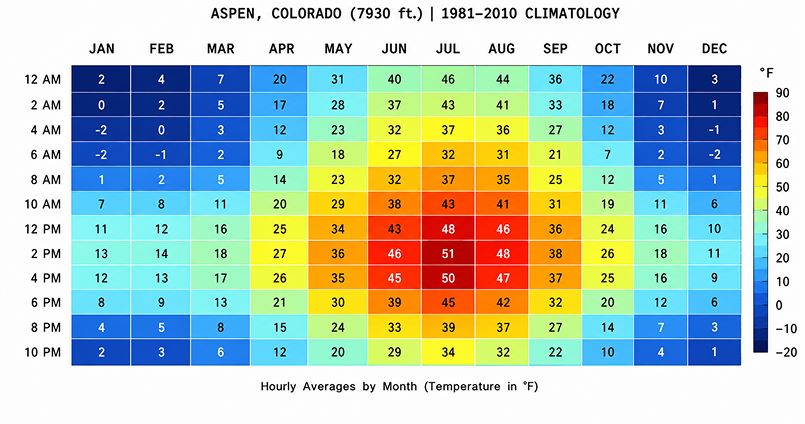
Climatestations.com started out with a simple idea: take long, reliable climate records and make them easy to see. The site began with the remarkable Minneapolis–St. Paul daily max/min temperature history, a dataset that’s almost completely intact all the way back to 1820. From there, the project grew. Today the site includes more than a dozen U.S. stations, each with at least 70 years of data, ranging from New York and Chicago to Los Angeles, Miami, Seattle, Phoenix, Dallas–Fort Worth, Washington DC, and others.
Over time, the site has built up a large library of year-to-year time-series graphs, daily and seasonal climograms, and other familiar visuals. These include:
- Daily max/min temperatures
- Precipitation, snowfall, and snow depth
- Wind (mean vector, scalar, and extremes)
- Relative humidity
- Annual mean temperature and precipitation charts
- Cumulative season-to-date precipitation
All of these graphics are produced in-house using public data sources, and the current-year charts are updated every couple weeks or so.
A New Layer: The Analytics Sections
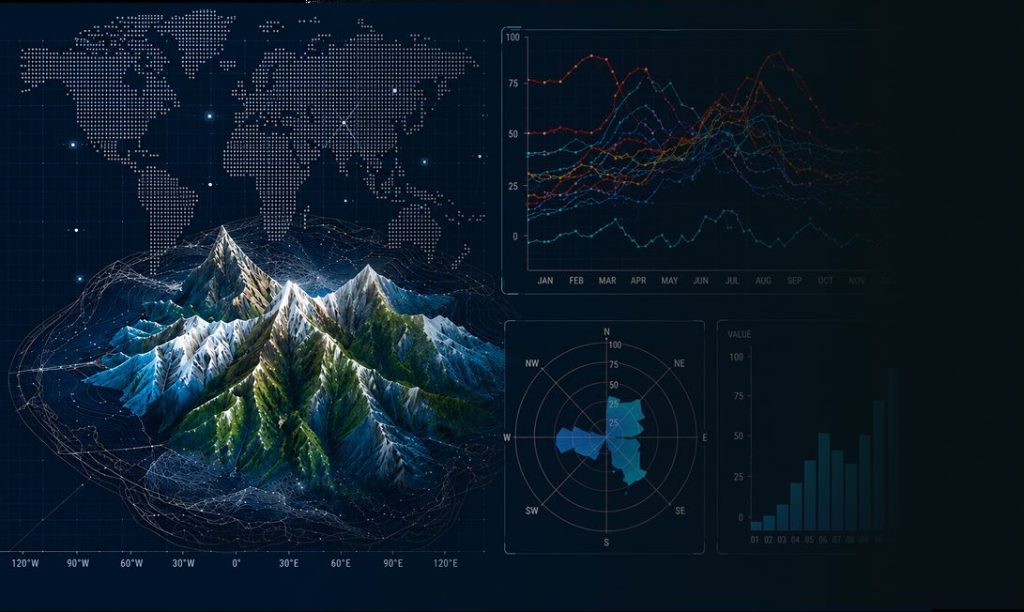
The biggest change to the site is the addition of a new Analytics section for each station, now in their ground floors for content development. These parts of the site will go beyond the standard graphs and dig deeper into how different climate variables behave — not just what happened, but how the patterns are structured.
The Analytics sections bring in tools such as:
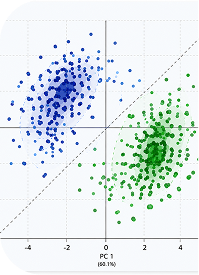
- Clustering (grouping similar diurnal or seasonal patterns)
- PCA (identifying the main “shape” modes of annual or diurnal cycles)
- Pattern extremes (years or days where the structure of the cycle is unusually distorted)
- Probability density modeling
- Extreme-value analysis (tail behavior, block maxima)
- Other emerging methods as datasets expand
Not every station will get the same treatment — the deeper-dive topics vary depending on the length and richness of each station’s record. Some stations in their analytics page and sections will get the full analytics treatment, others getting somewhat less attention.
The goal here is to give visitors a second way to understand climate behavior: not just through graphs, but through structure, geometry, and statistical fingerprints that reveal how a station’s climate actually “moves.”
All raw data come from public sources, with attribution, and all statistical and graphics work are done in-house, and current charts are refreshed semi-weekly.