
Station Overview
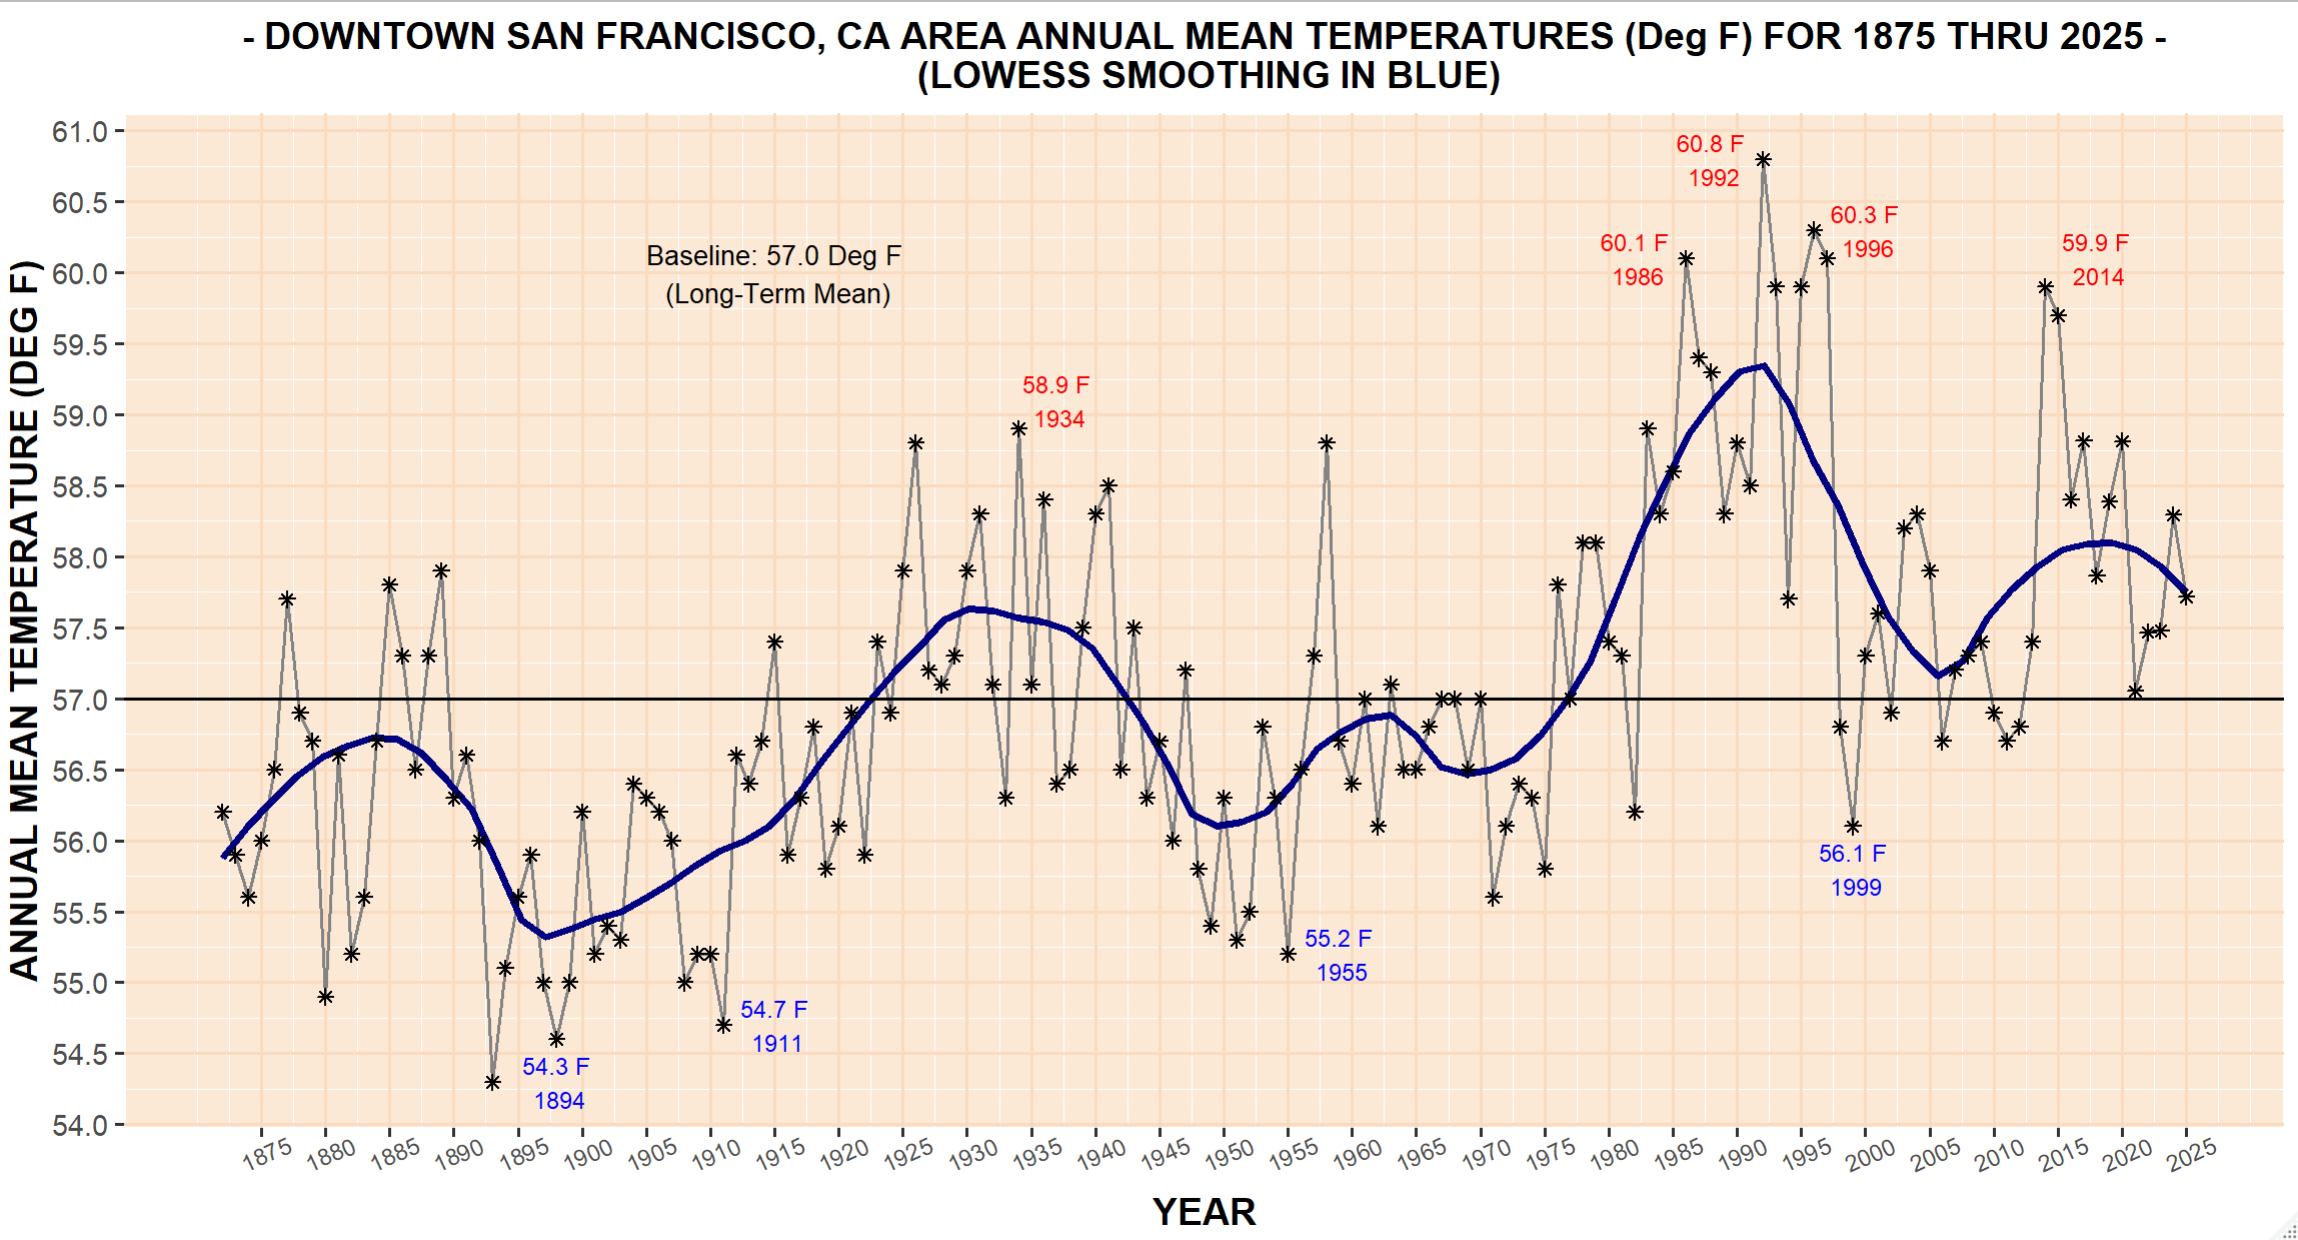
Graphical Climatology of Downtown San Francisco: Daily Temperatures and Rainfall, by Year (1875 – Present)
The following is a graphical climatology of Downtown San Francisco, California temperatures and precipitation, from 1875 into the current year 2026. Included are summary overview charts followed by 152 year-to-year graphs depicting daily temperatures, temperature anomalies, and precipitation. The 1875 to 2026 period of record includes observations from four different Downtown locations. Current year’s data can be accessed from the NWS-Monterey website at http://www.wrh.noaa.gov/mtr/
- http://www.wrh.noaa.gov/mtr/The following is a graphical climatology of Downtown San Francisco, California temperatures and precipitation, from 1875 into the current year 2026. Included are summary overview charts followed by 152 year-to-year graphs depicting daily temperatures, temperature anomalies, and precipitation. The 1875 to 2026 period of record includes observations from four different Downtown locations. Current year’s data can be accessed from the NWS-Monterey website at http://www.wrh.noaa.gov/mtr/
Explore the Climate Data
Use these shortcuts to move directly to the principal charts, analyses and historical records.
Climate Overview Graphs — RECENT YEARS
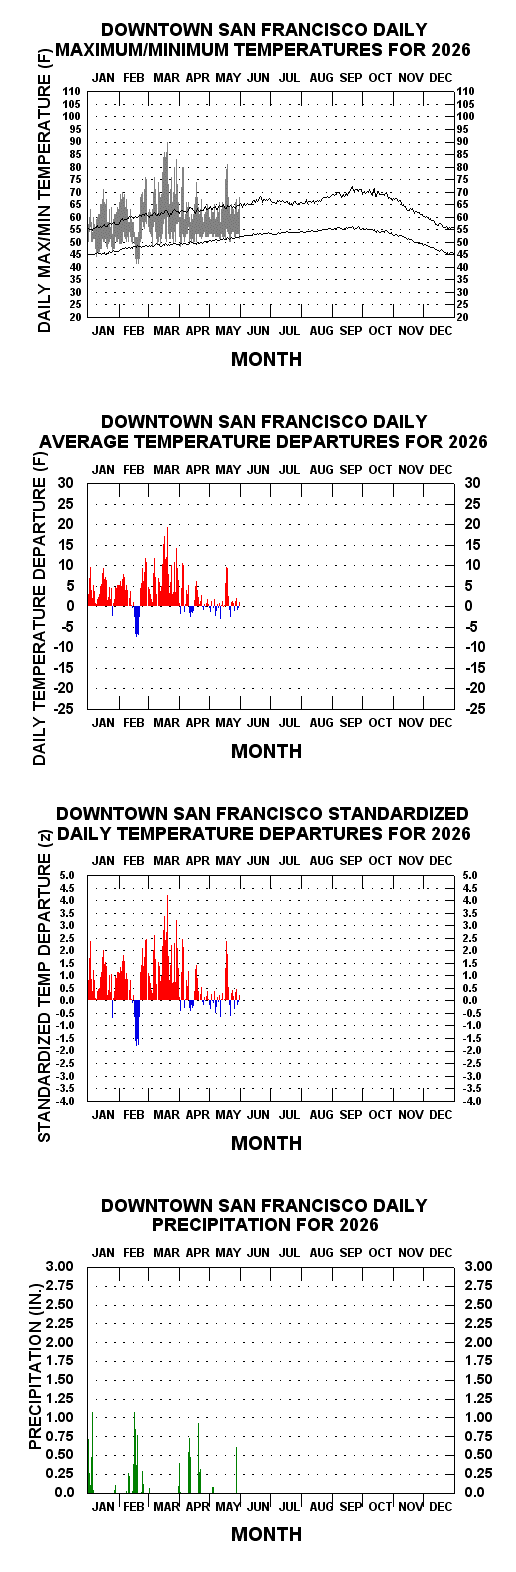
- 2026 Daily Temperature and Precipitation for Downtown San Francisco NewNew (5/31/26)
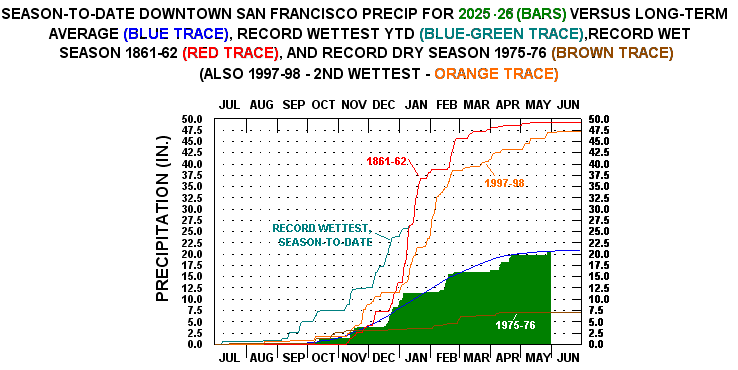
- 2026 Season-to-Date Precipitation for Downtown San Francisco NewNew (5/31/26)
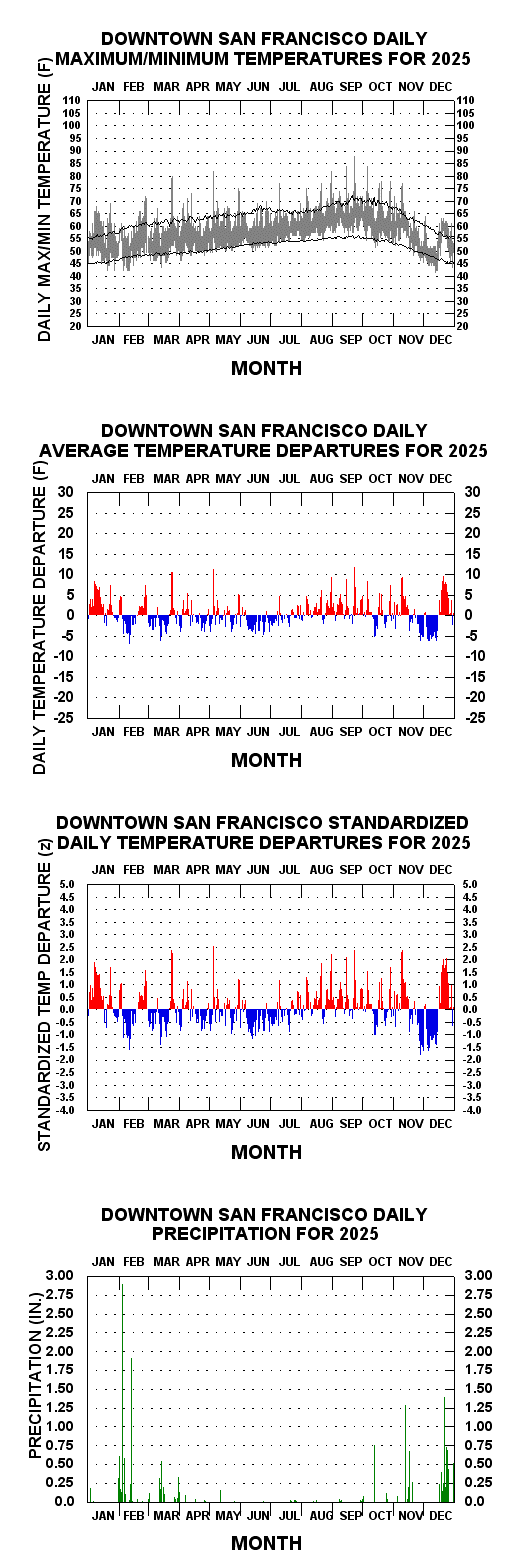
- 2025 Daily Temperature and Precipitation for Downtown San Francisco NewNew (12/31/25)
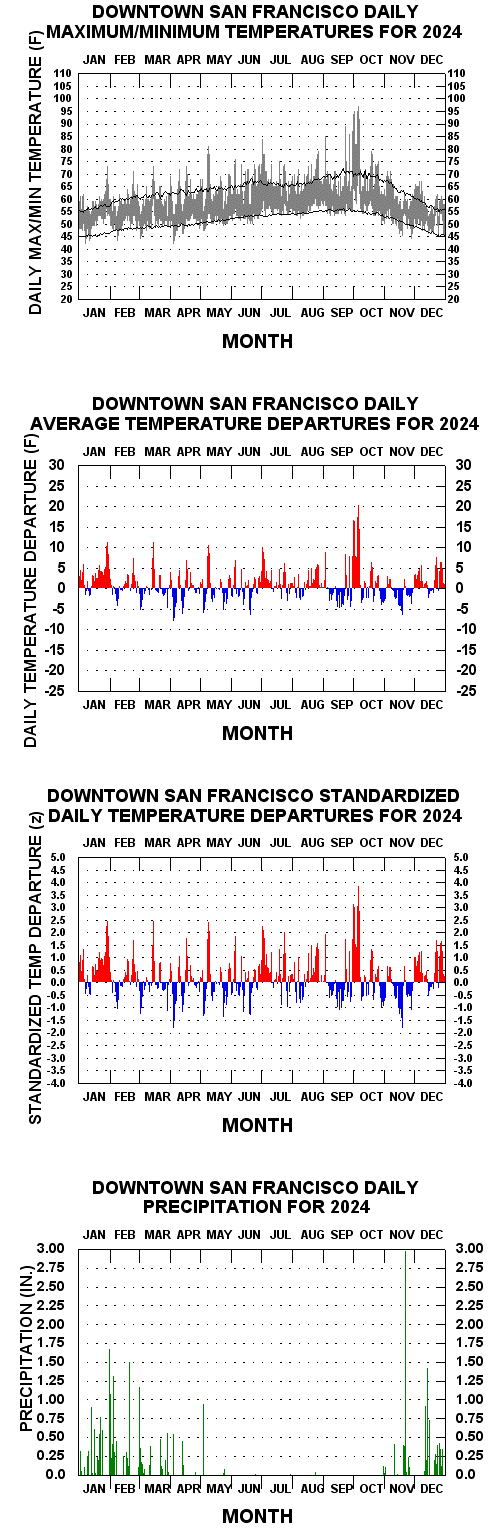
- 2024 Daily Temperature and Precipitations for Downtown San Francisco
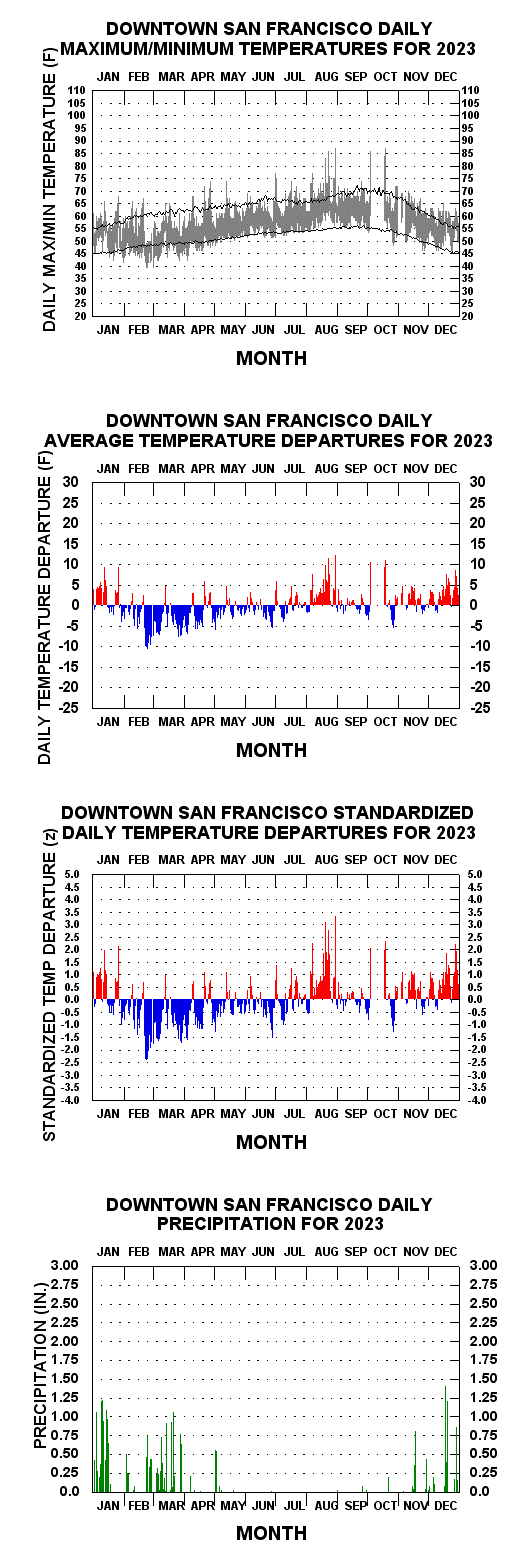
- 2023 Daily Temperature and Precipitations for Downtown San Francisco
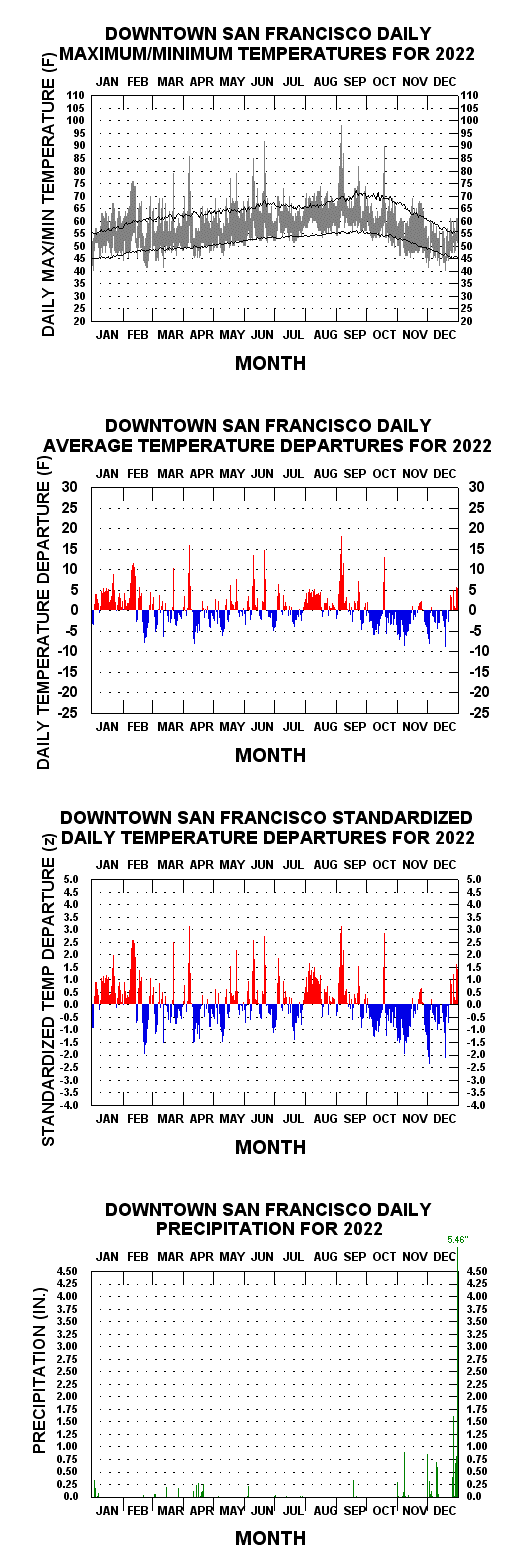
- 2022 Daily Temperatures and Precipitation for Downtown San Francisco
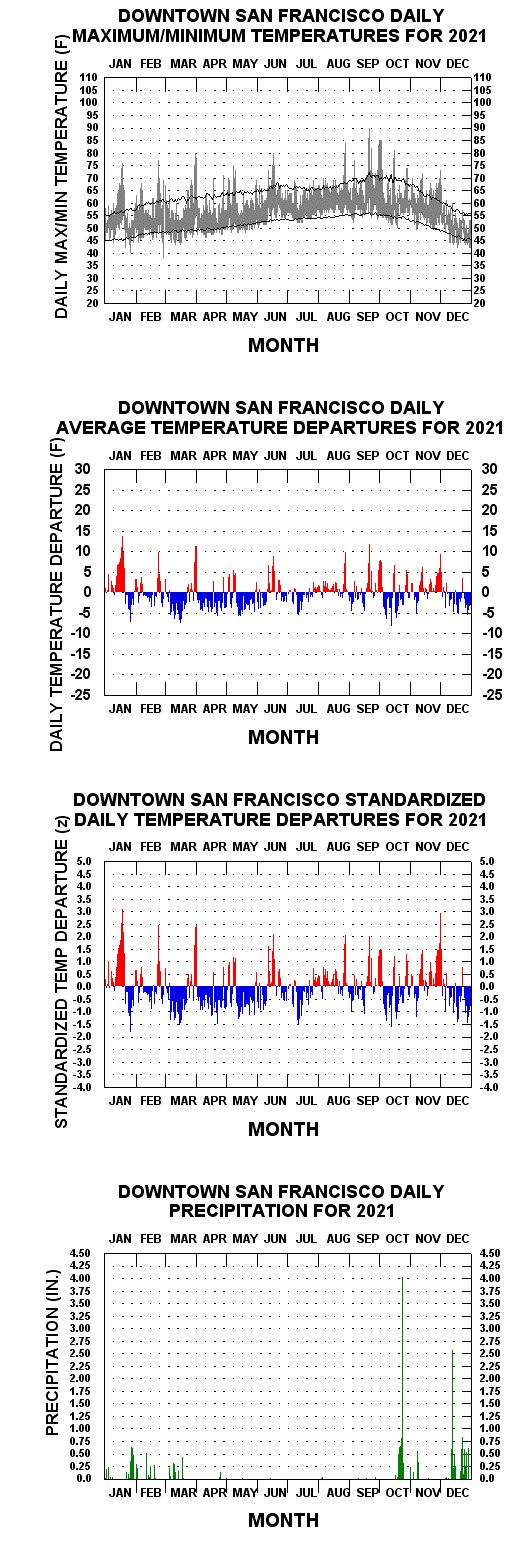
- 2021 Daily Temperatures and Precipitation for Downtown San Francisco
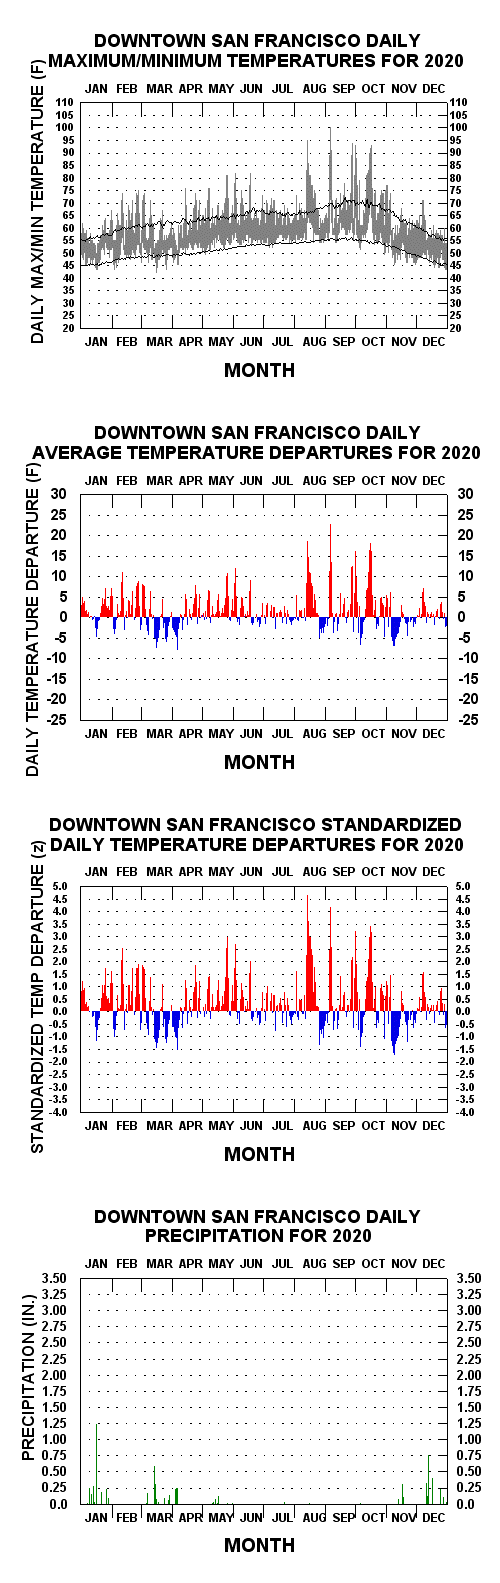
- 2020 Daily Temperatures and Precipitation for Downtown San Francisco
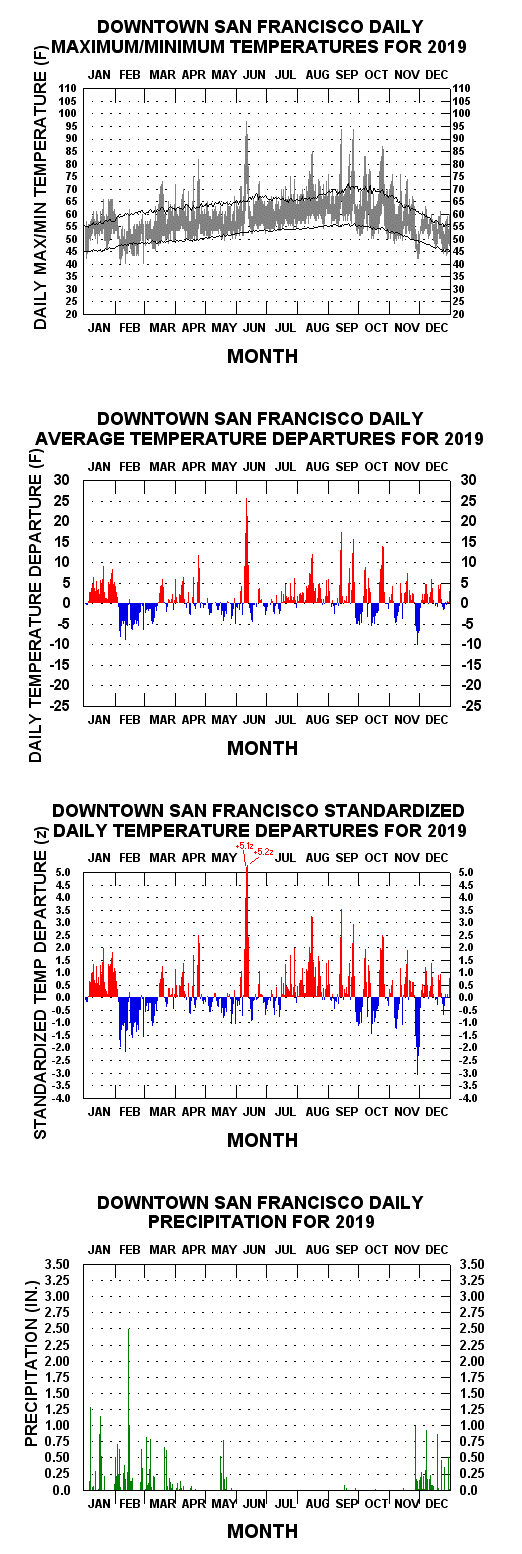
- 2019 Daily Temperatures and Precipitation for Downtown San Francisco
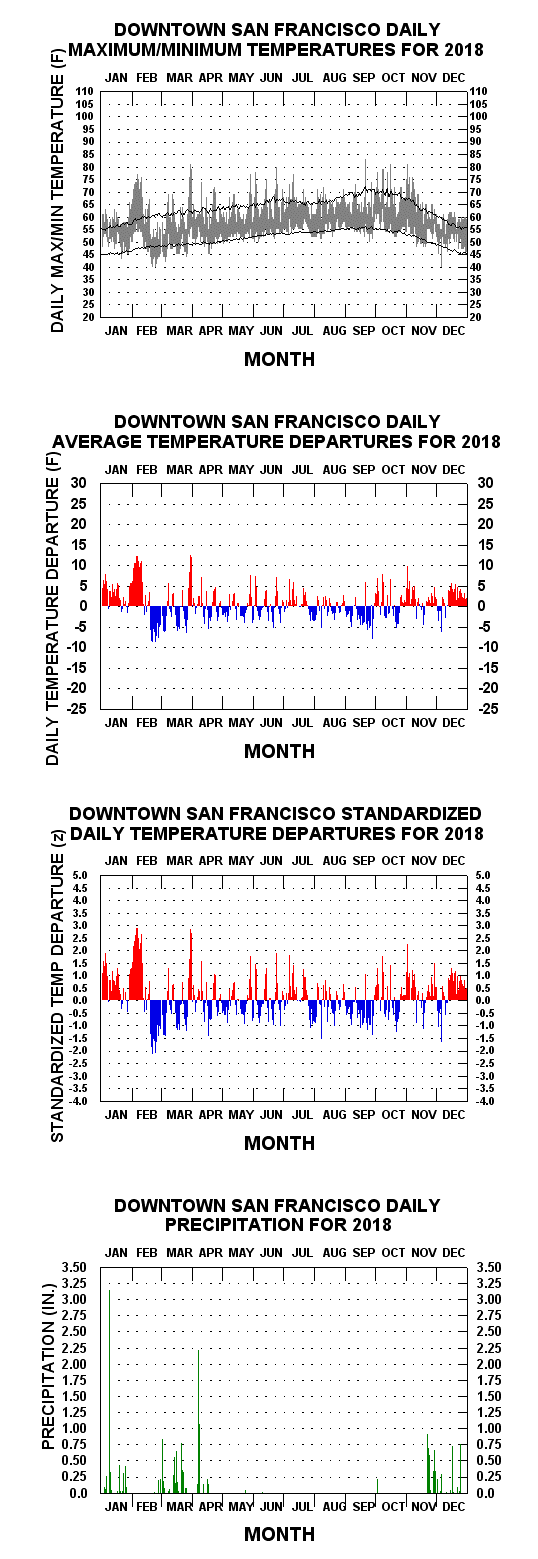
- 2018 Daily Temperatures and Precipitation for Downtown San Francisco
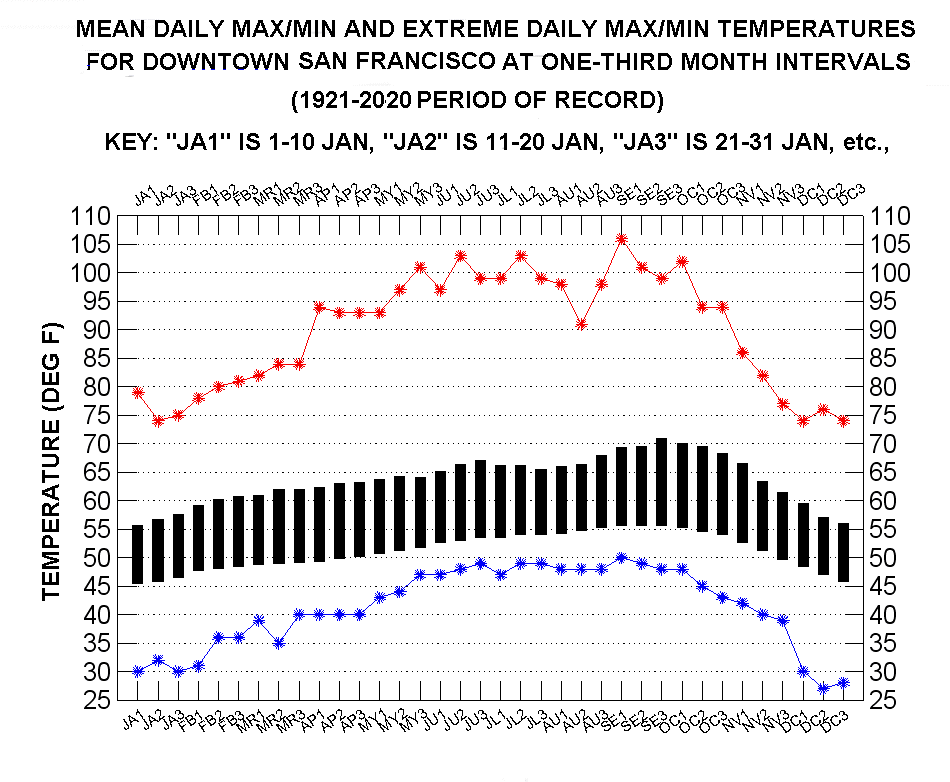
San Francisco Mean And Record Daily Max/Min Temperatures
San Francisco Rainfall
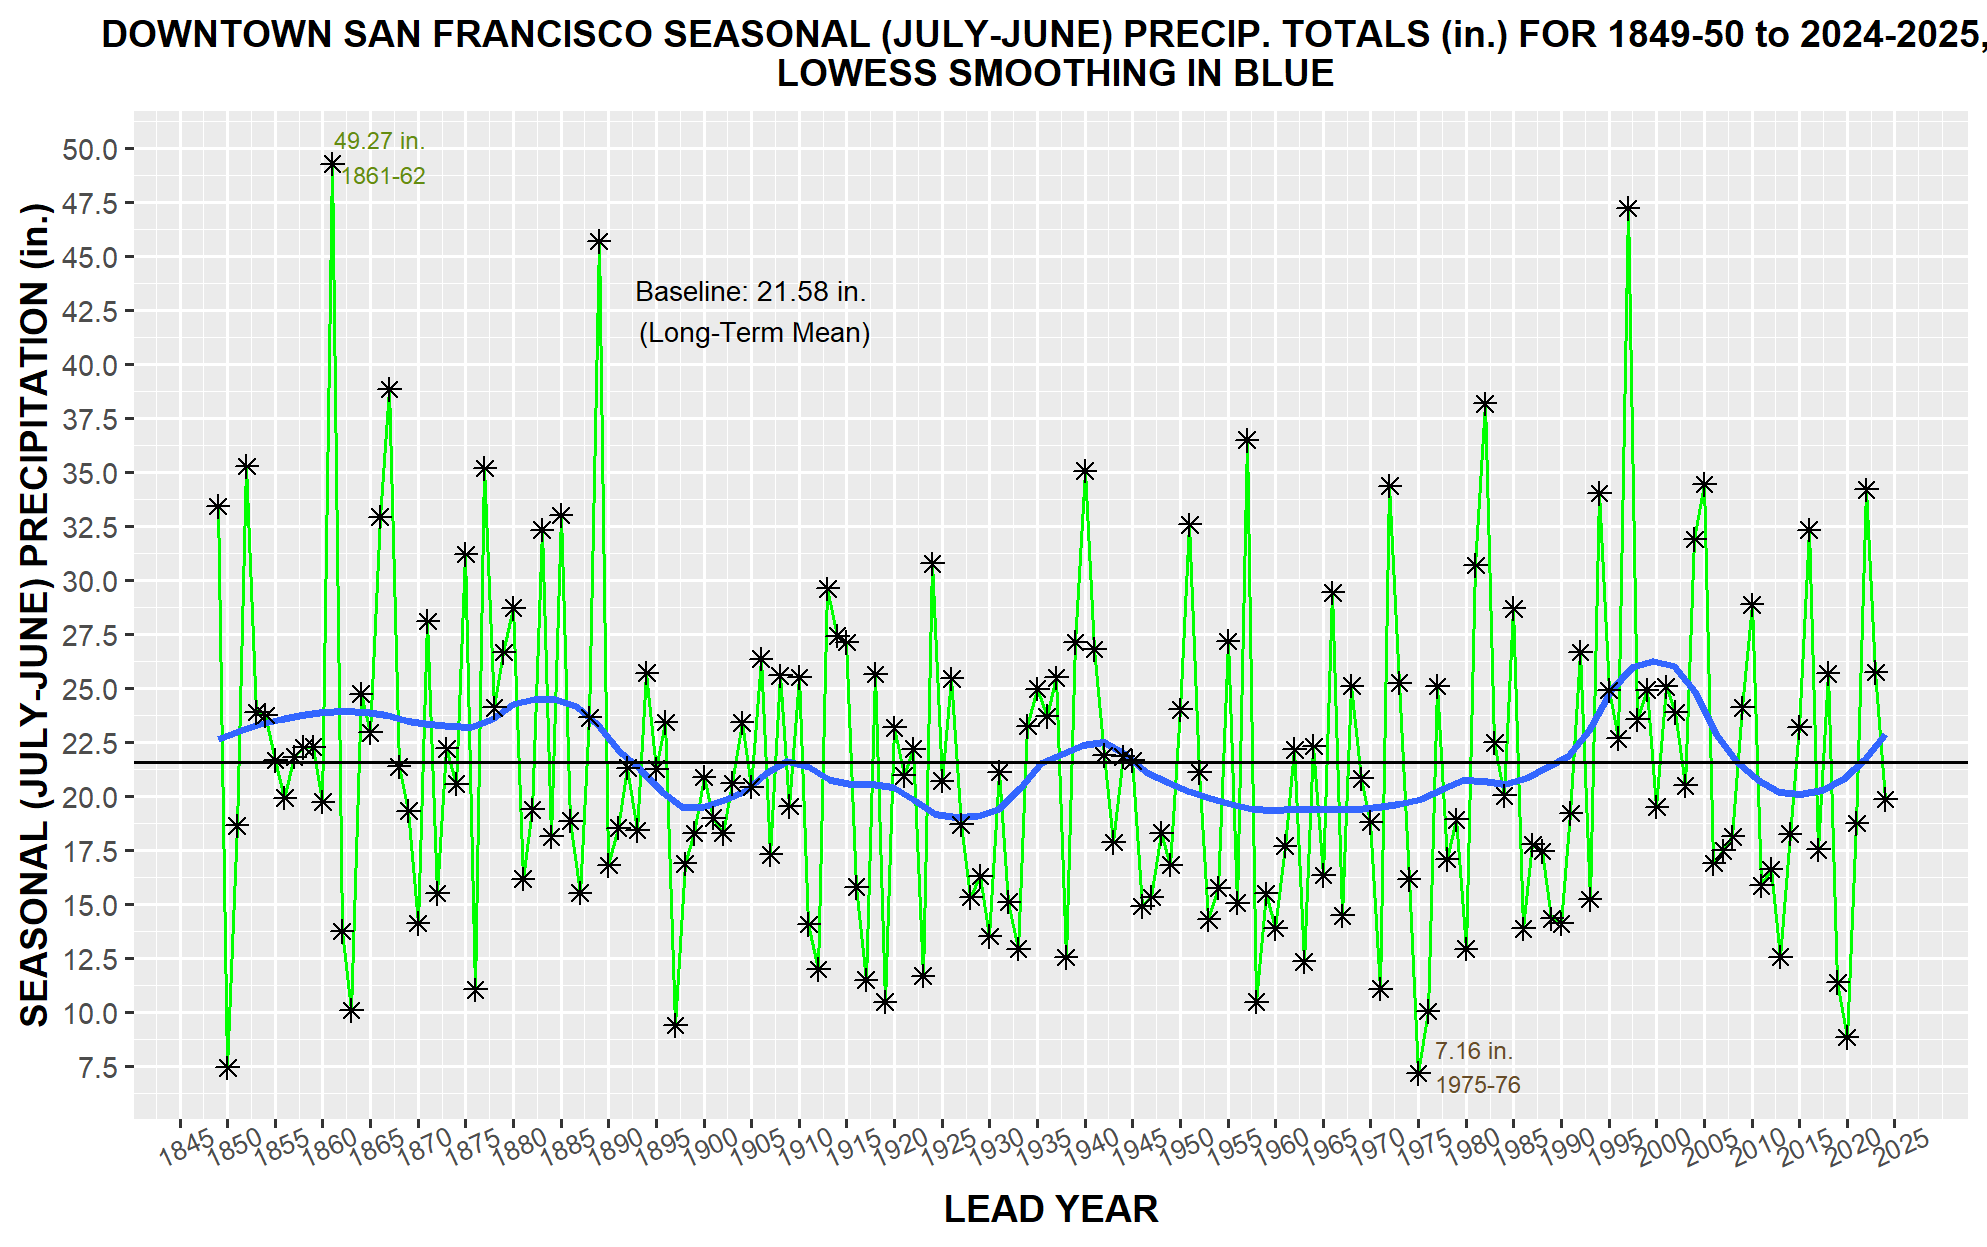
- Downtown San Francisco Seasonal Rainfall (1849-50 thru 2024-25 Seasons) NewNew (7/2/25)
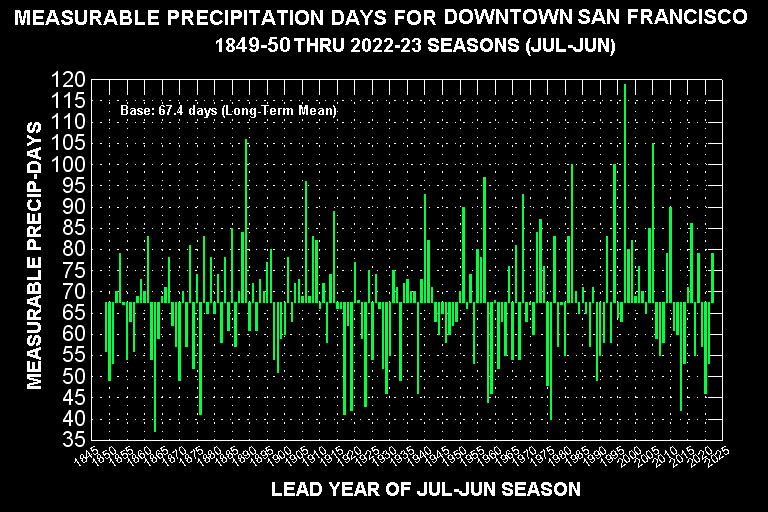
- Downtown San Francisco Measurable Precipitation Days (1849-50 thru 2022-2023 Seasons)(10/4/23)
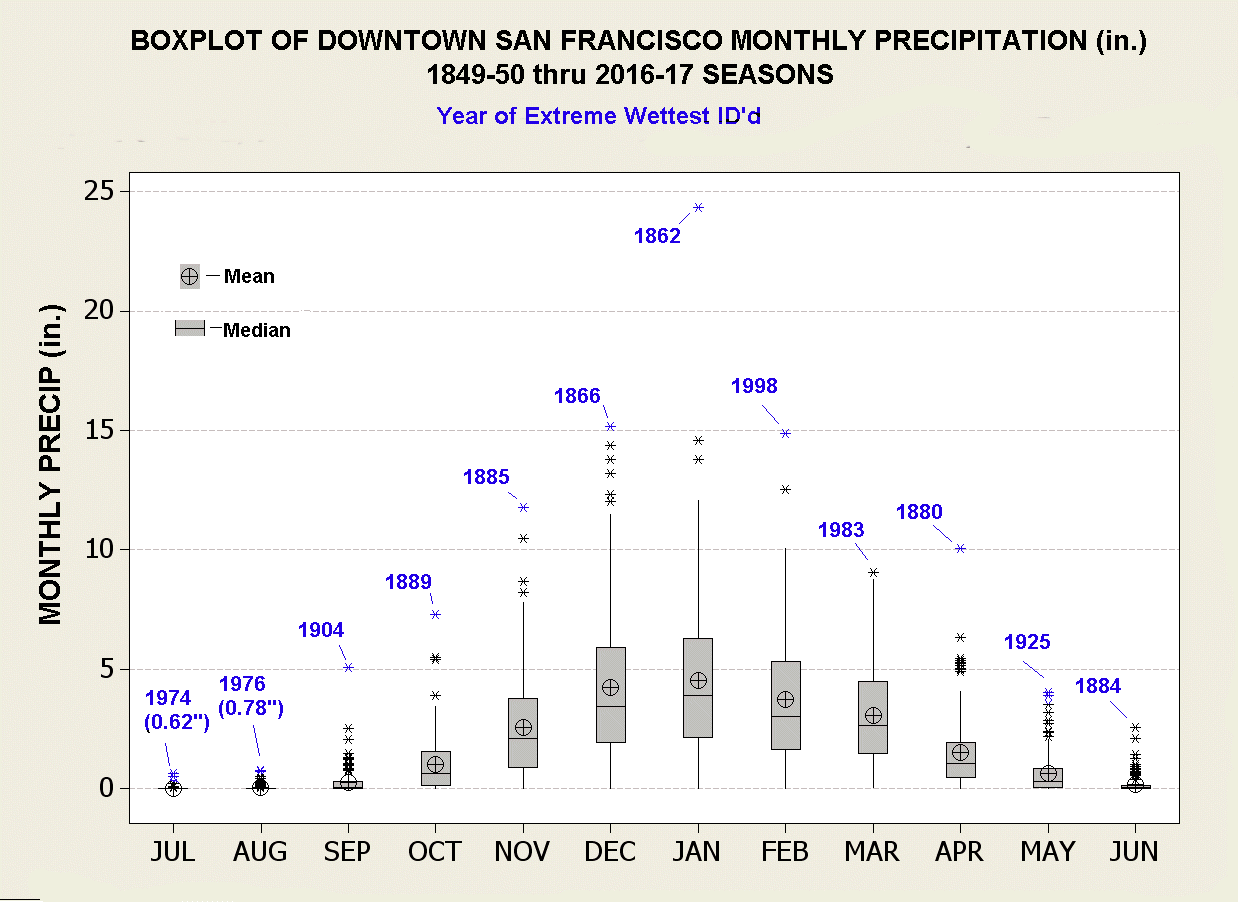
- Boxplot of Downtown San Francisco Monthly Precipitation Distributions (1849-50 thru 2016-17 Seasons
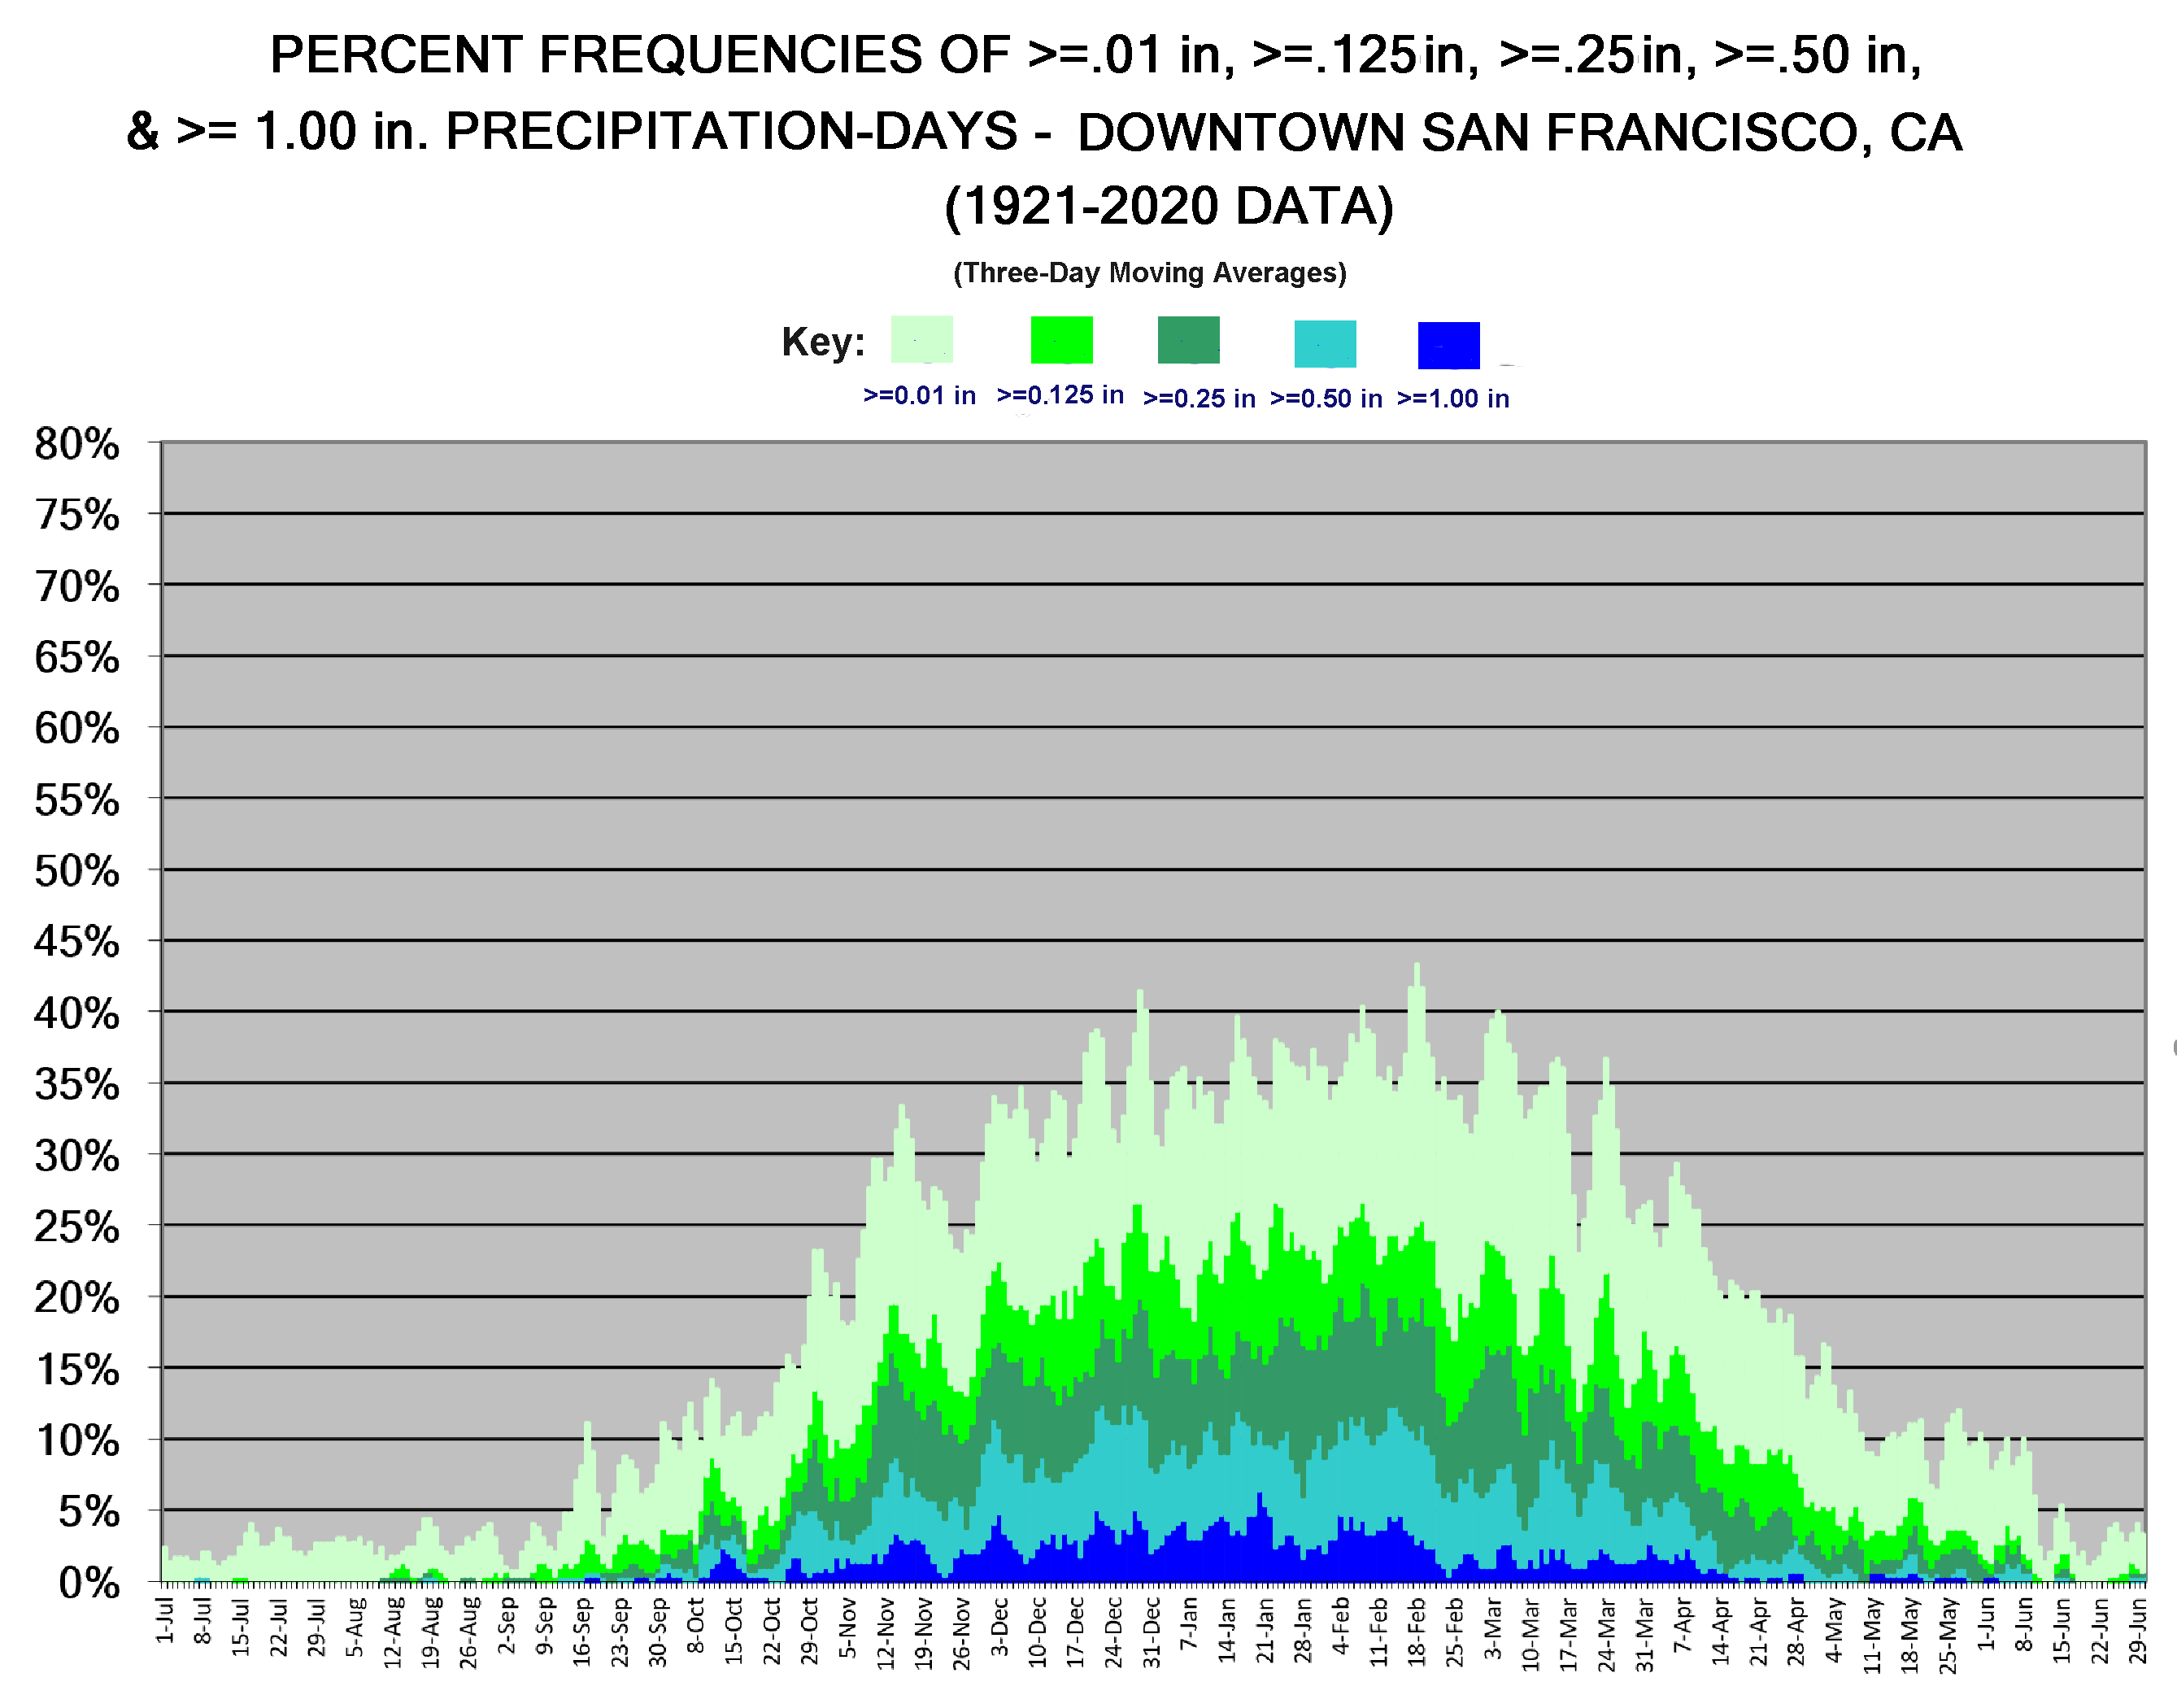
- Downtown San Francisco Pct. Frequencies of >=0.01 in., >=,125 in, >=0.25 in. >=0.50 in. and >=1.00 in. Rainfall Days, by Calendar Day
Other Summary Climate Graphs:
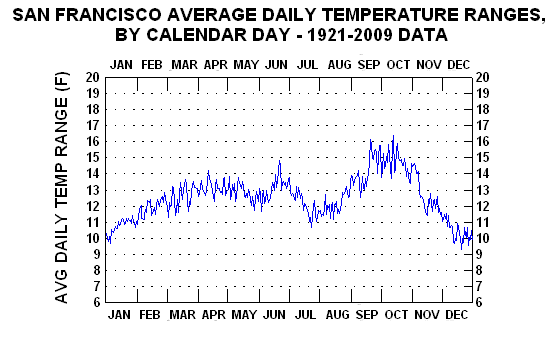
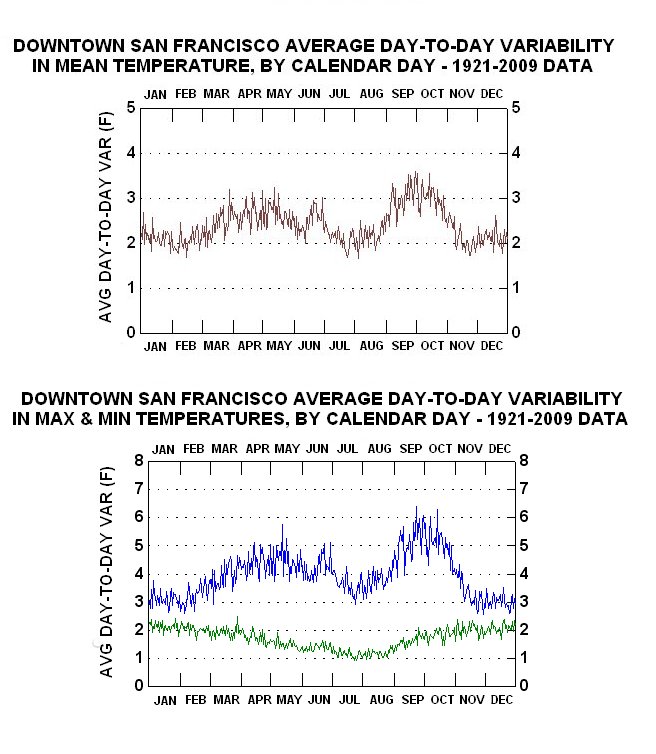
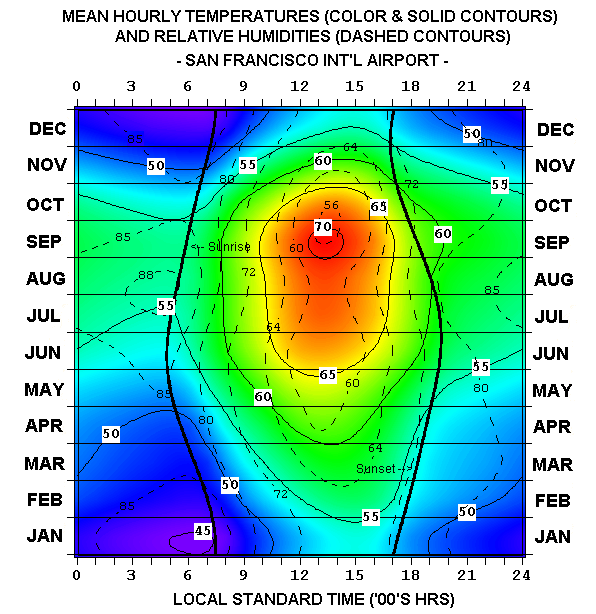
Climograms For San Francisco Int’L Airport & Other Charts
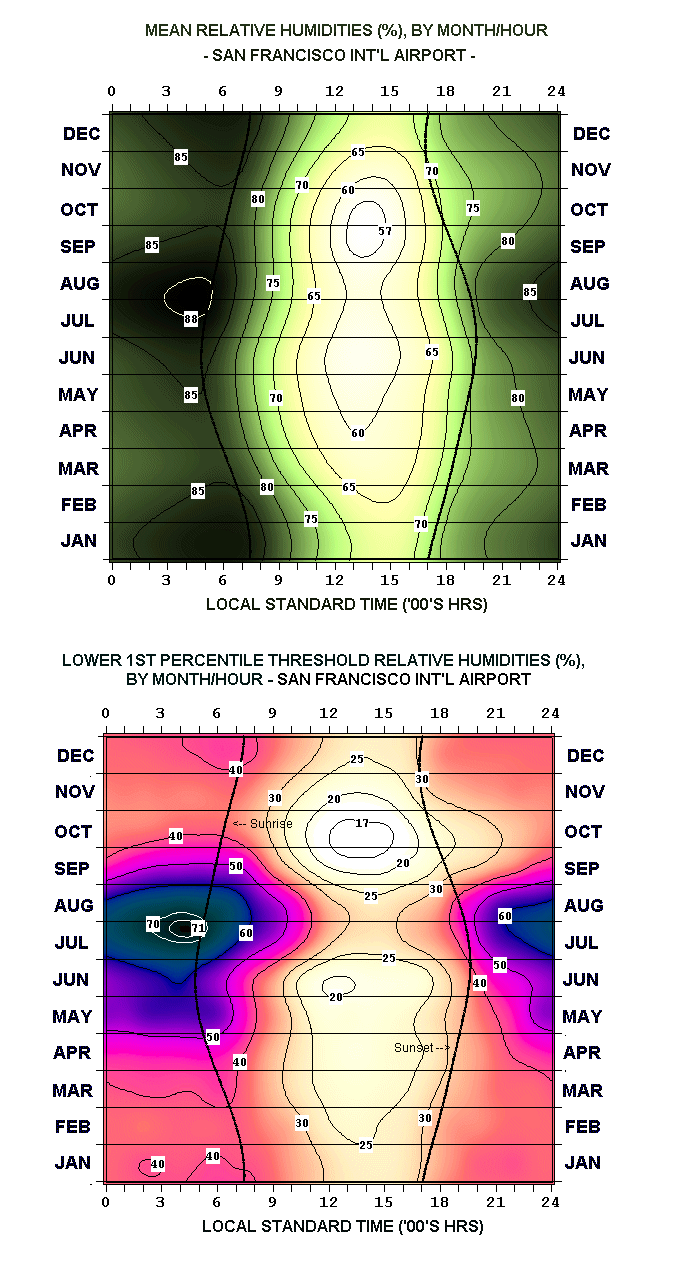
- Temperature/Humidity
- Mean and Extreme Hourly Humidities (Lower 1st Pctile)
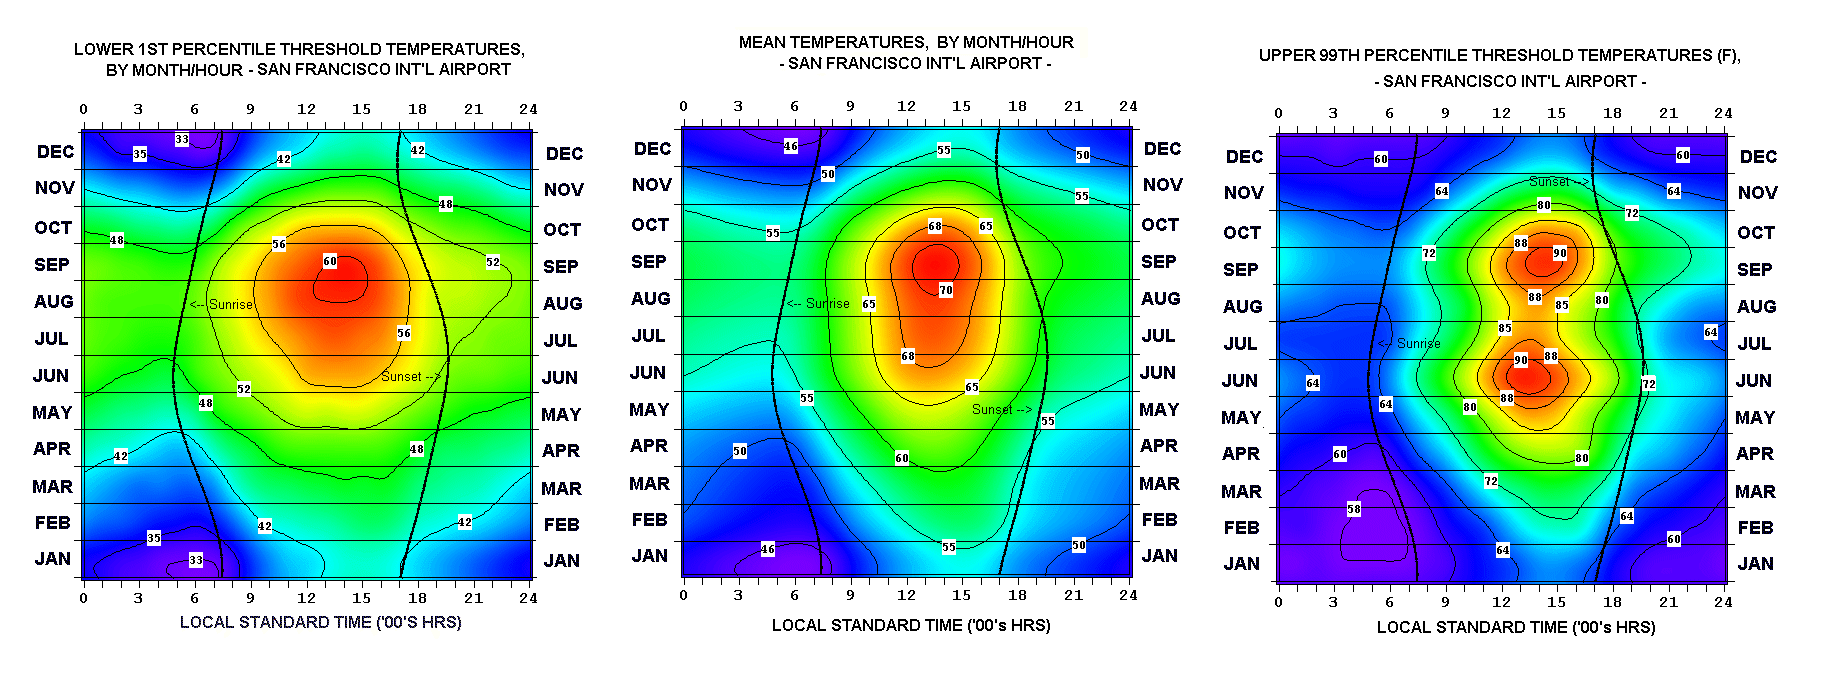
- Mean and Extreme Hourly Temps (Upper 99th & Lower 1st Pctile)
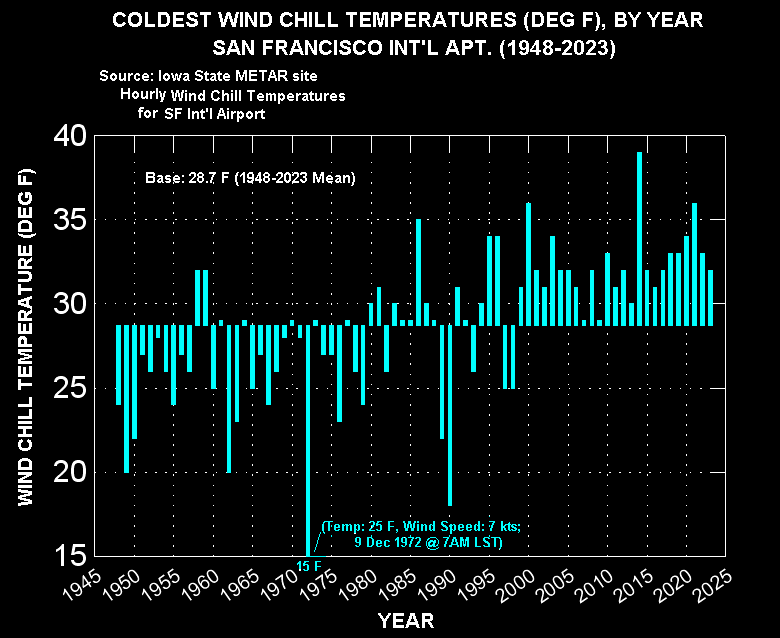
- Annual Coldest Wind Chill Temperatures (1948-2023) NewNew (9/5/23)
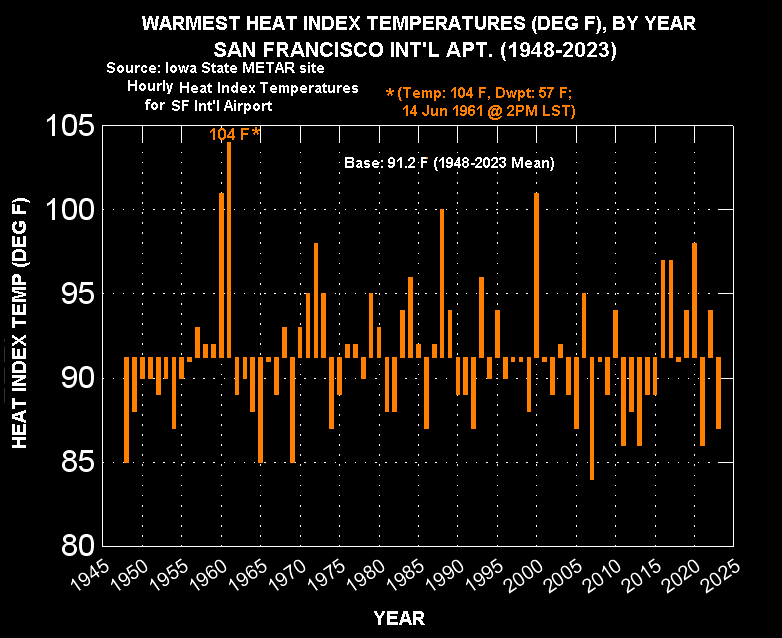
- Annual Warmest Heat Index Temperatures (1948-2023) NewNew (9/5/23)
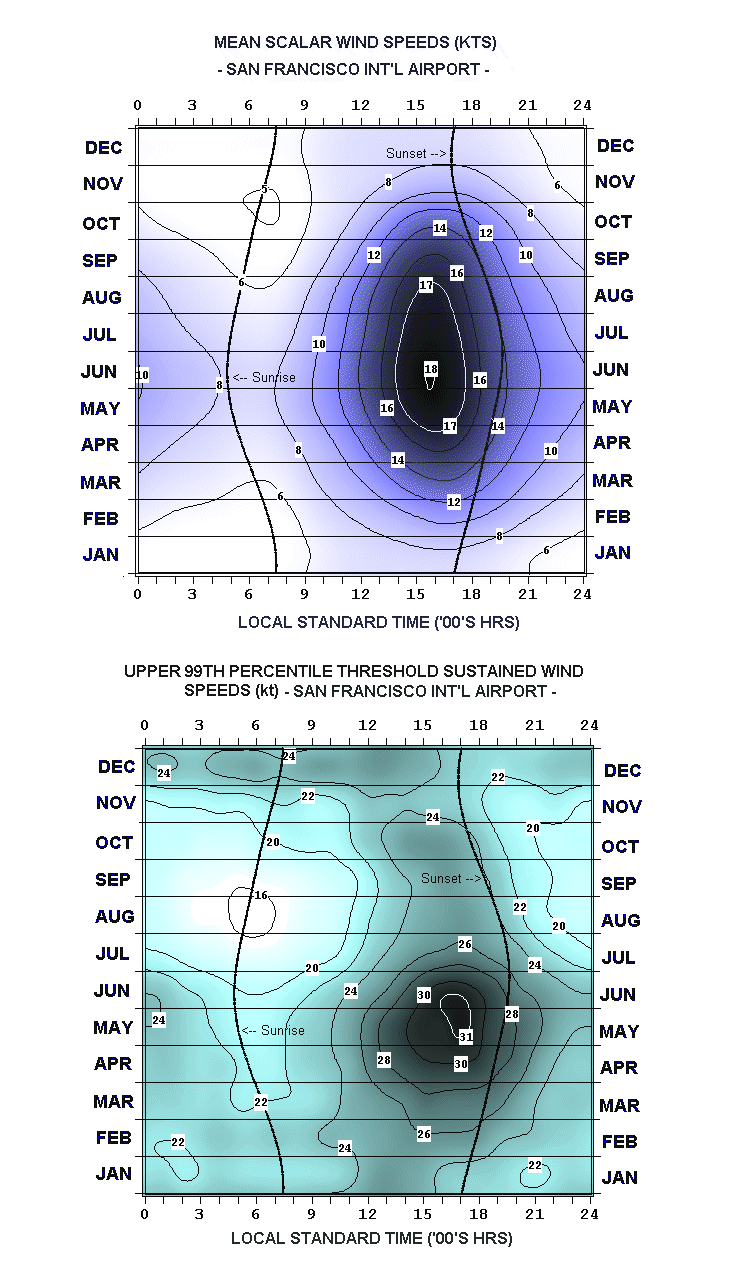
- Mean and Extreme Hourly Wind Speeds (Upper 99th Pctile)
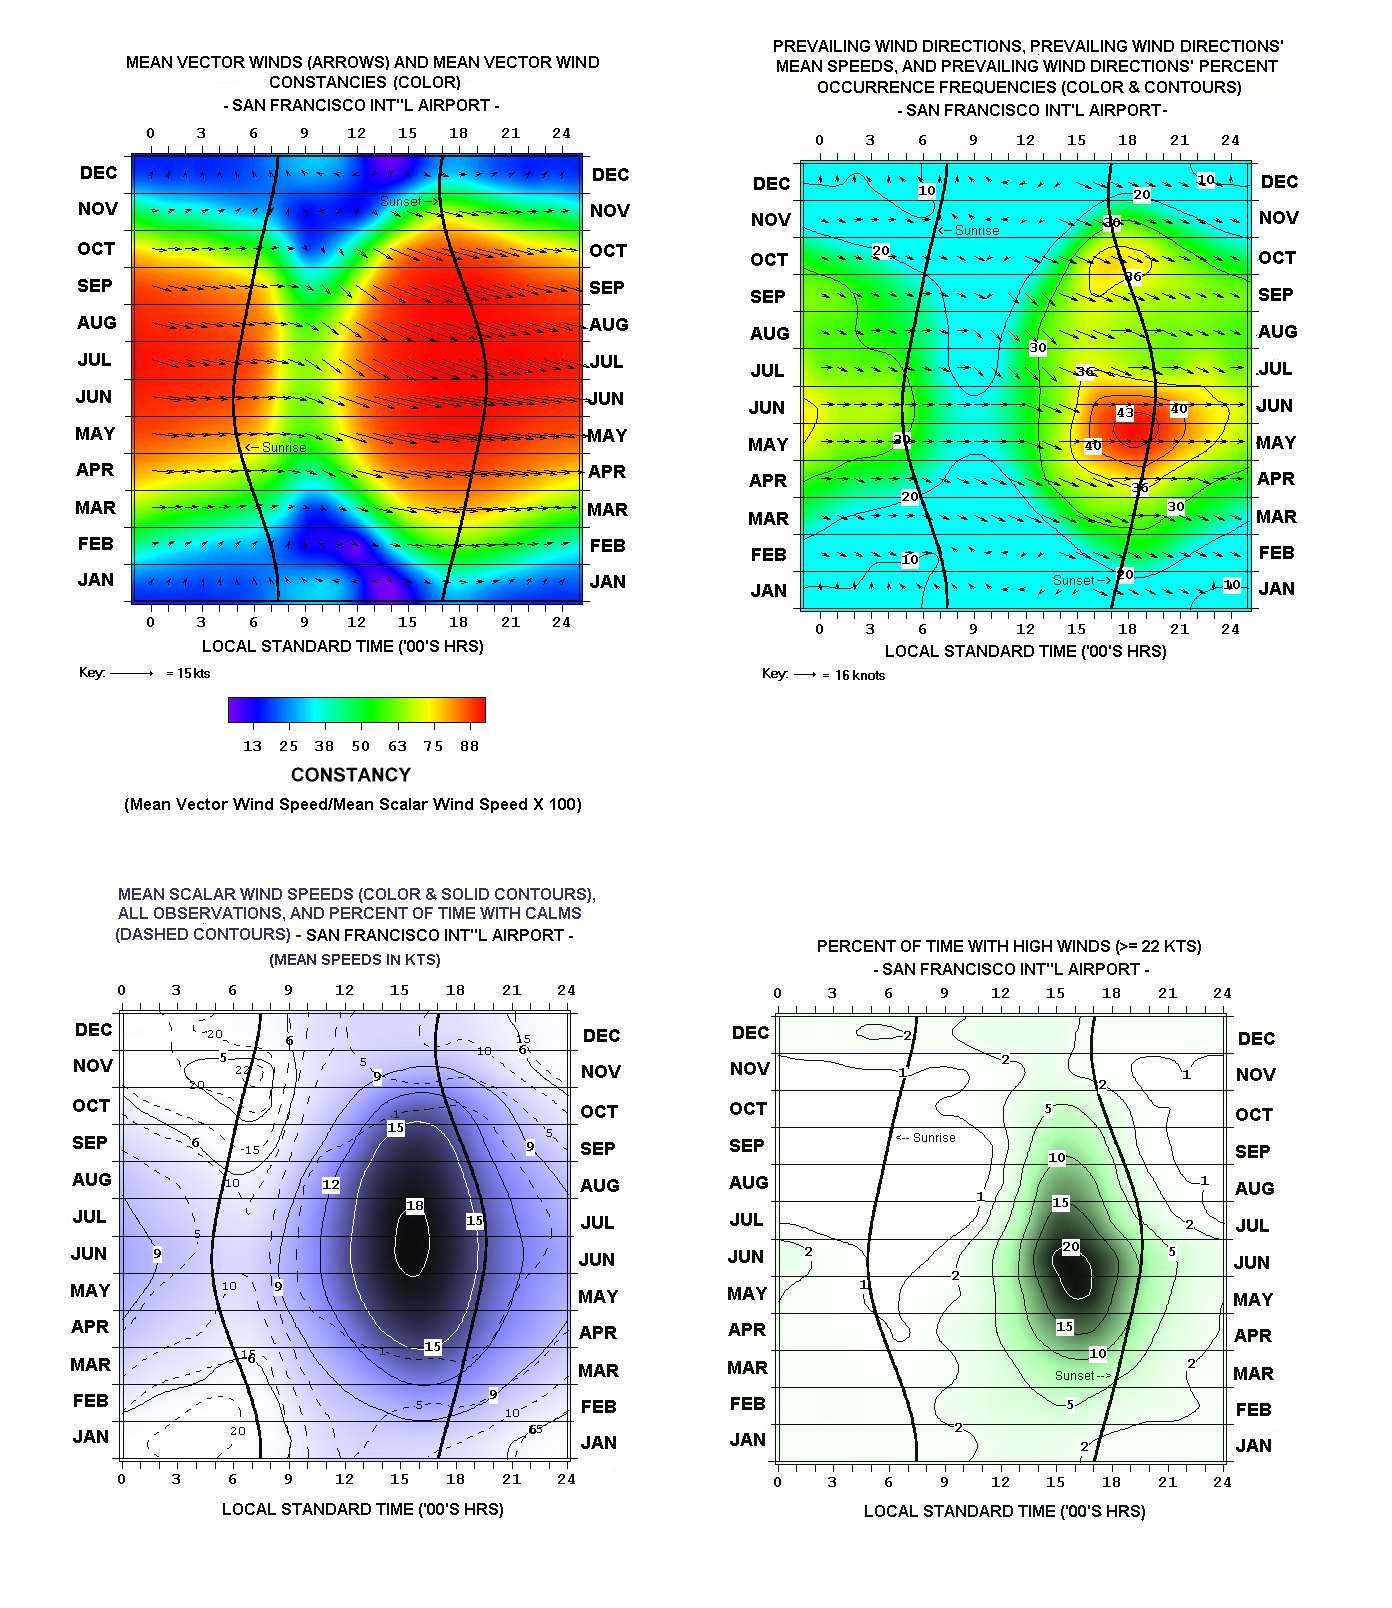
- Winds (Mean Vector, Prevailing, & Mean Scalar)
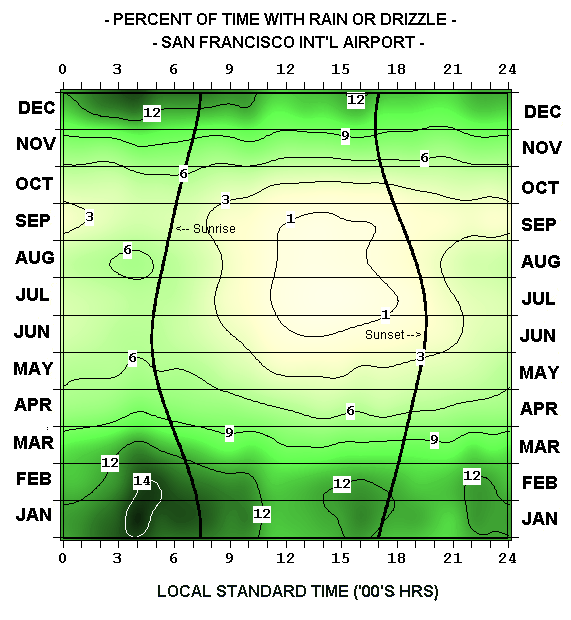
- Rainfall
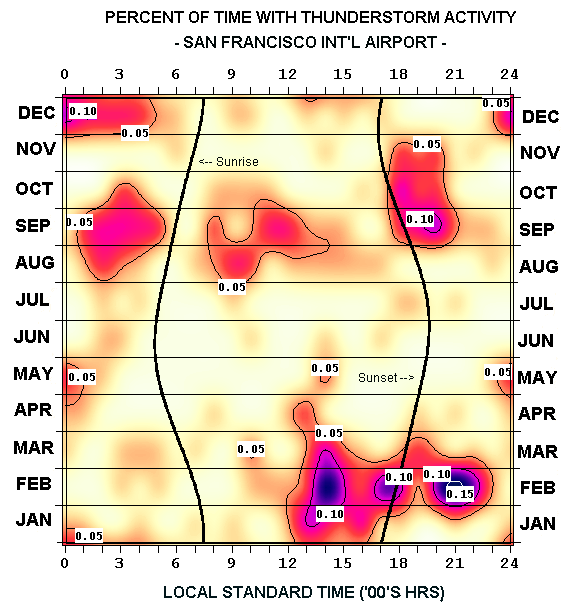
- Thunderstorms
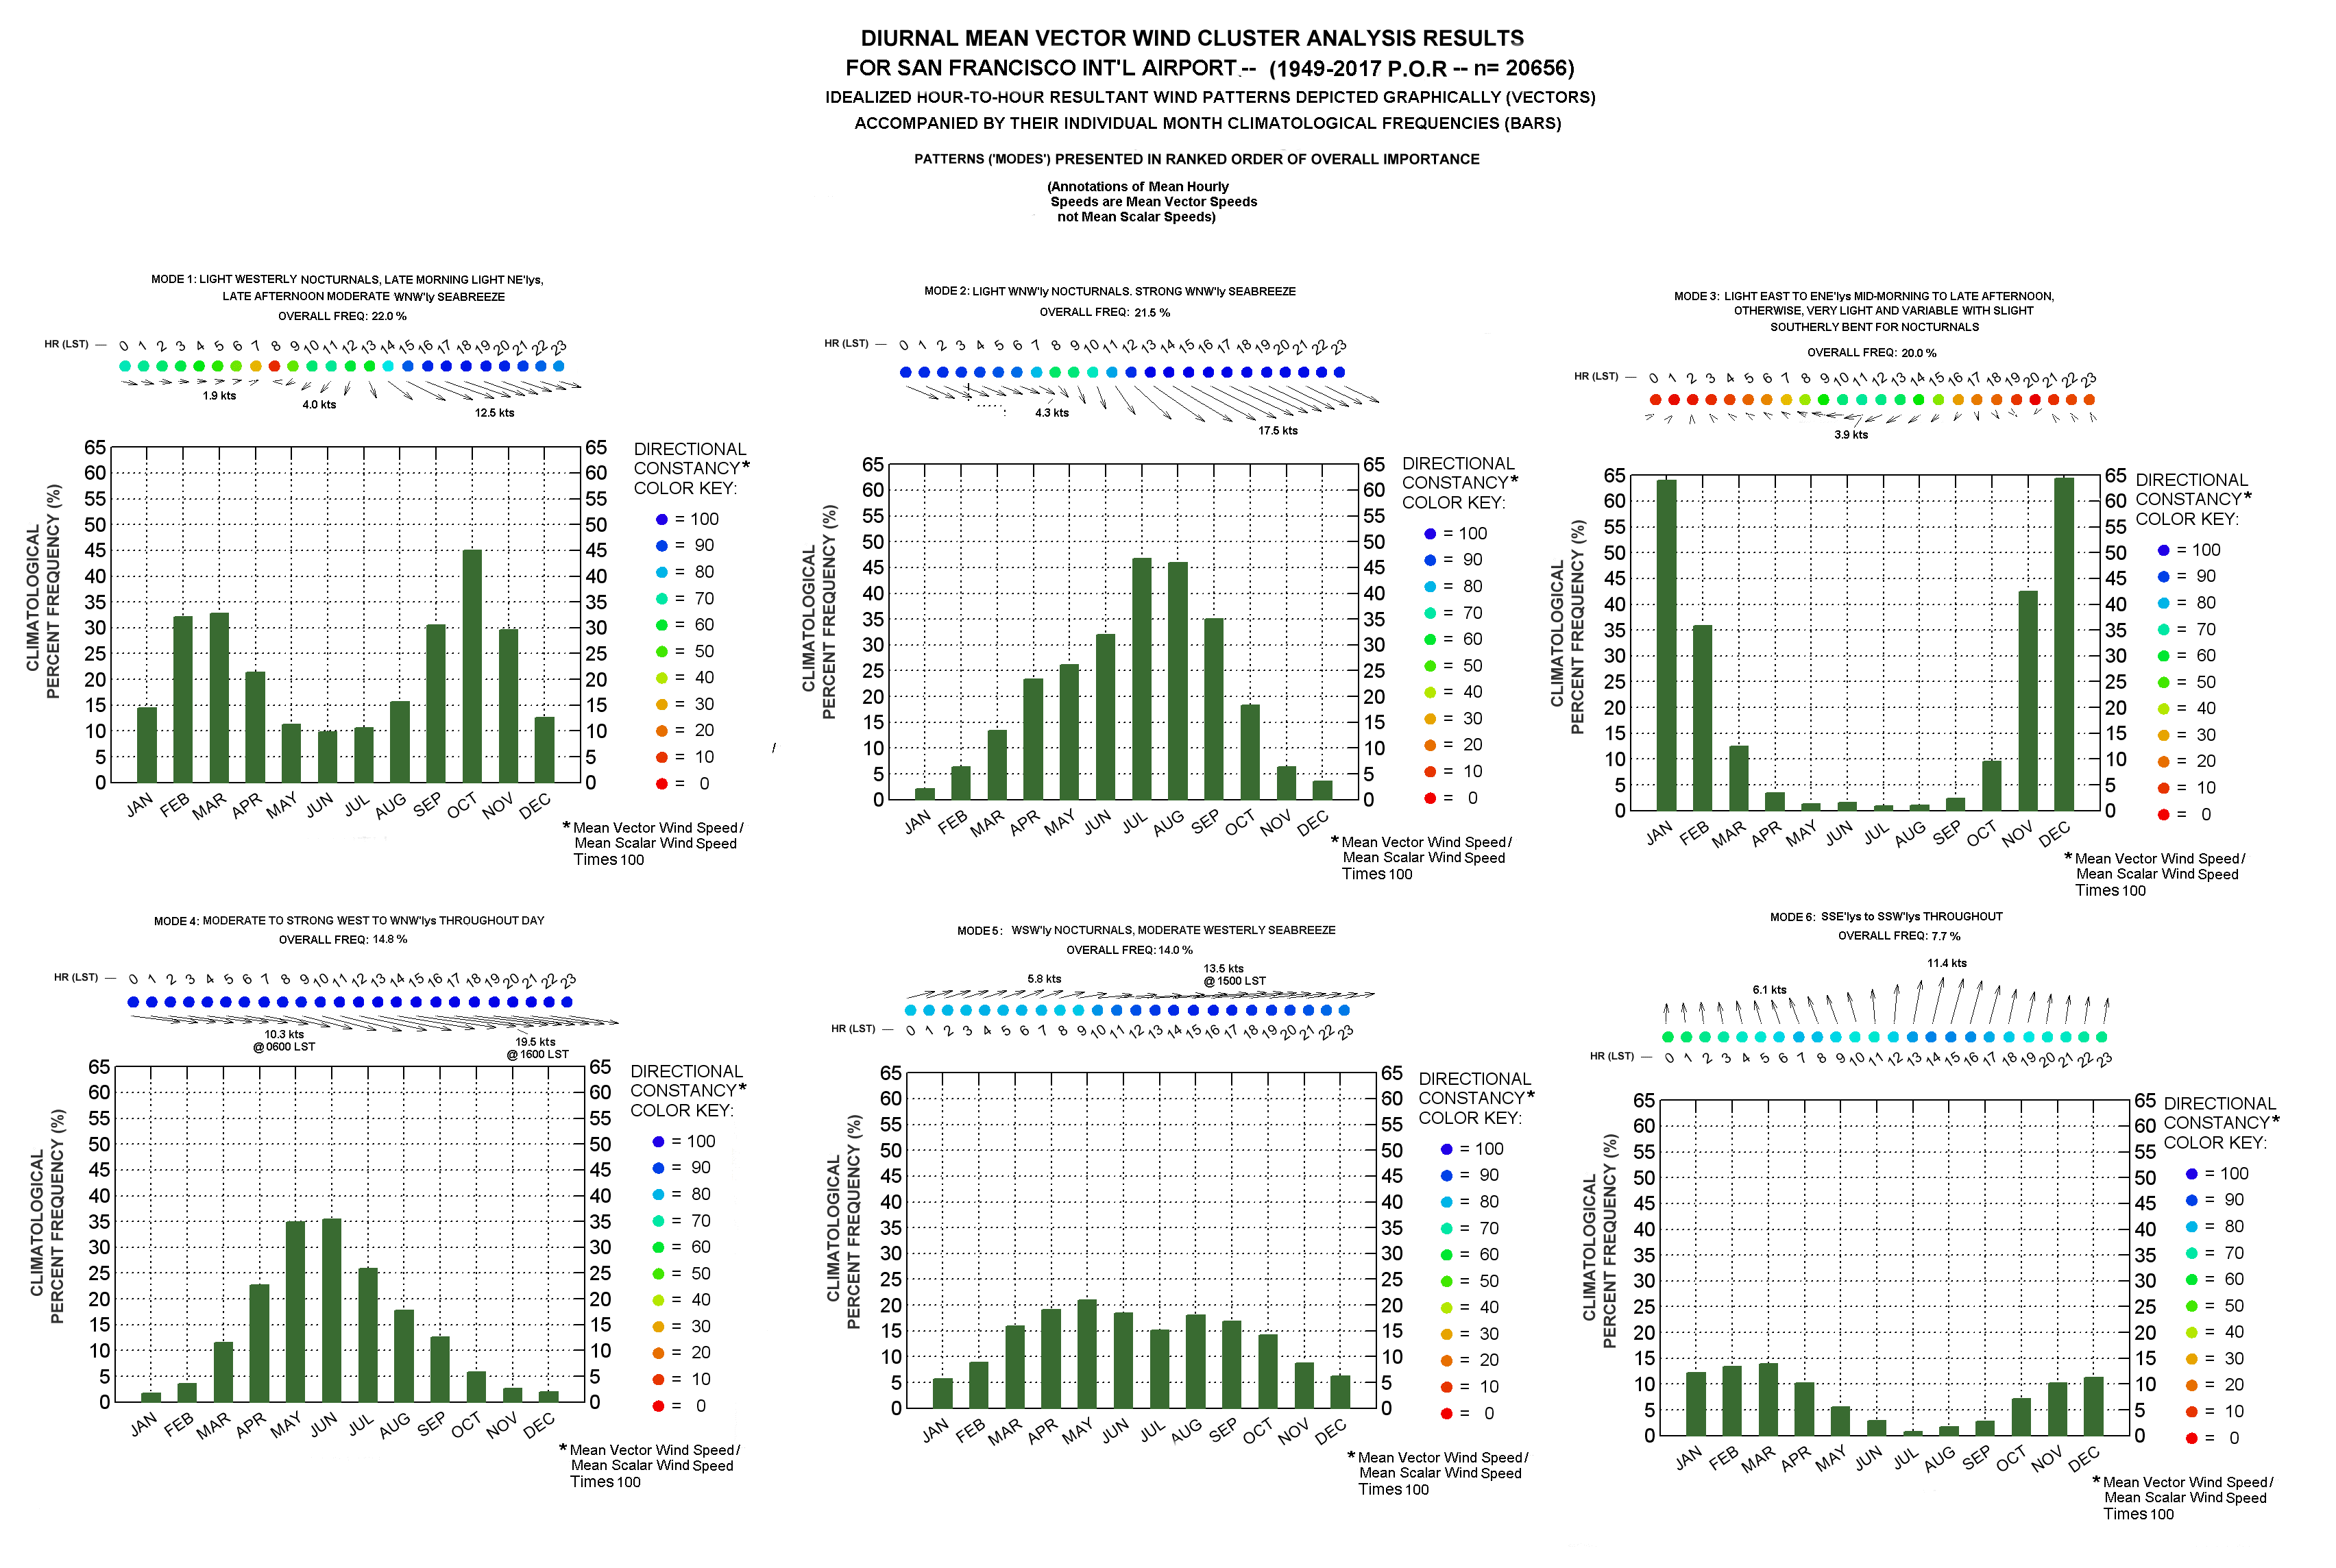
- K-Means Clustering Analysis of SF Int’l Airport Diurnal Resultant Wind Patterns
Year-To-Year Graphs – Interpretation
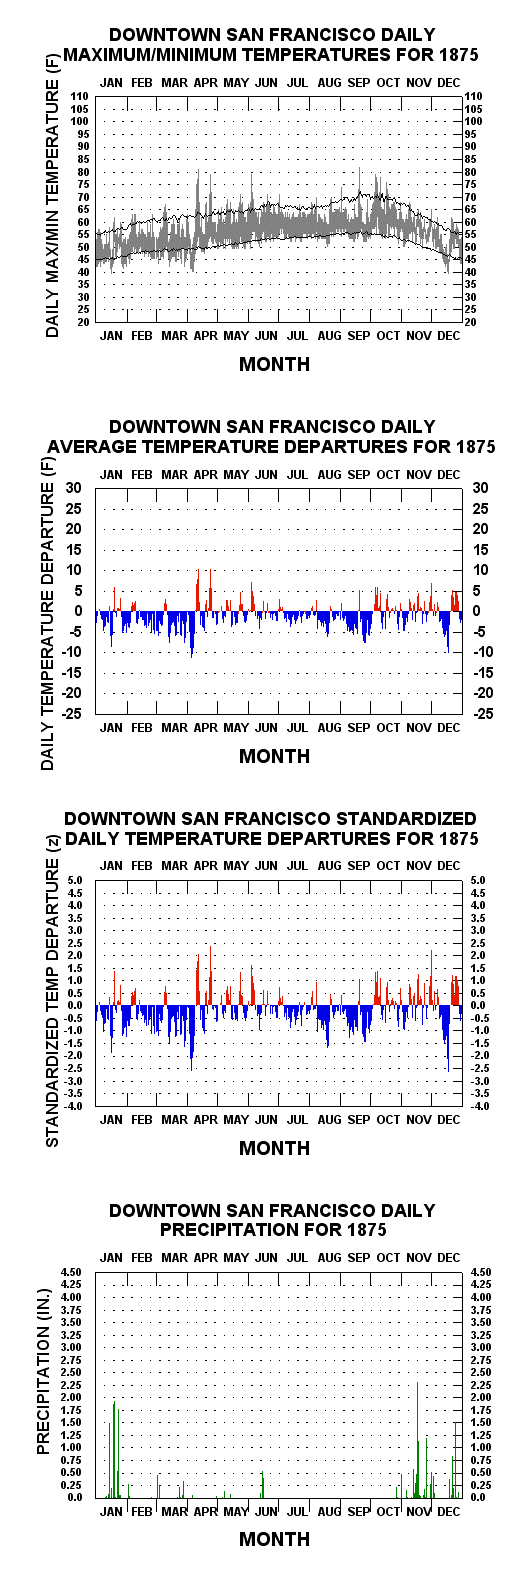
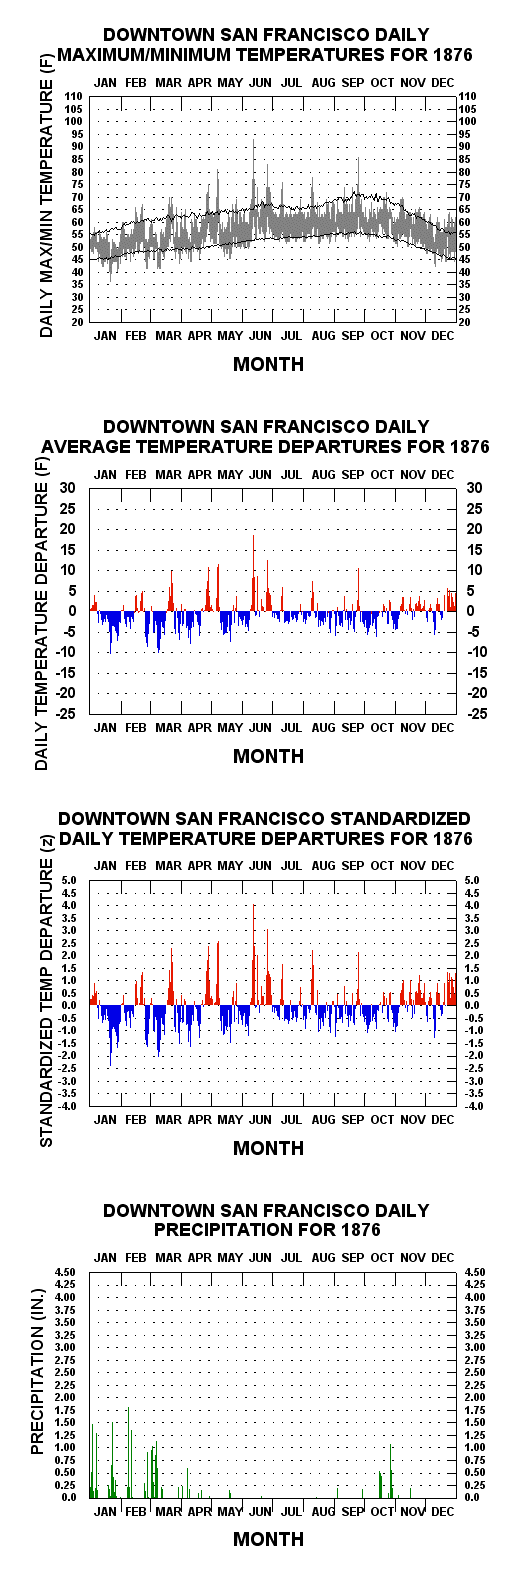
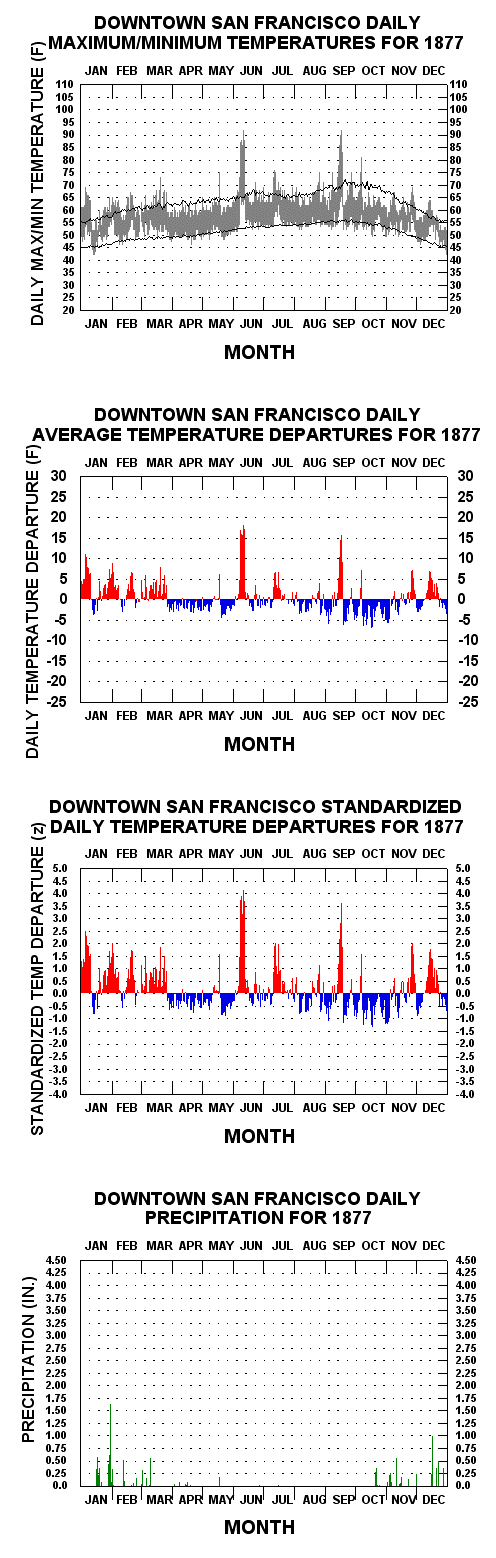
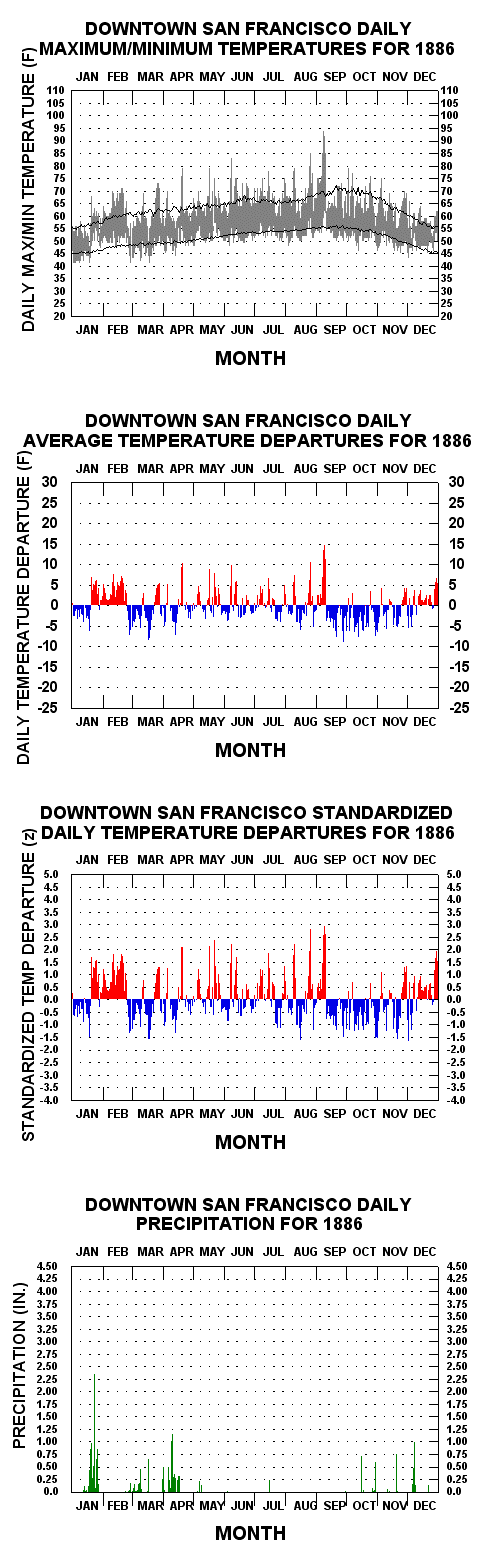
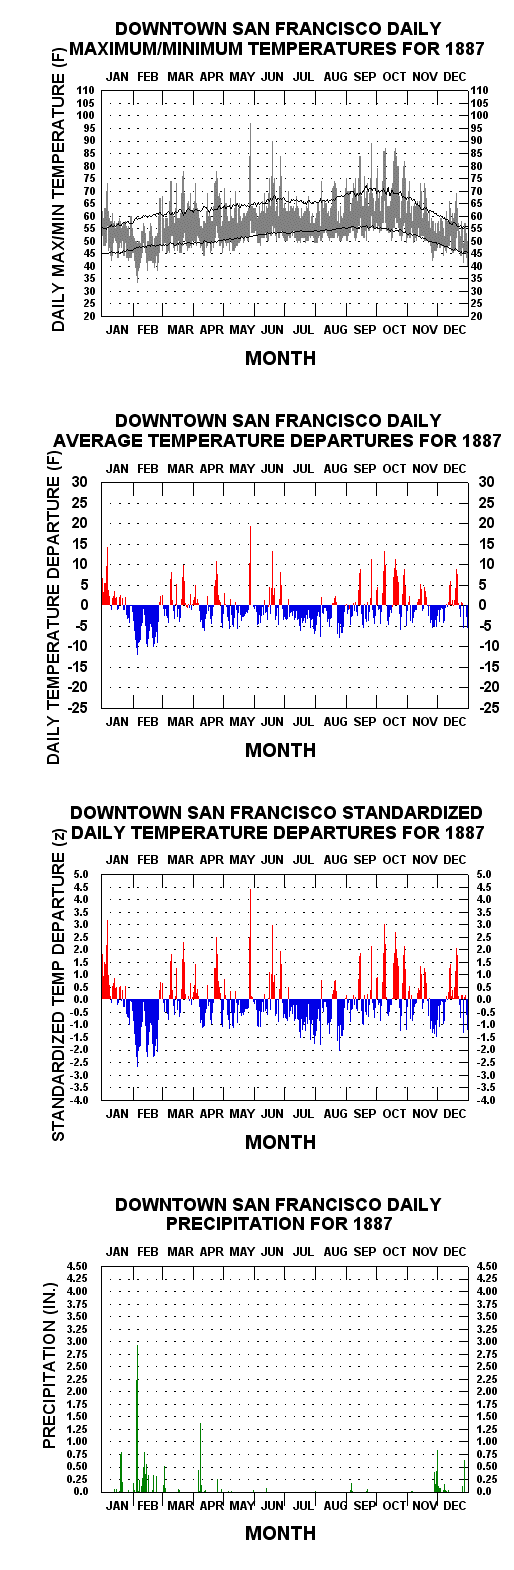
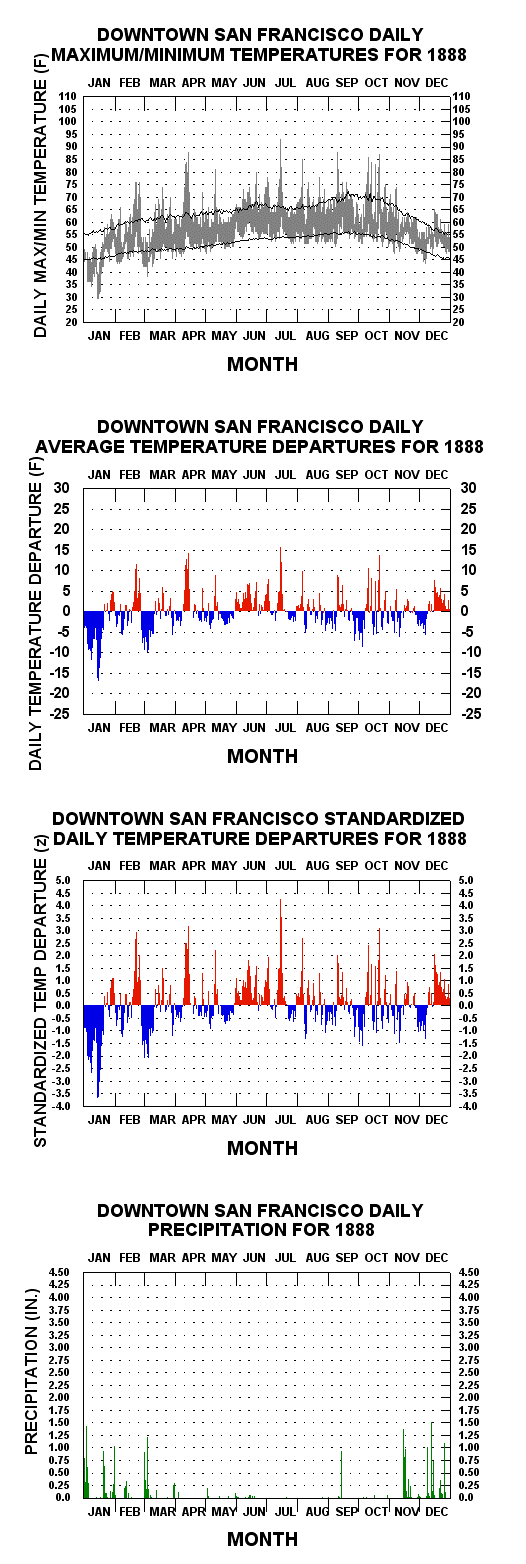
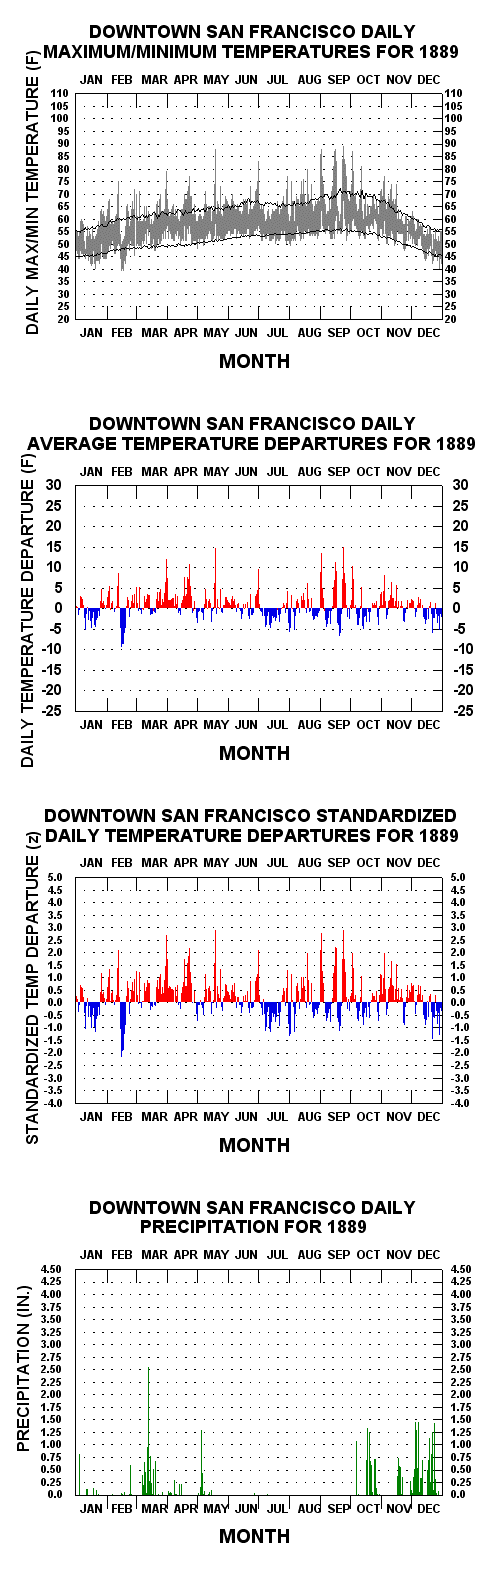
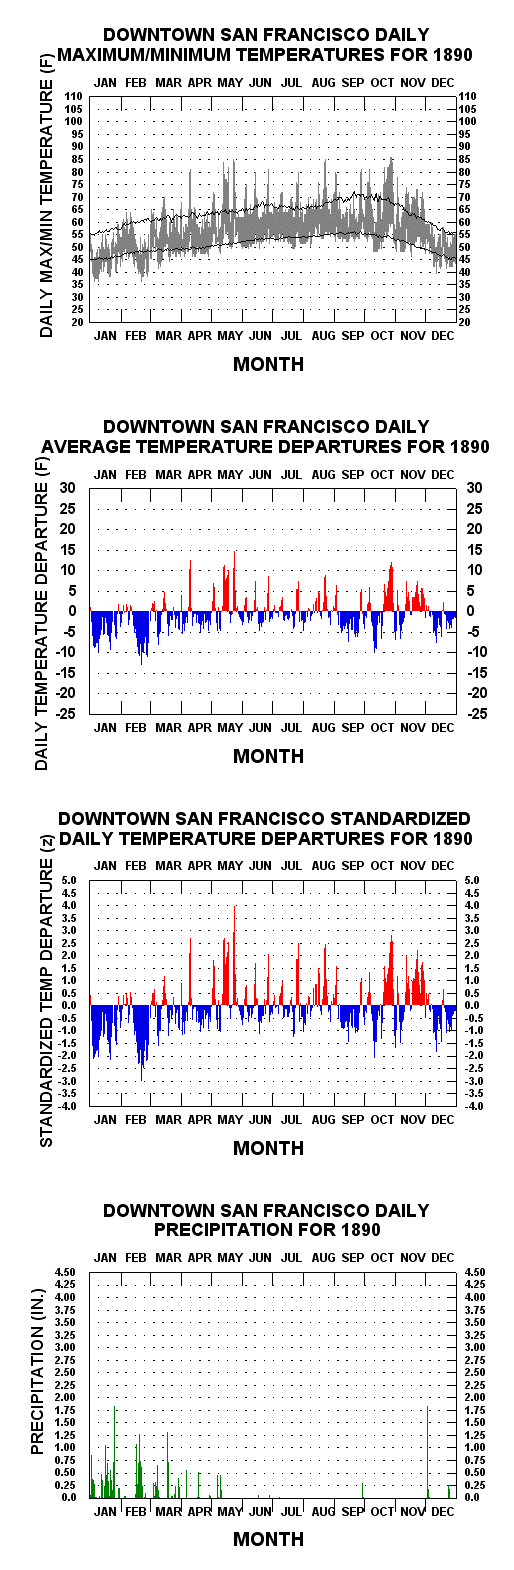
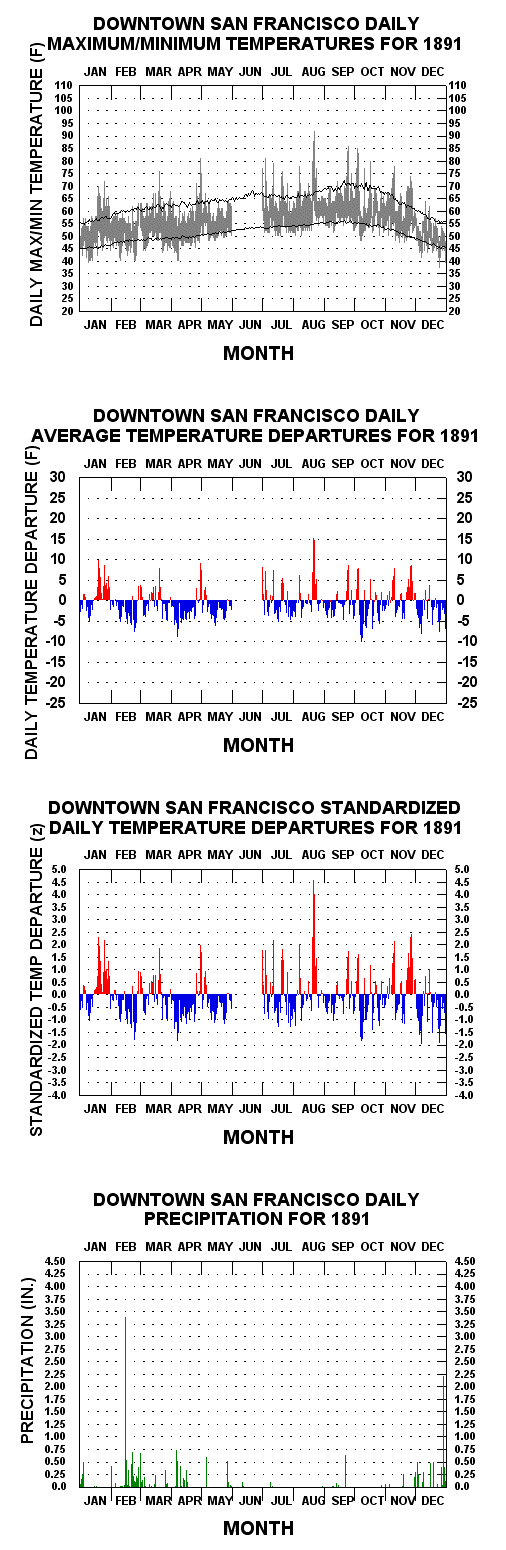
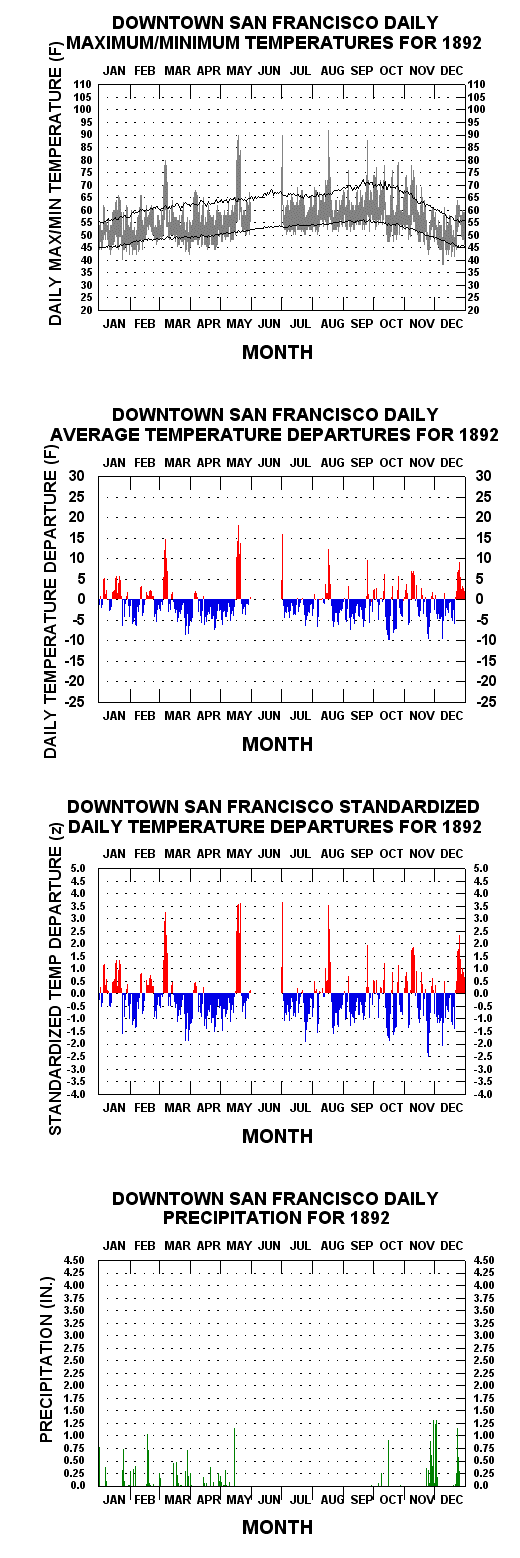
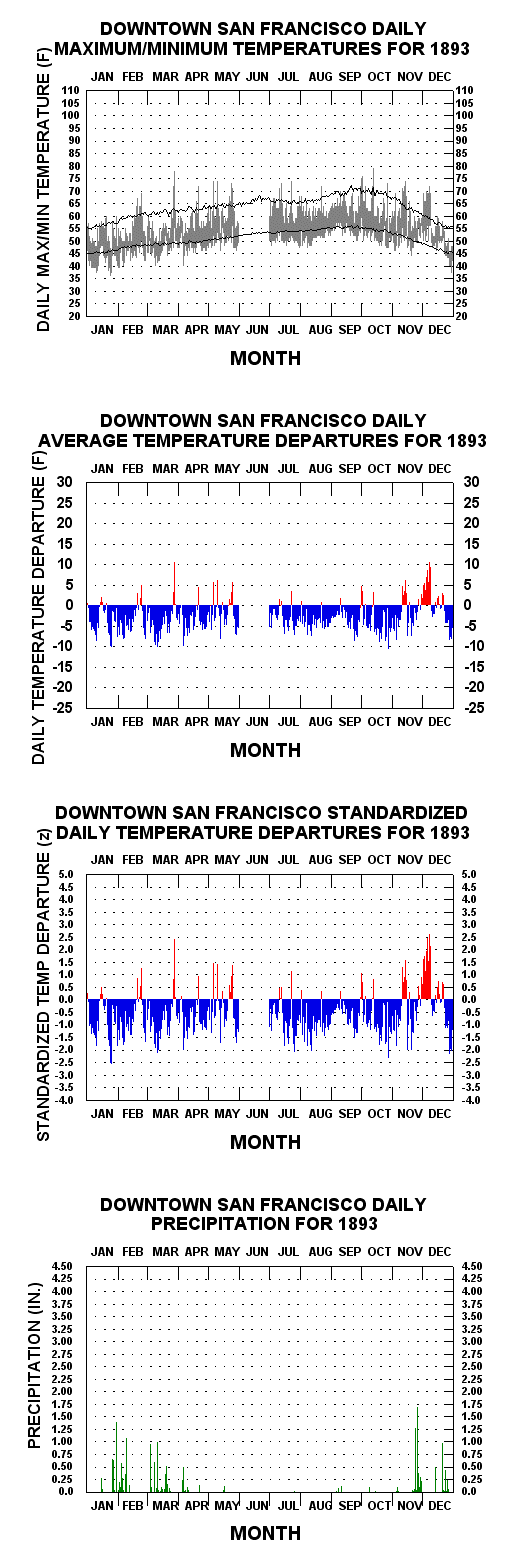
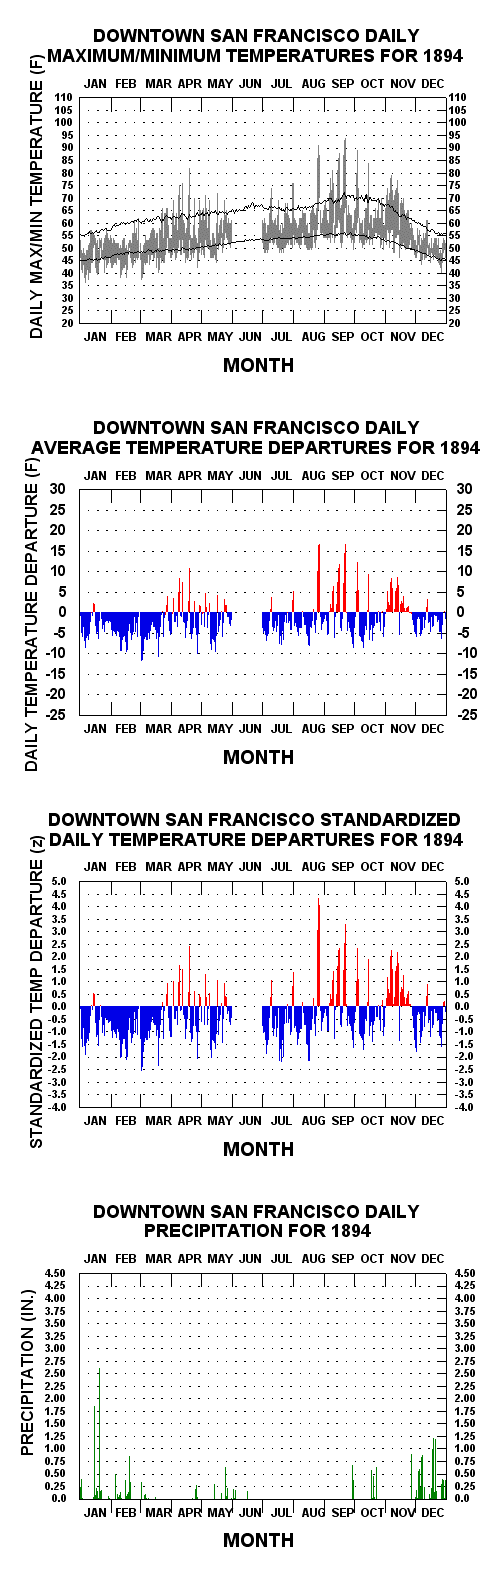
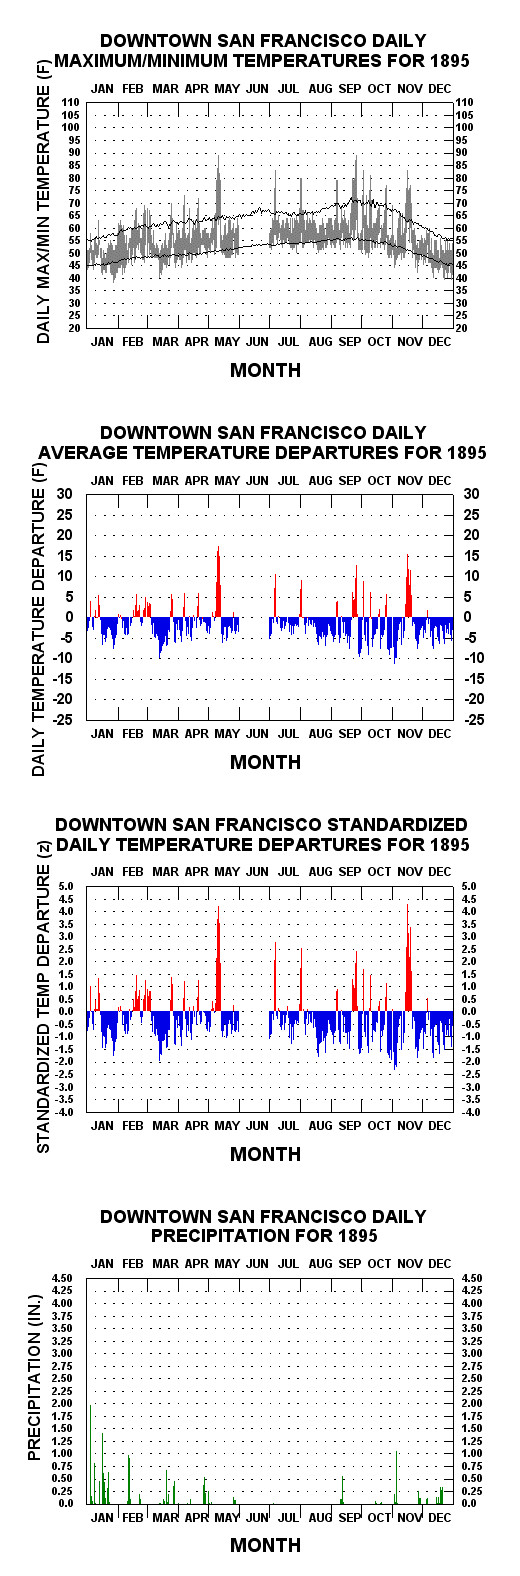
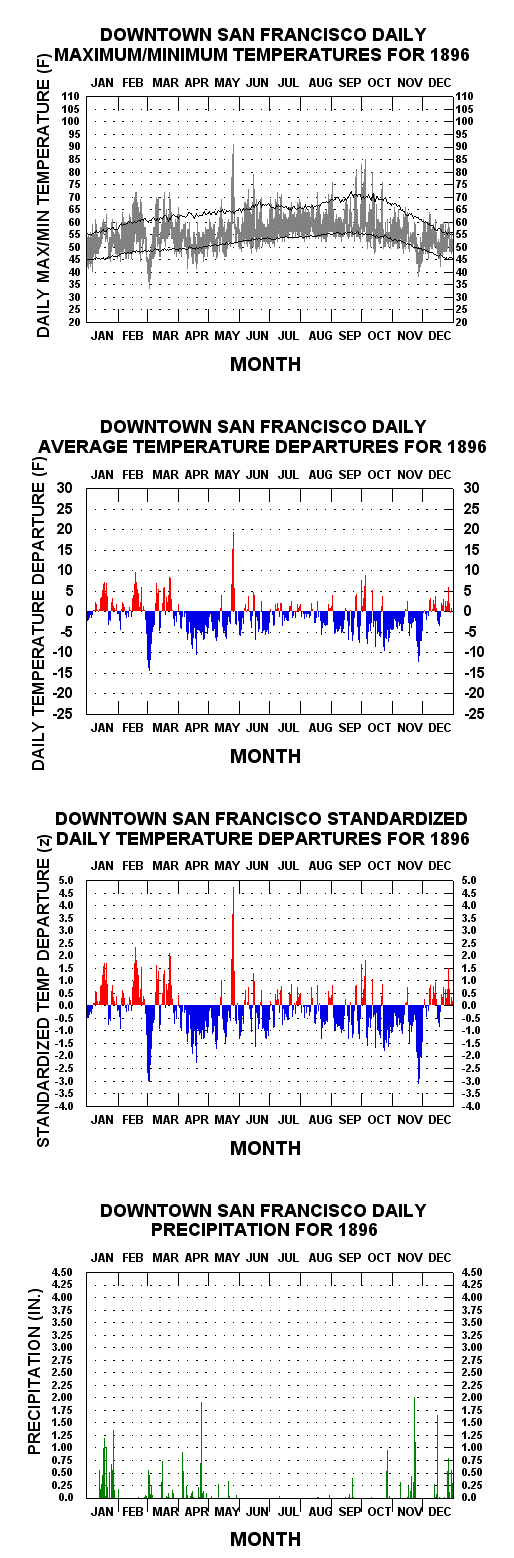
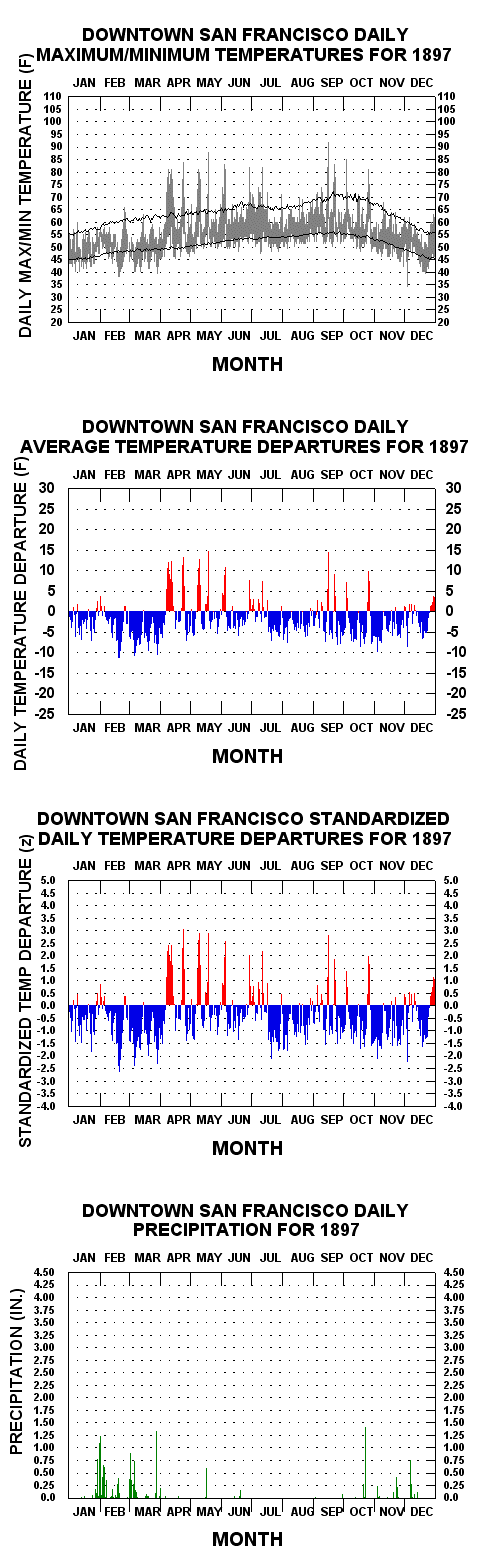
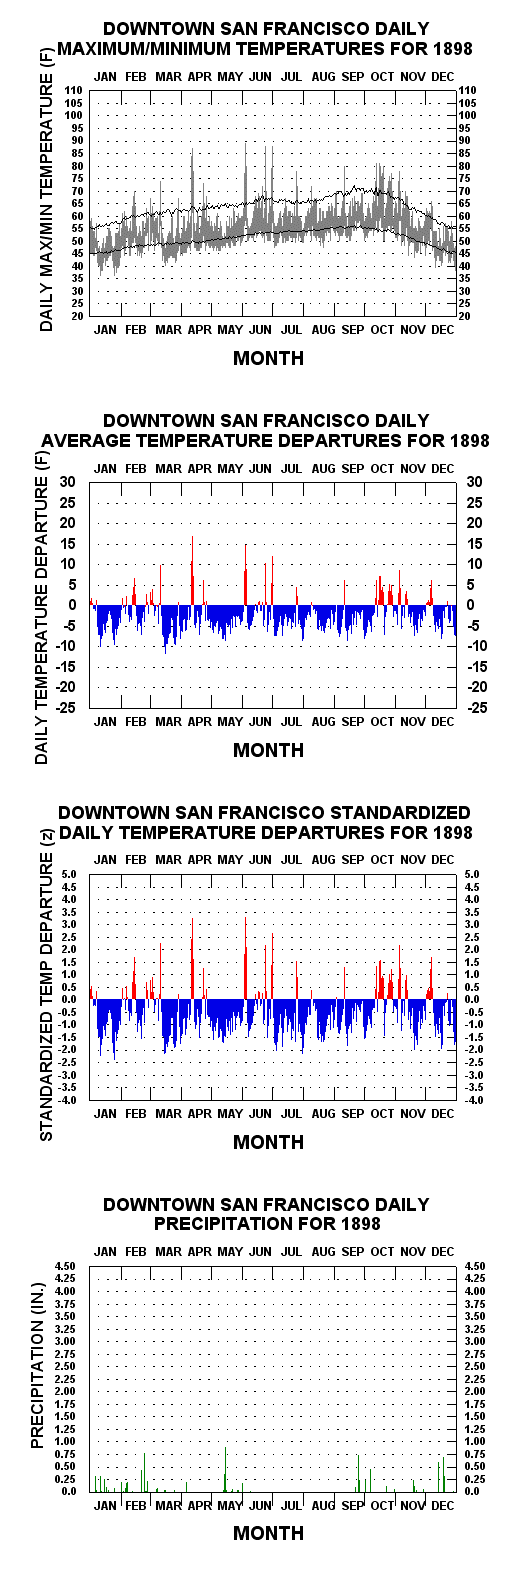
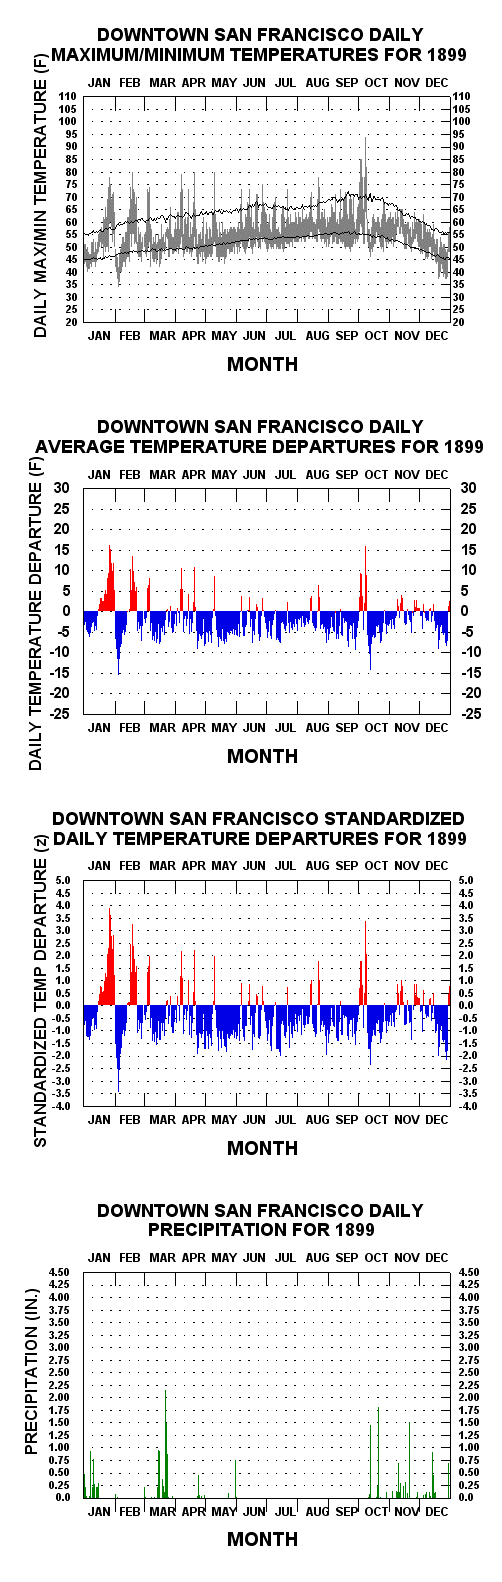
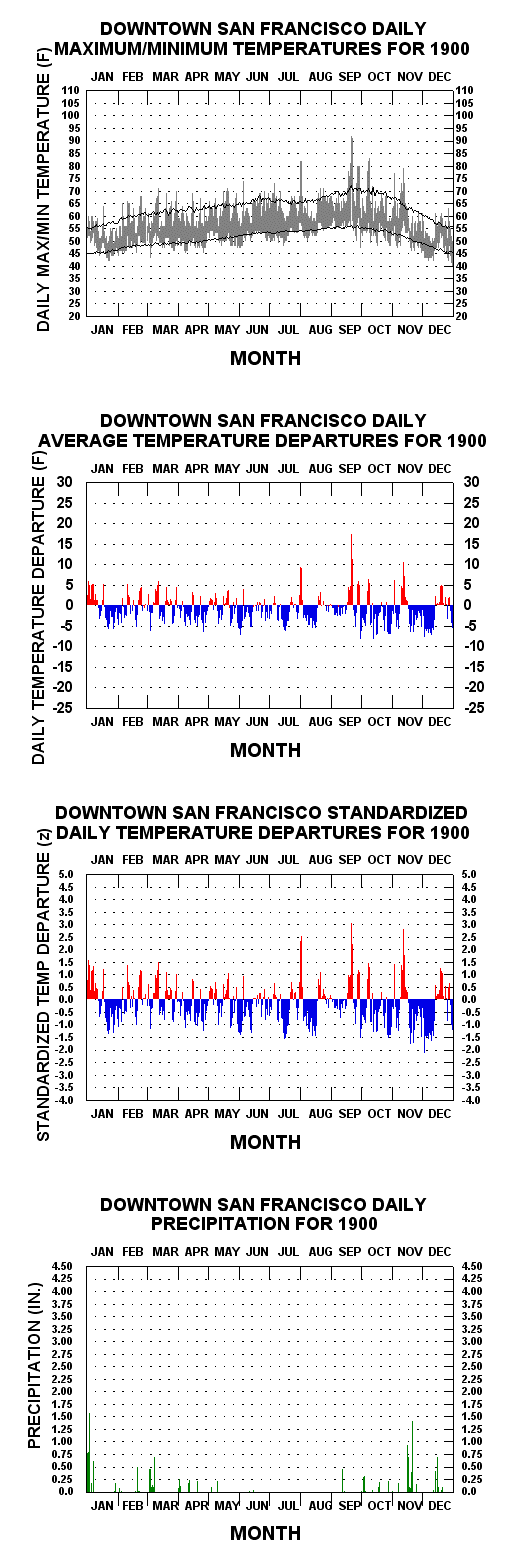
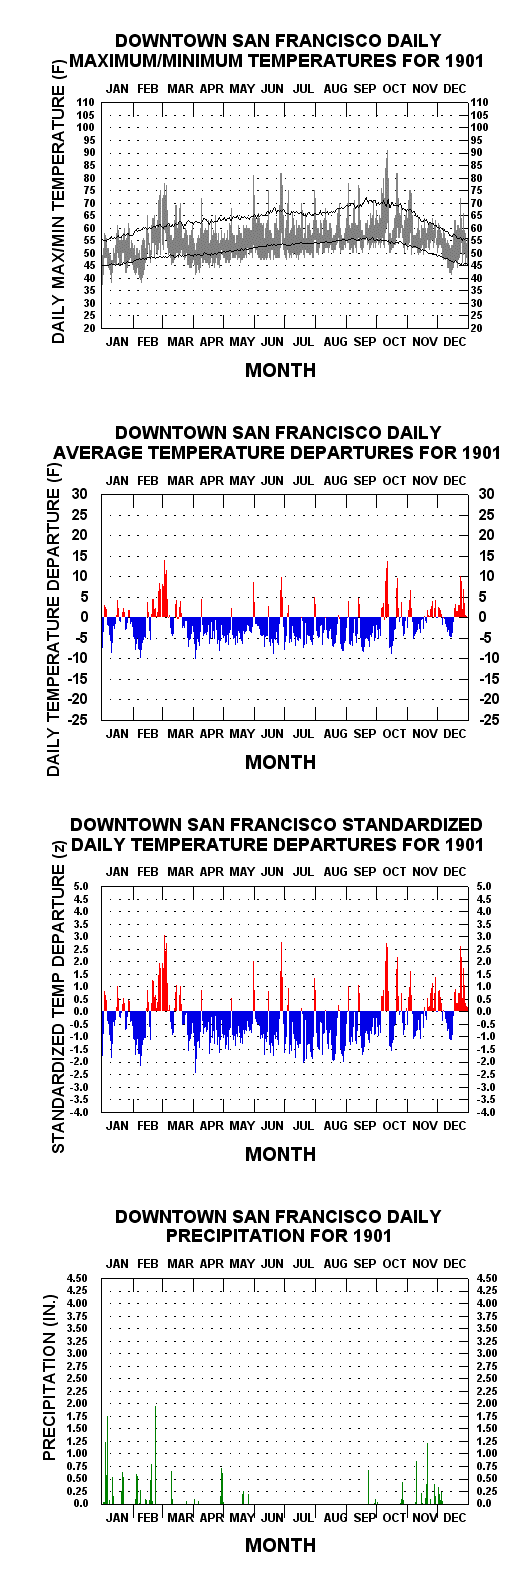
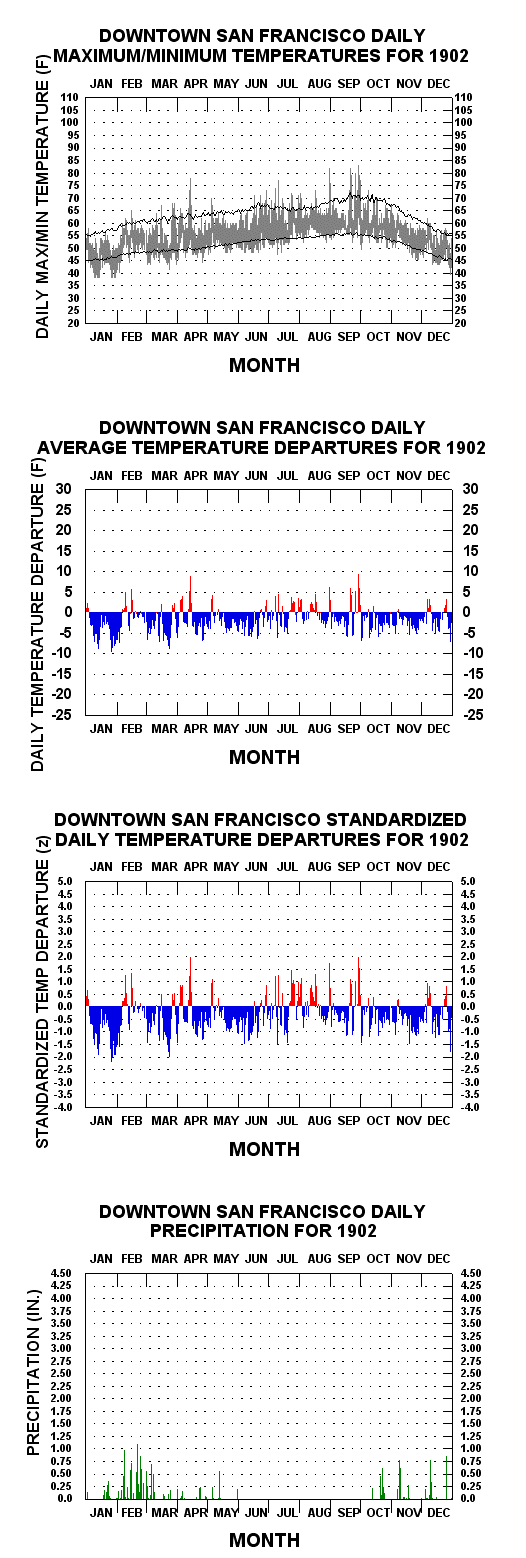
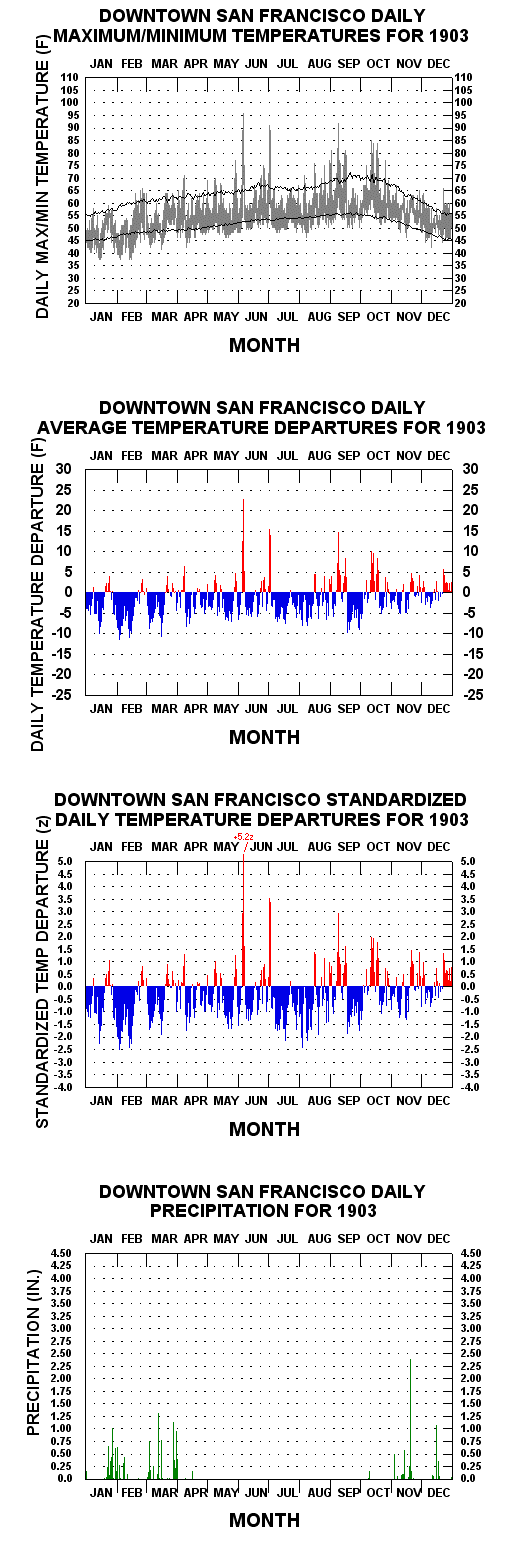
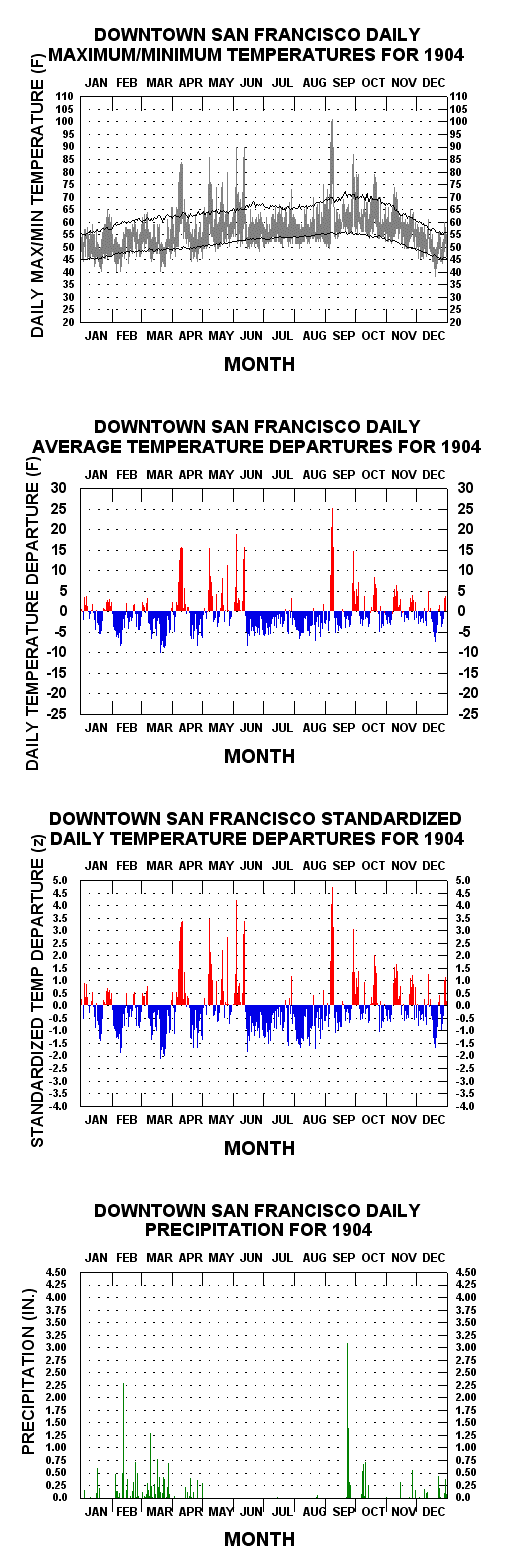
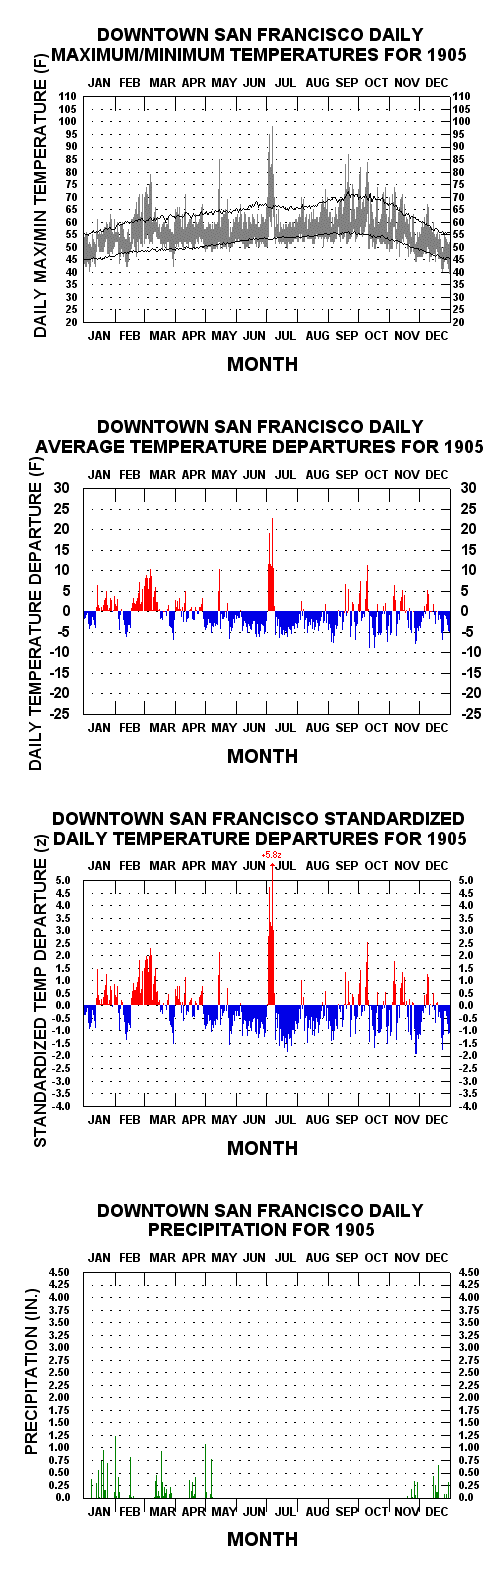
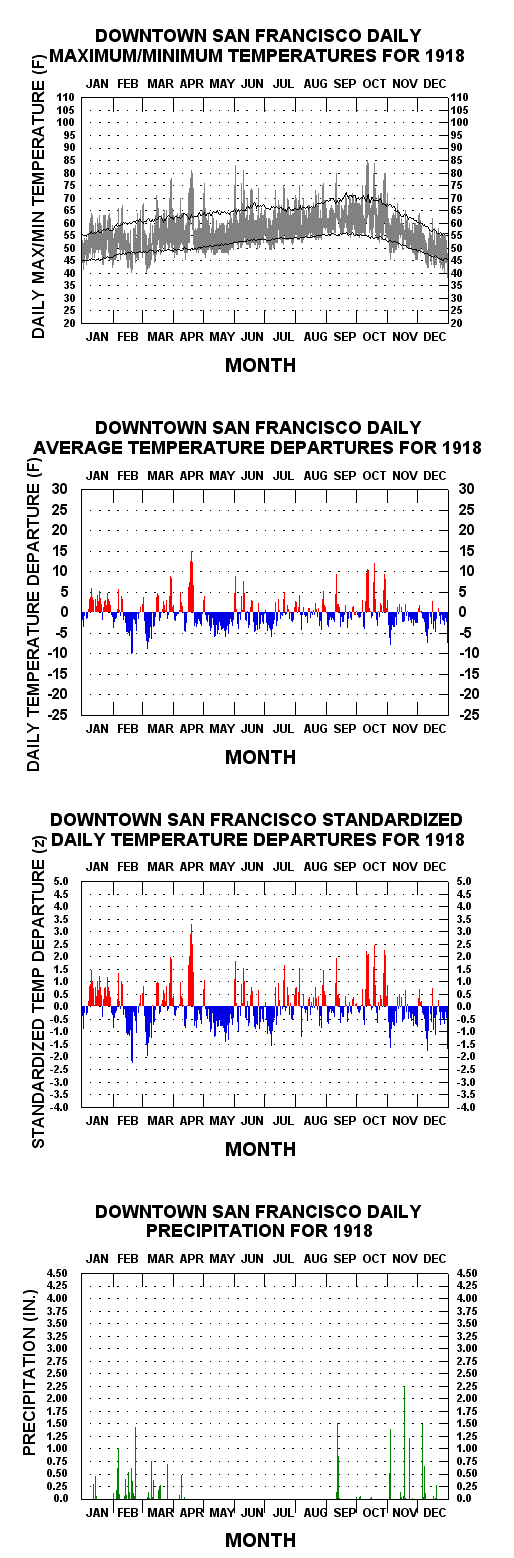
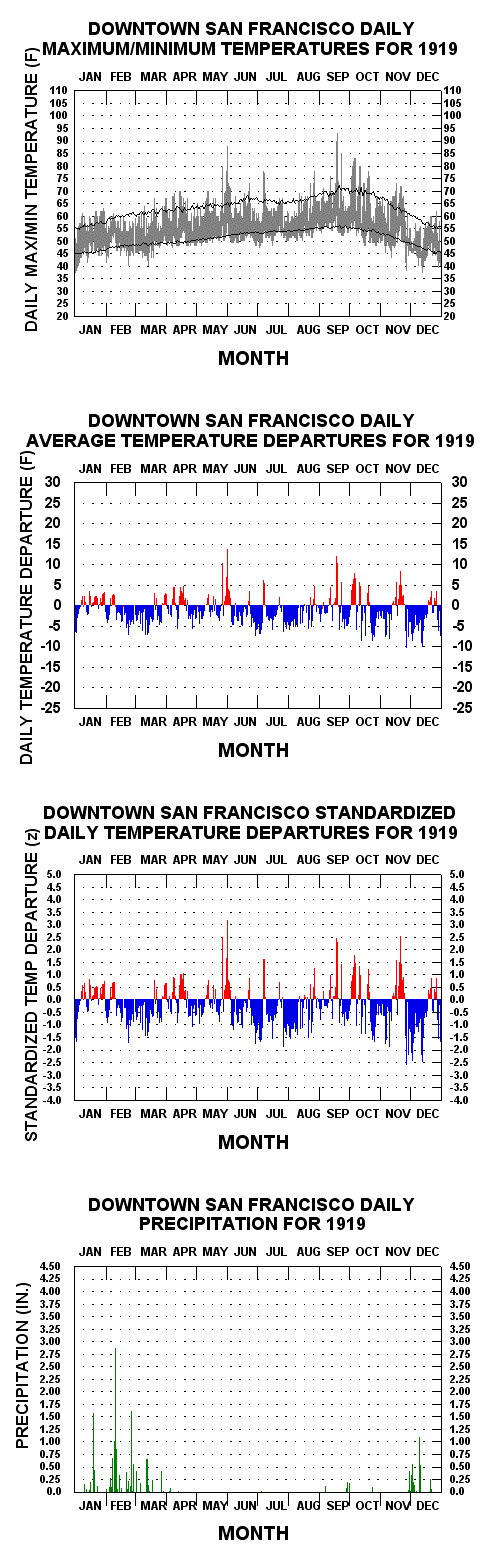
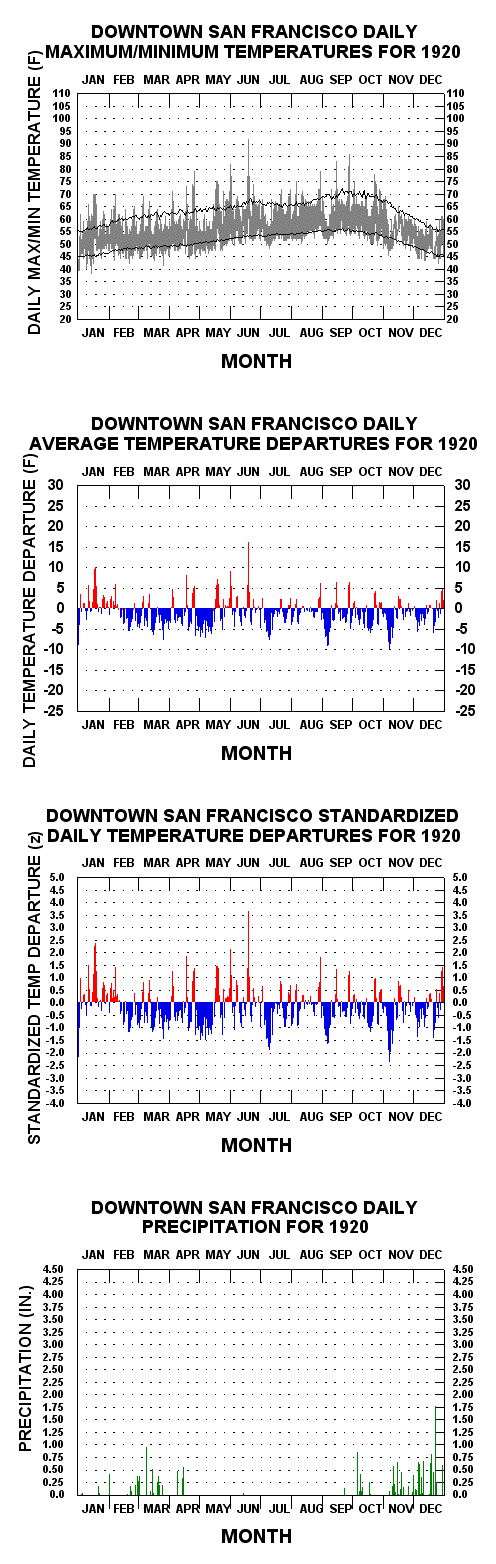
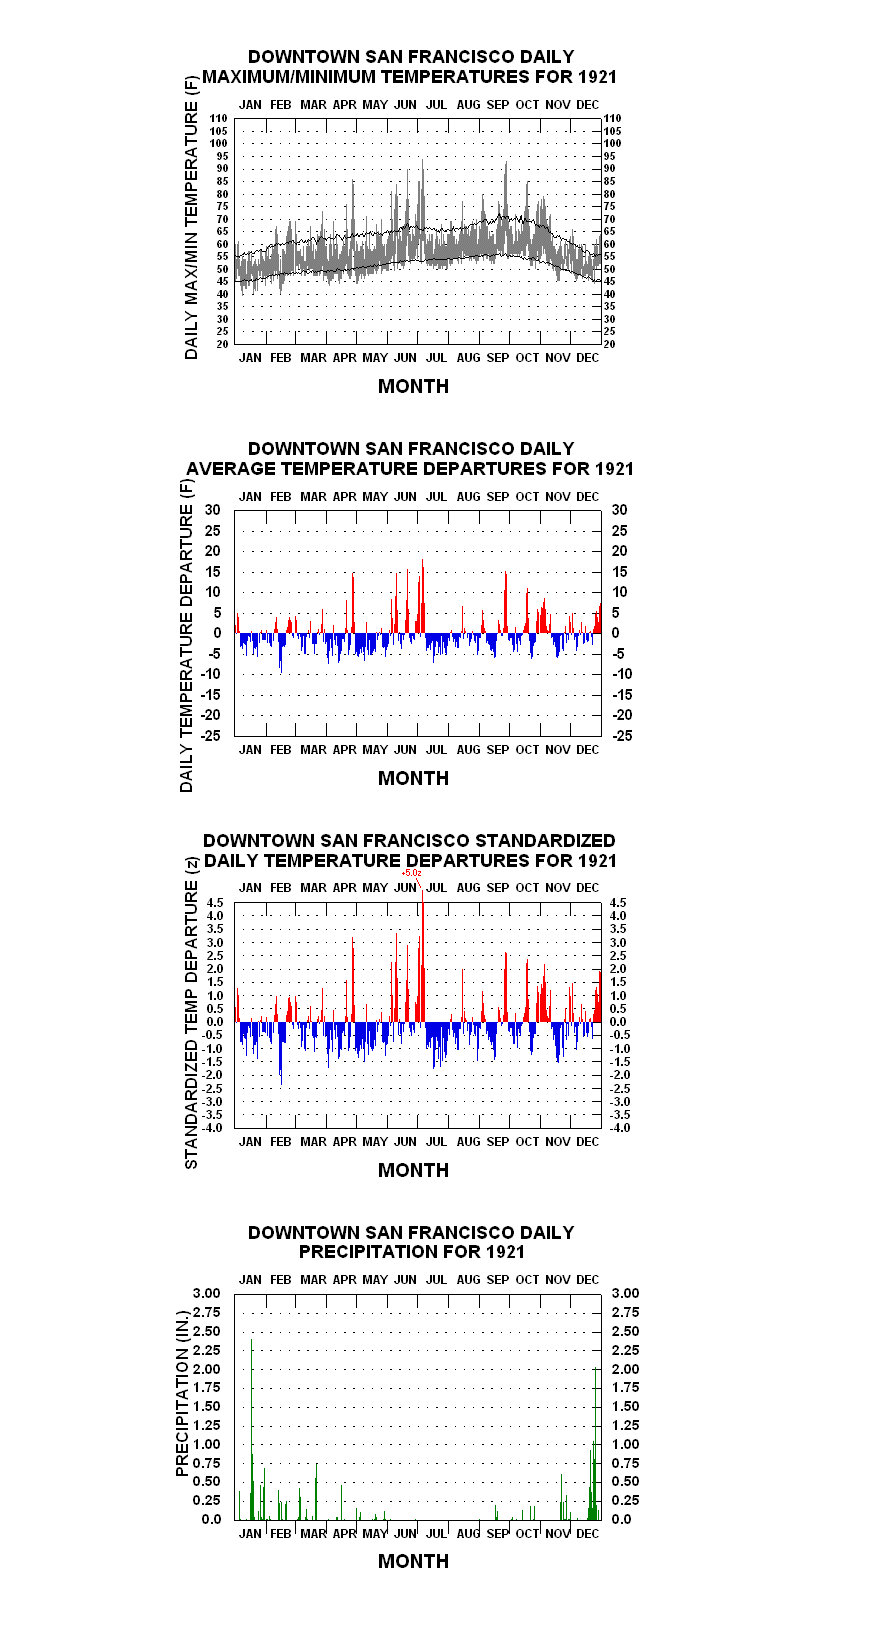
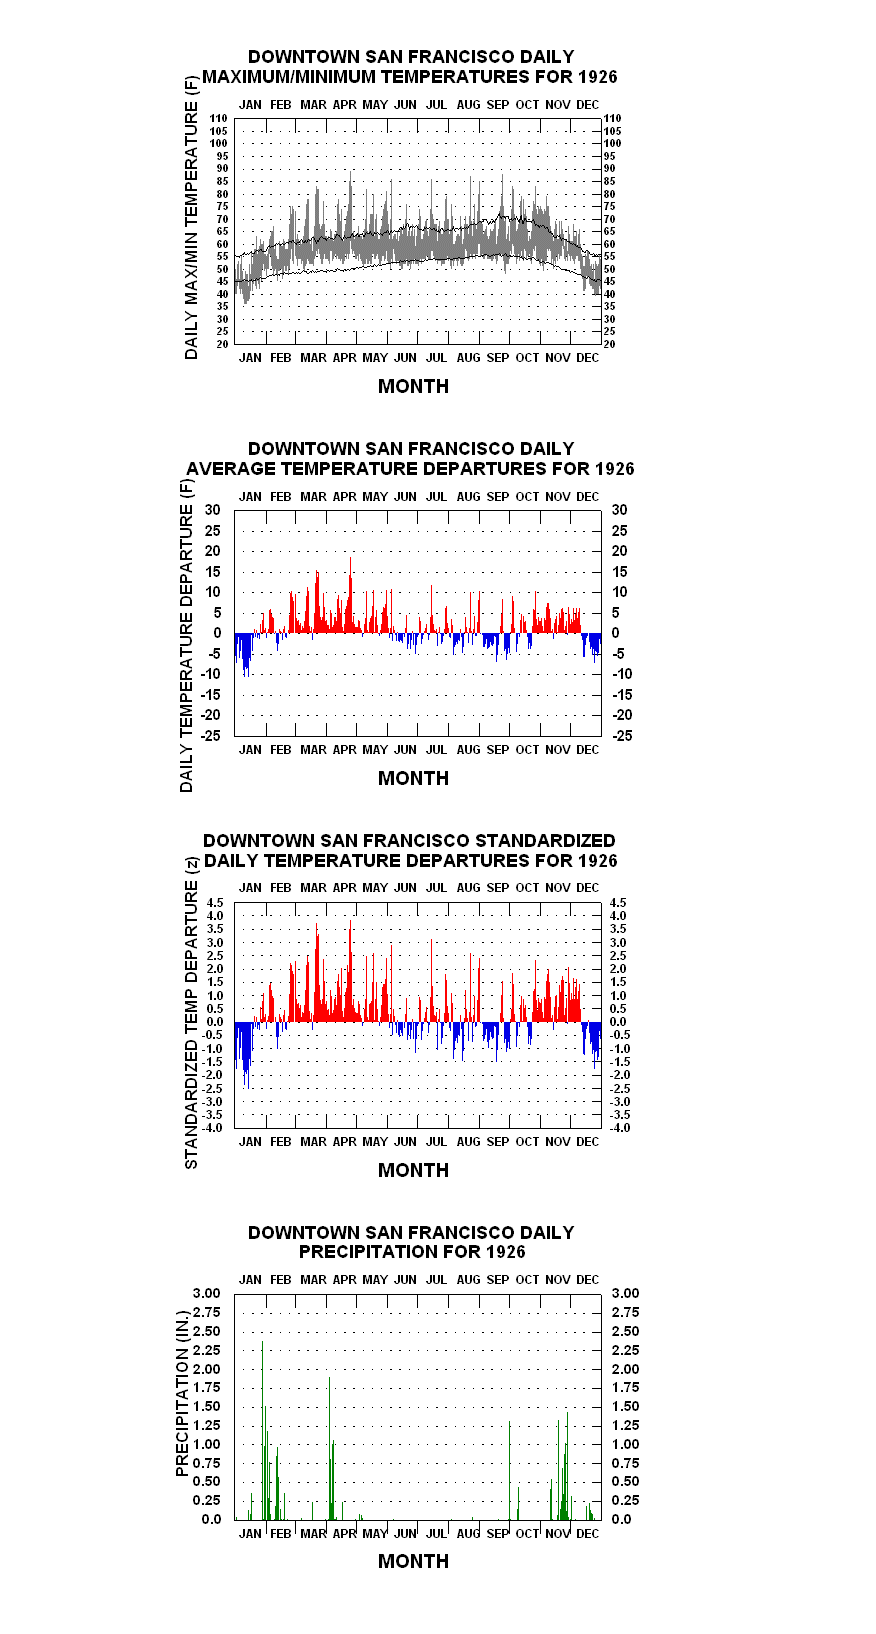
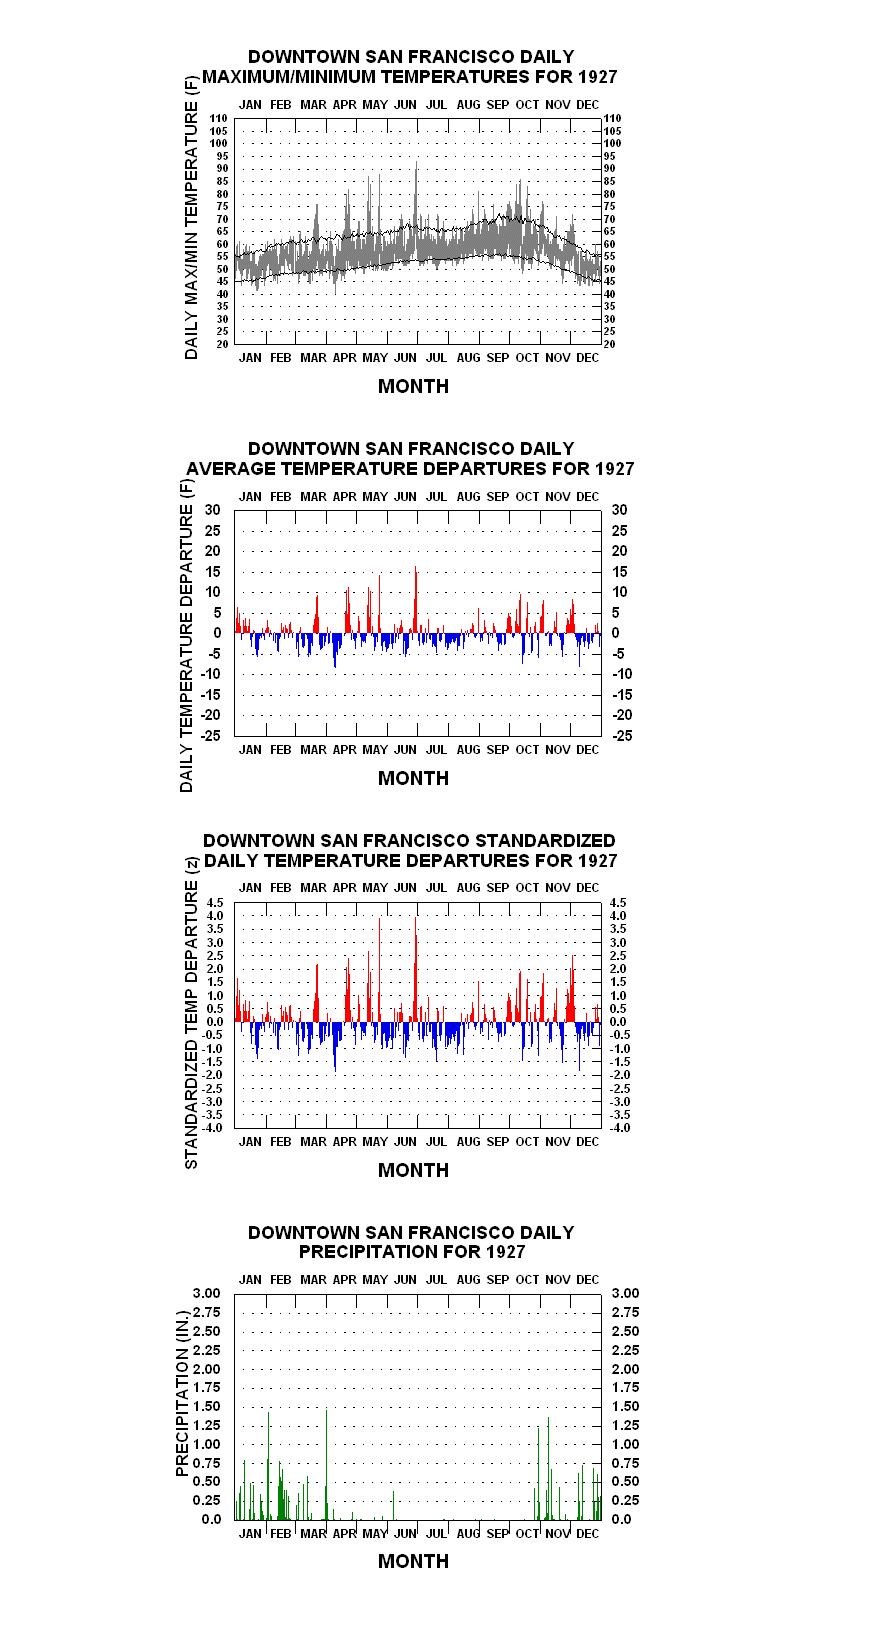
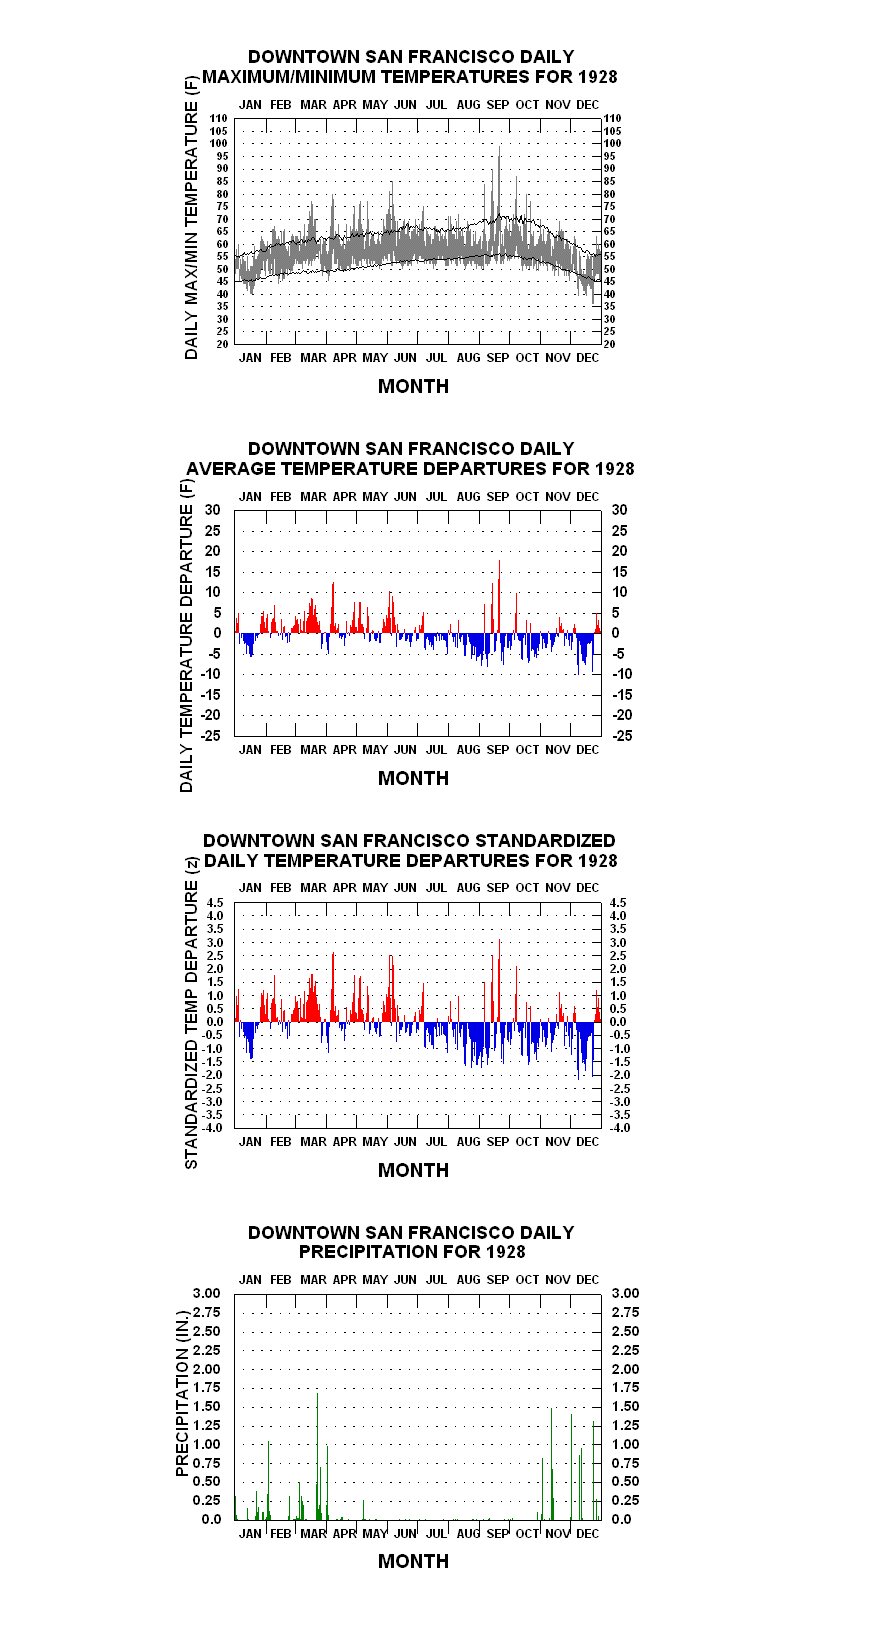
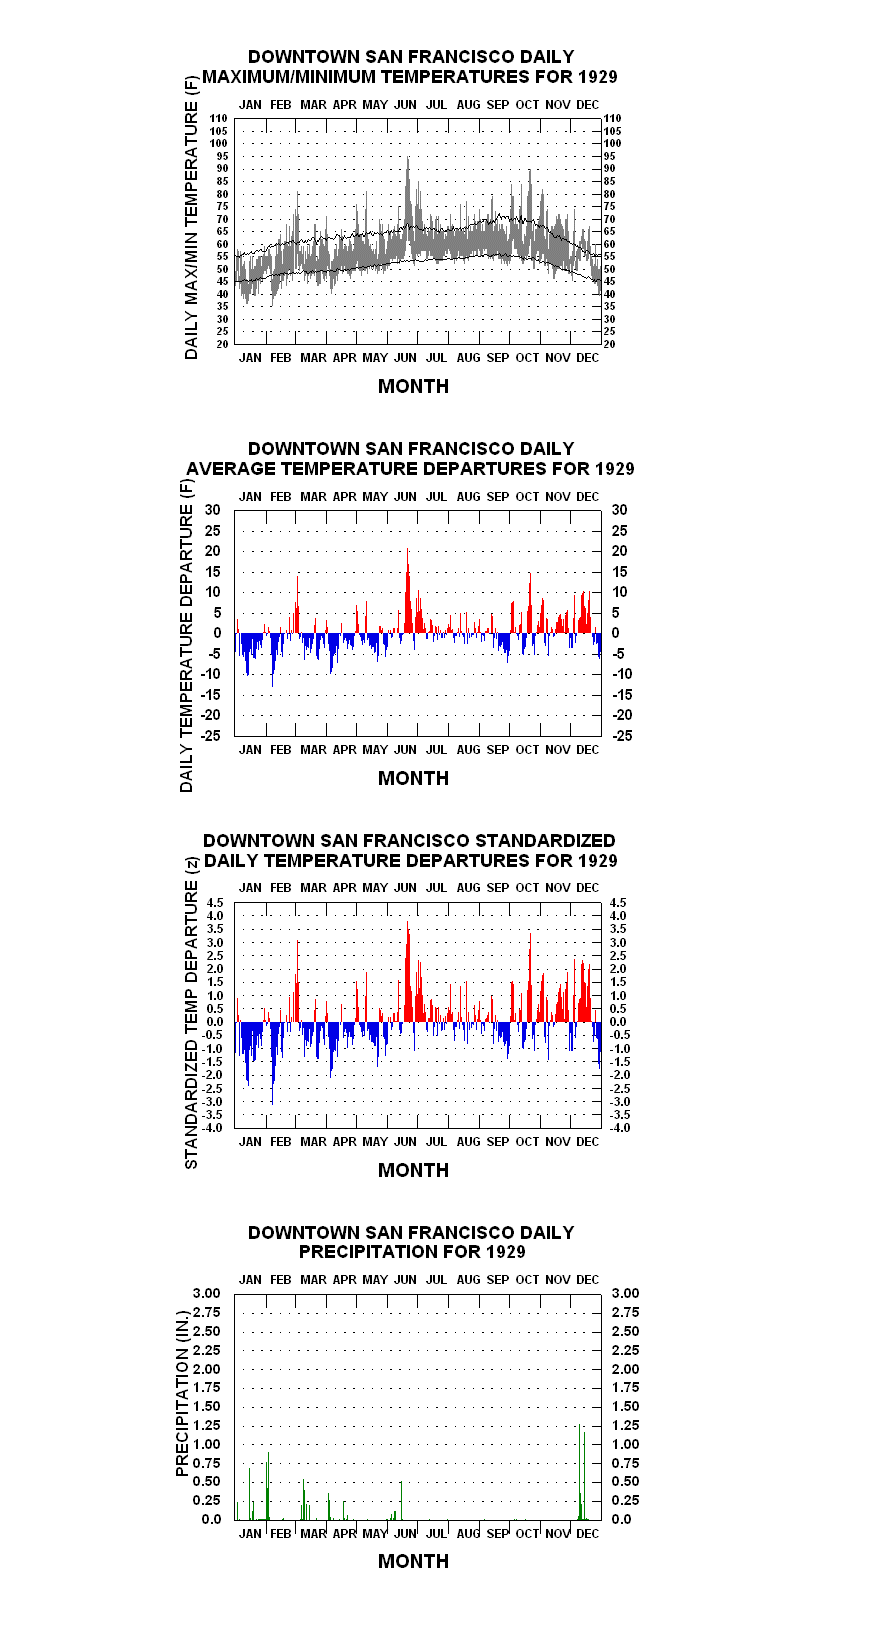
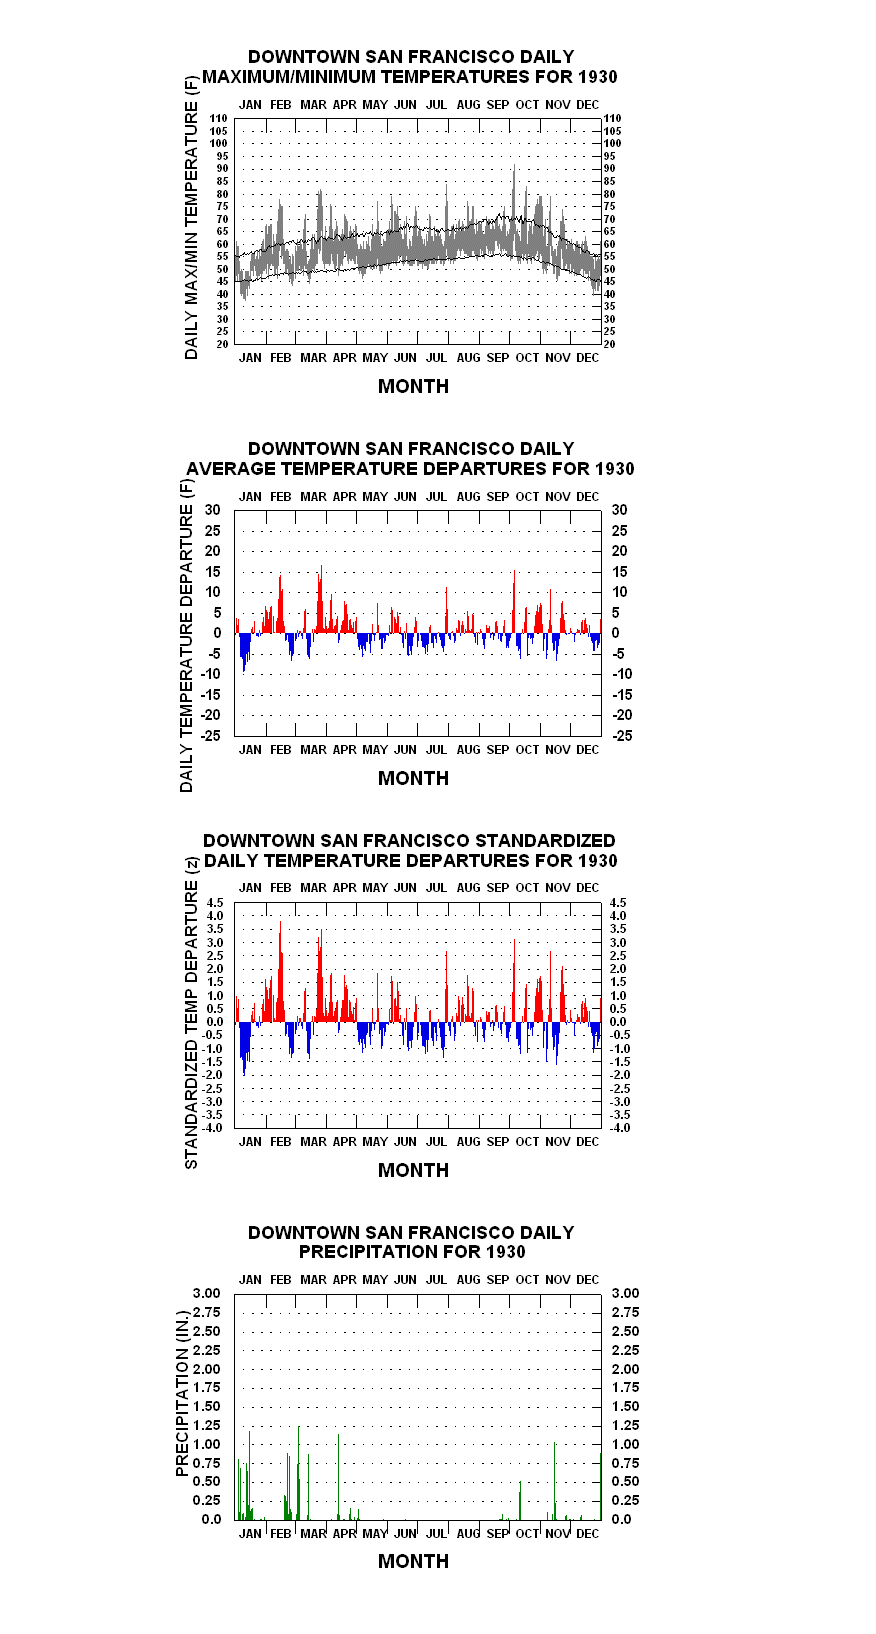
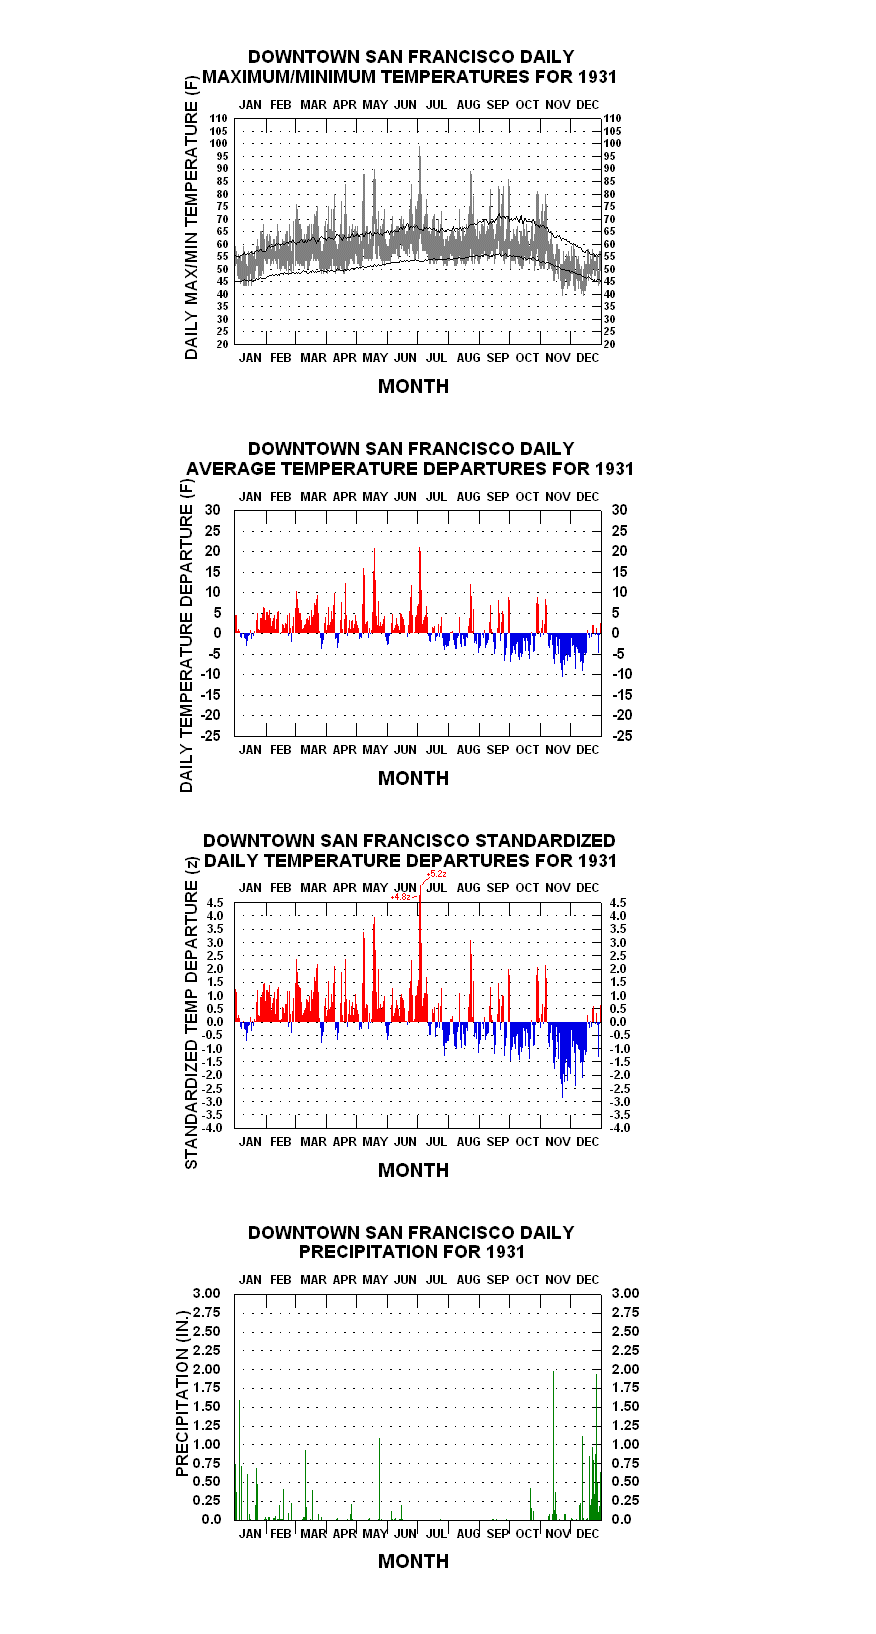
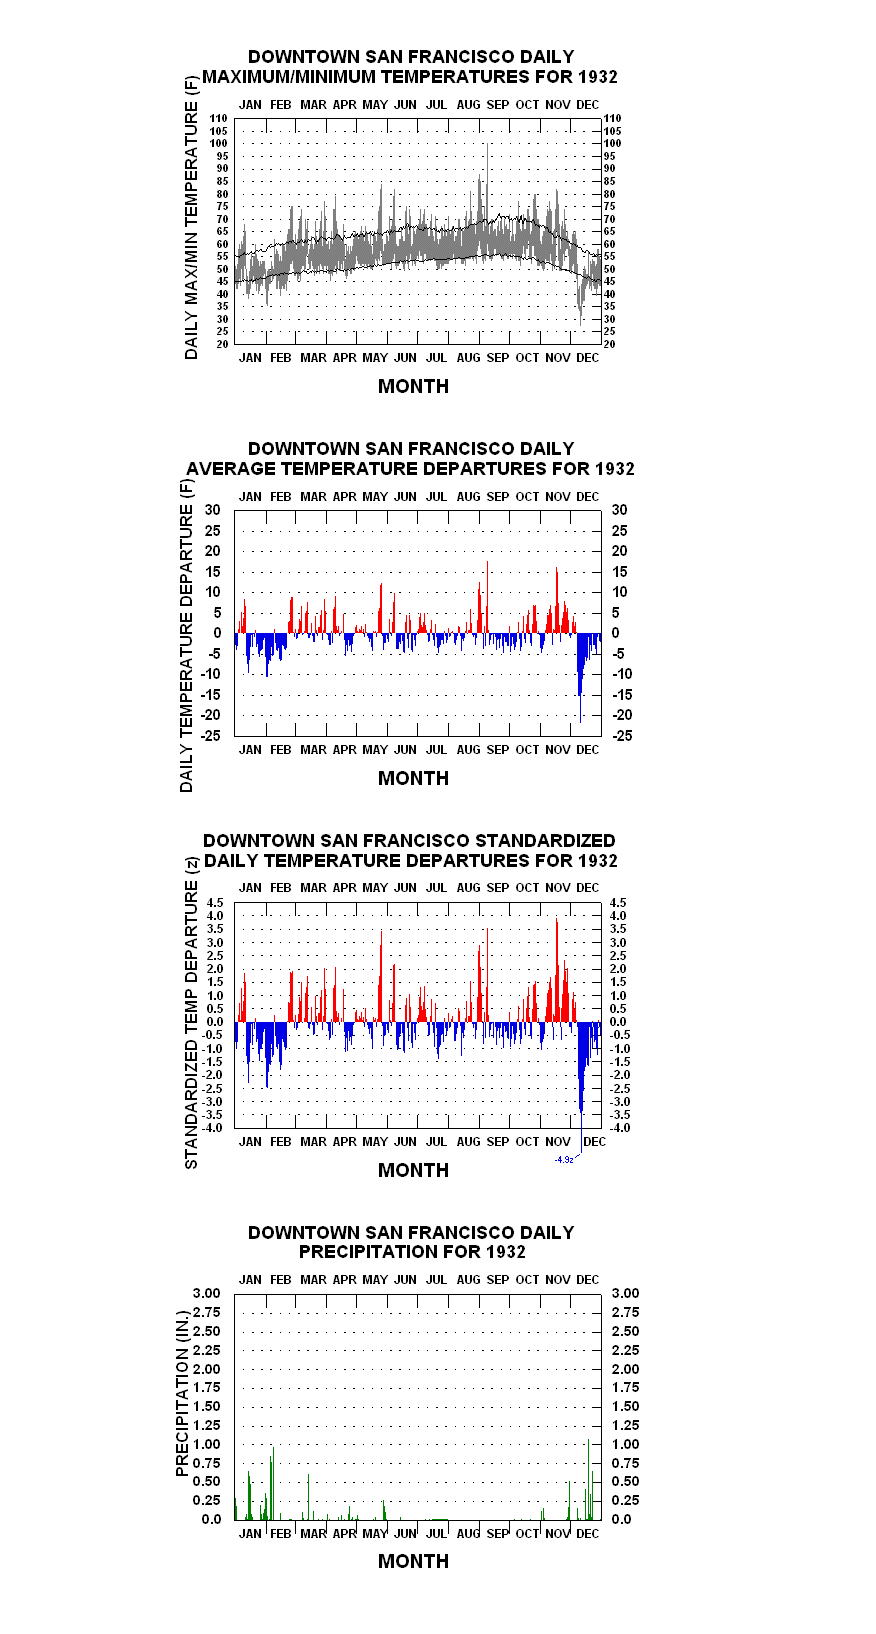
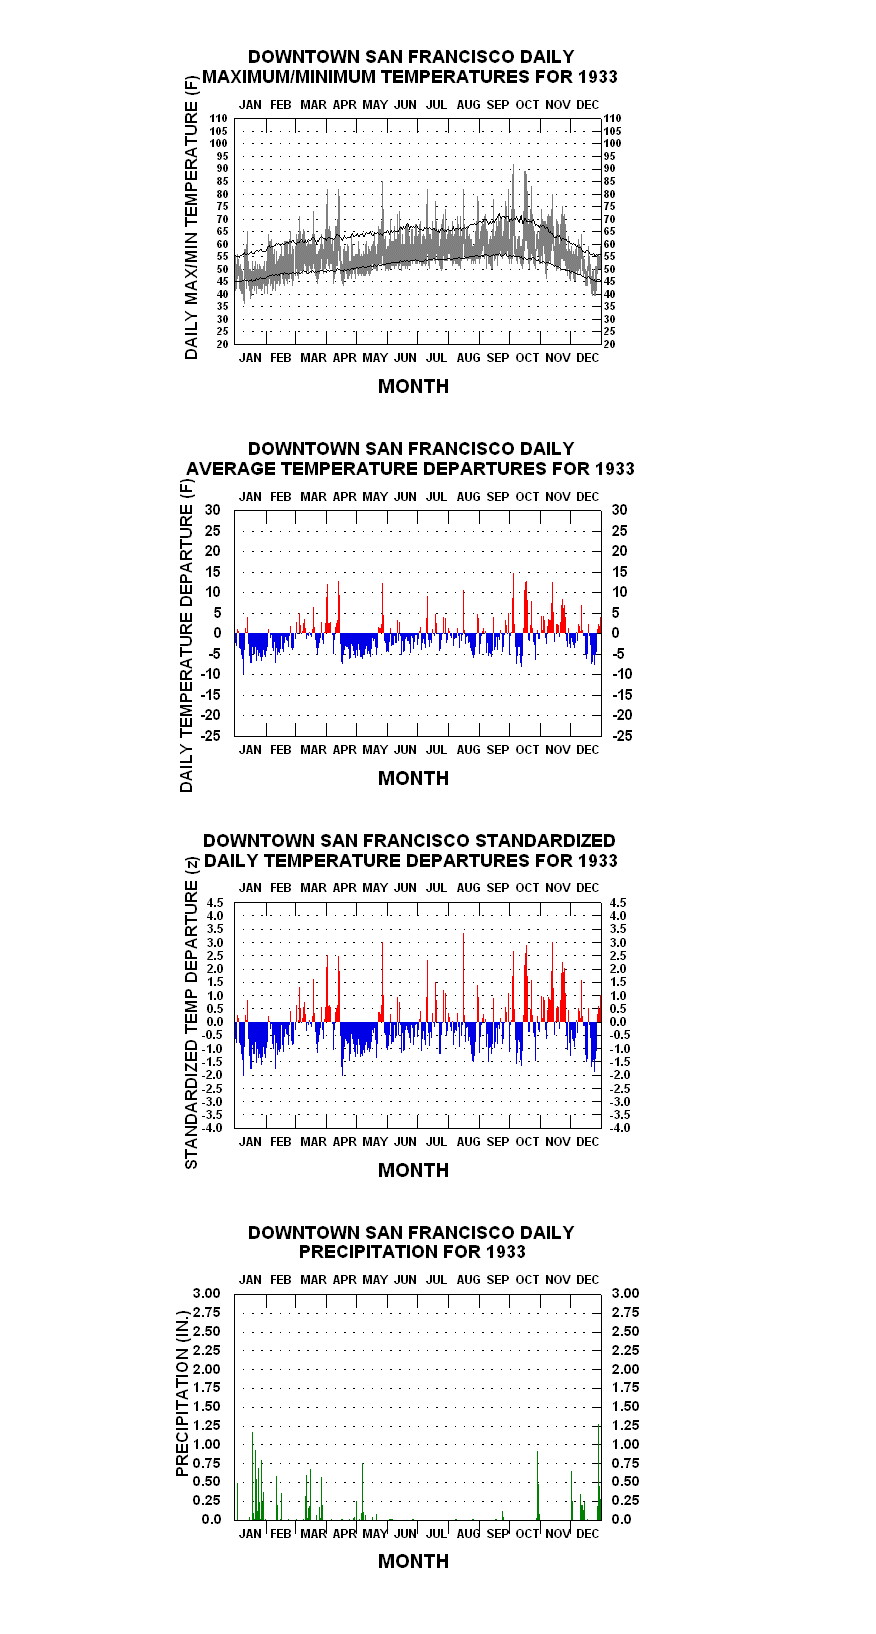
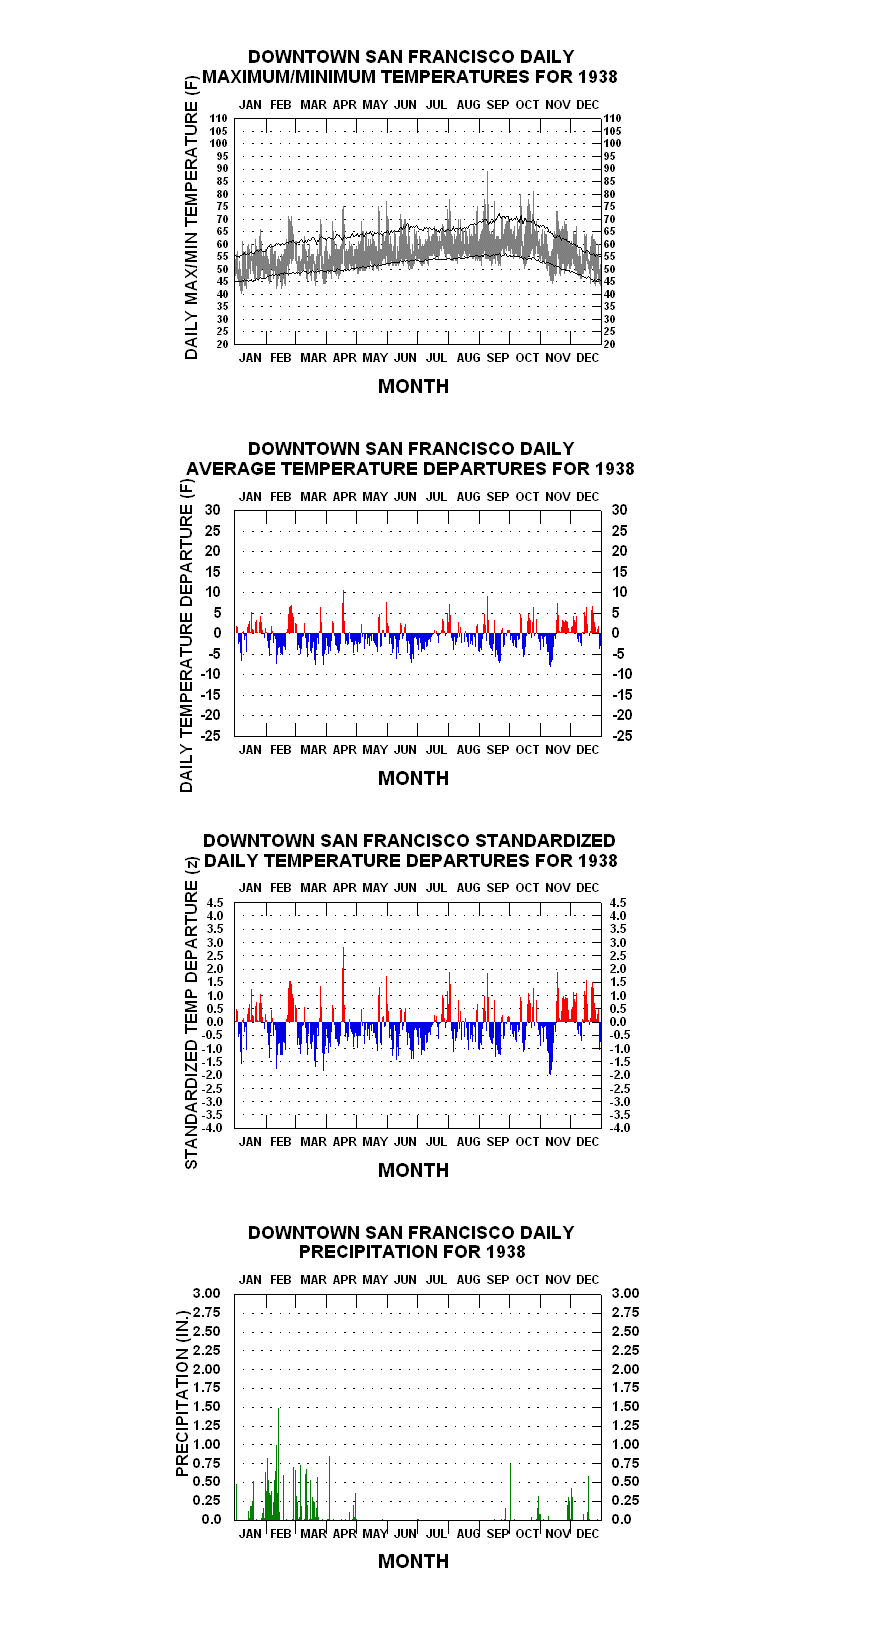
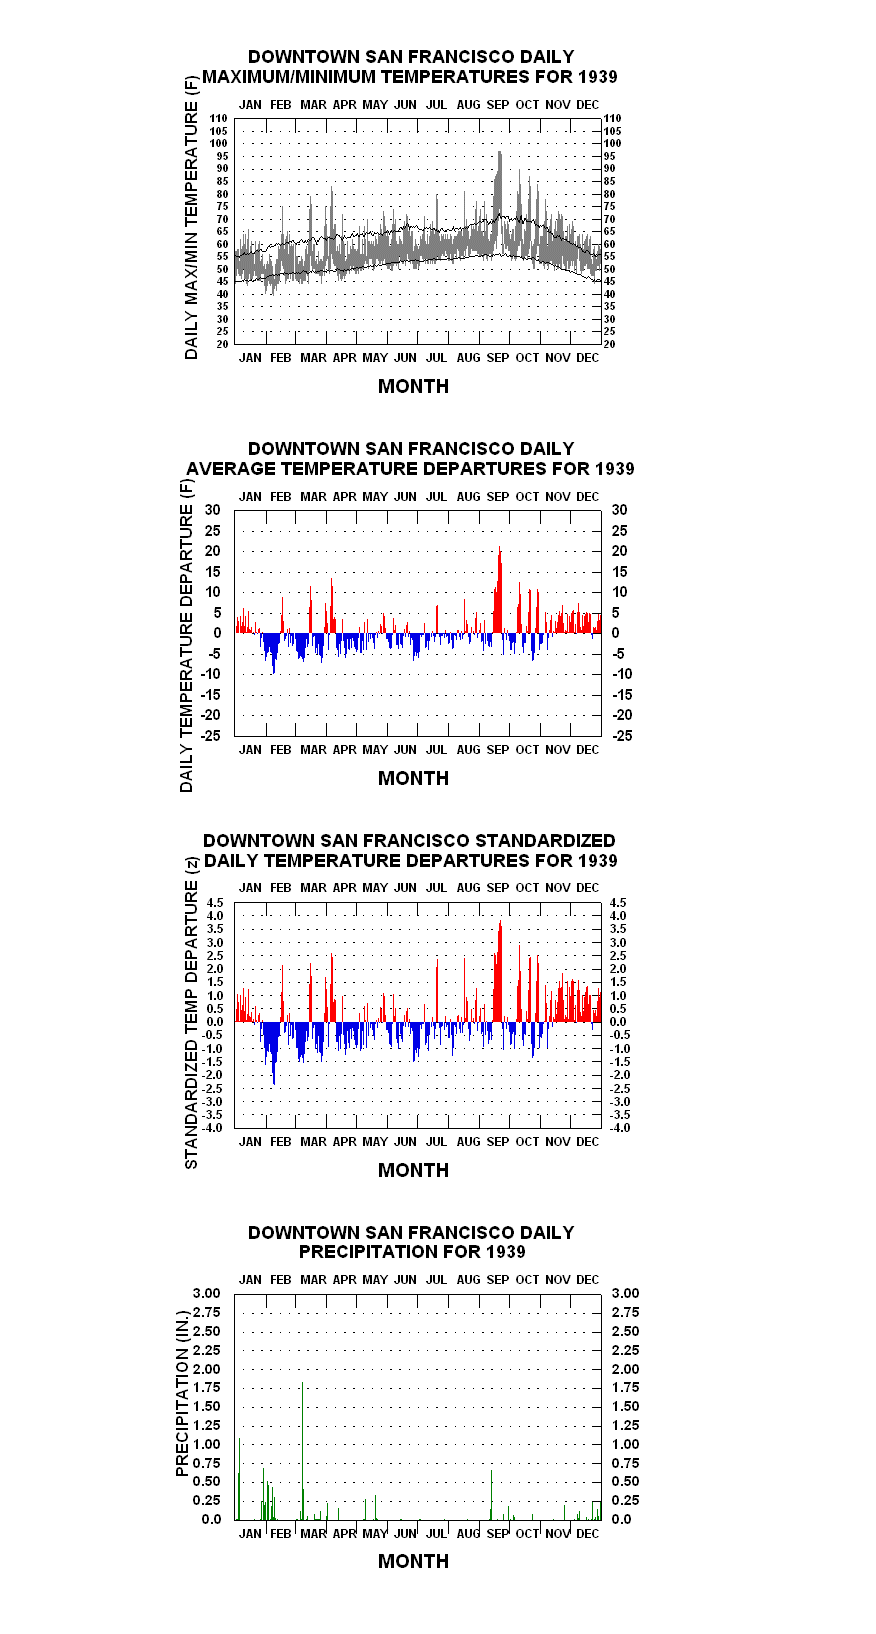
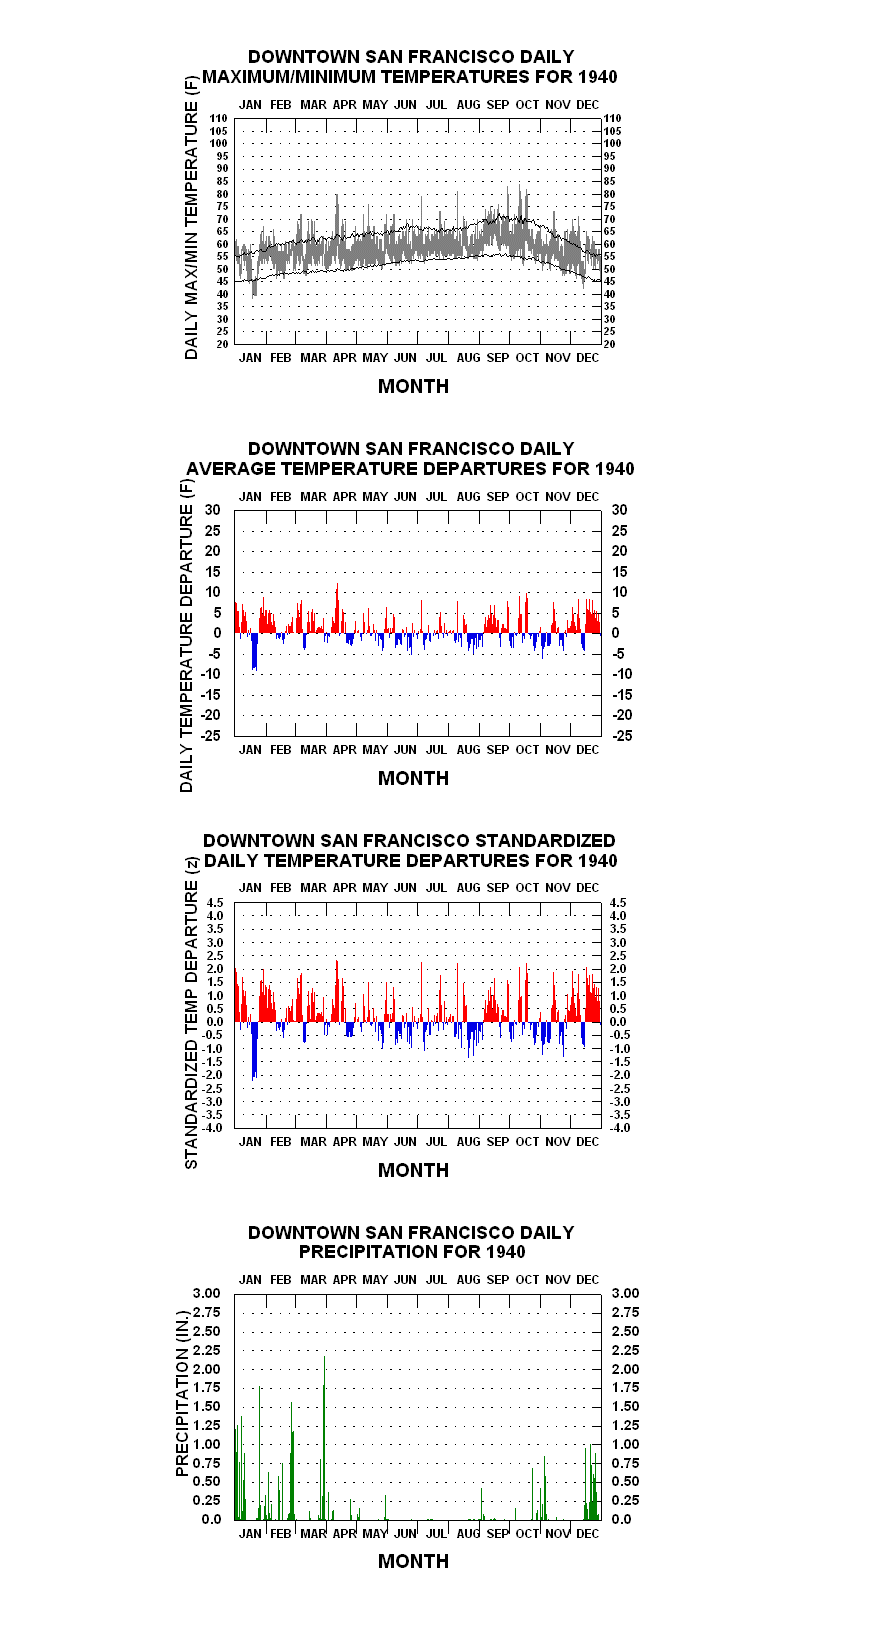
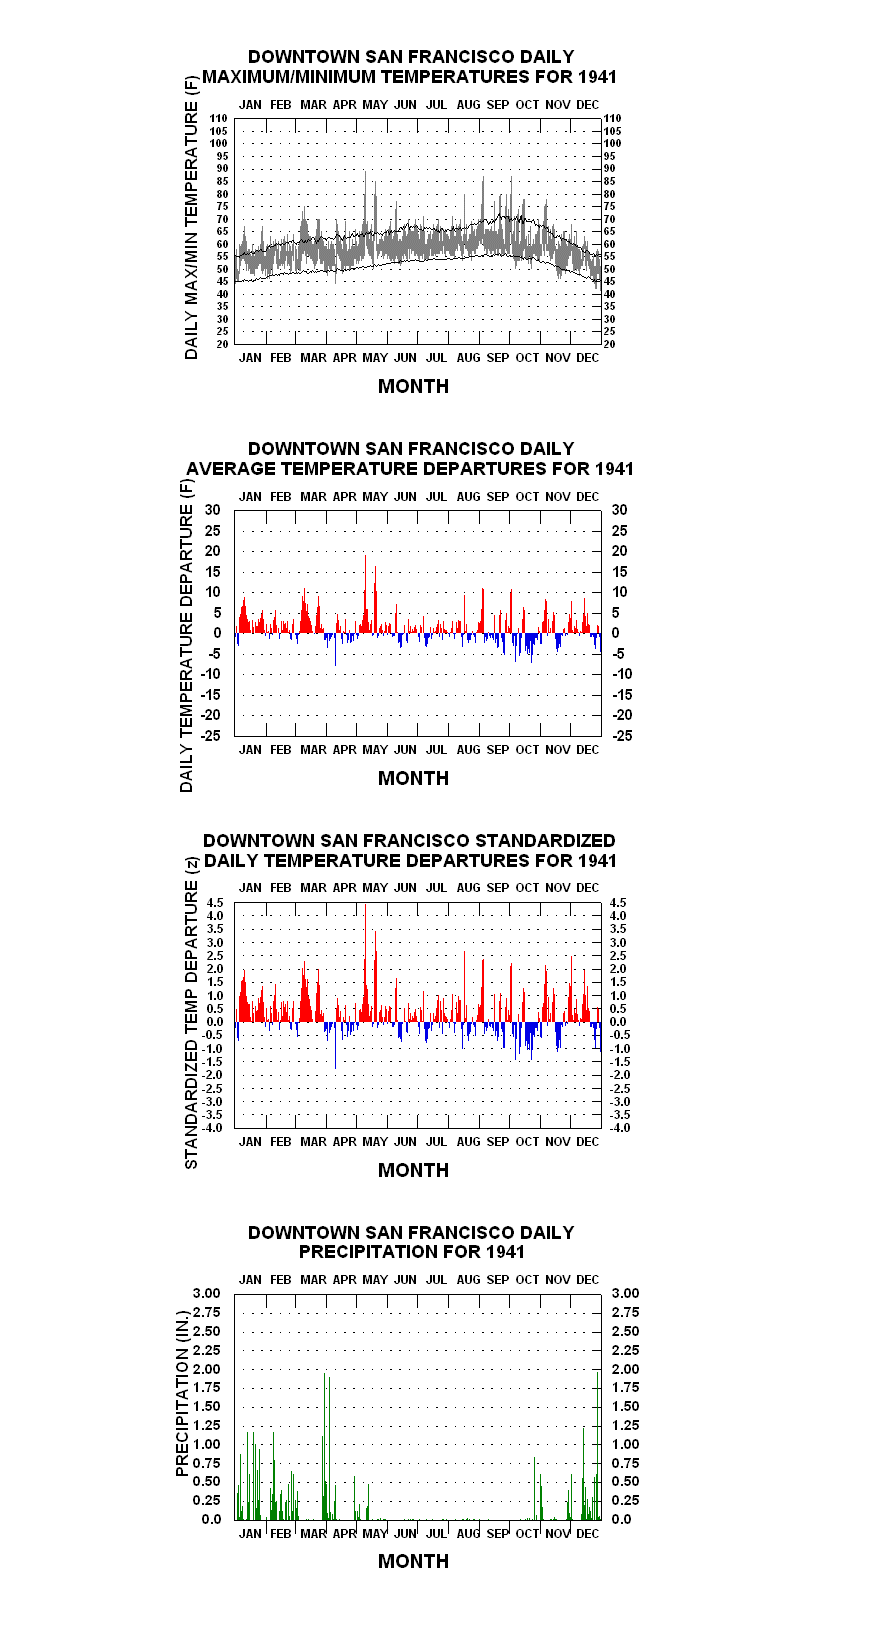
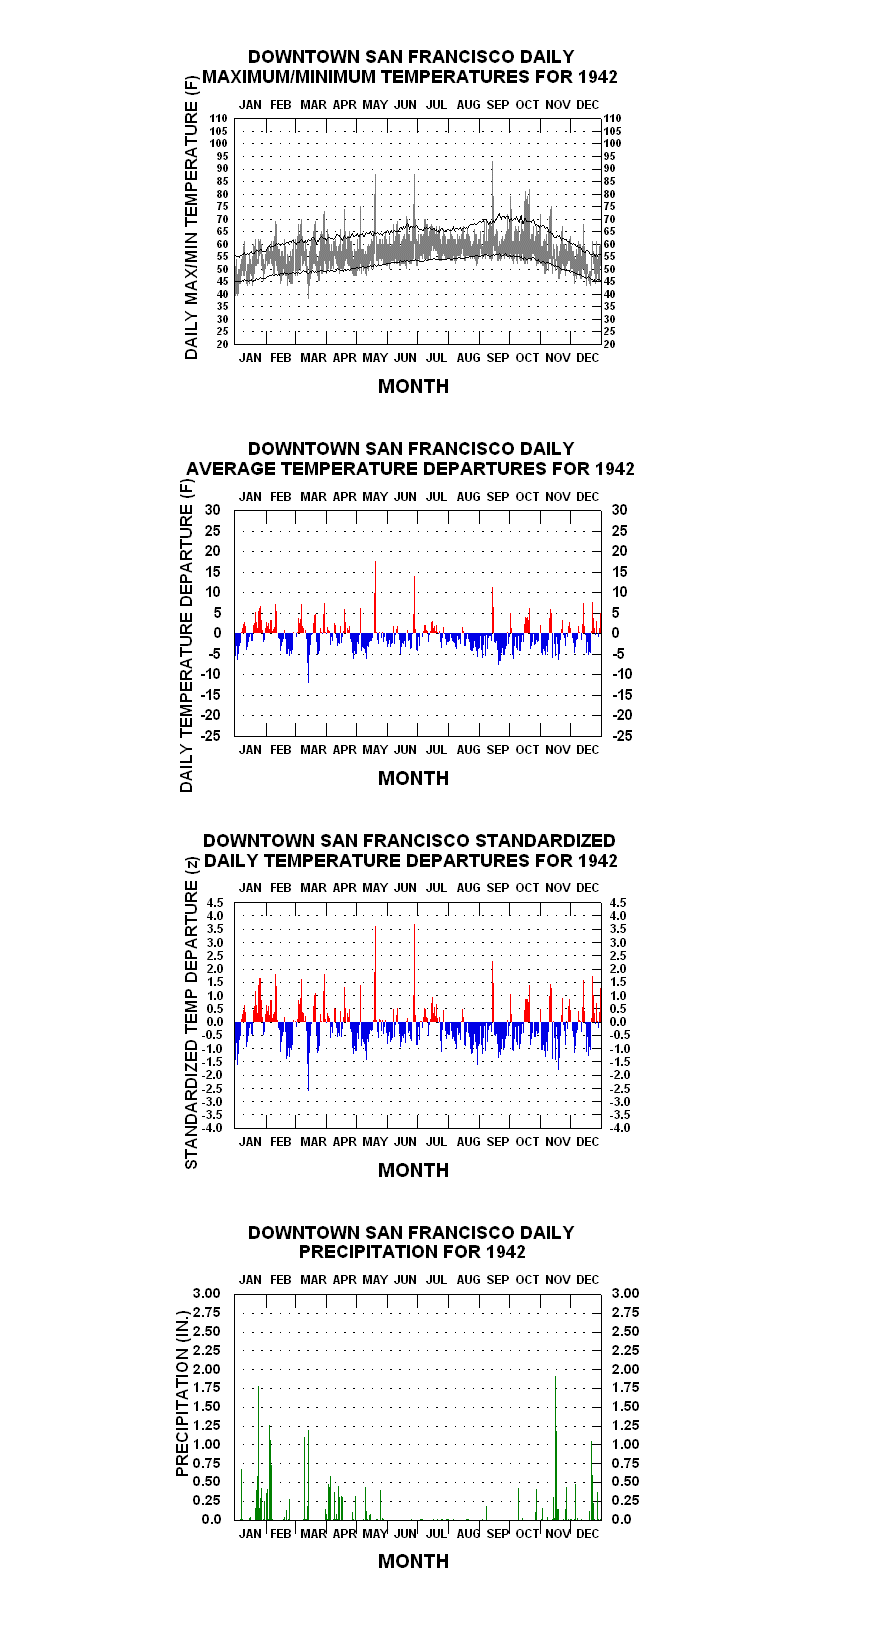
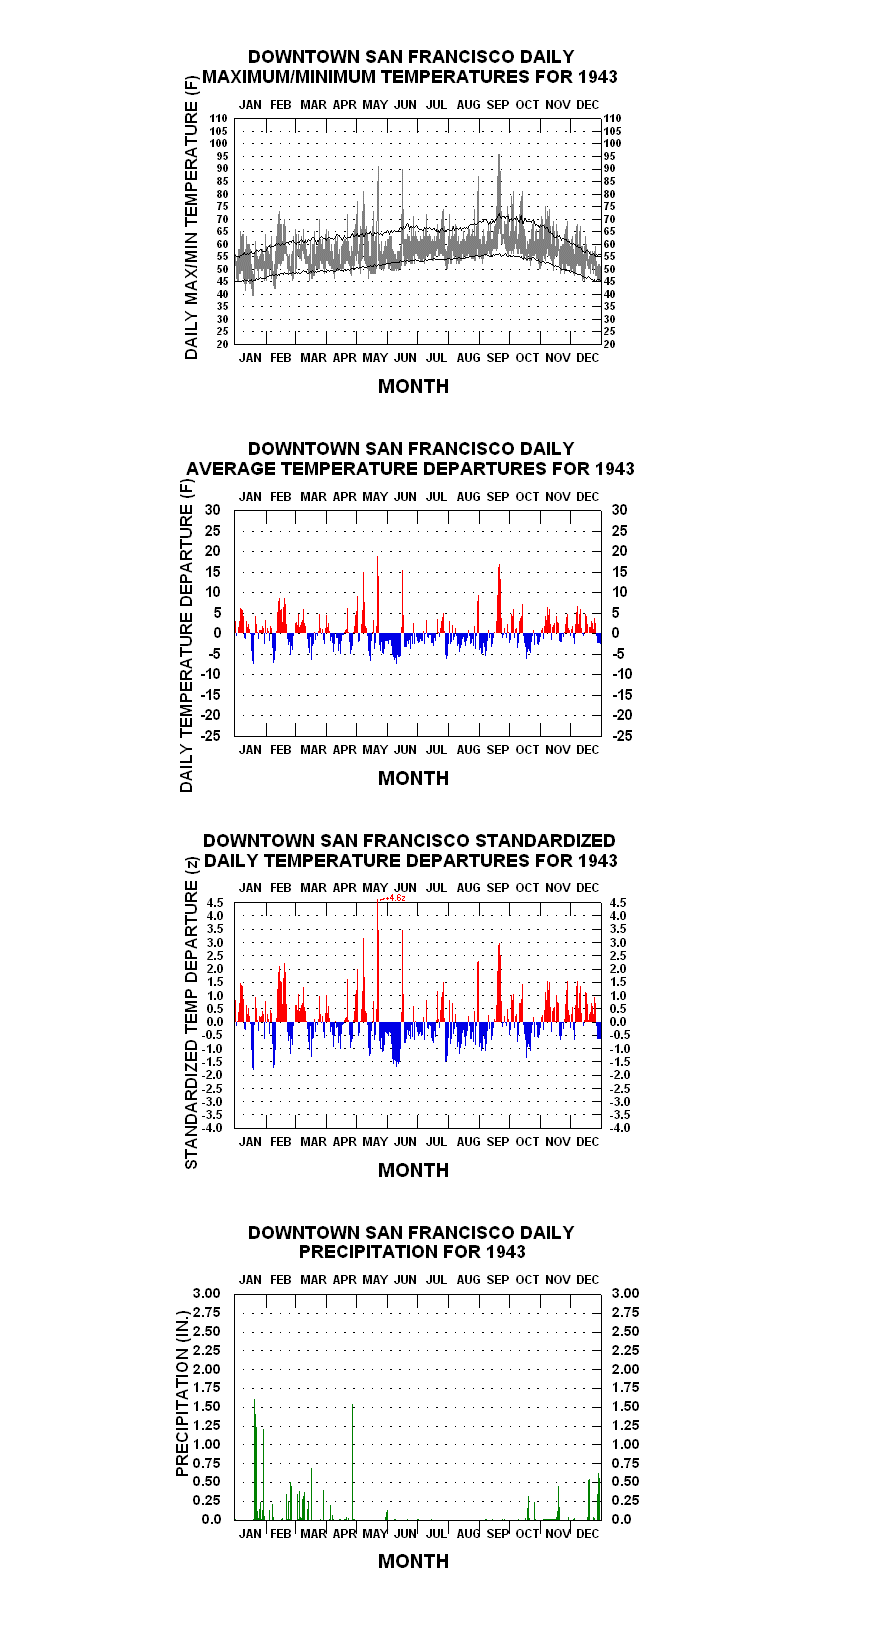
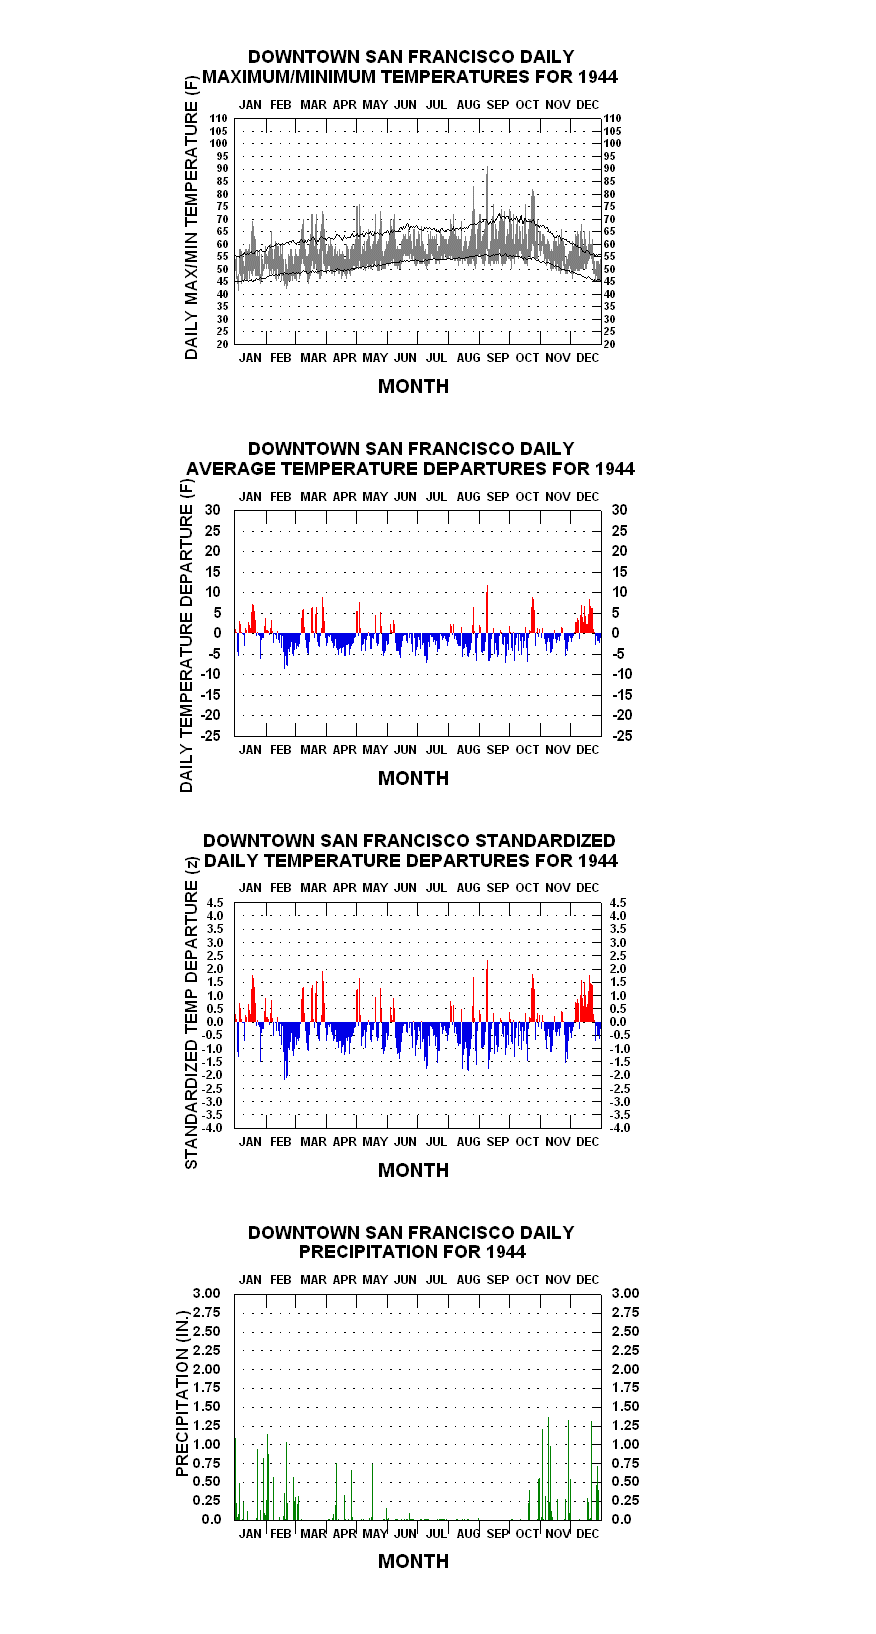
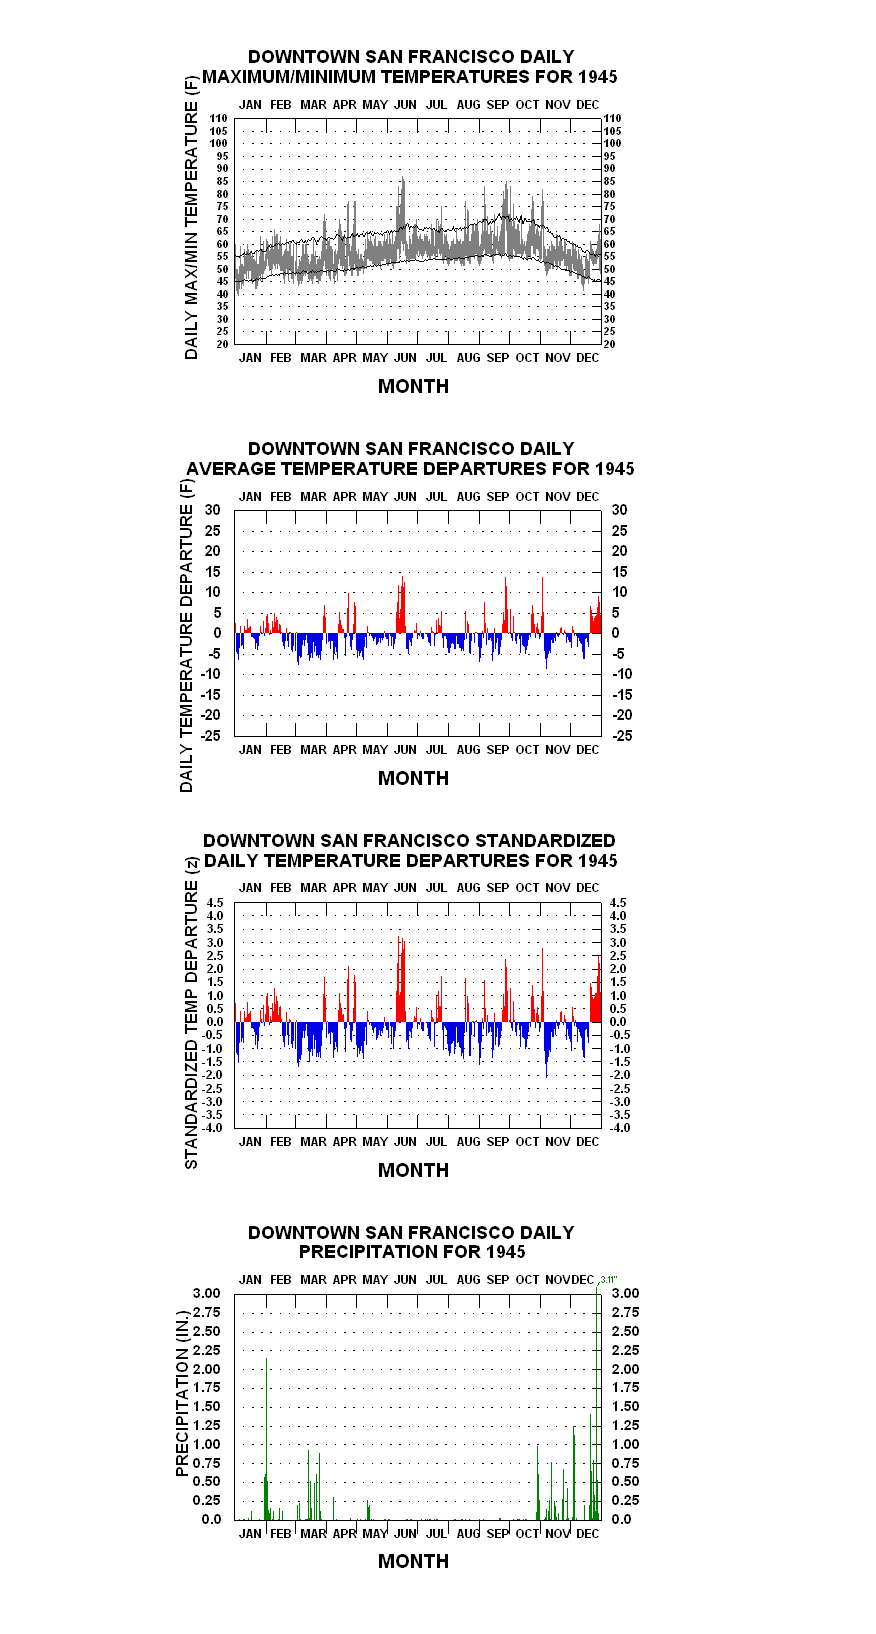
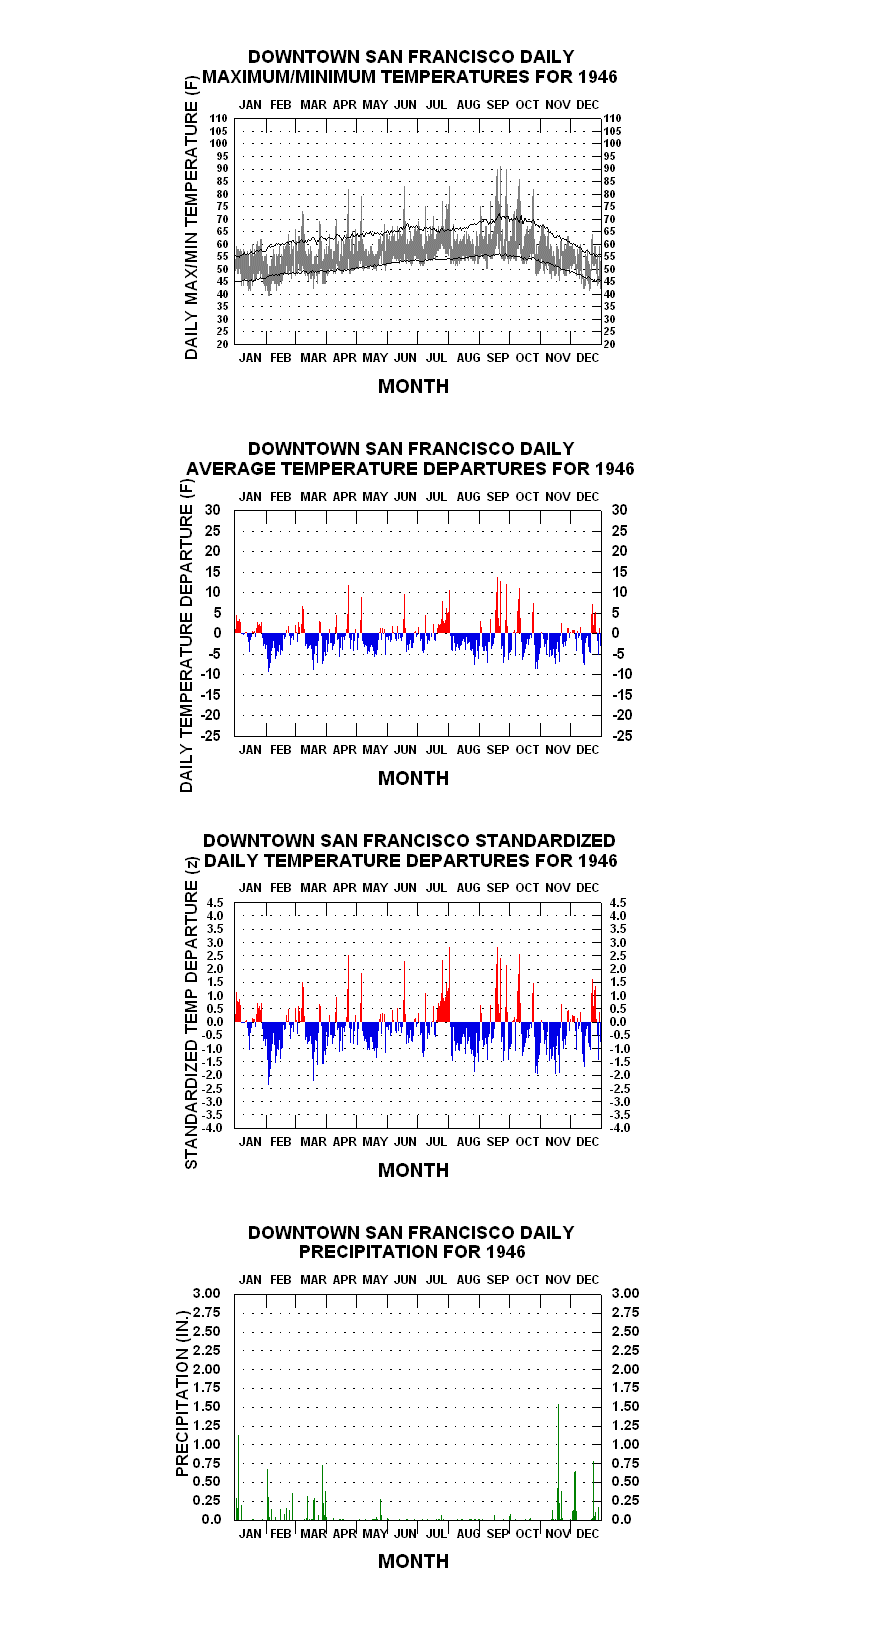
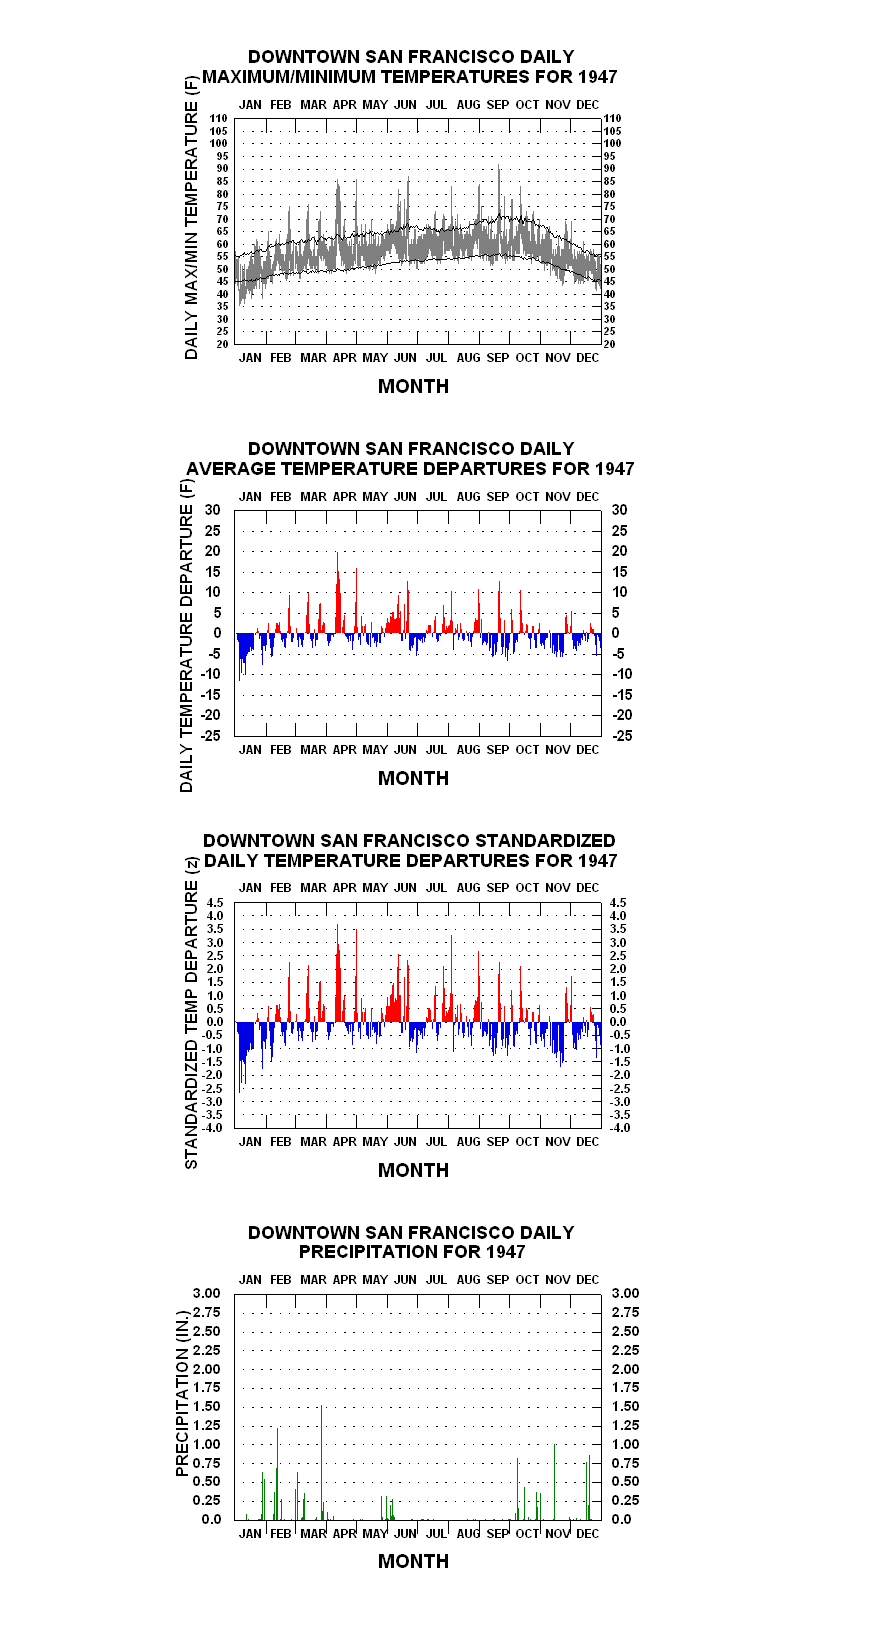
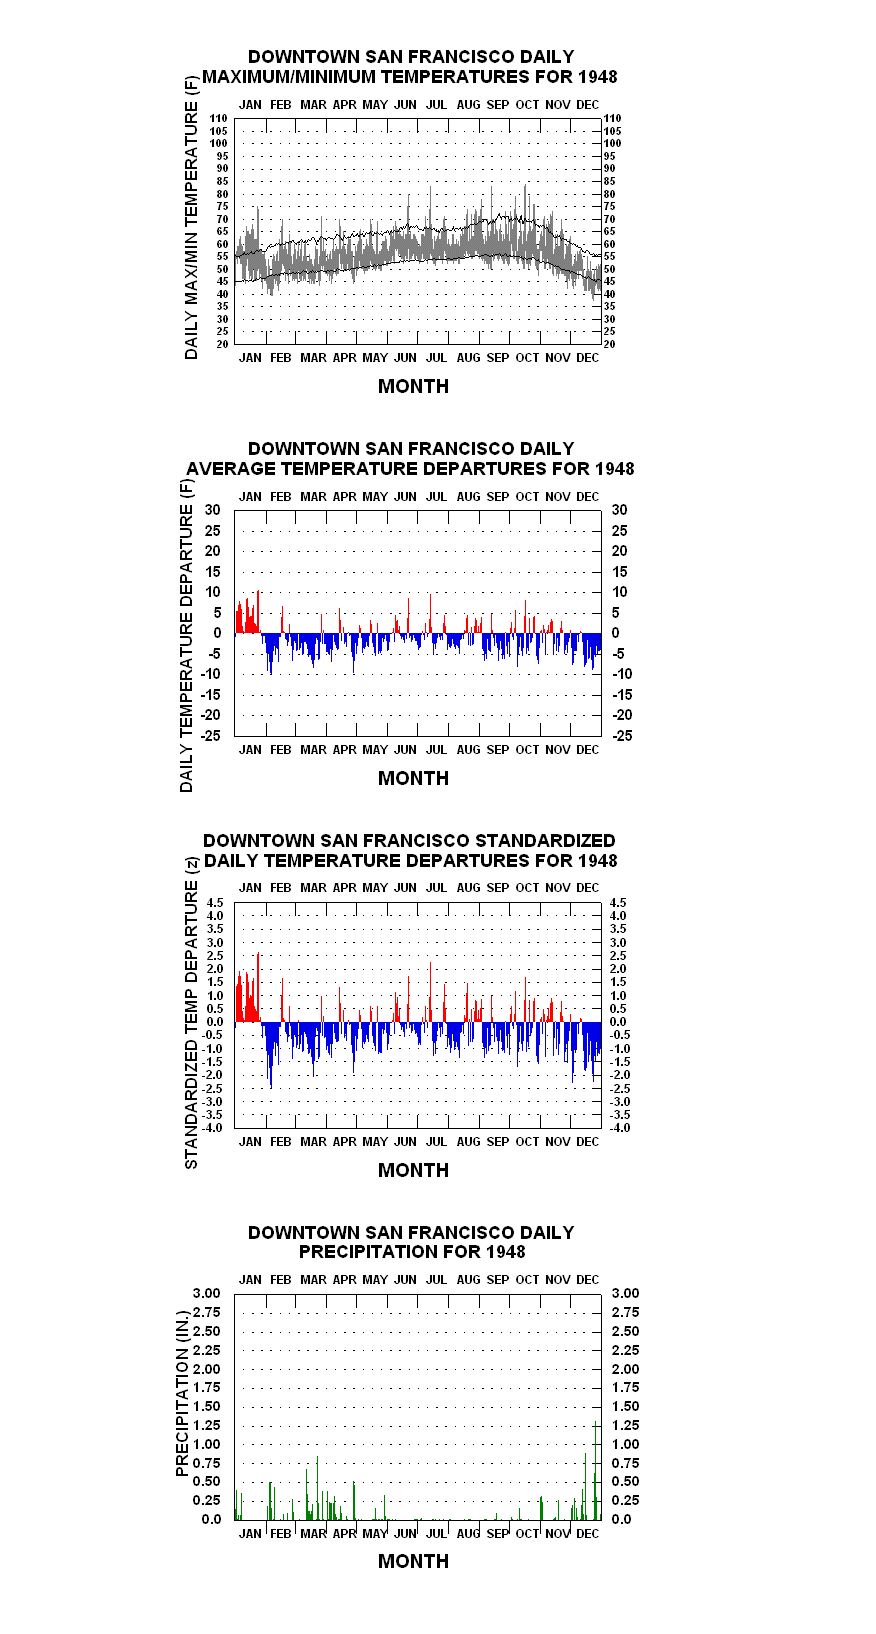
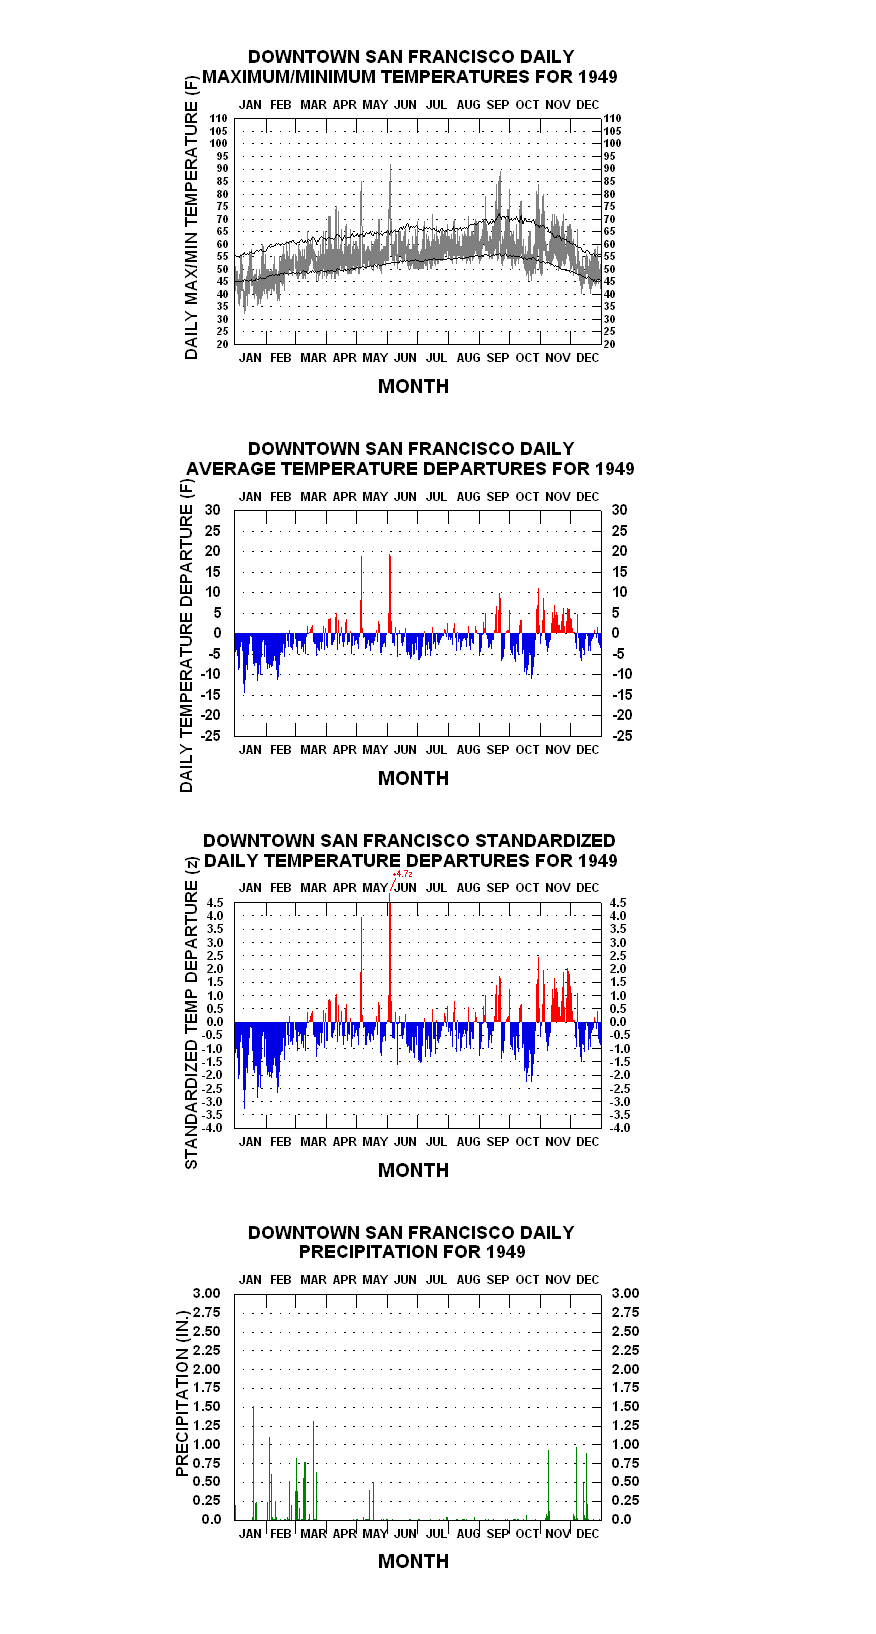
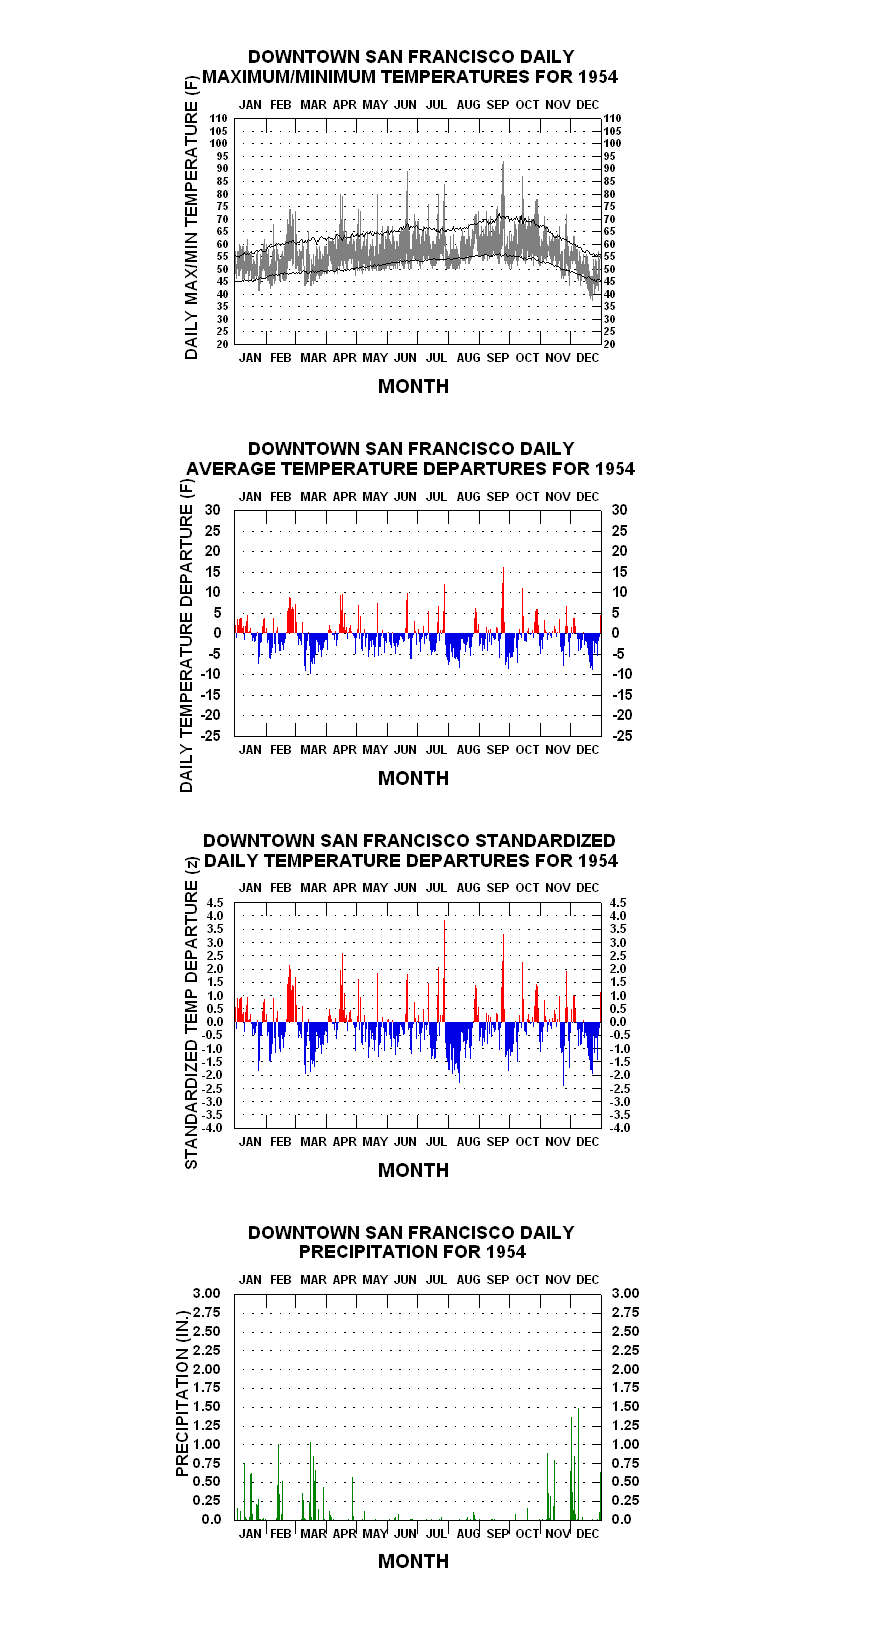
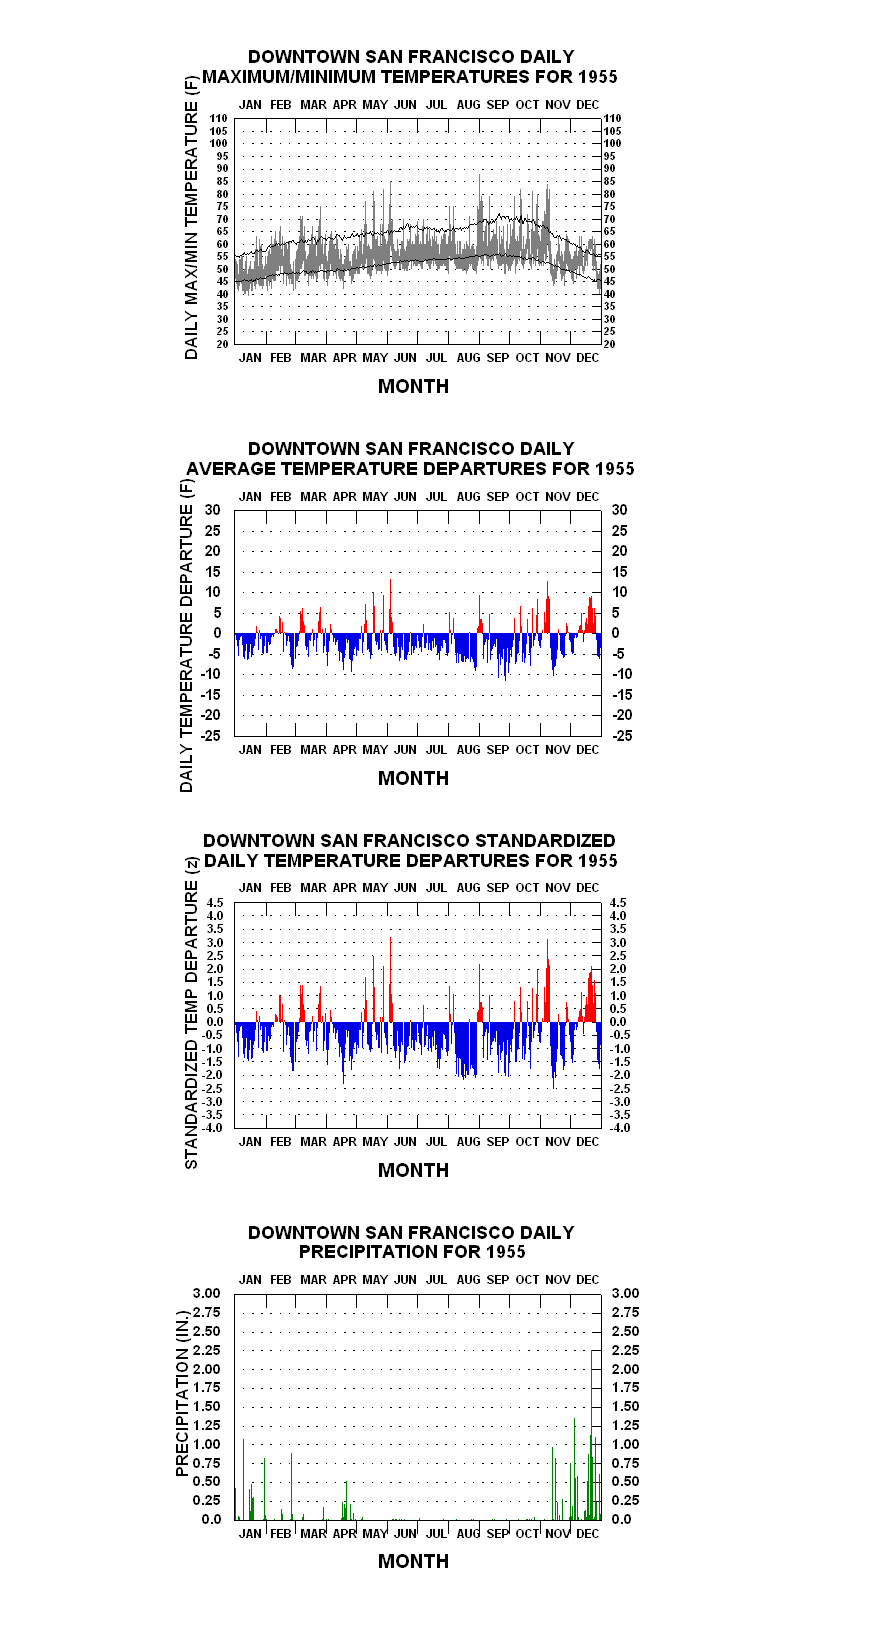
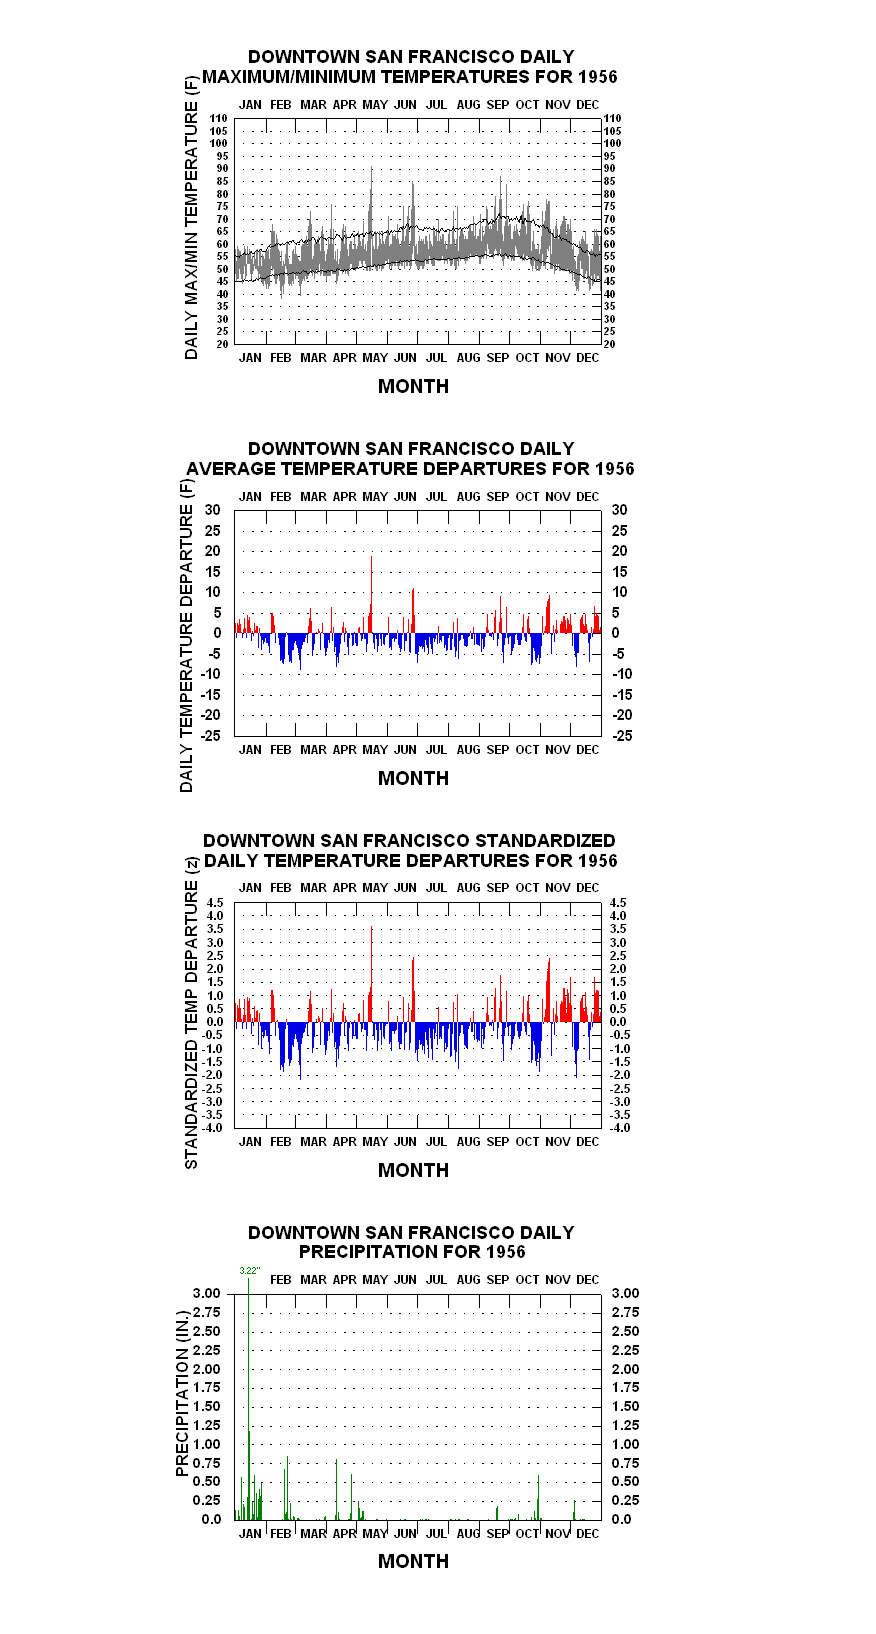
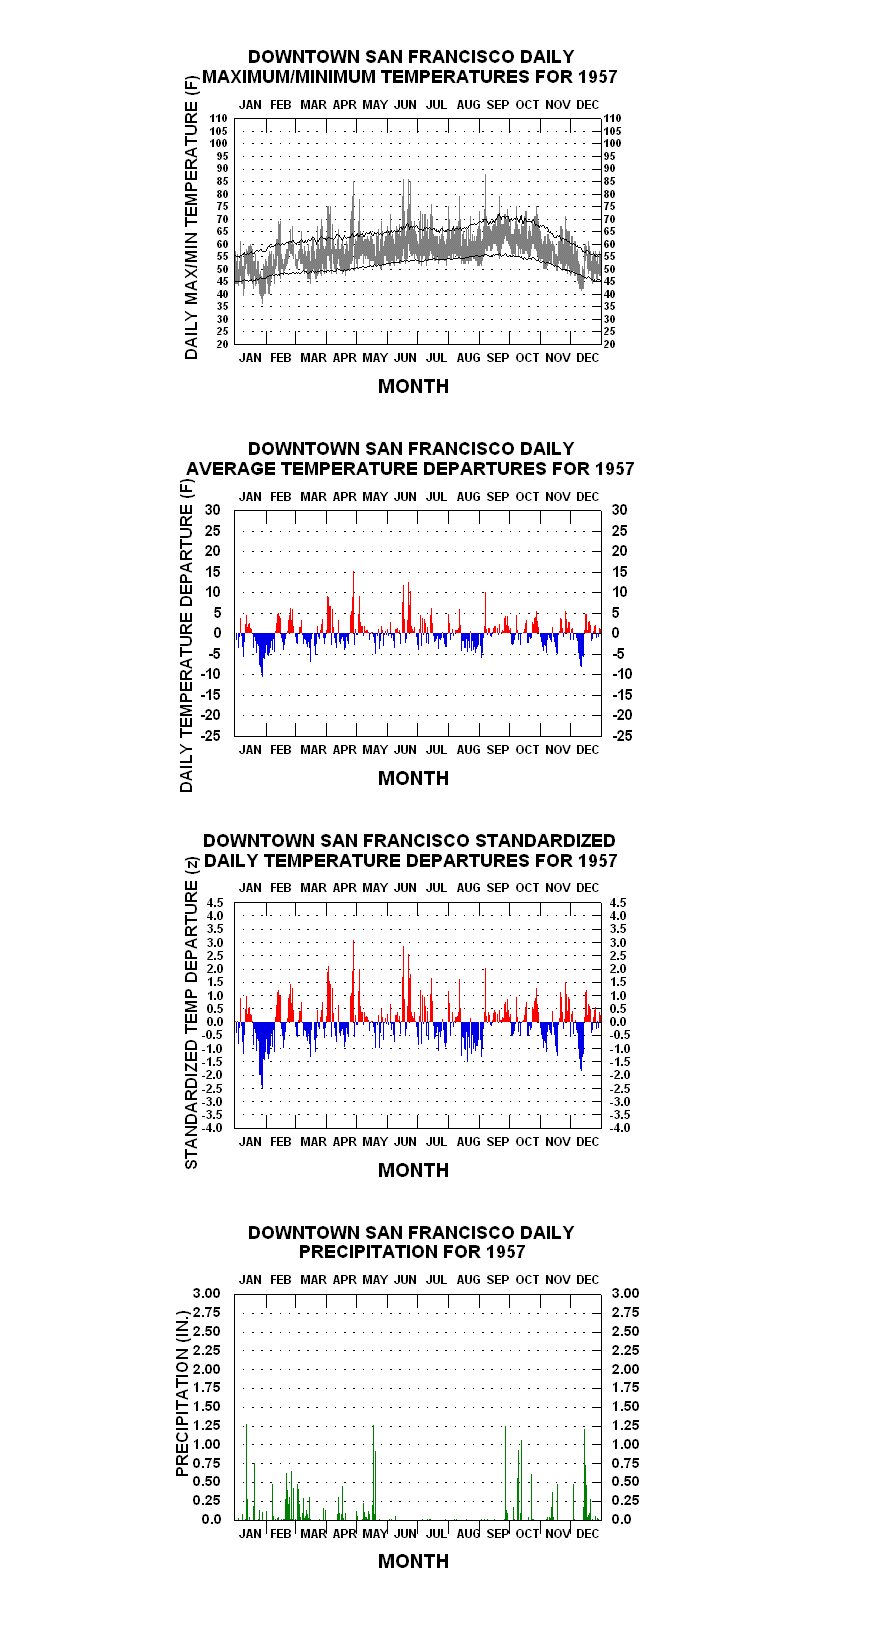
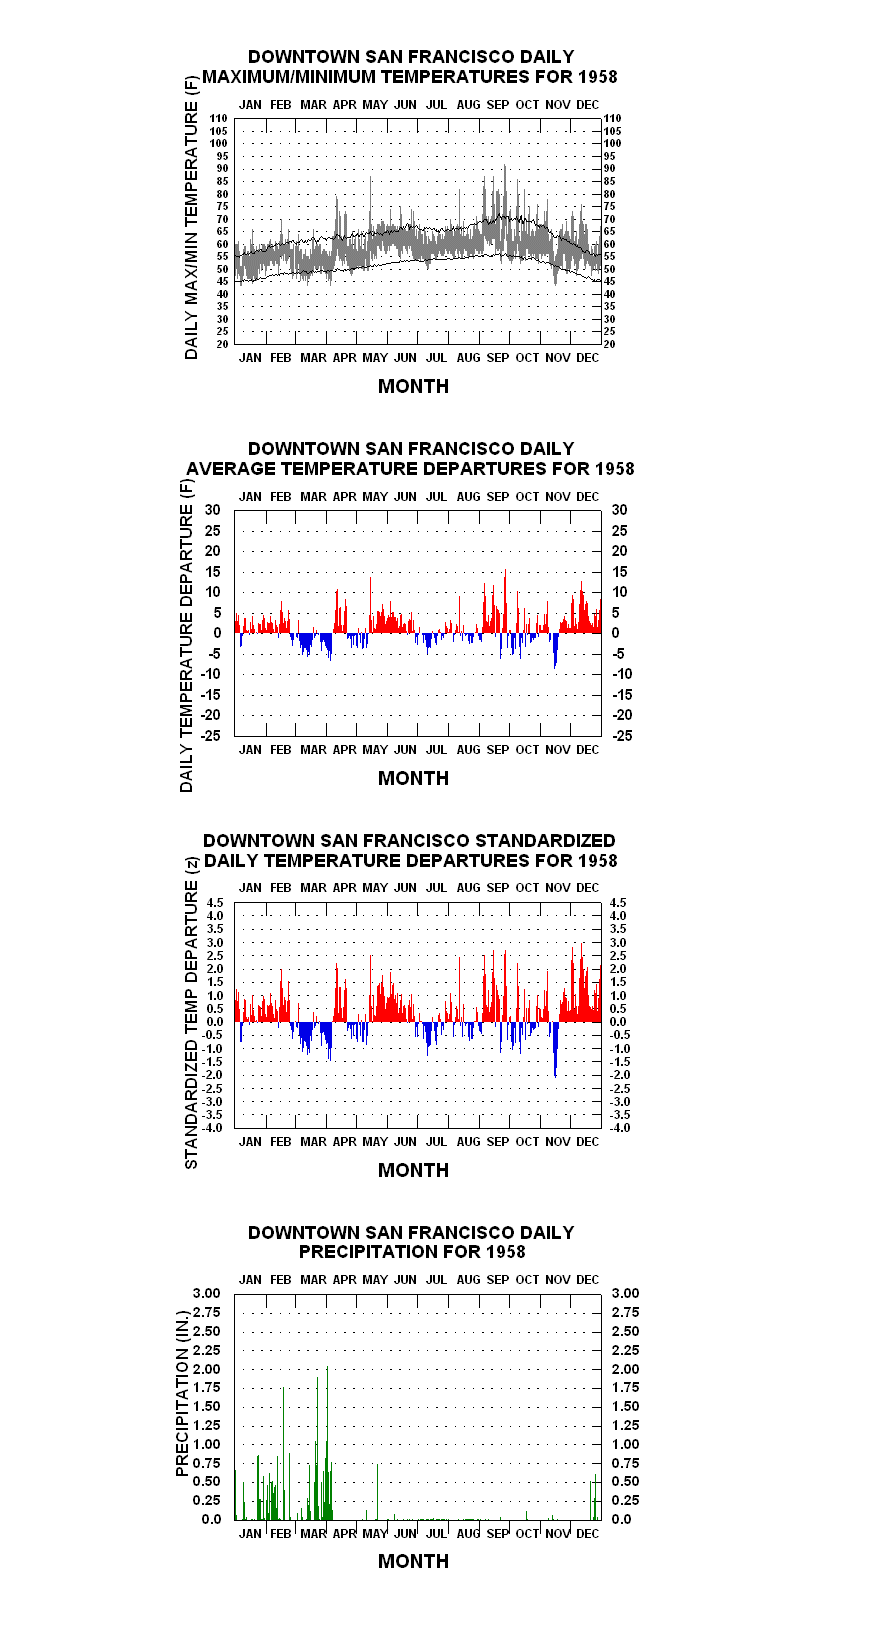
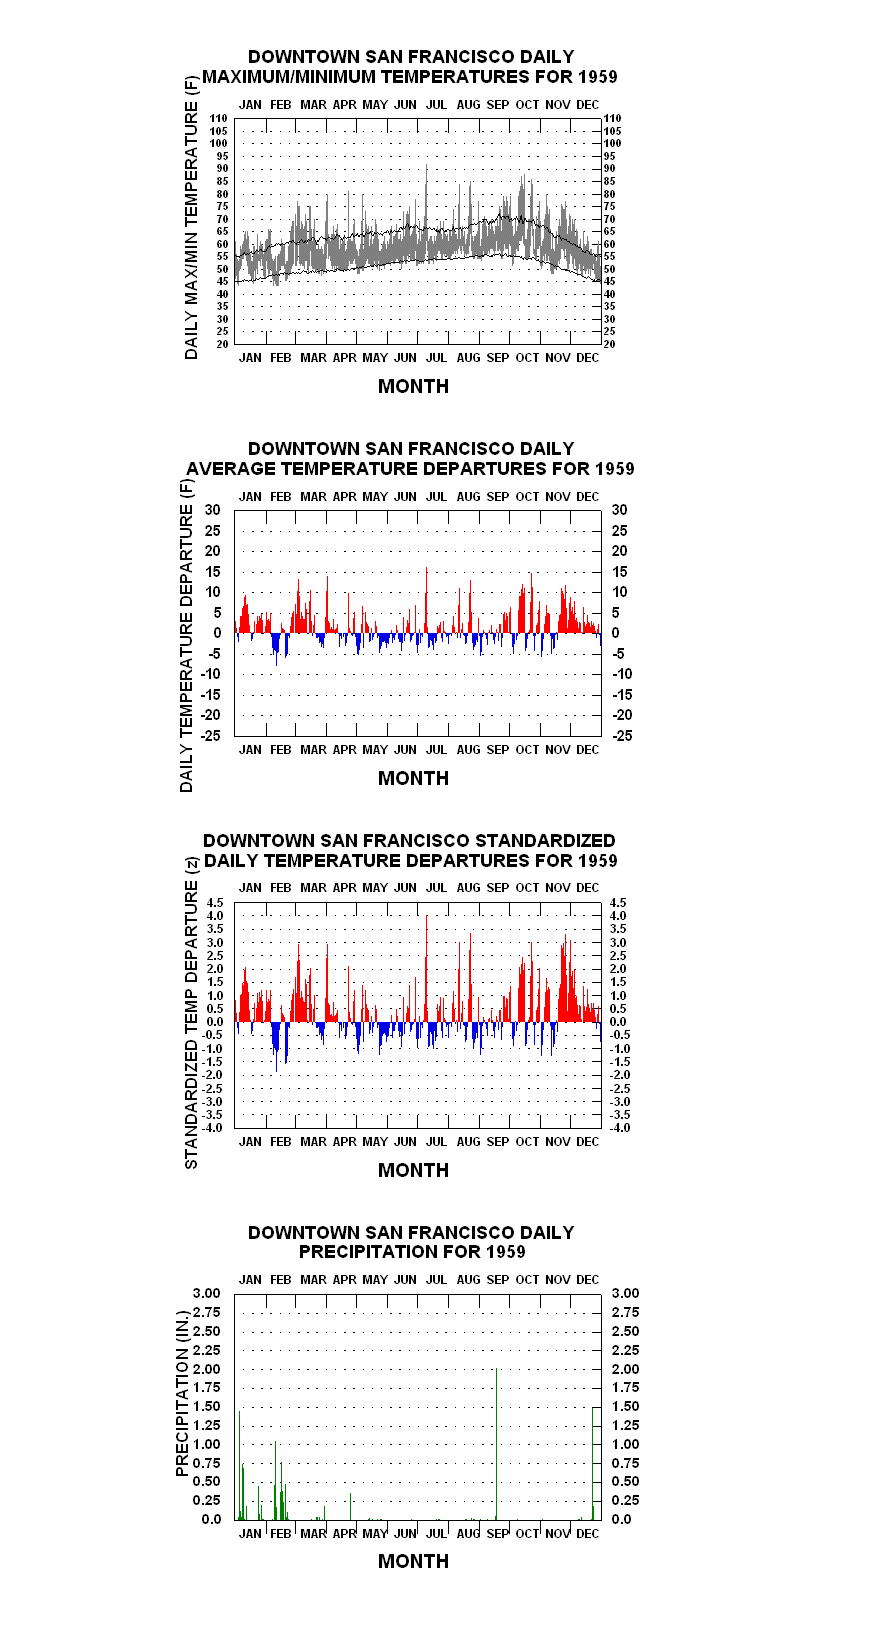
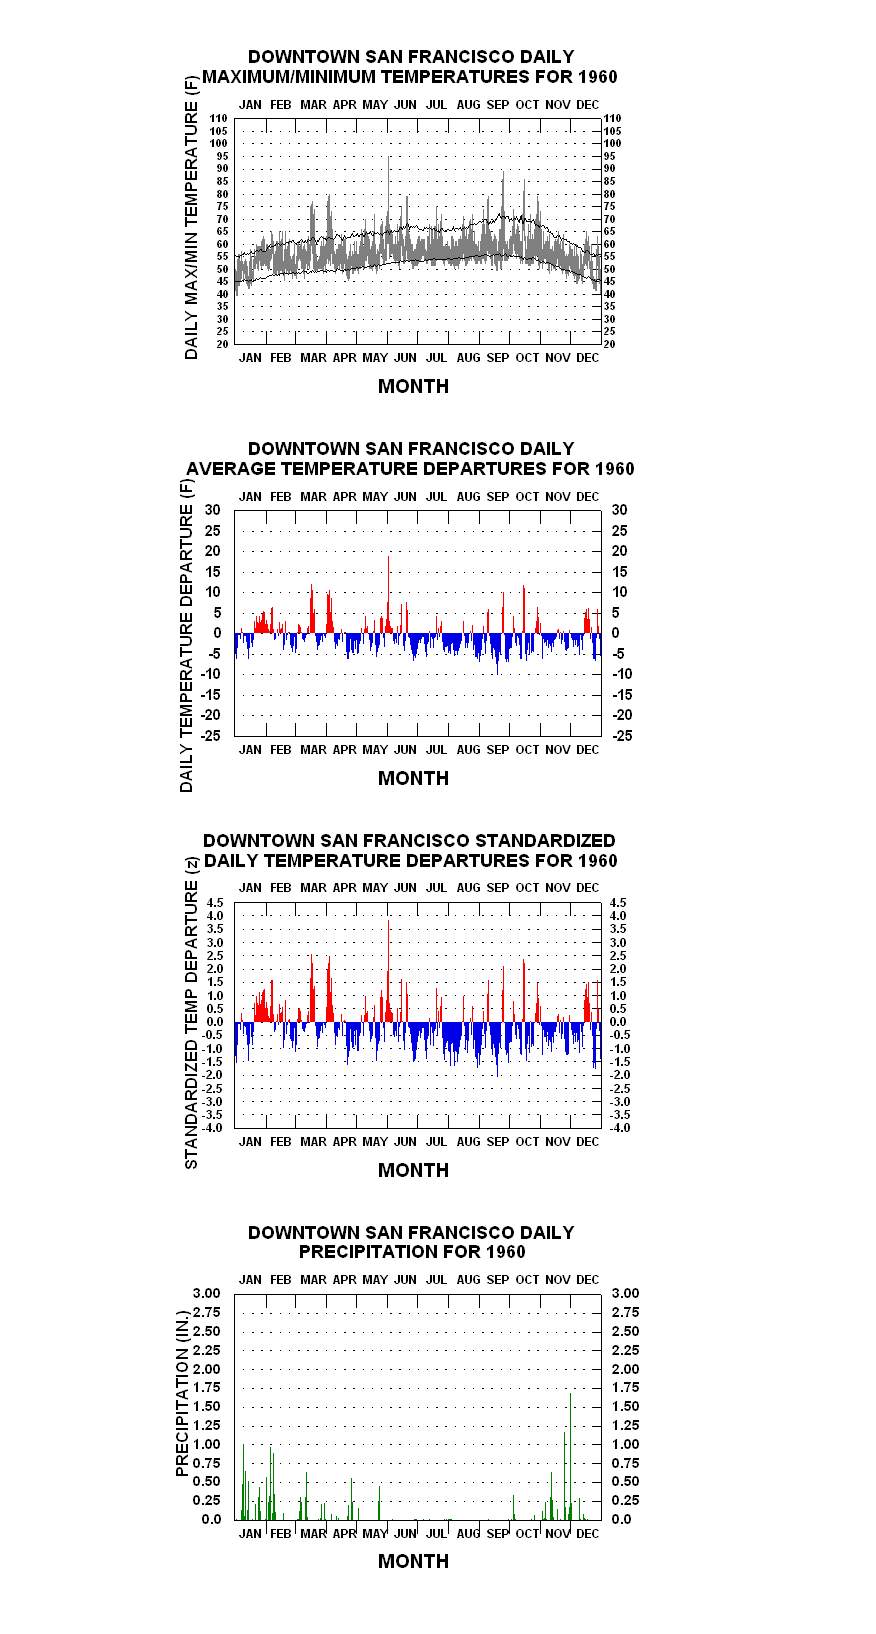
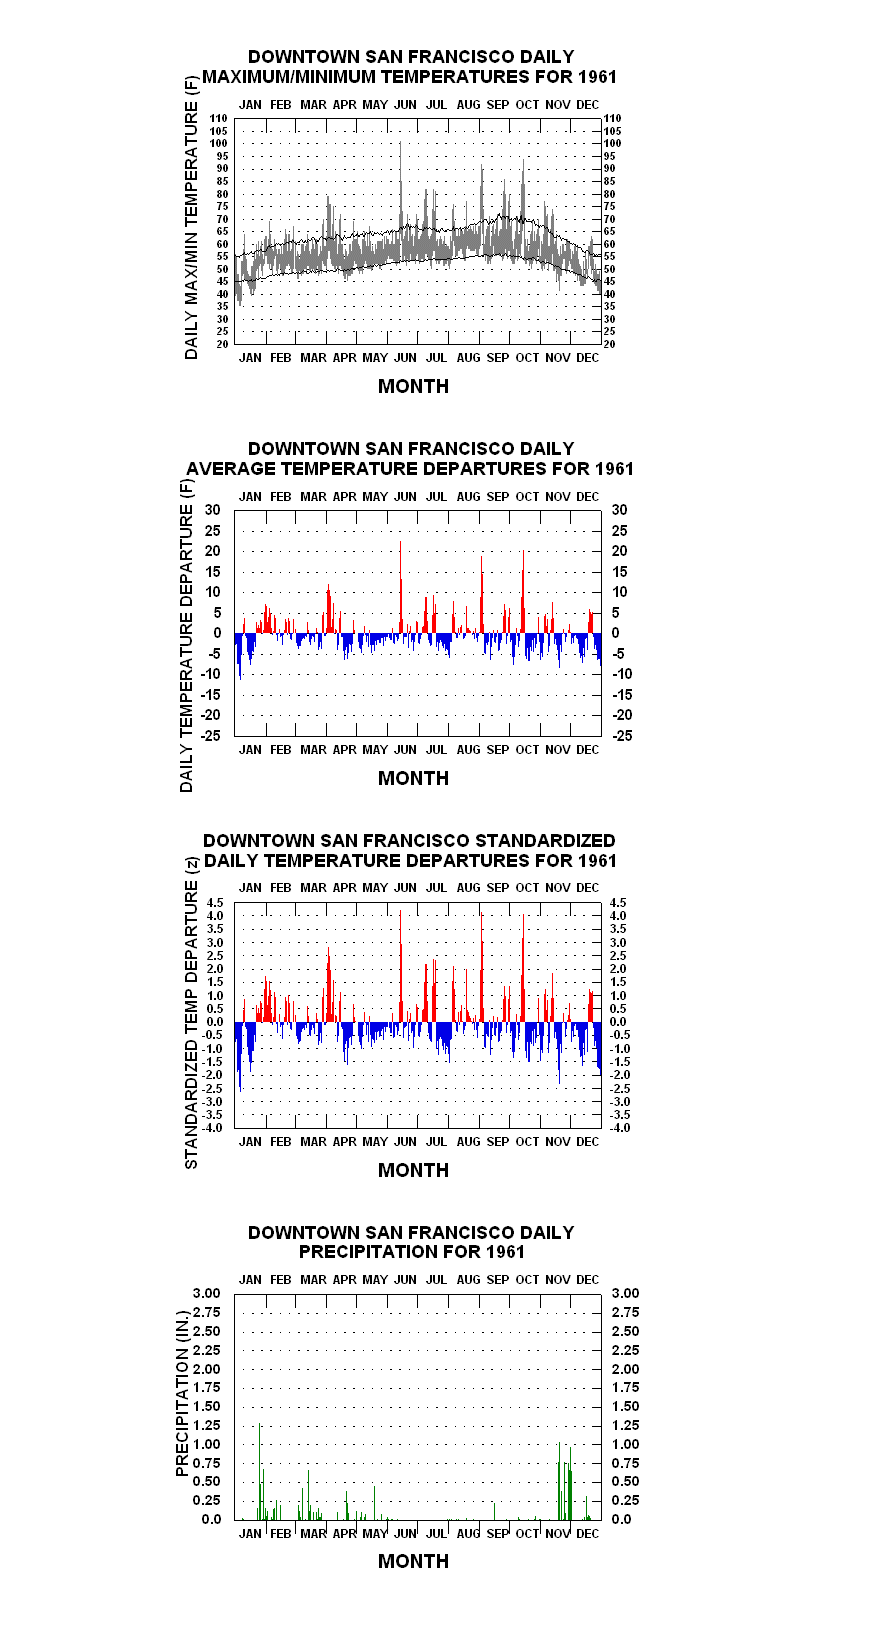
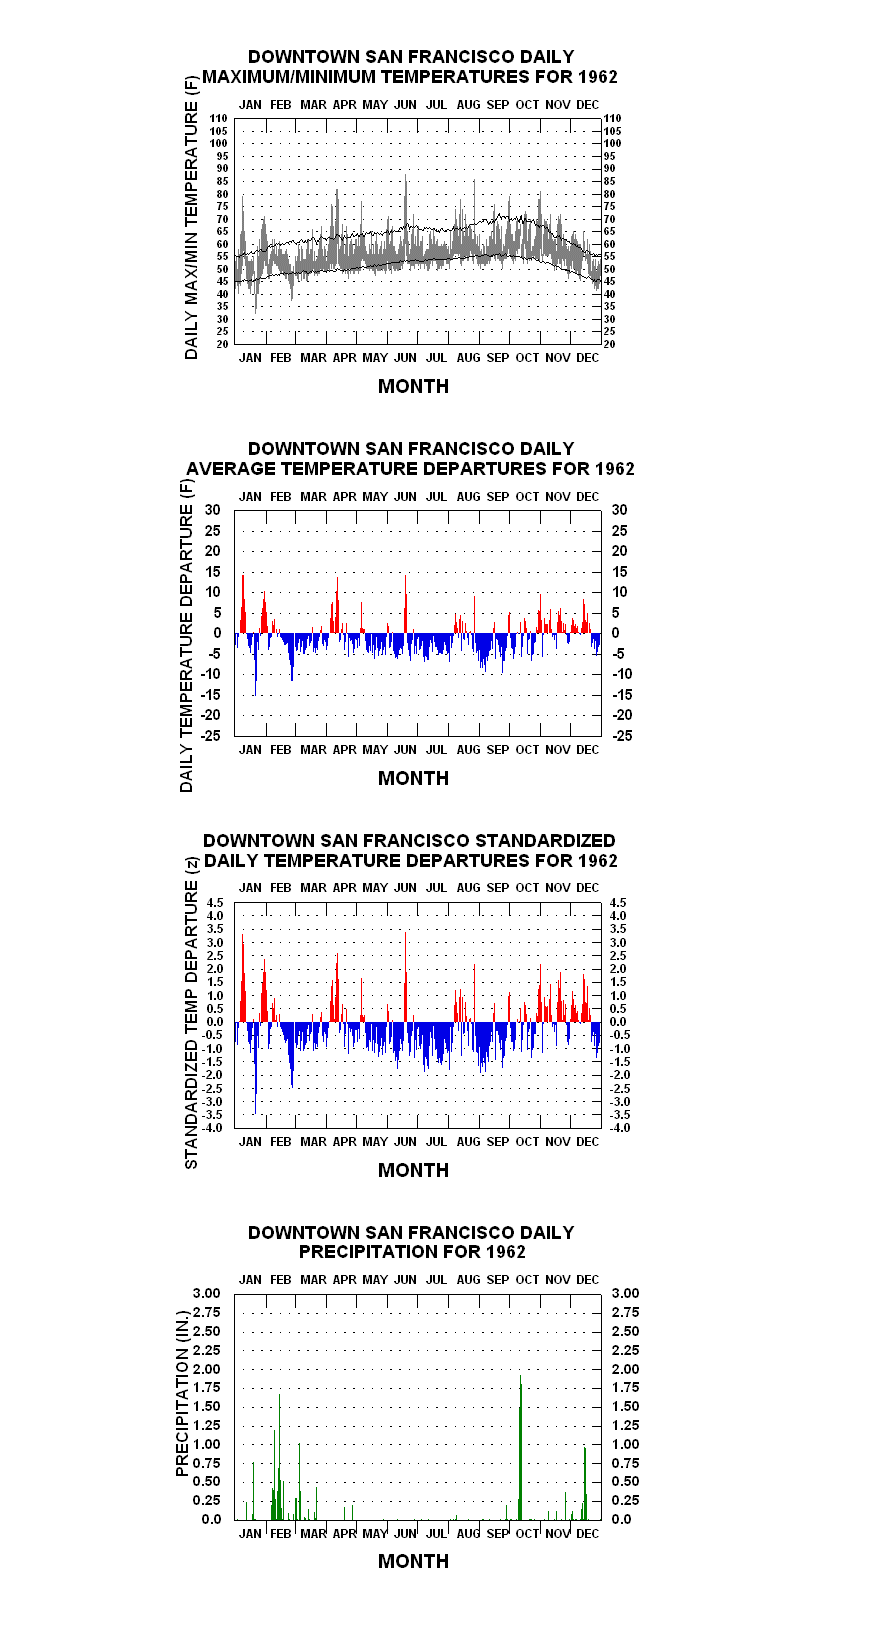
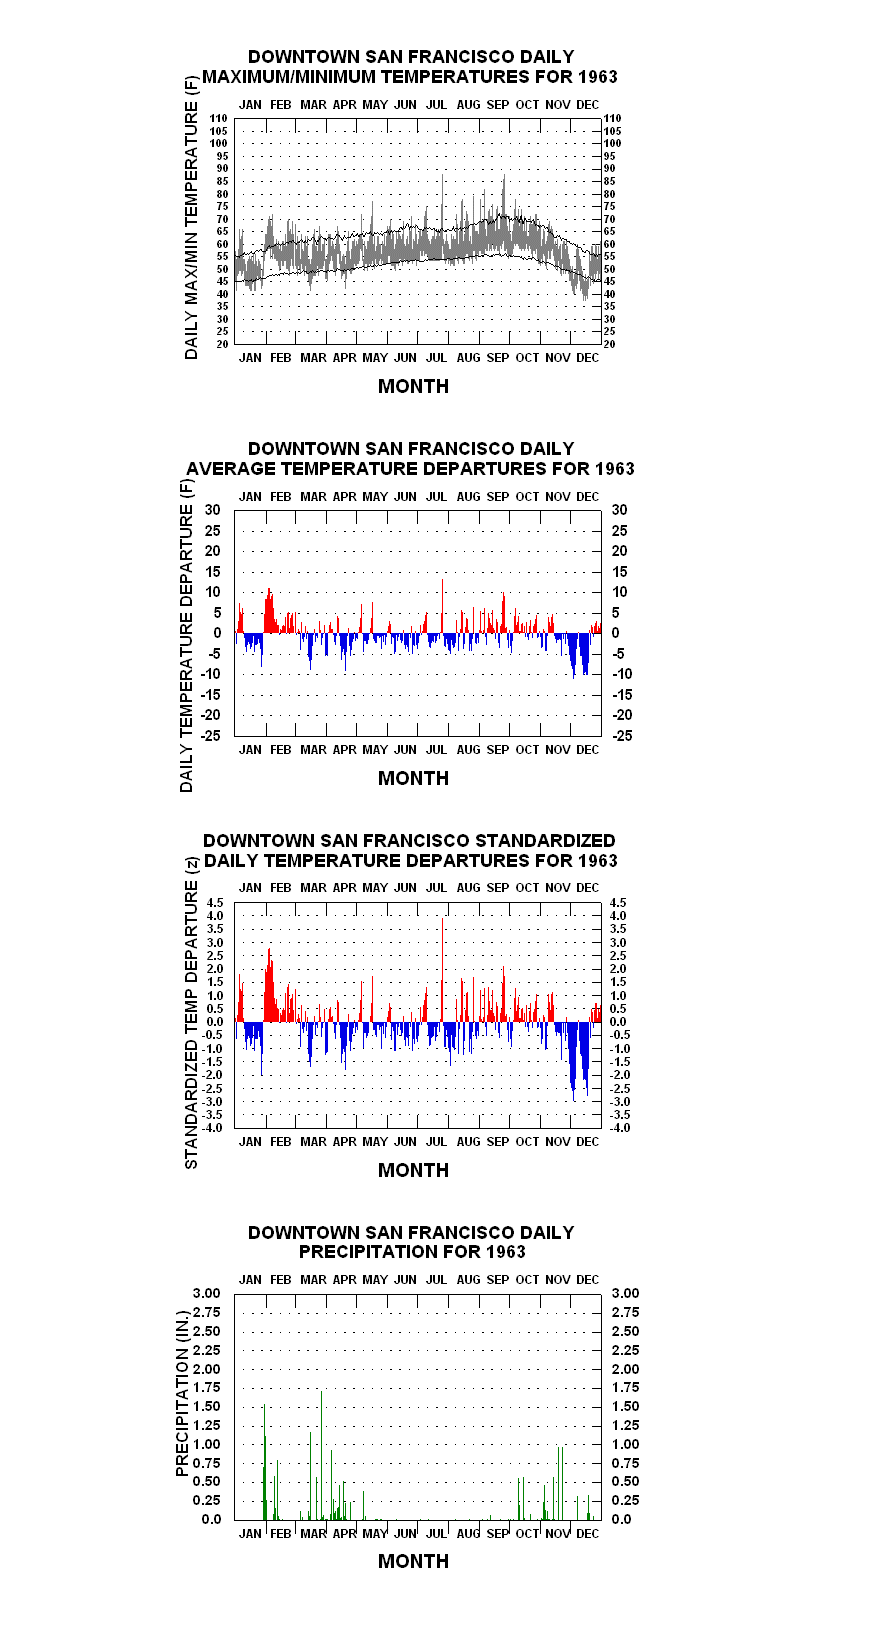
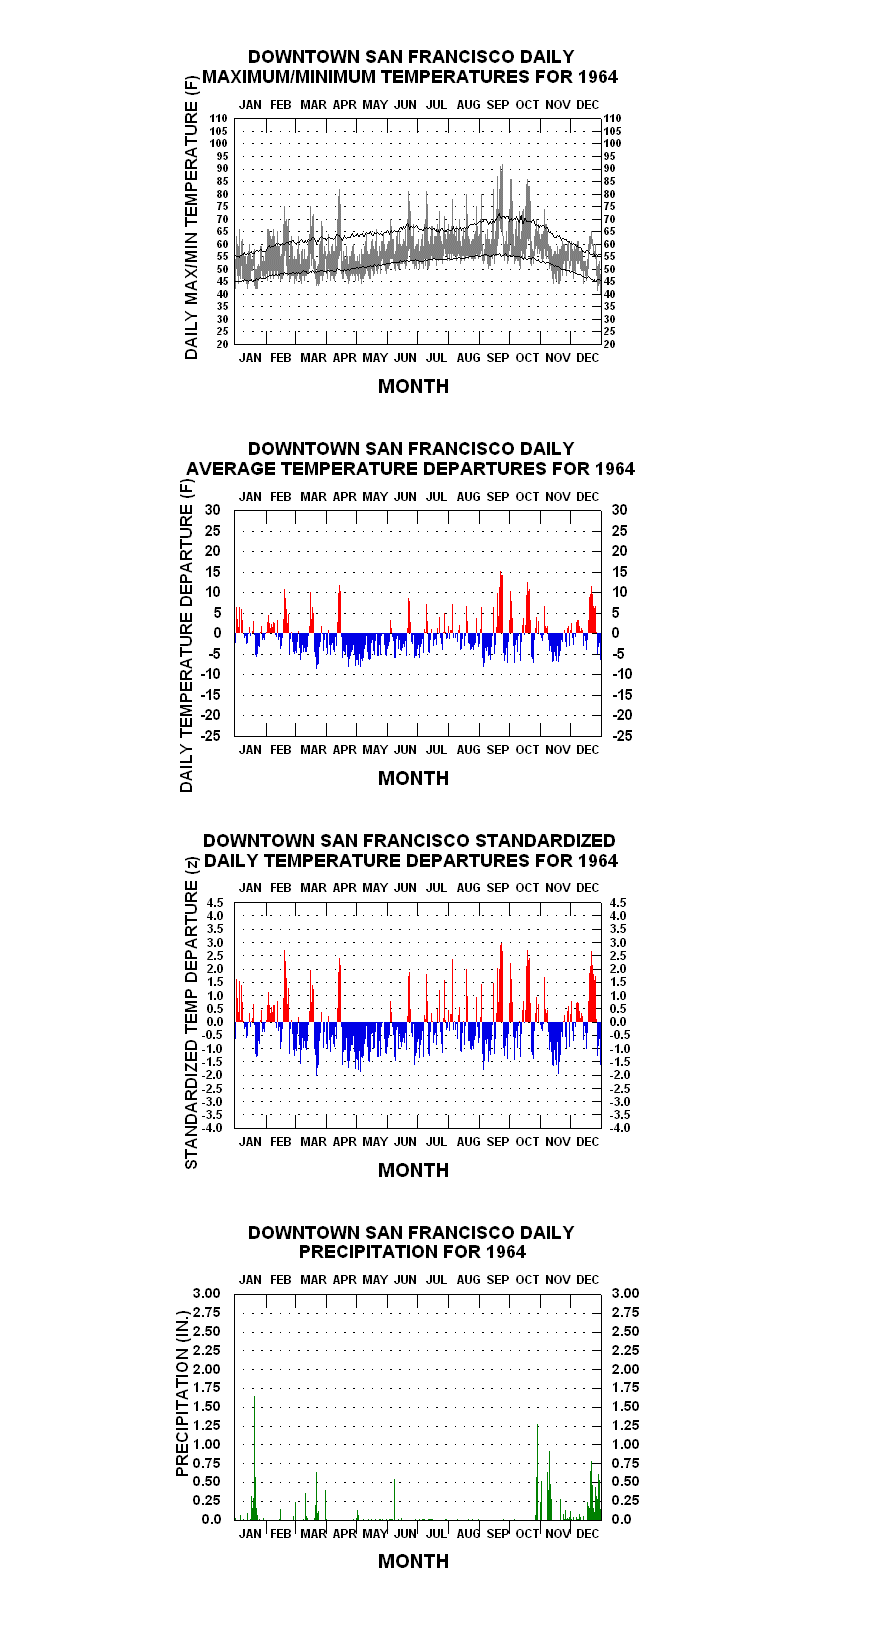
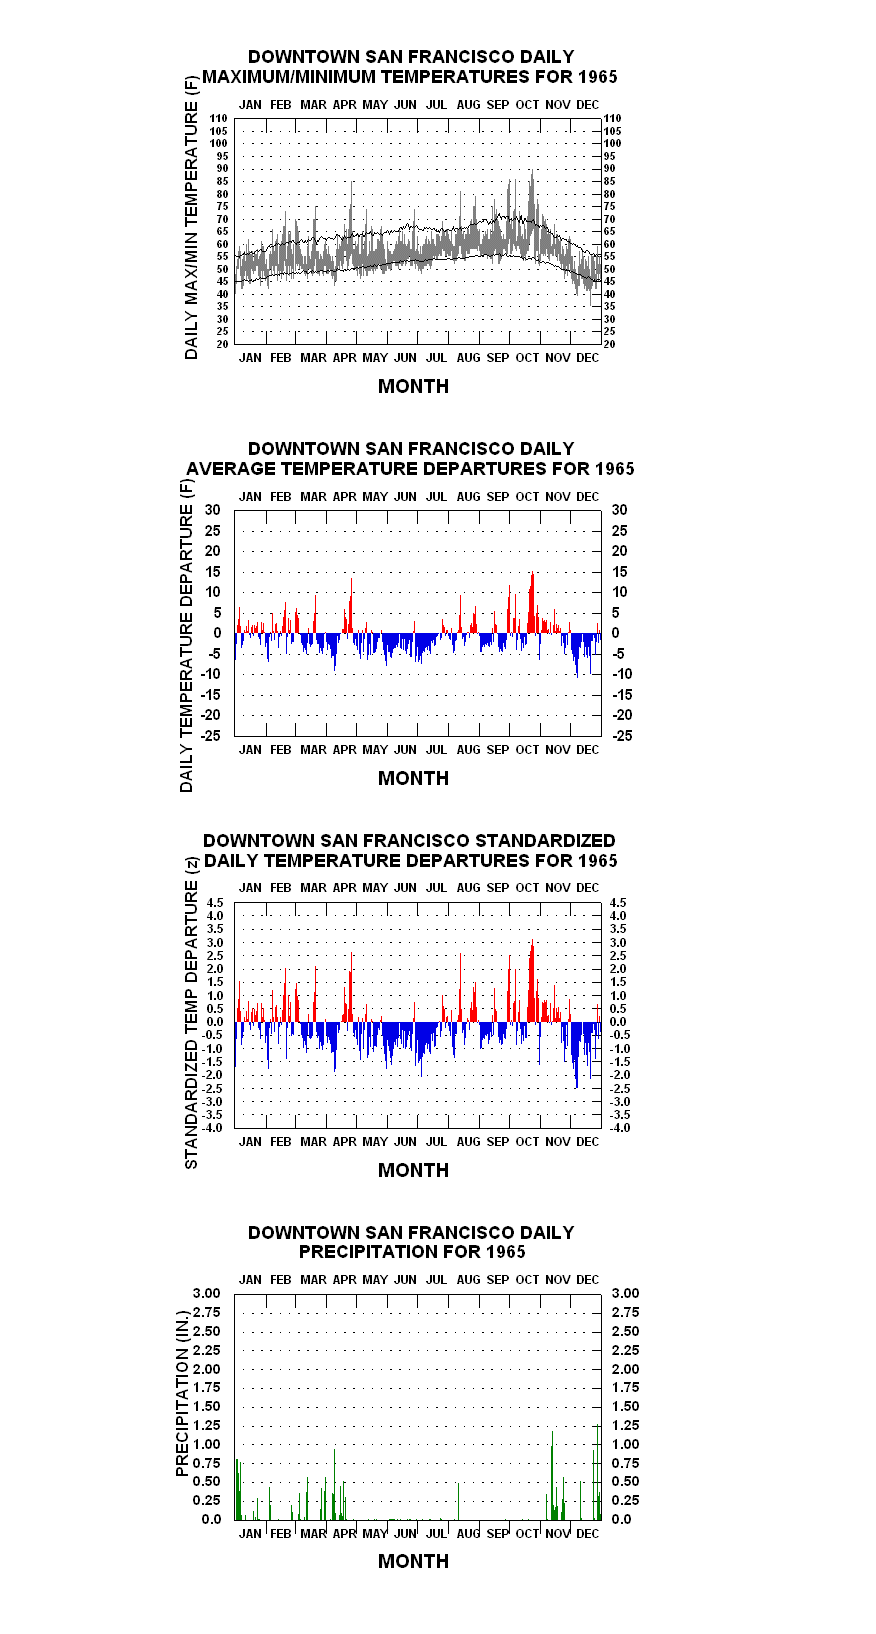
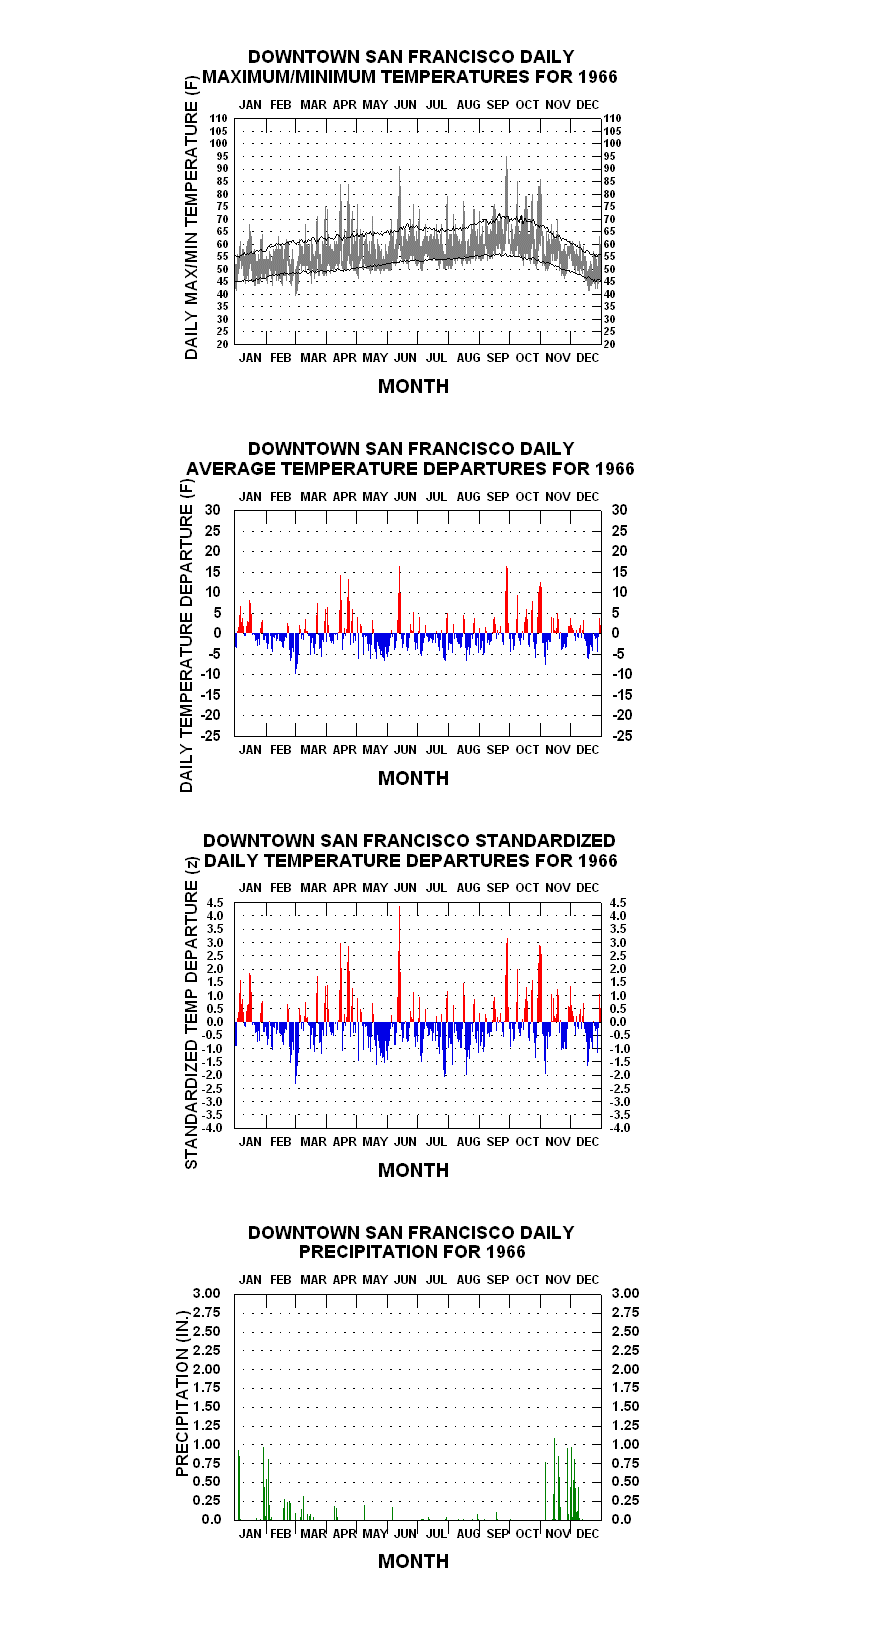
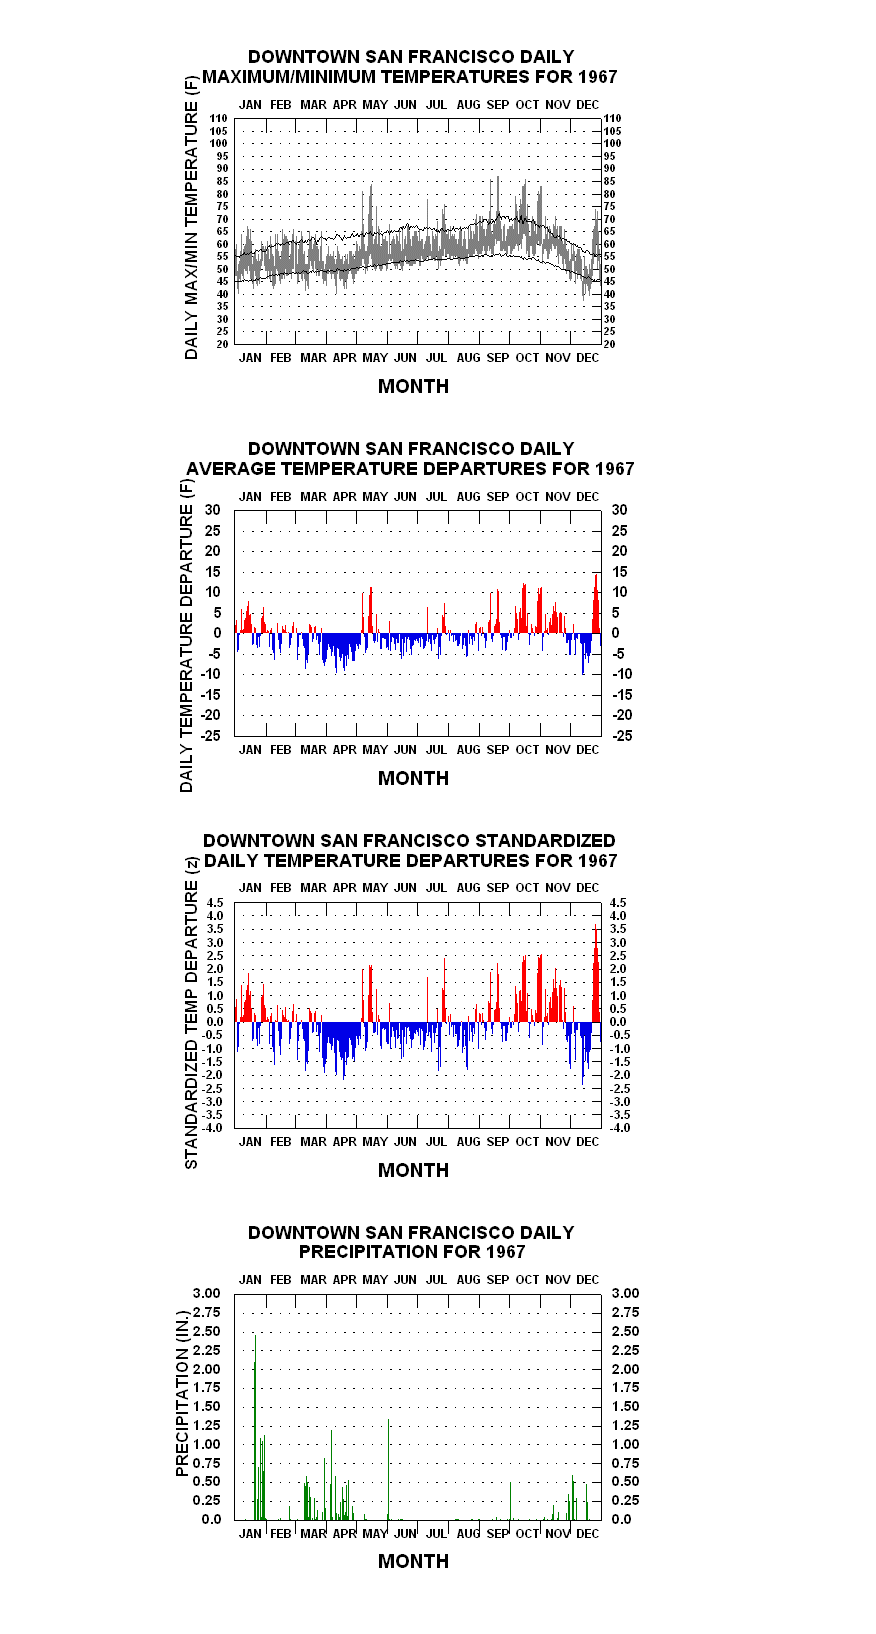
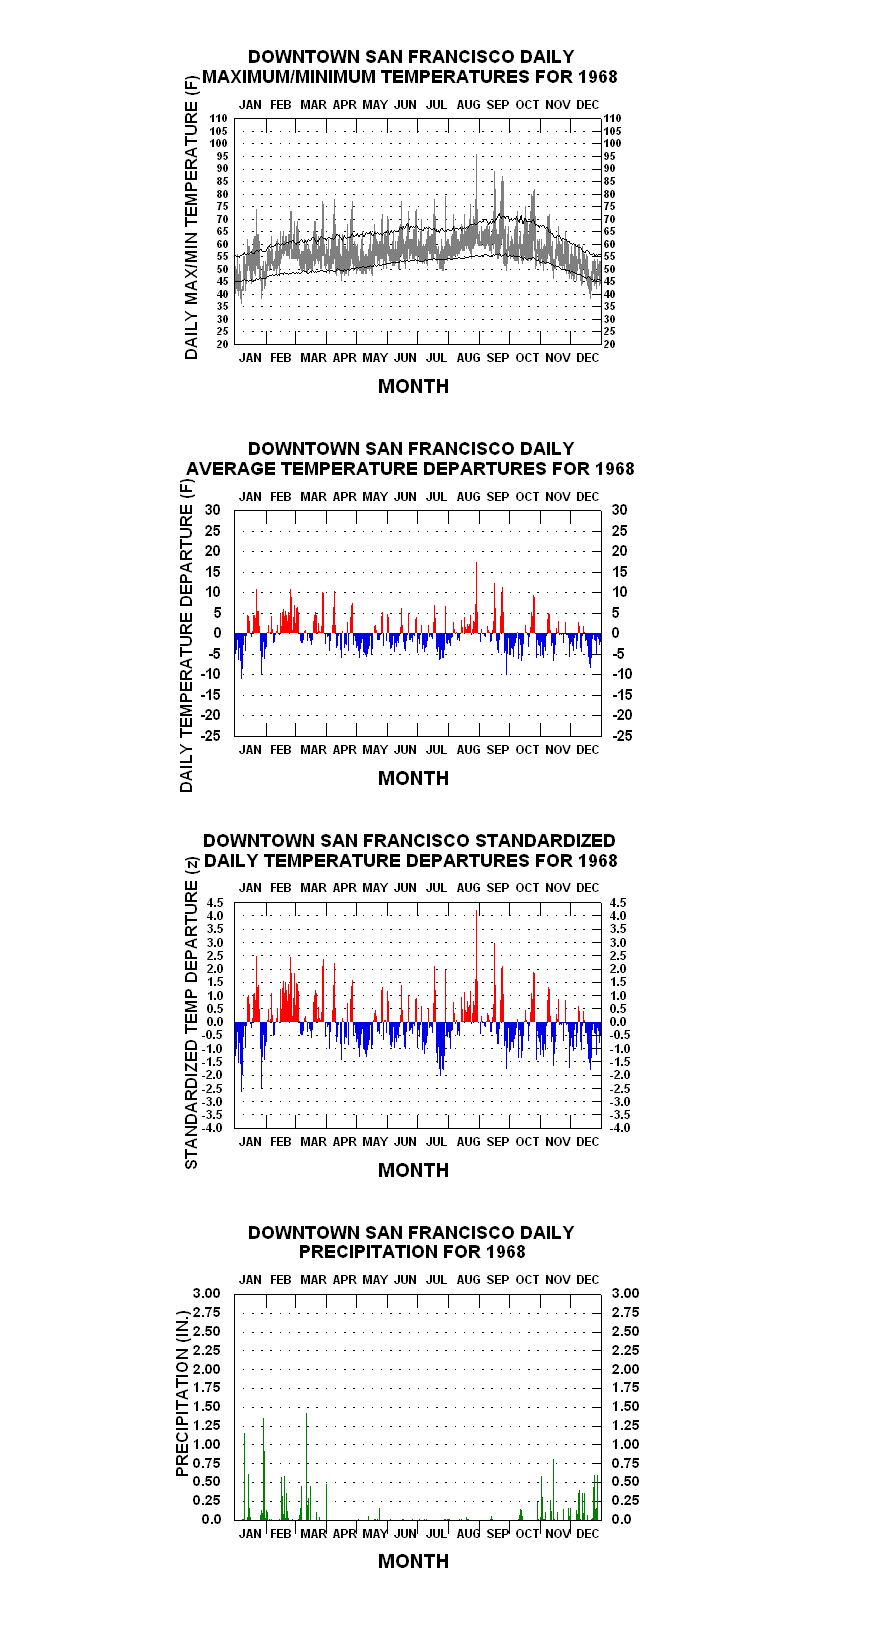
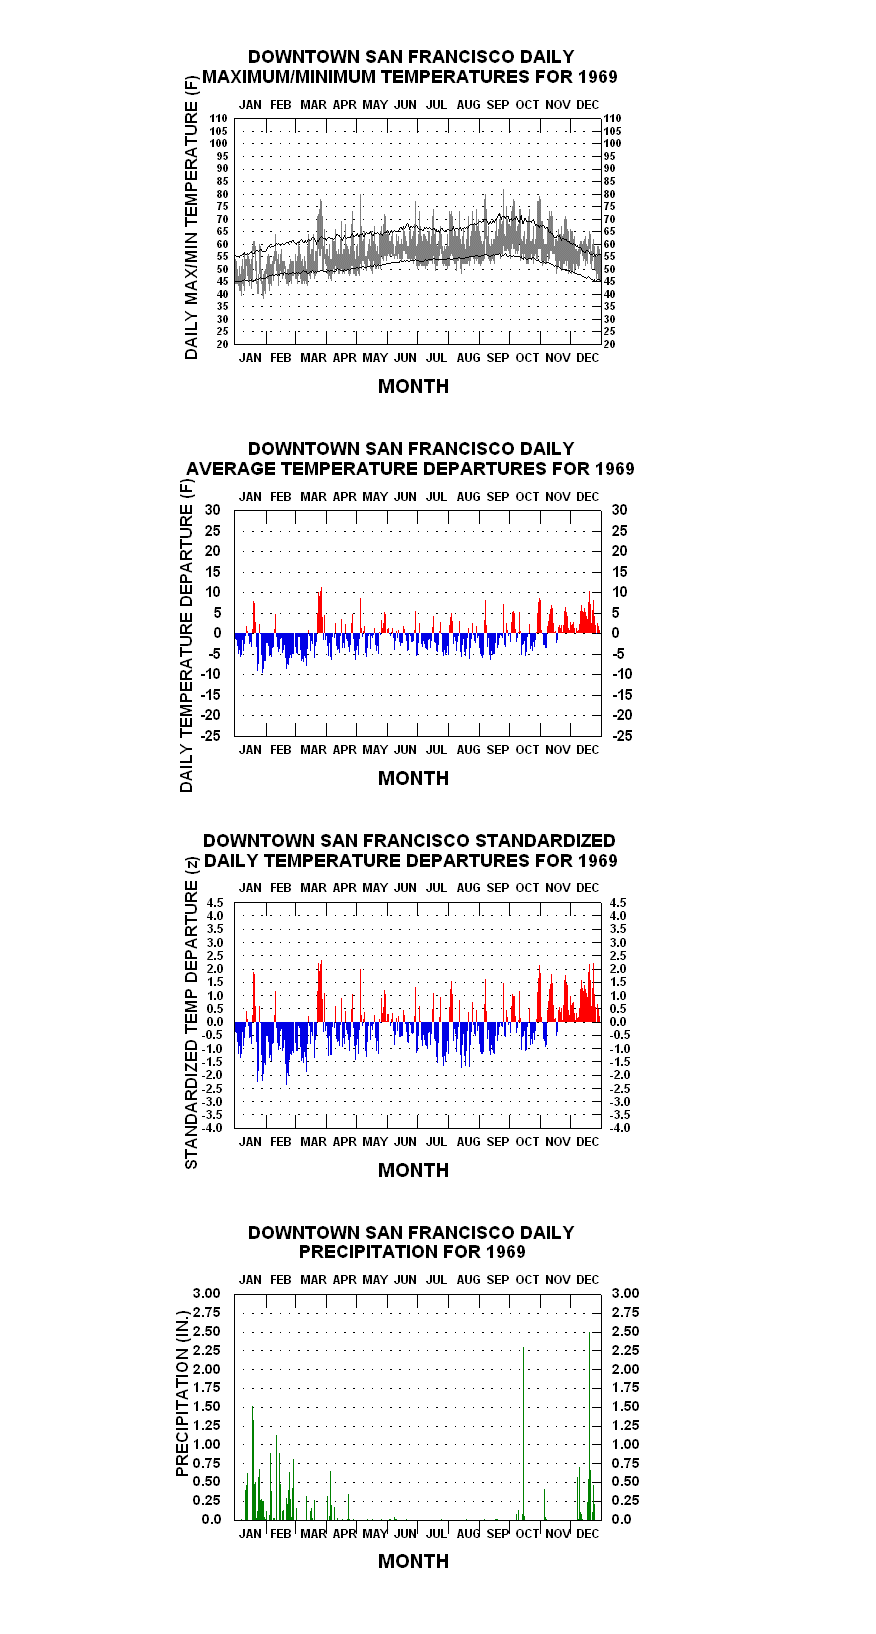
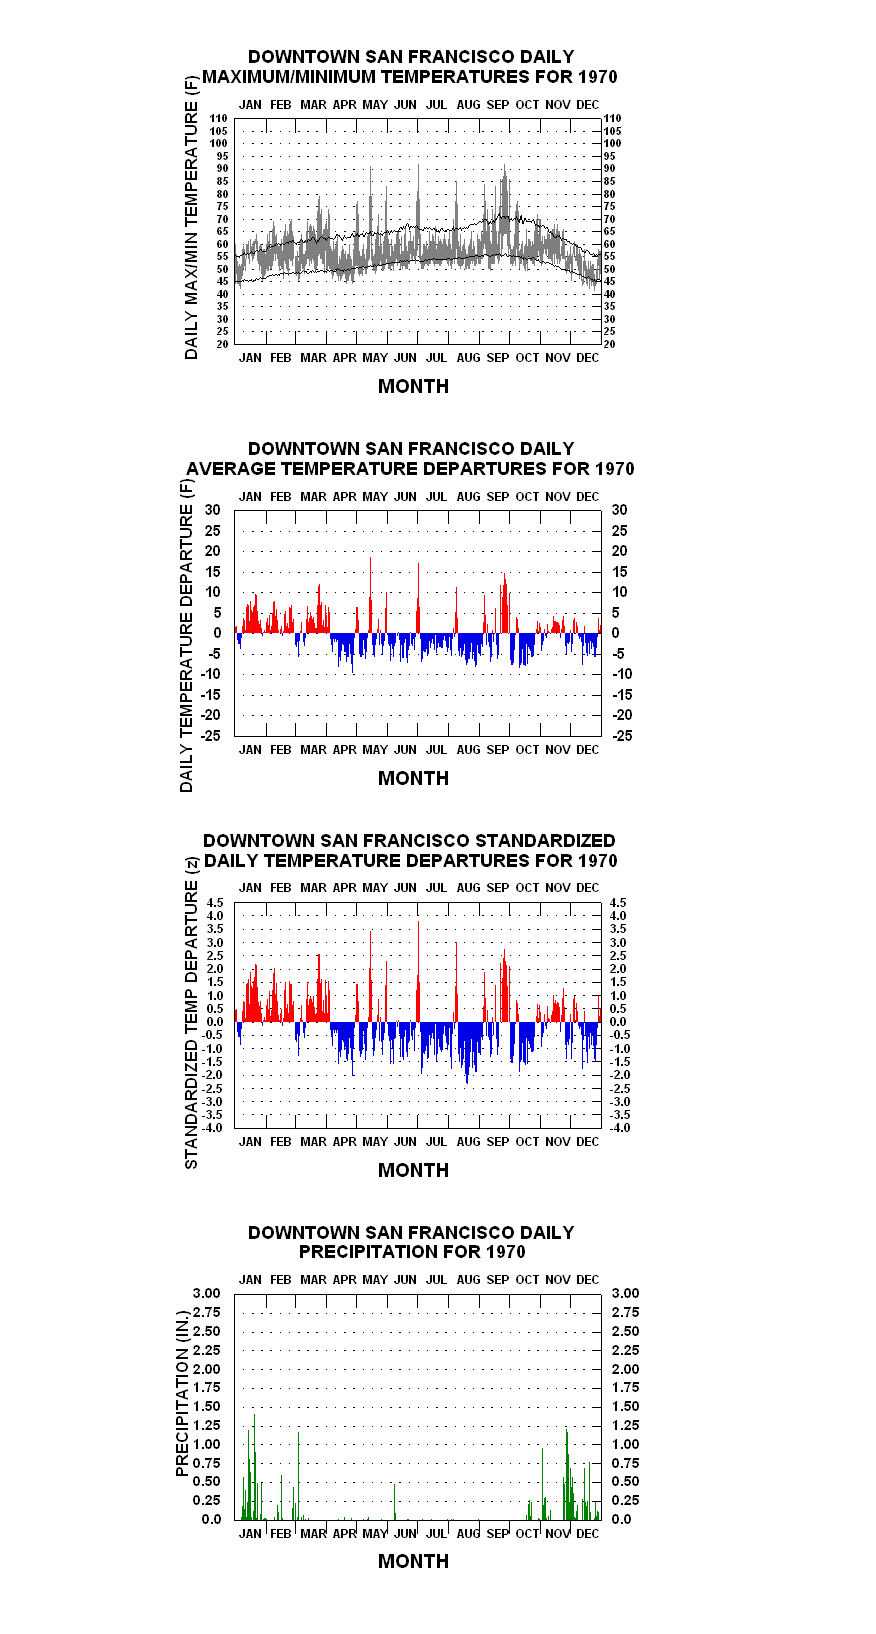
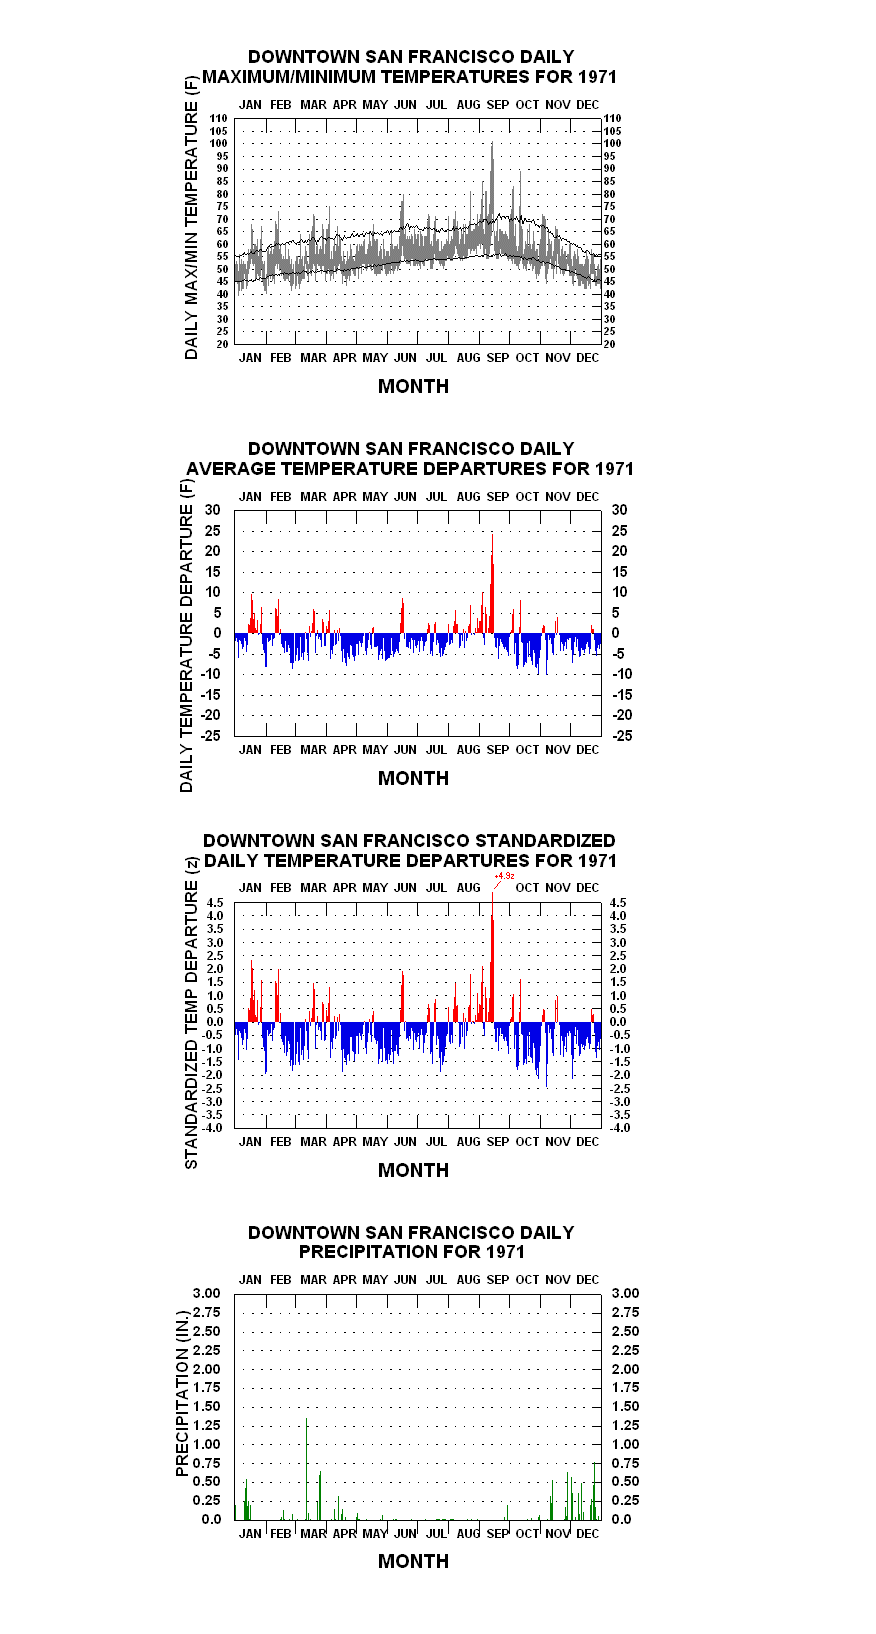
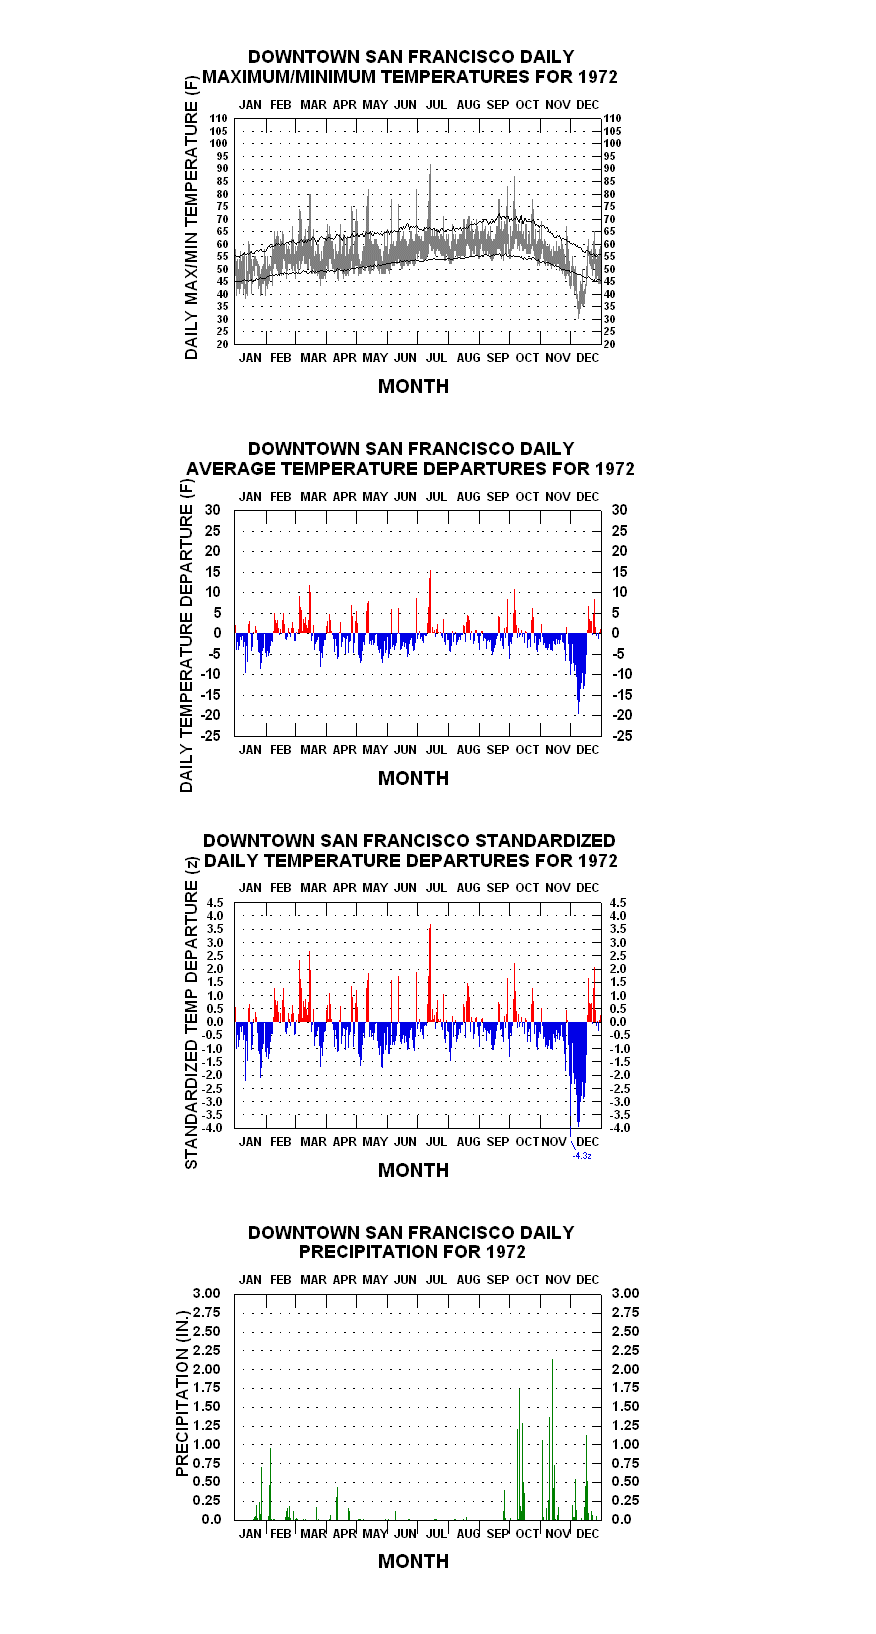
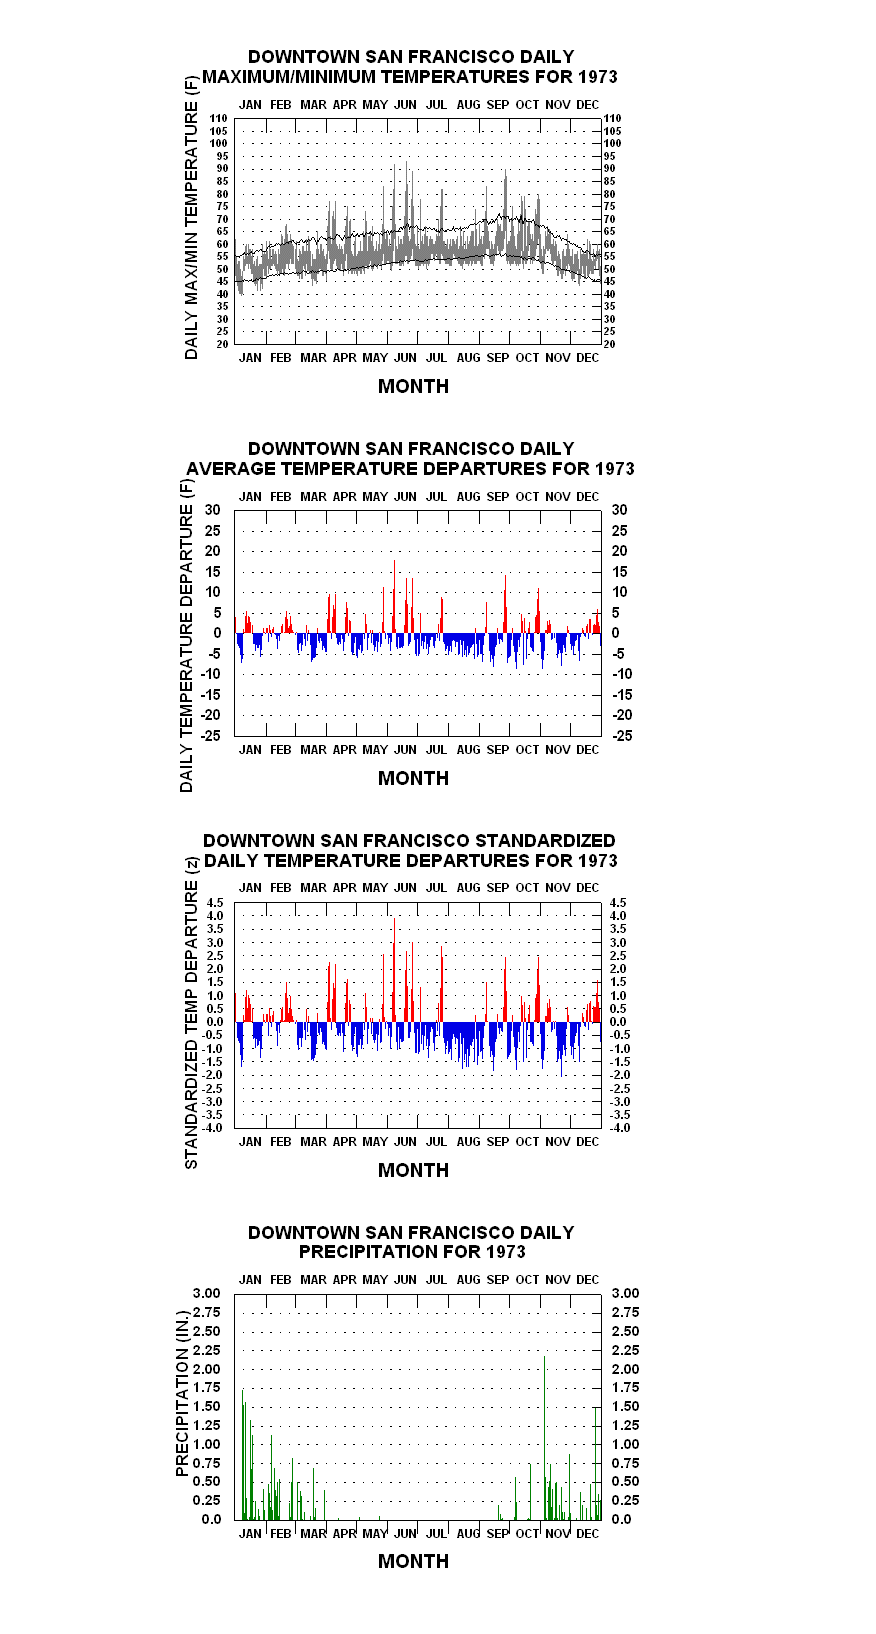
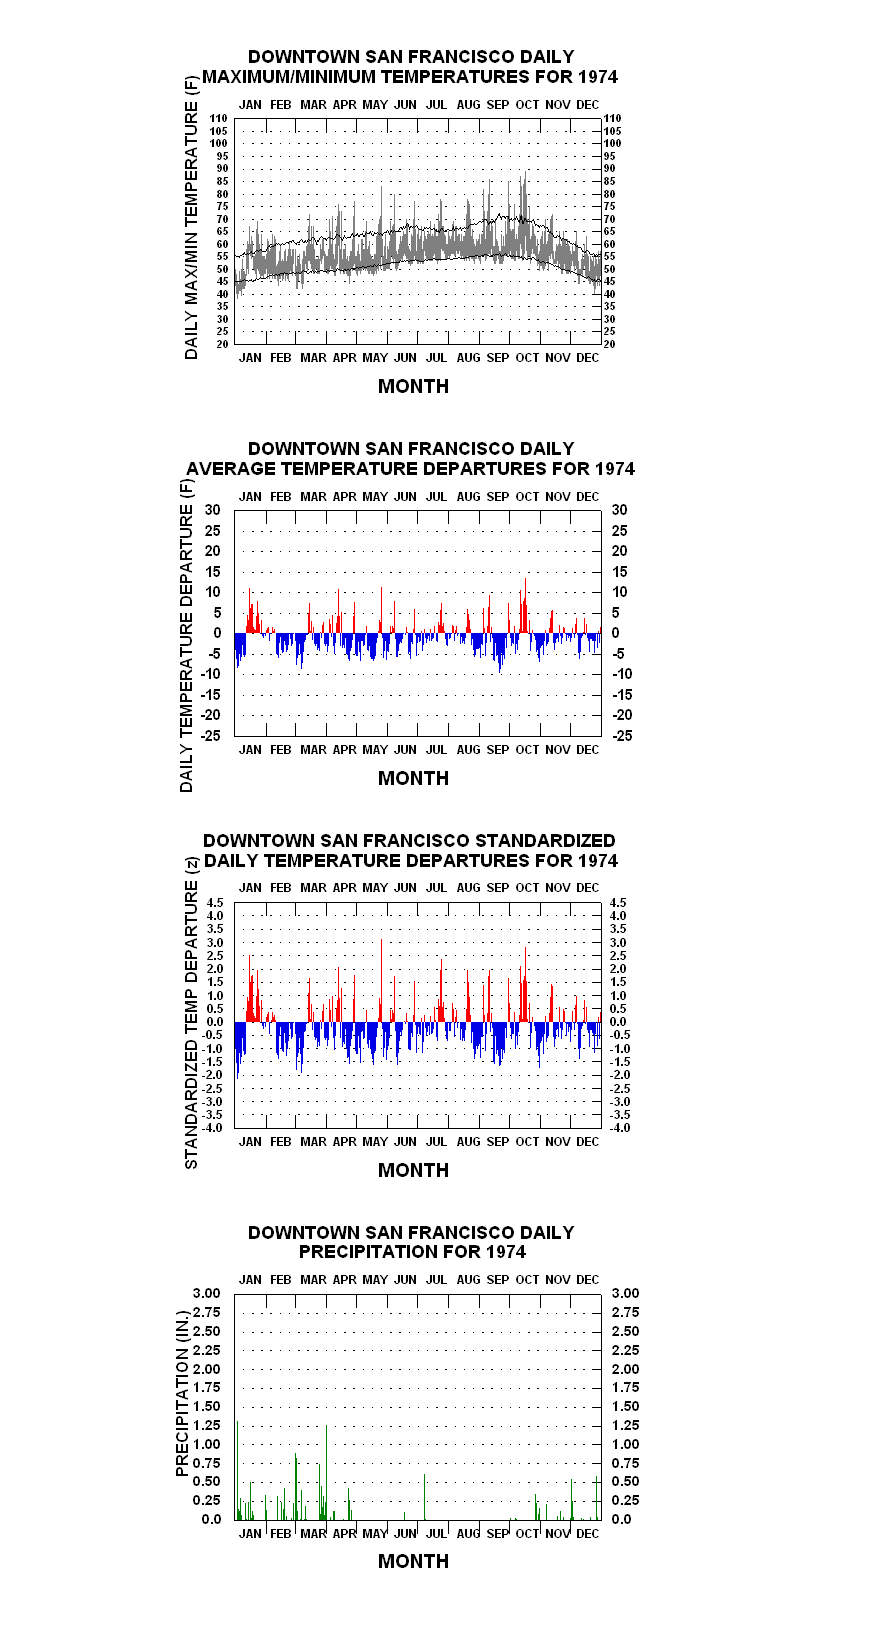
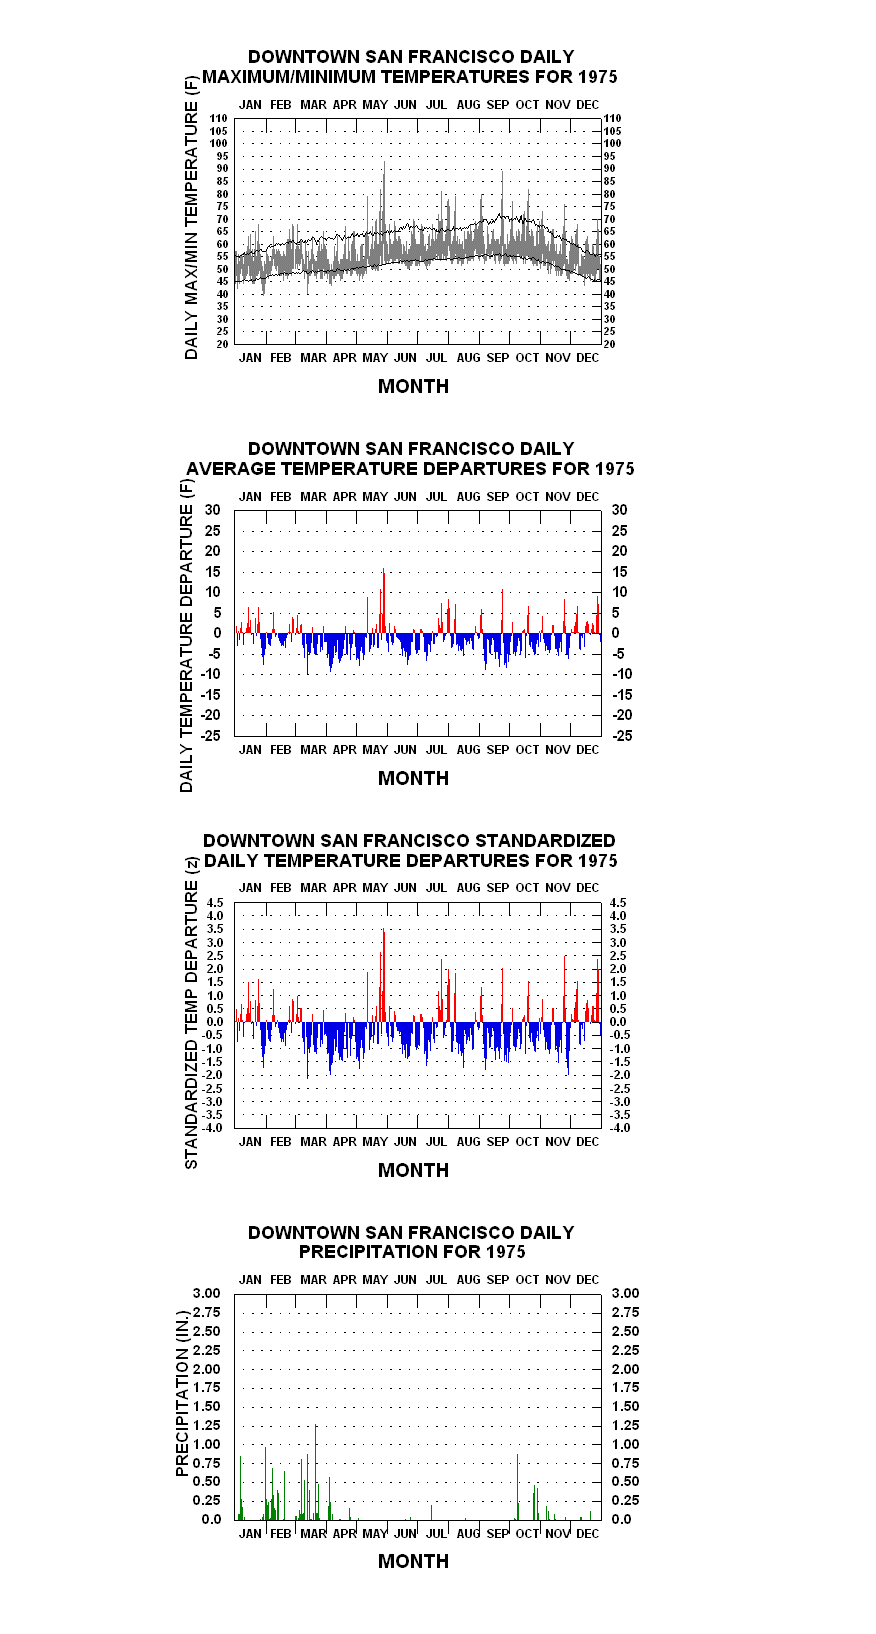
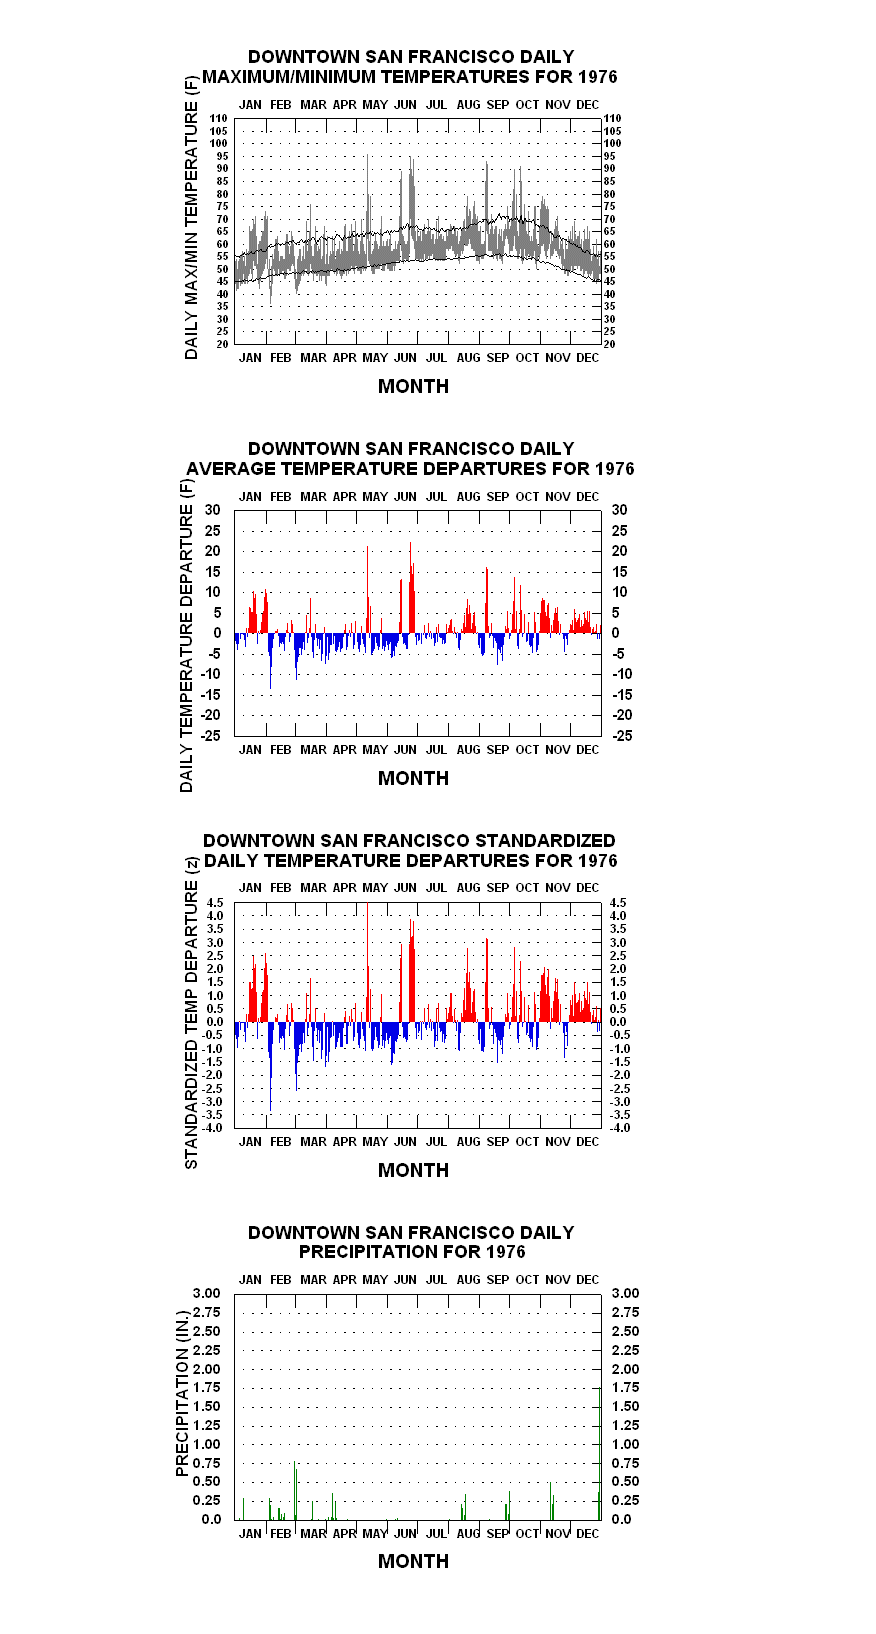
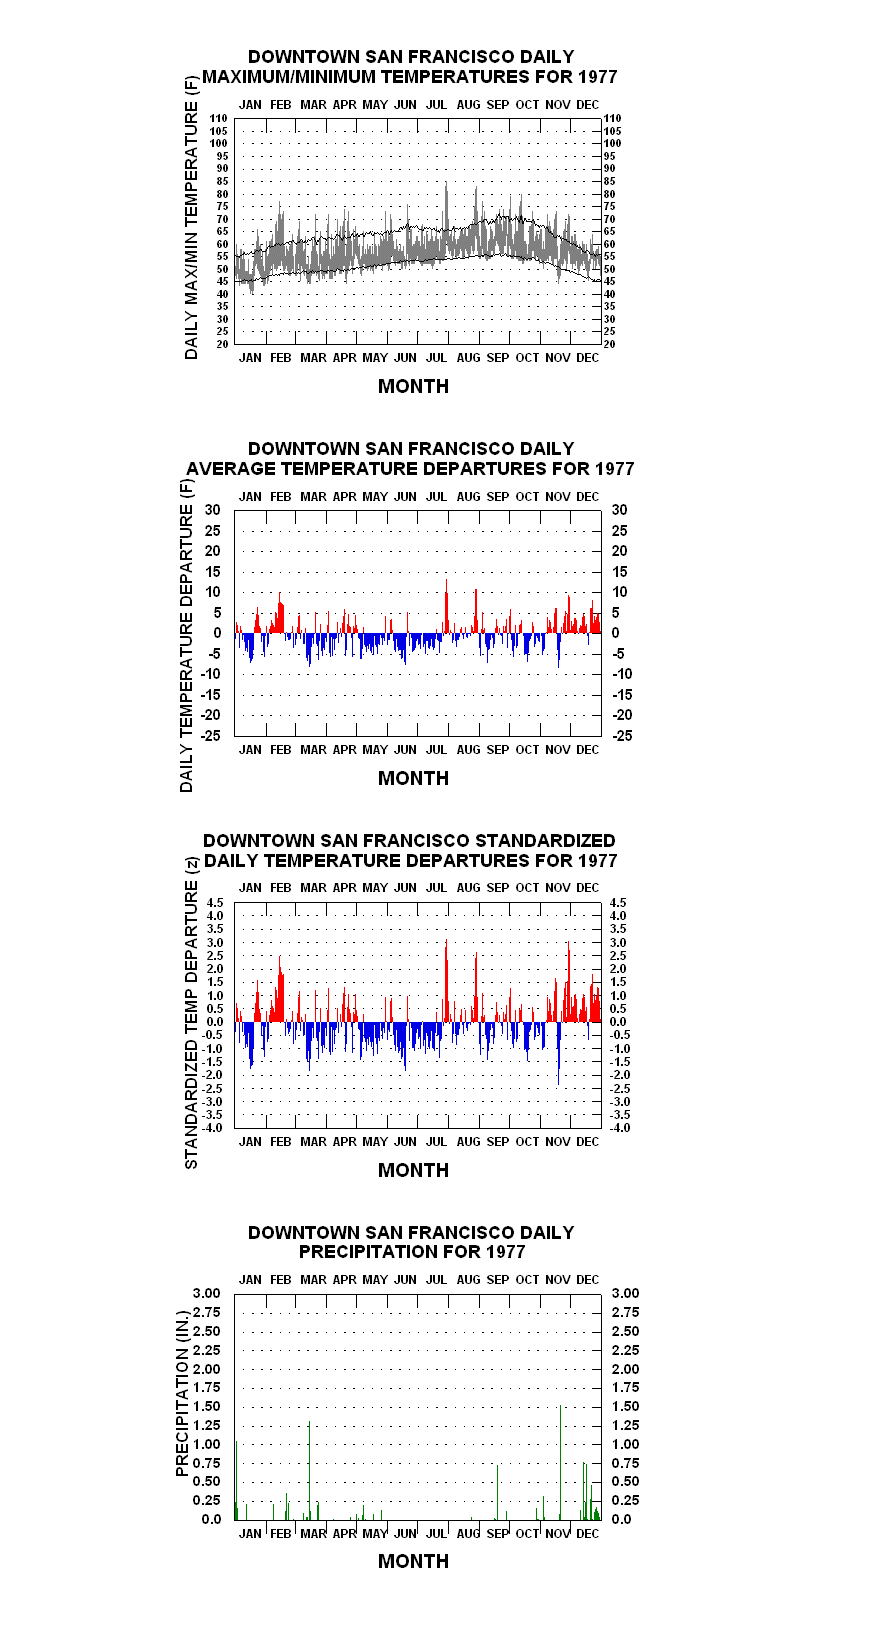
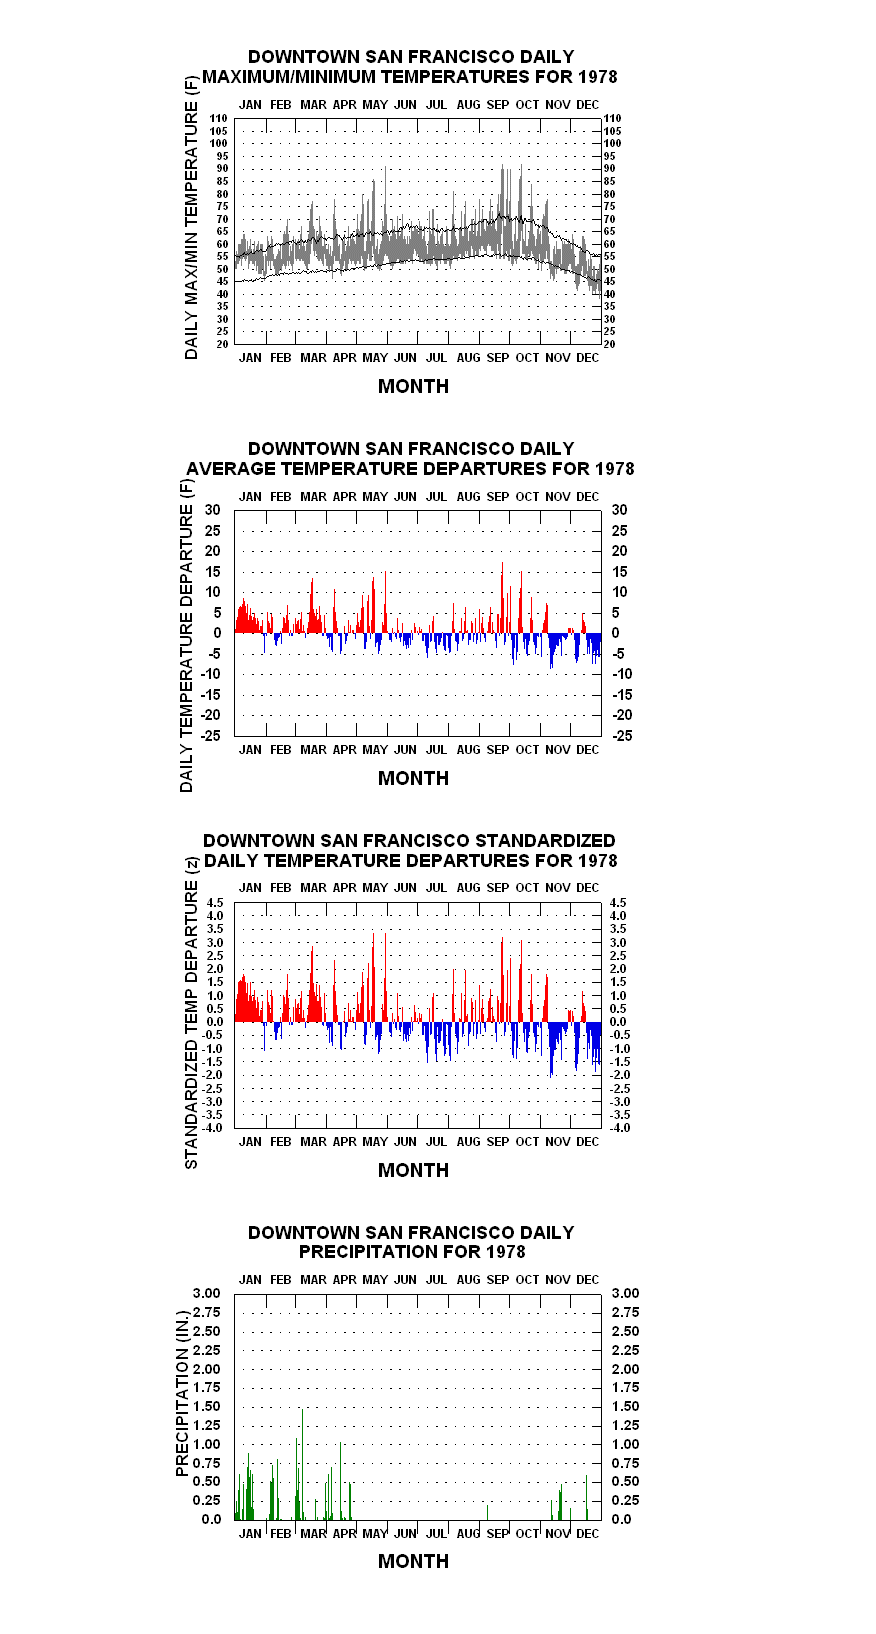
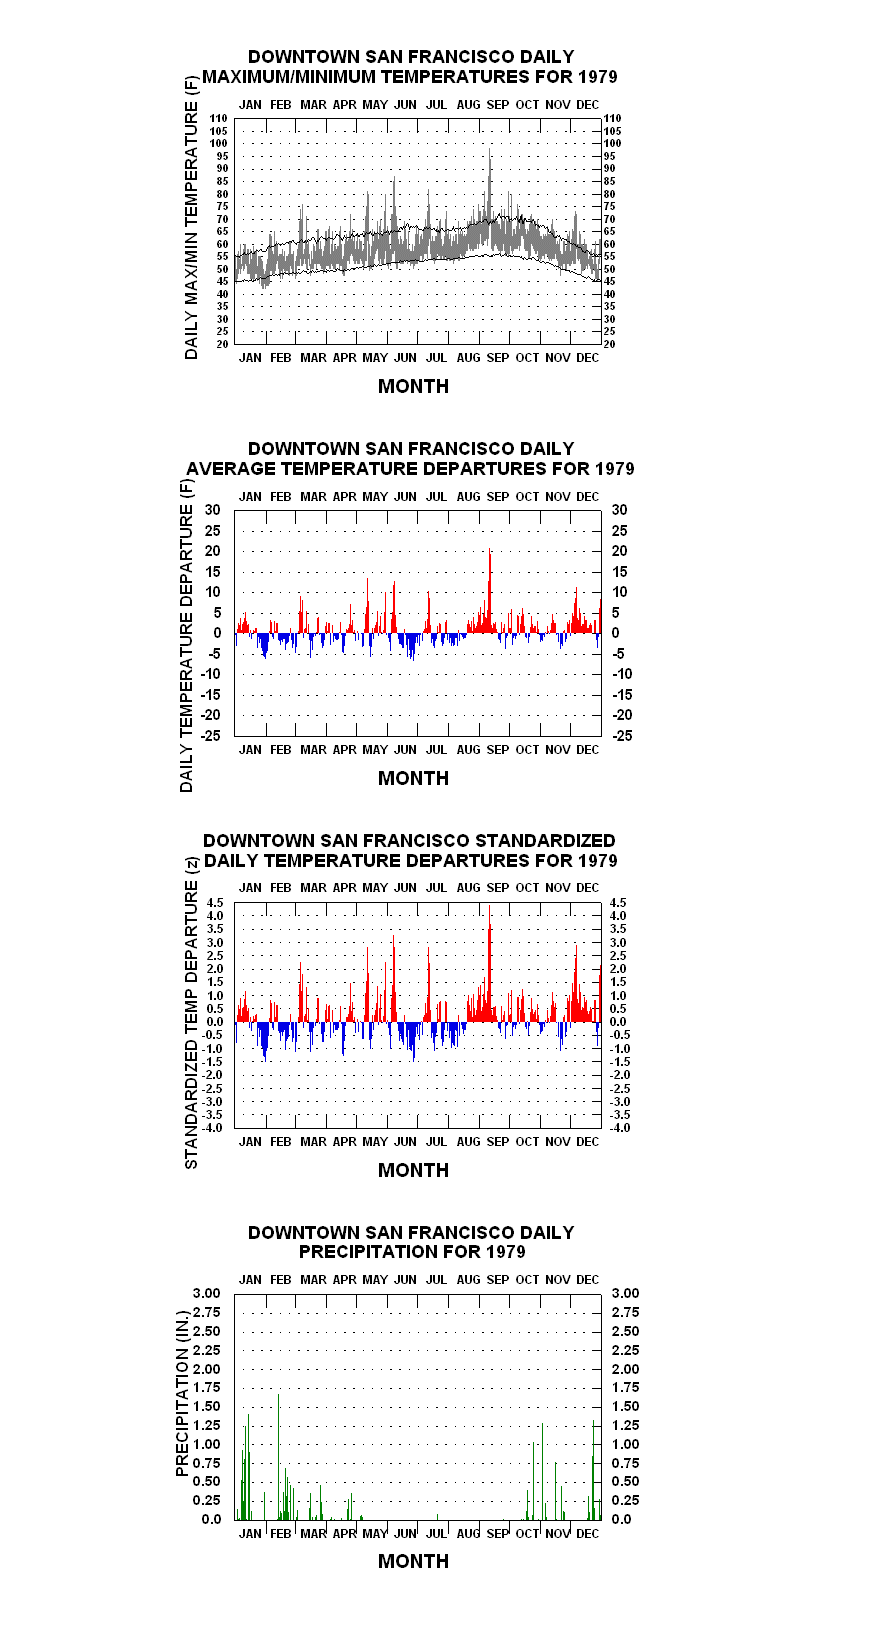
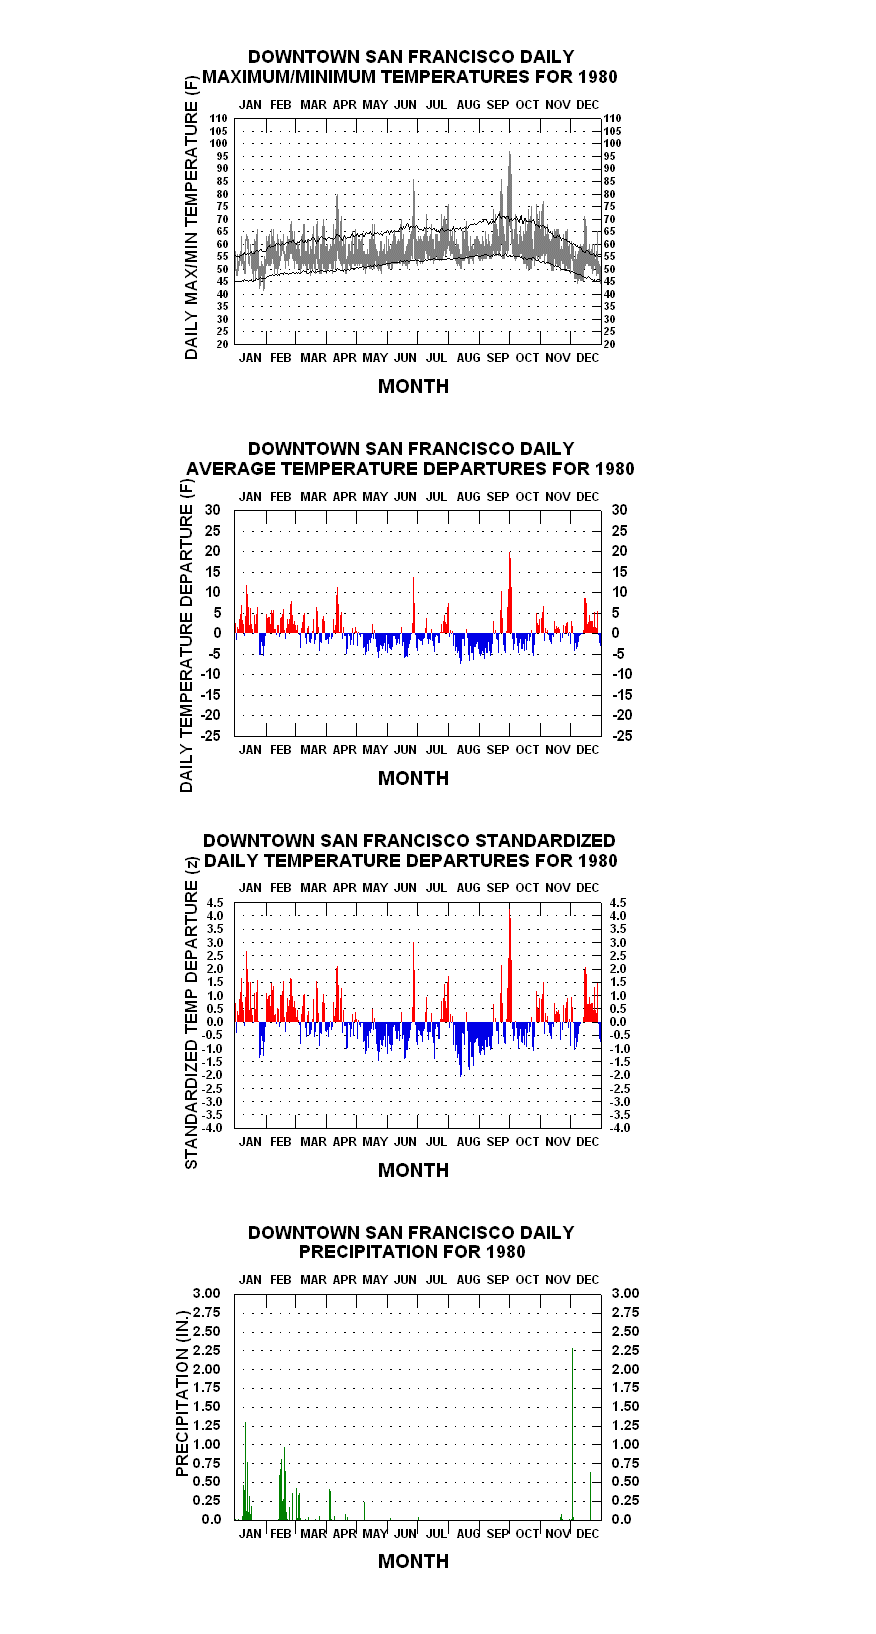
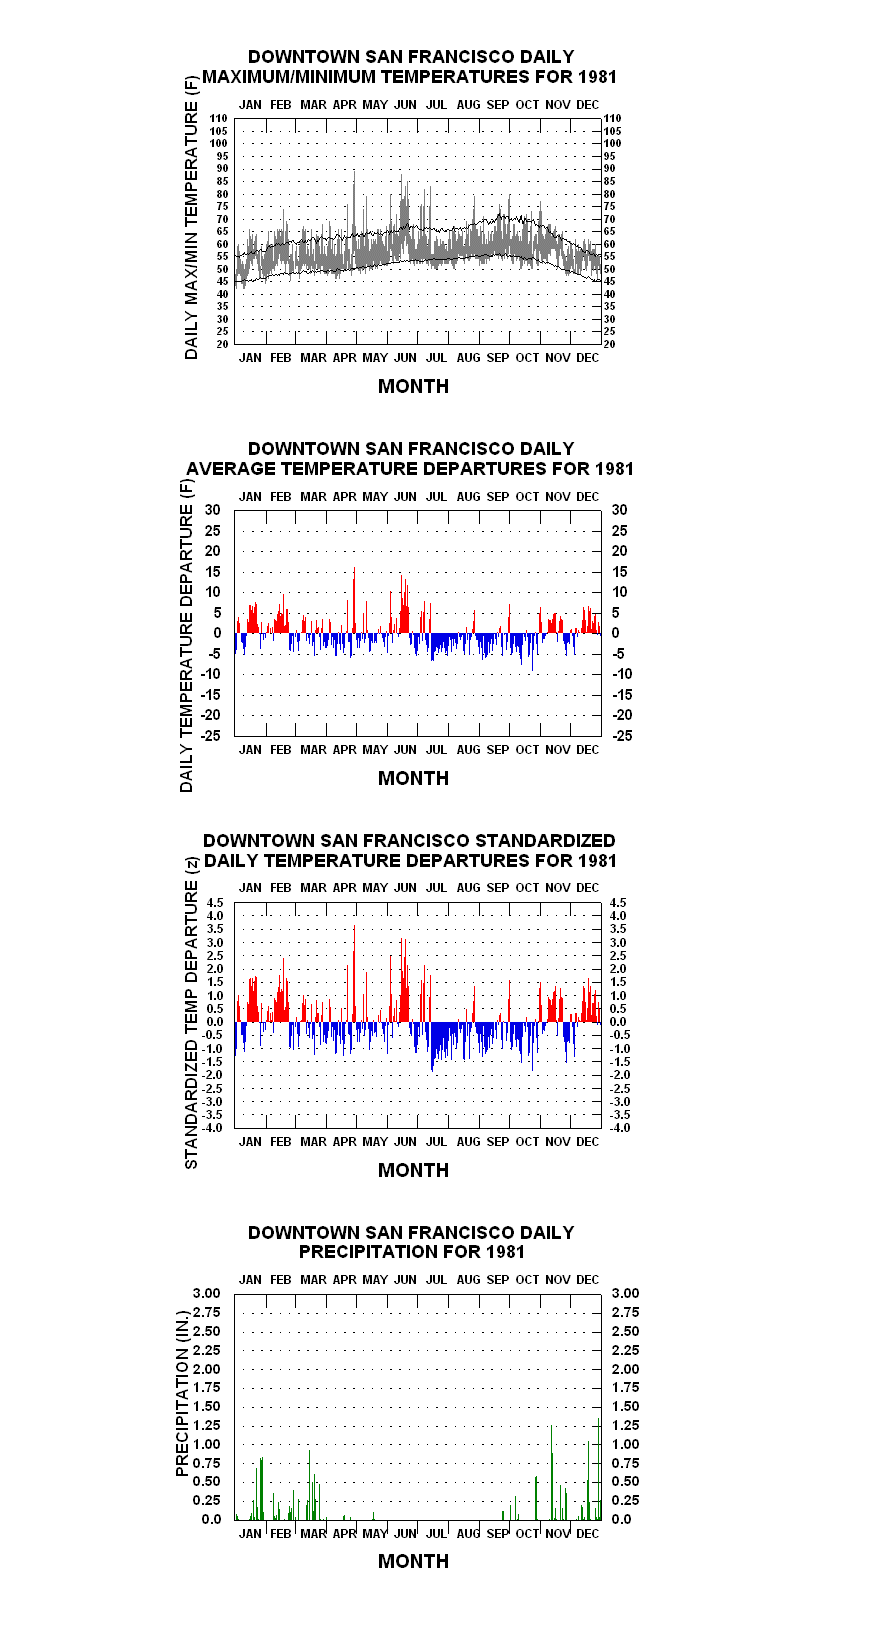
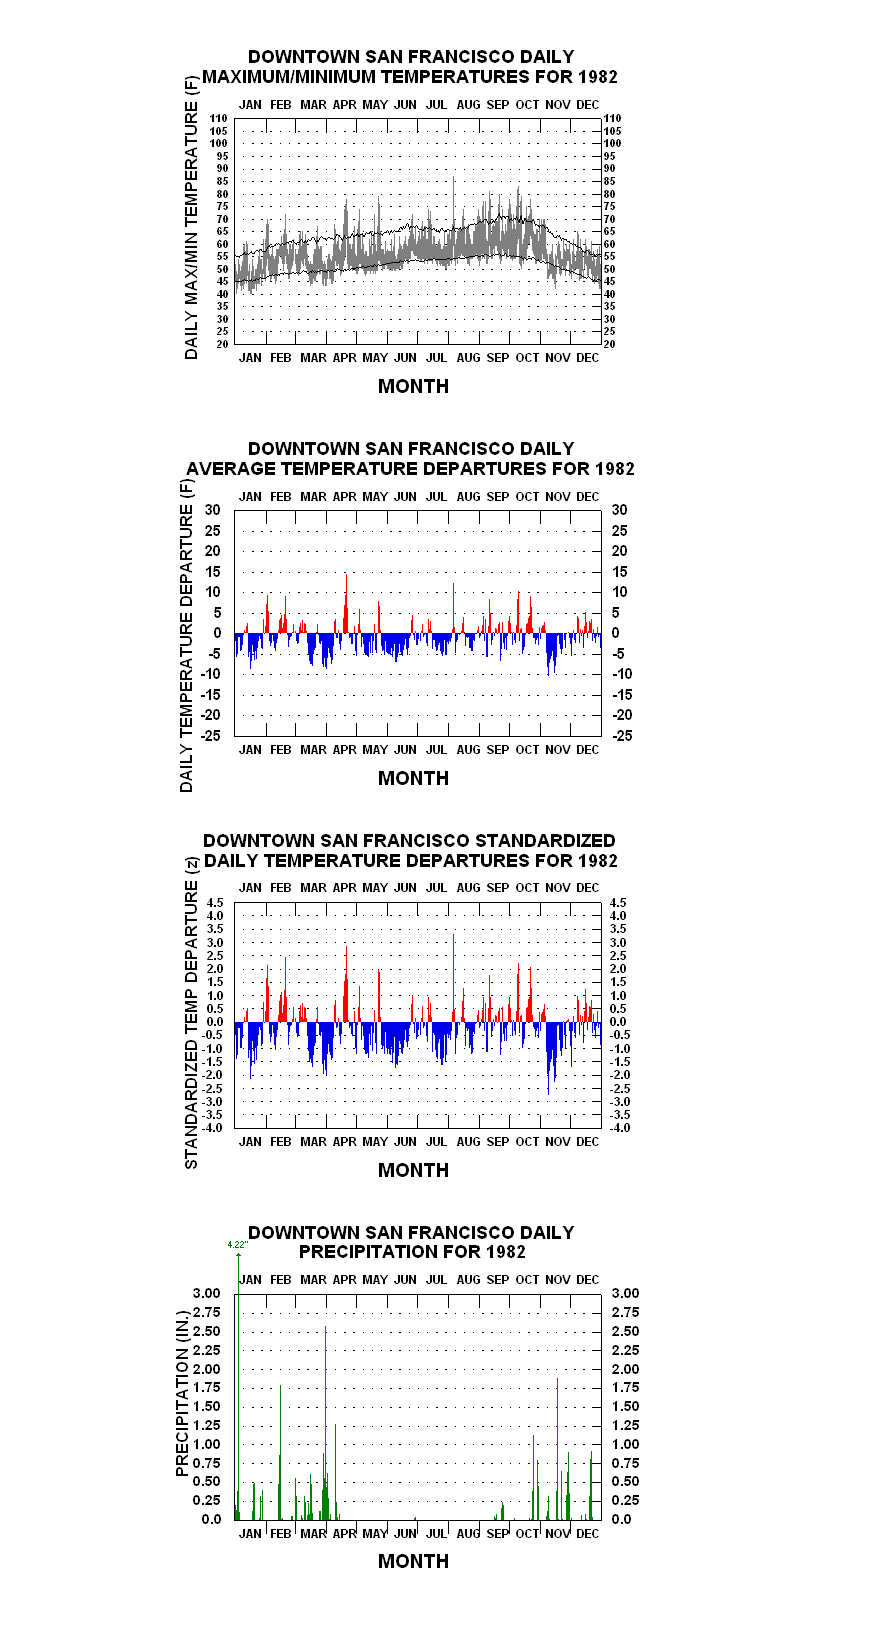
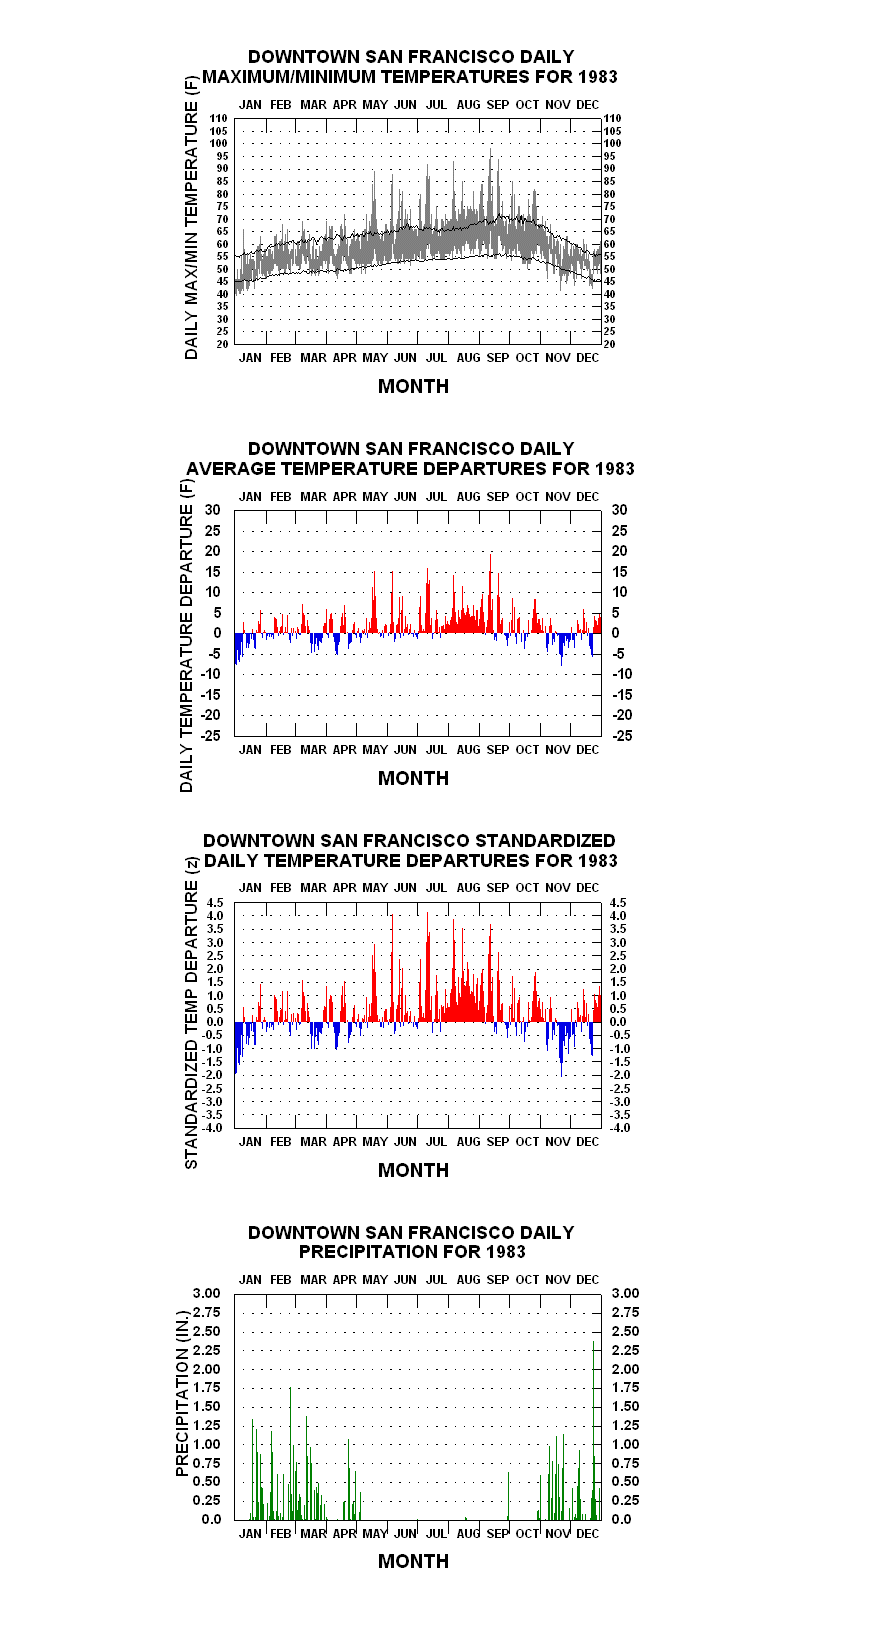
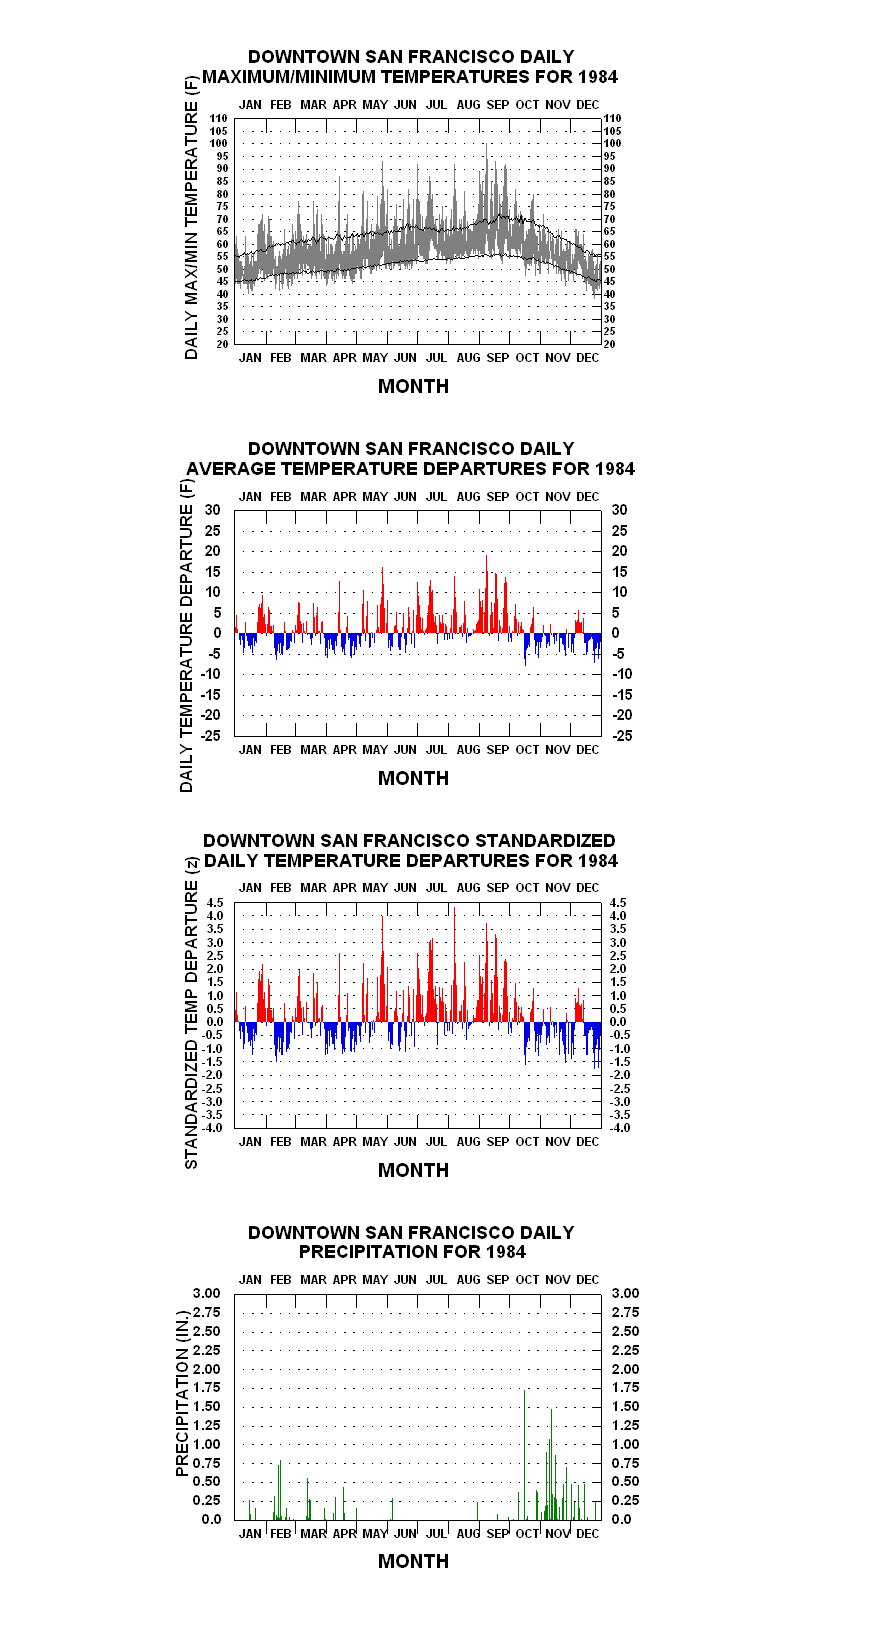
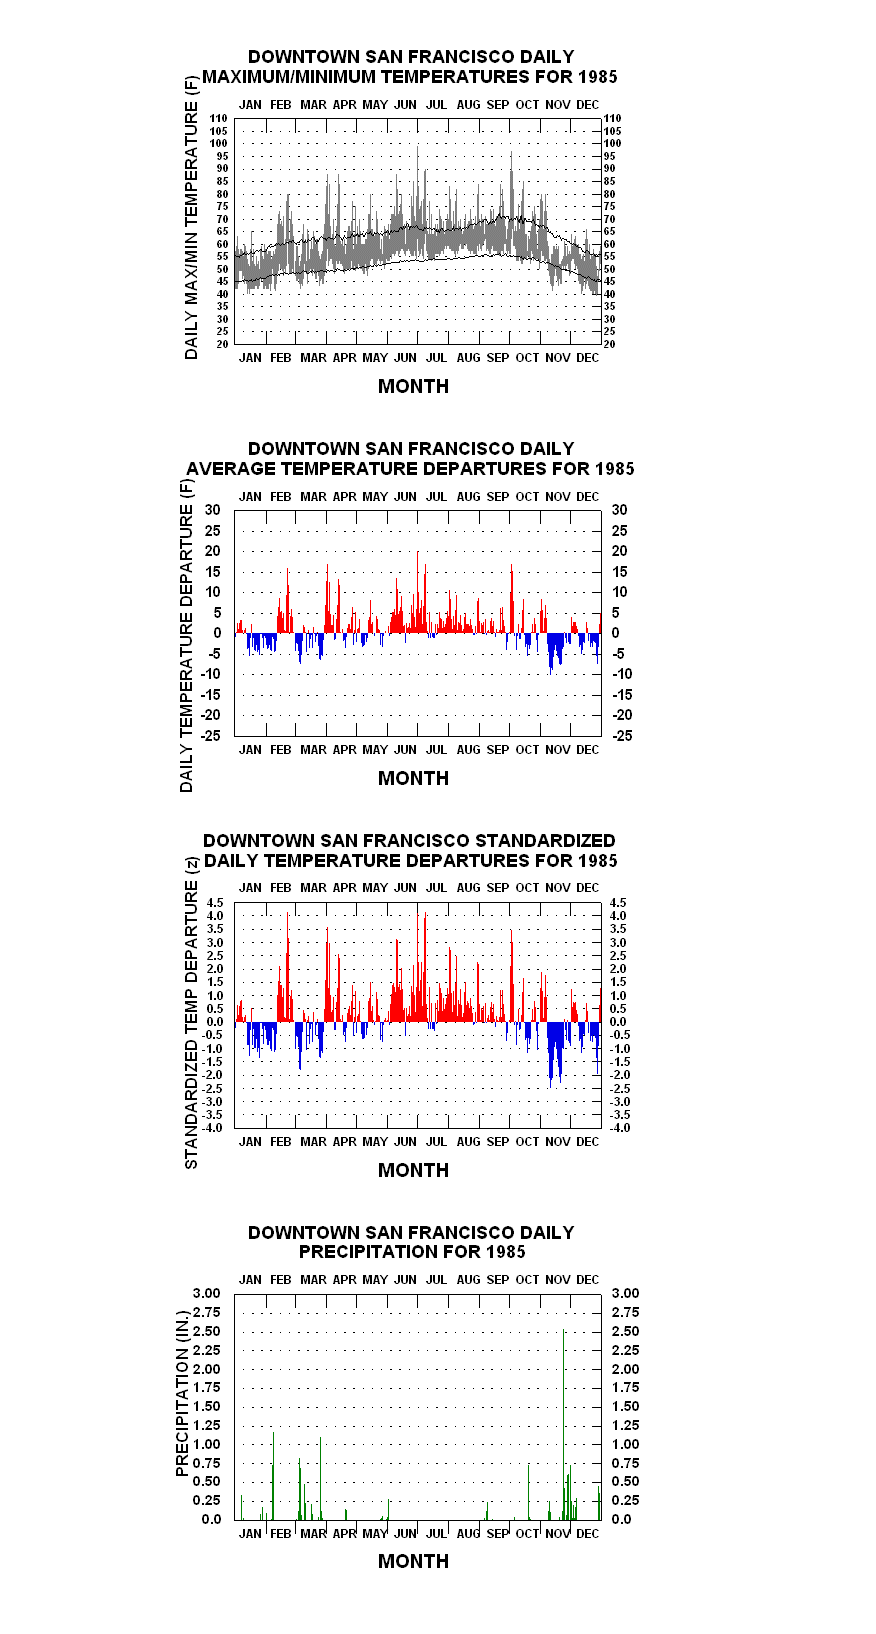
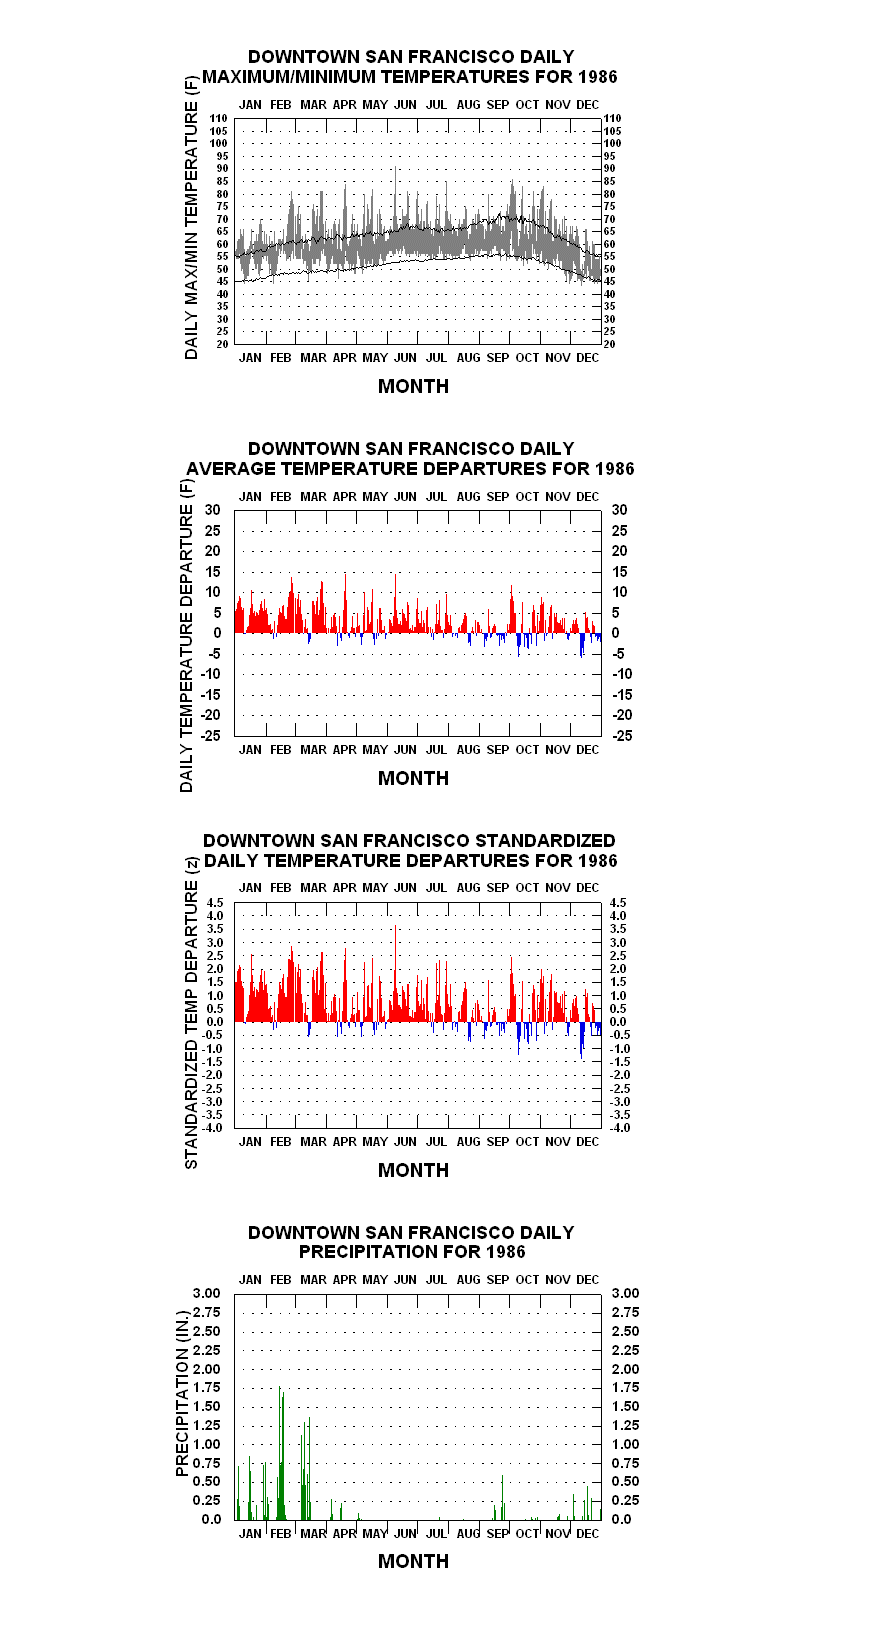
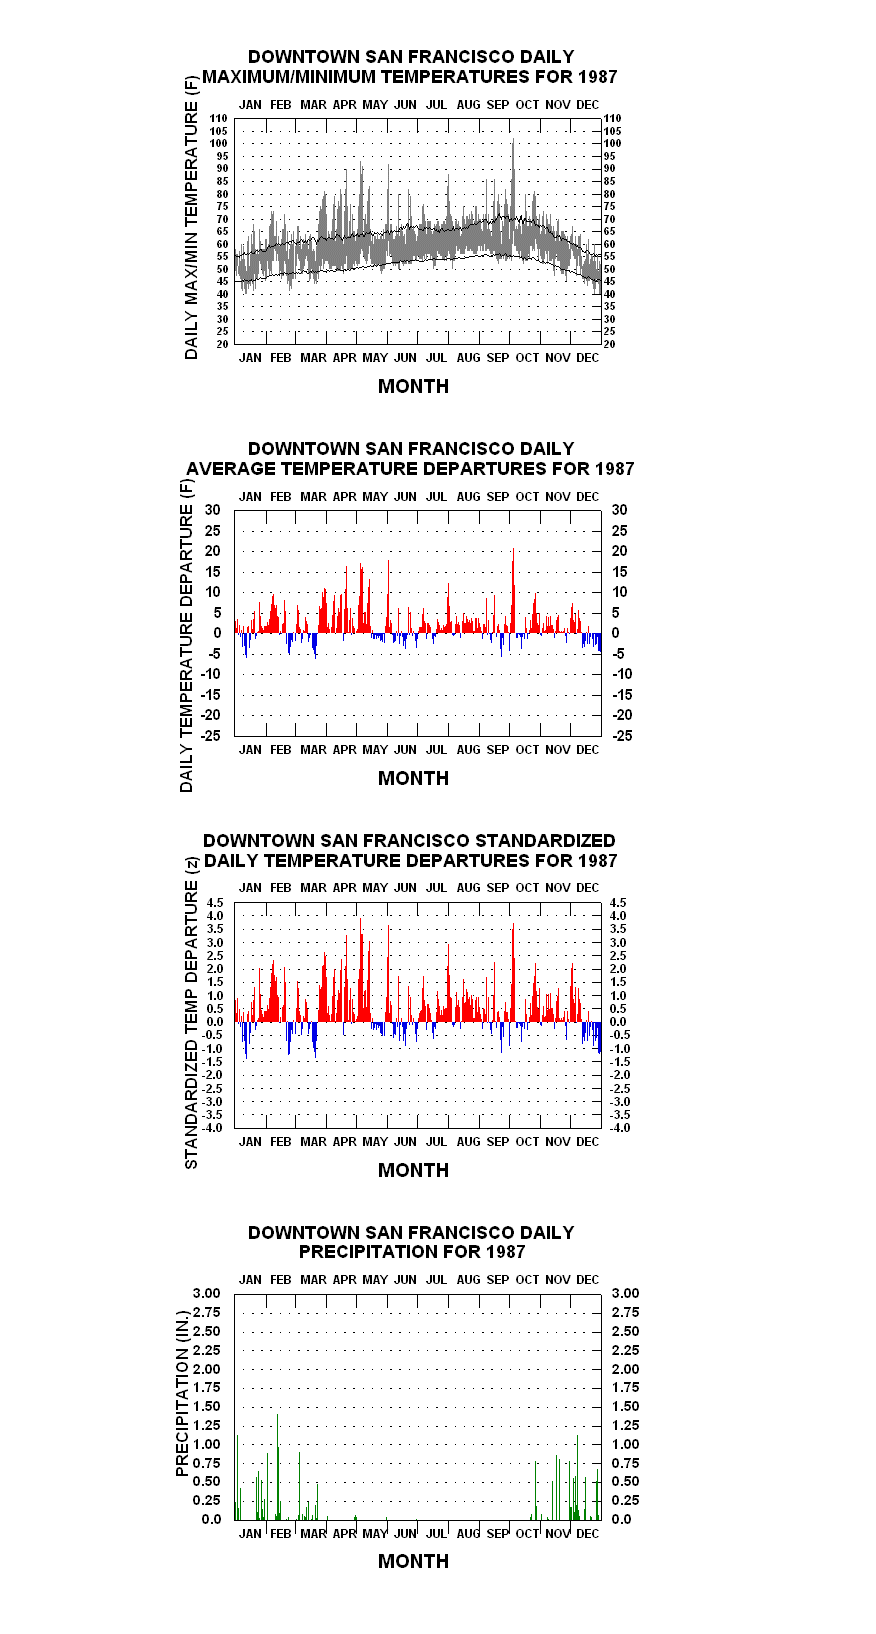
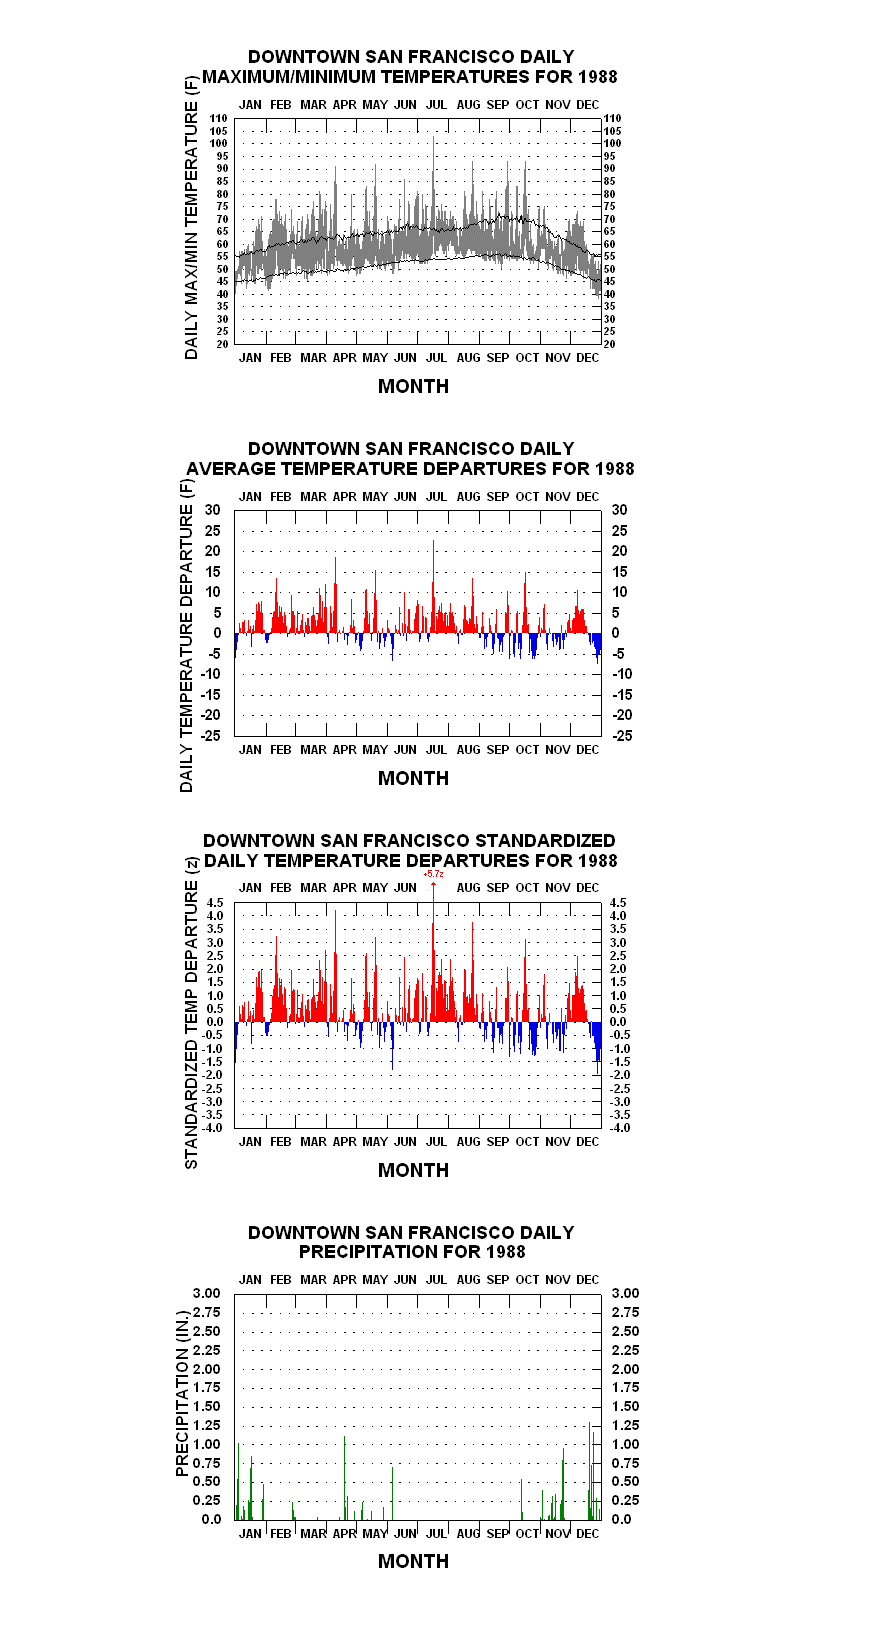
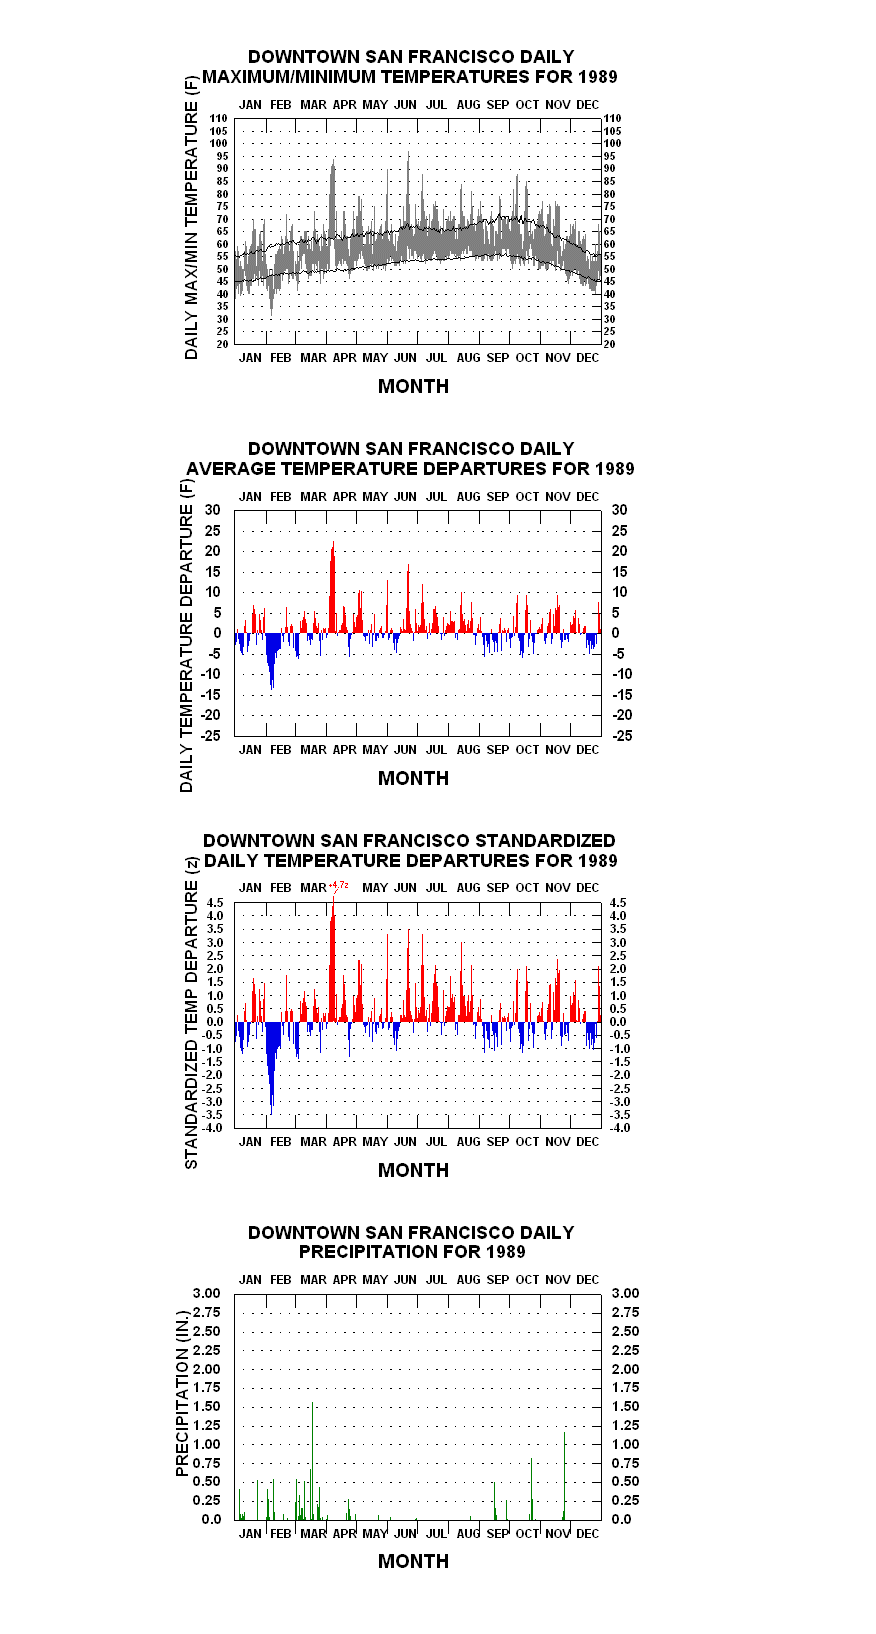
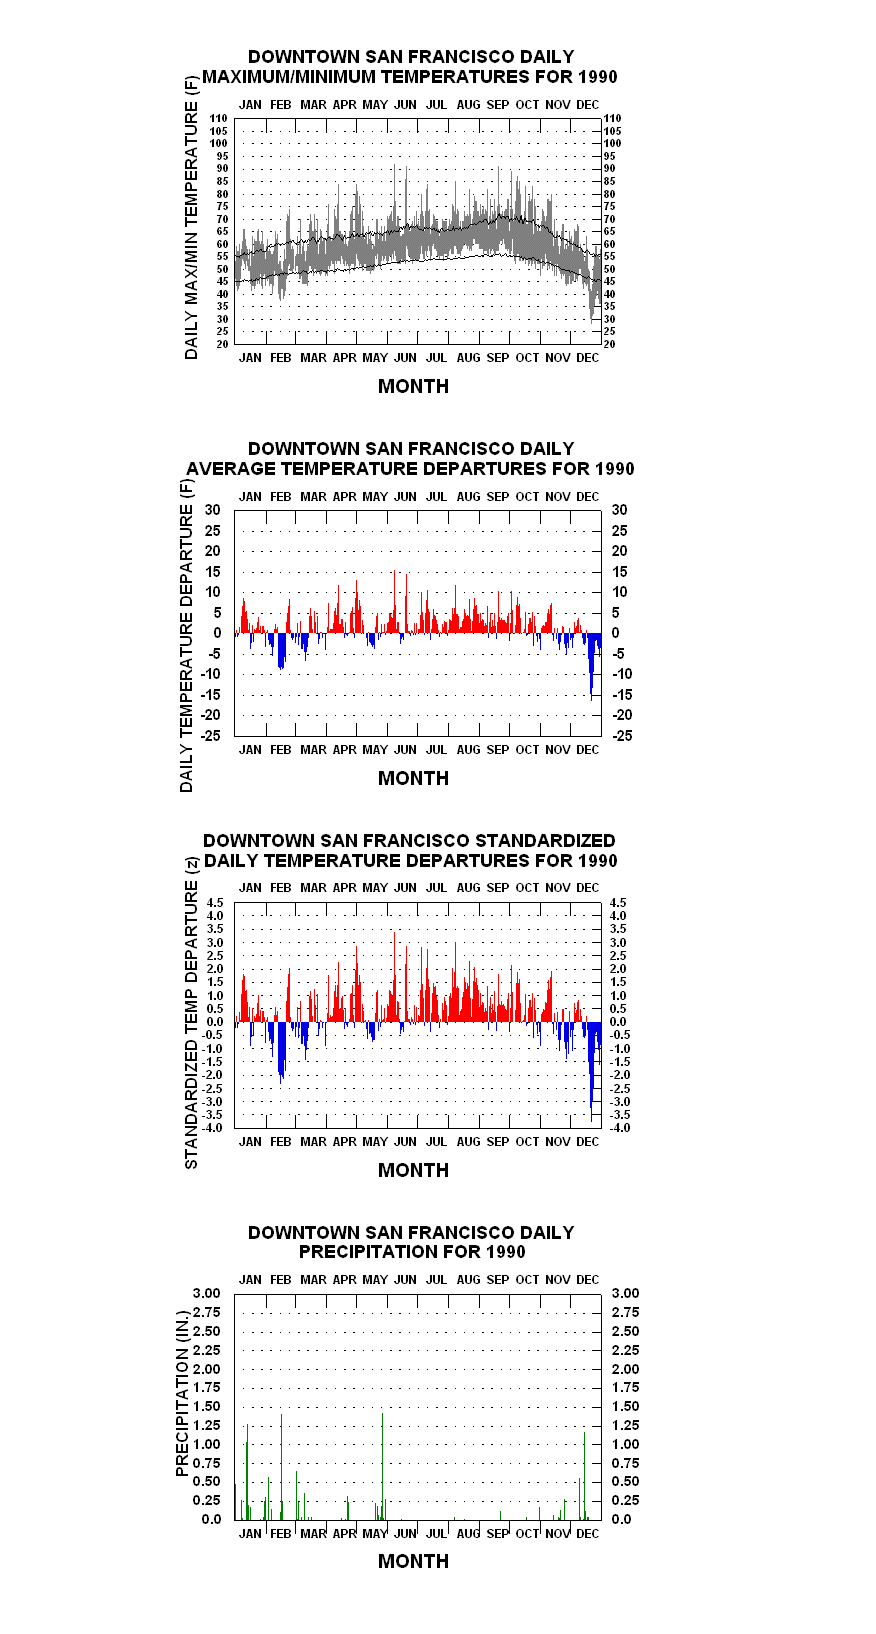
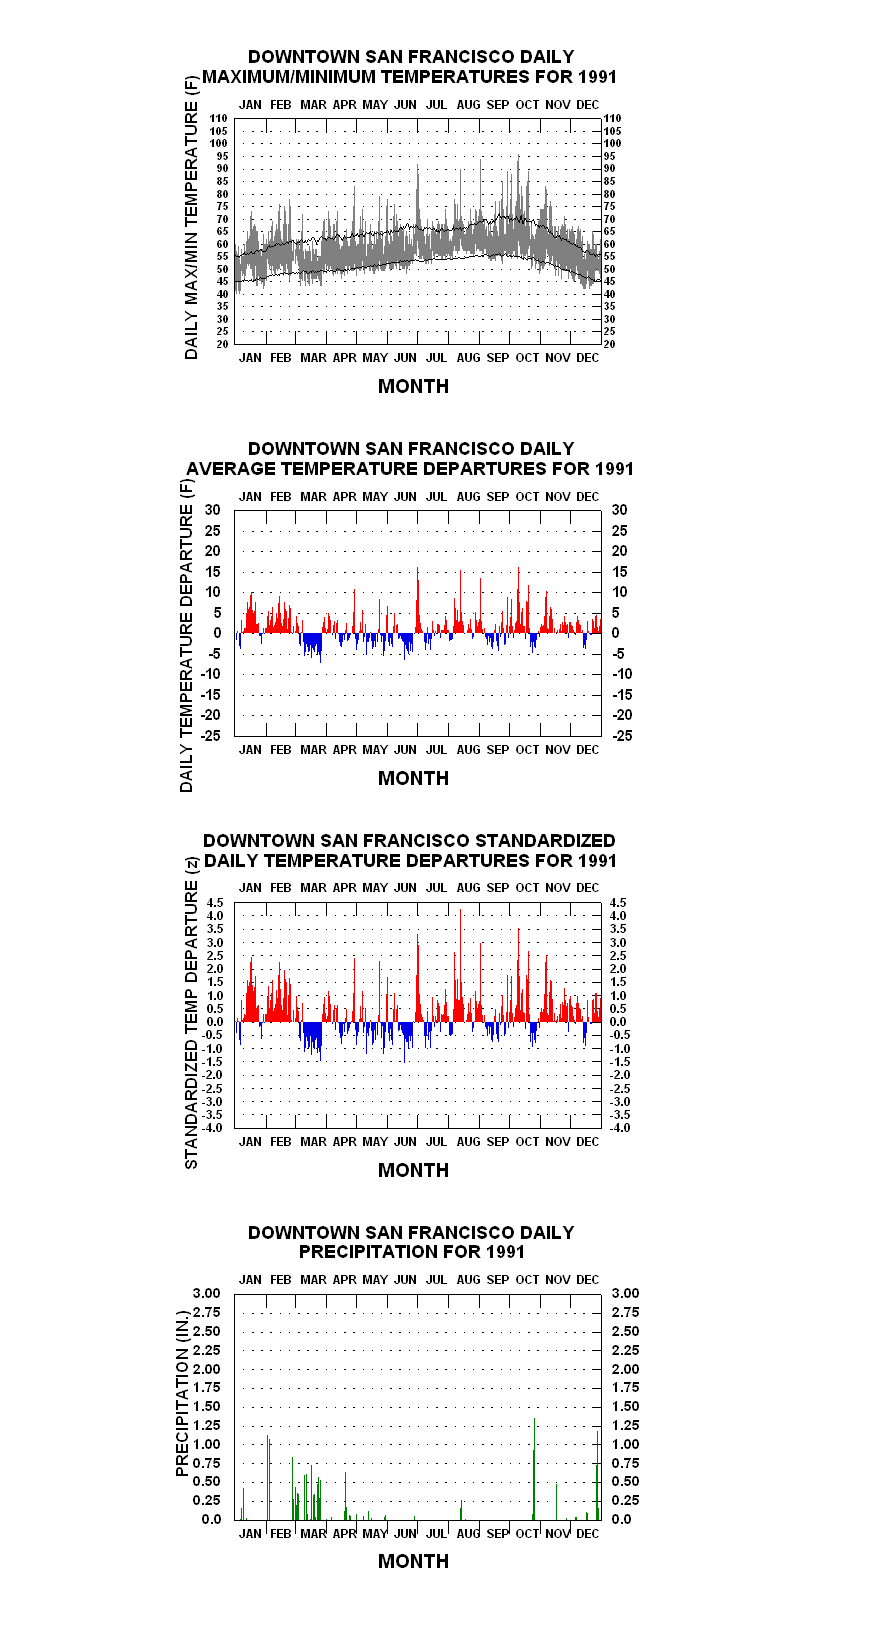
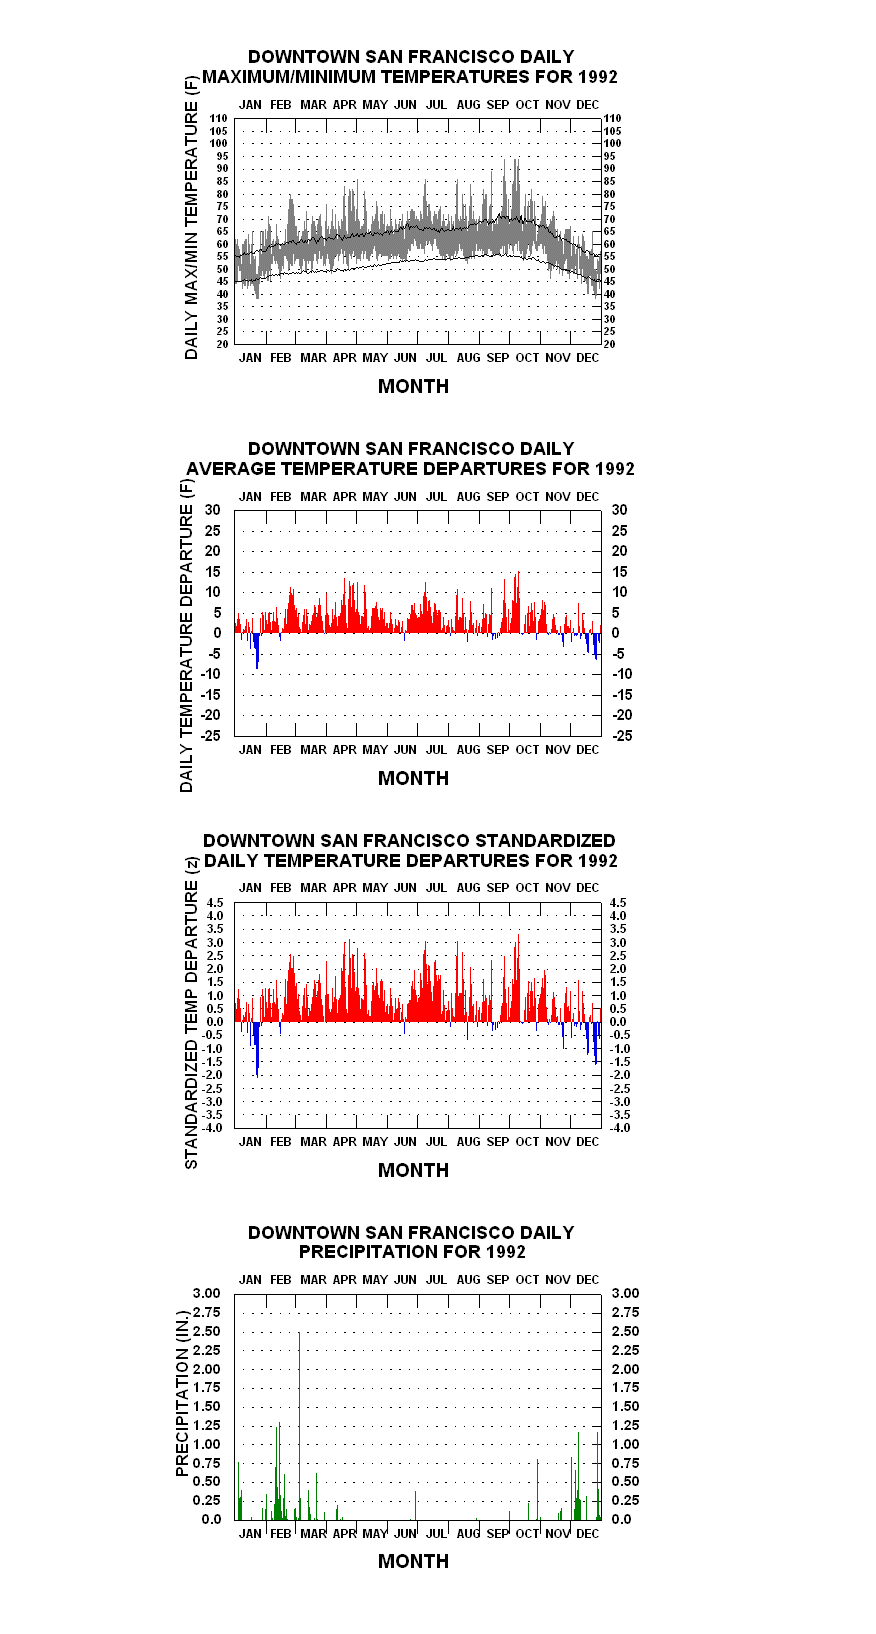
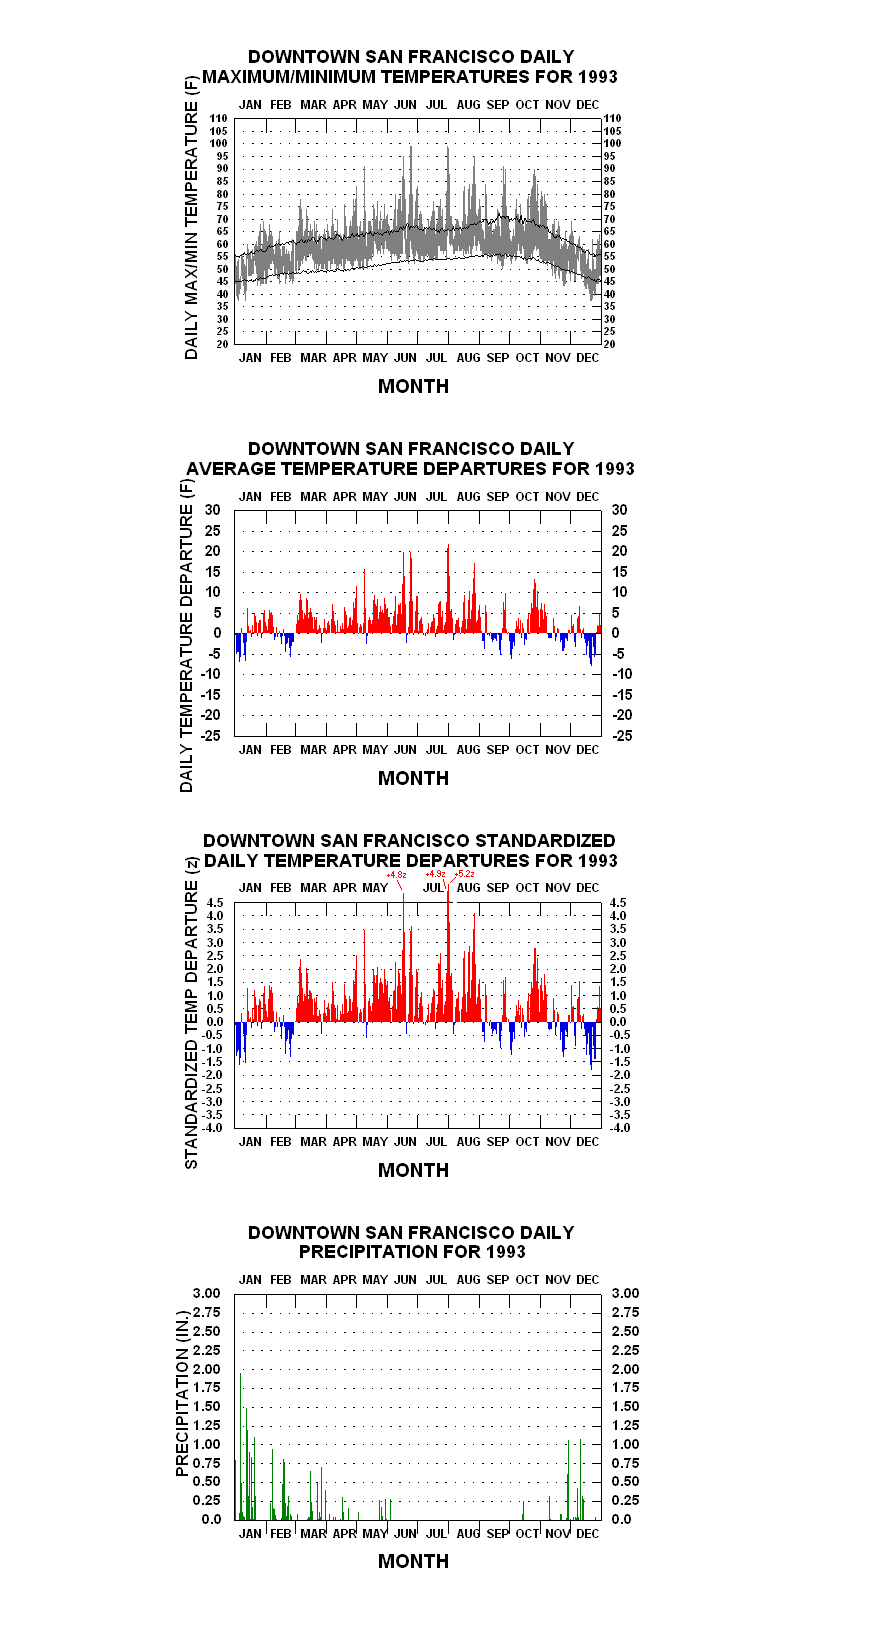
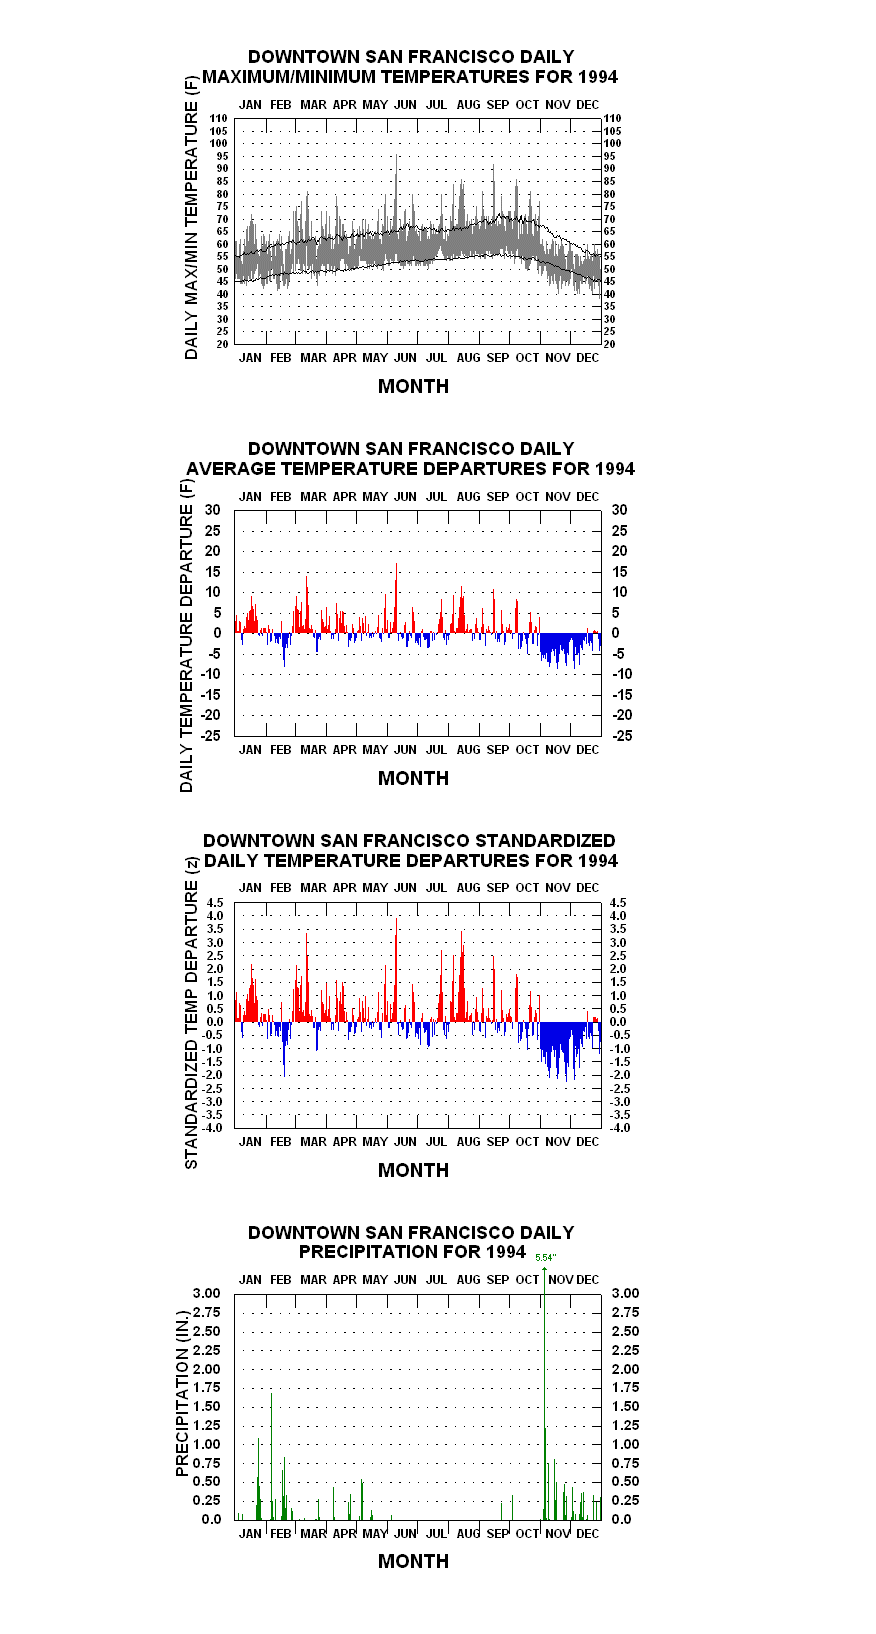
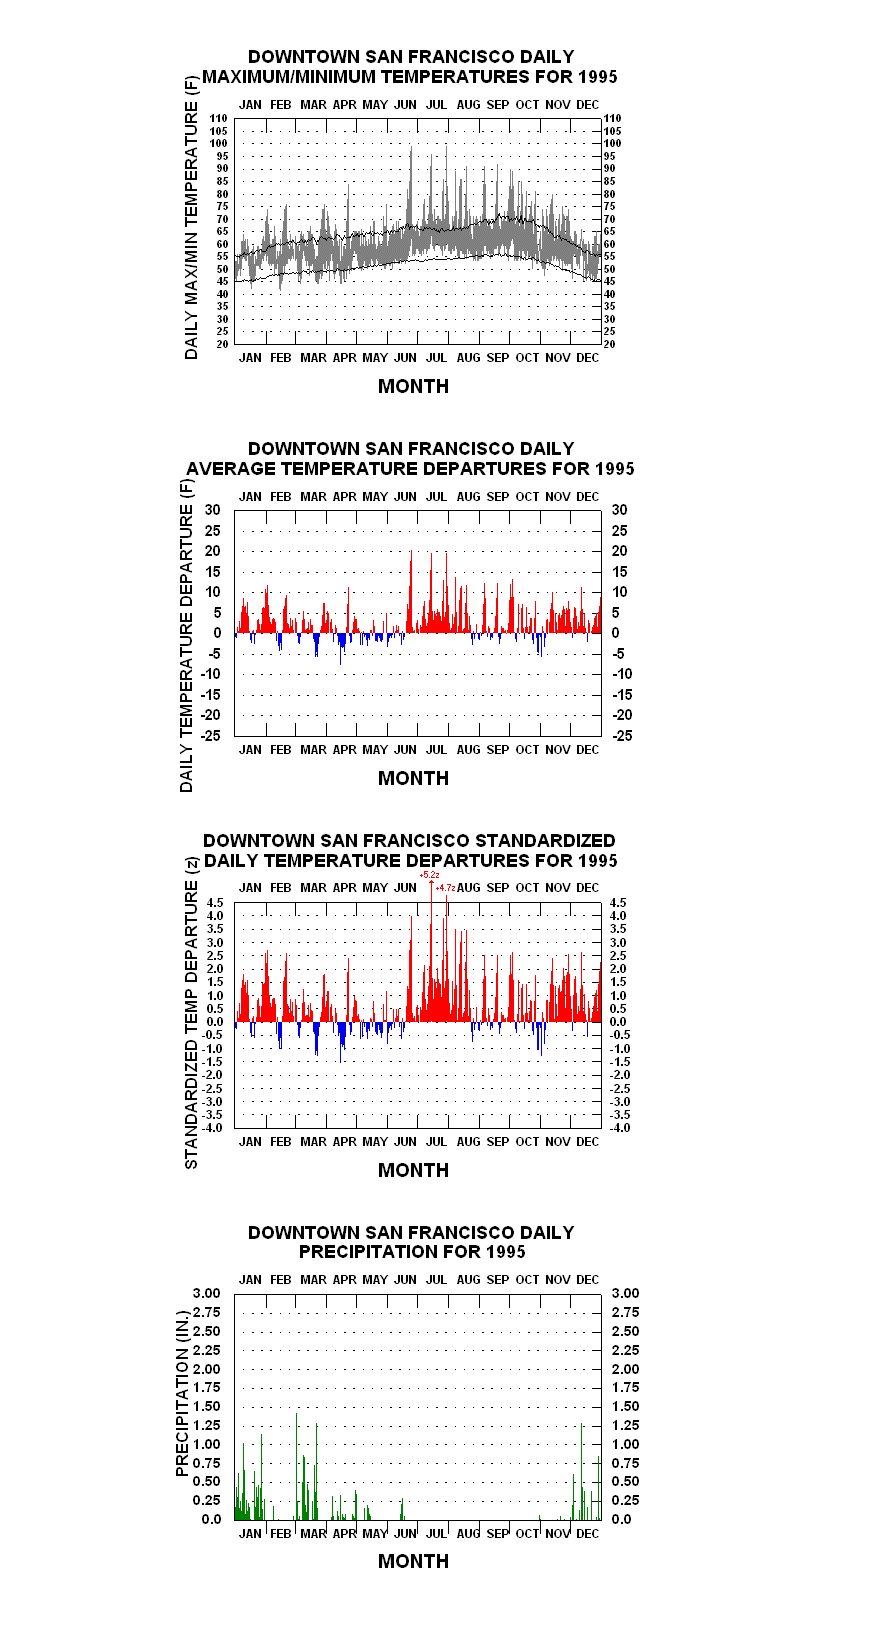
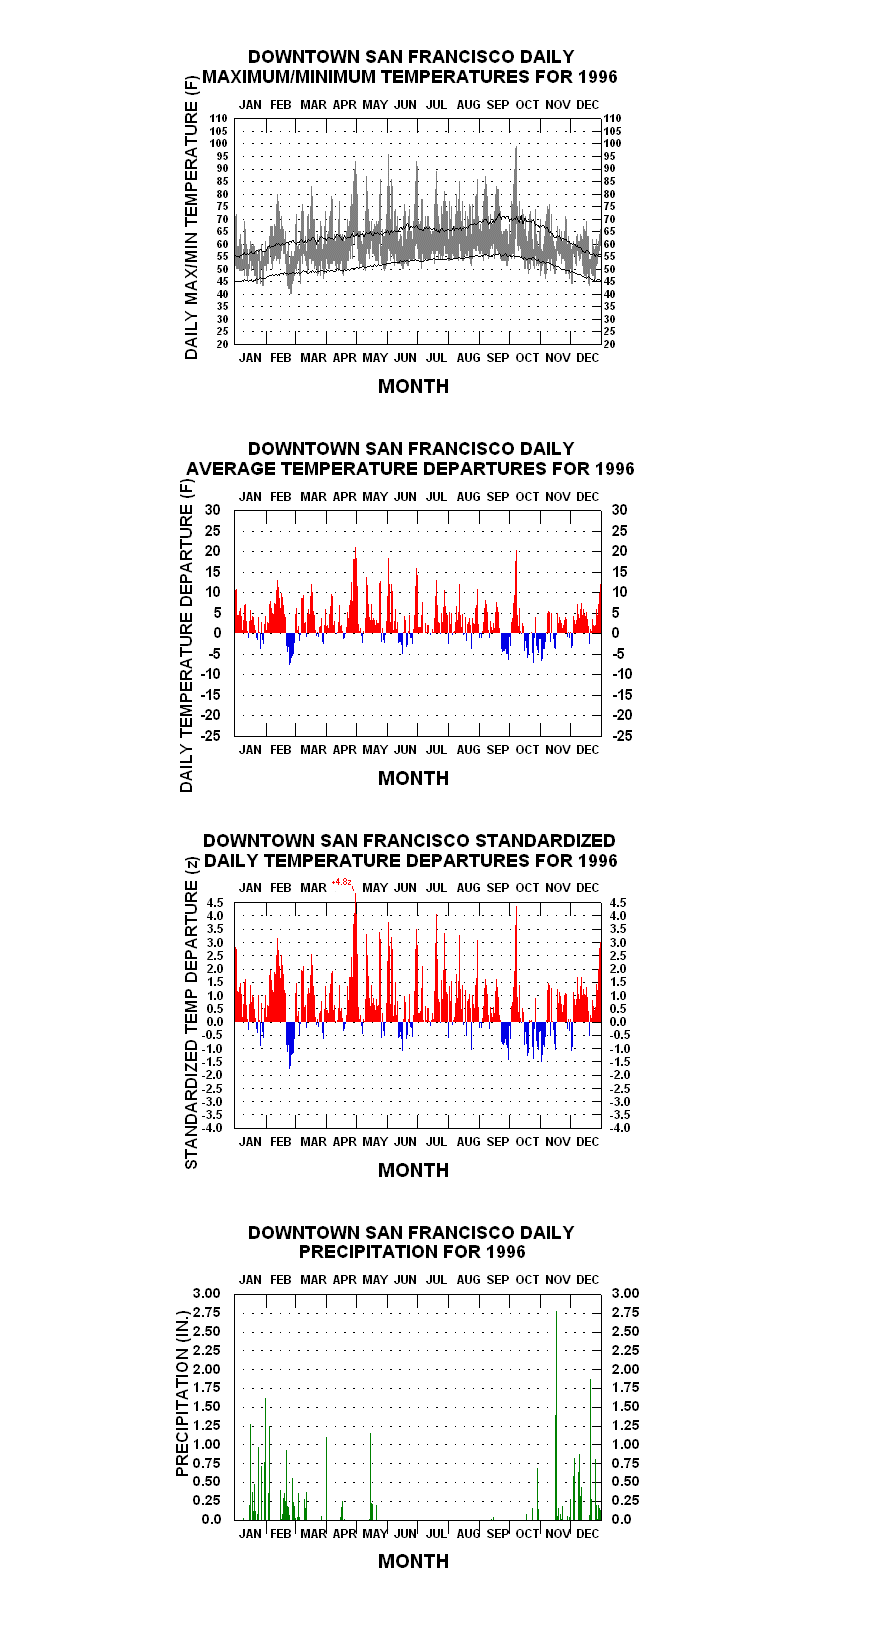
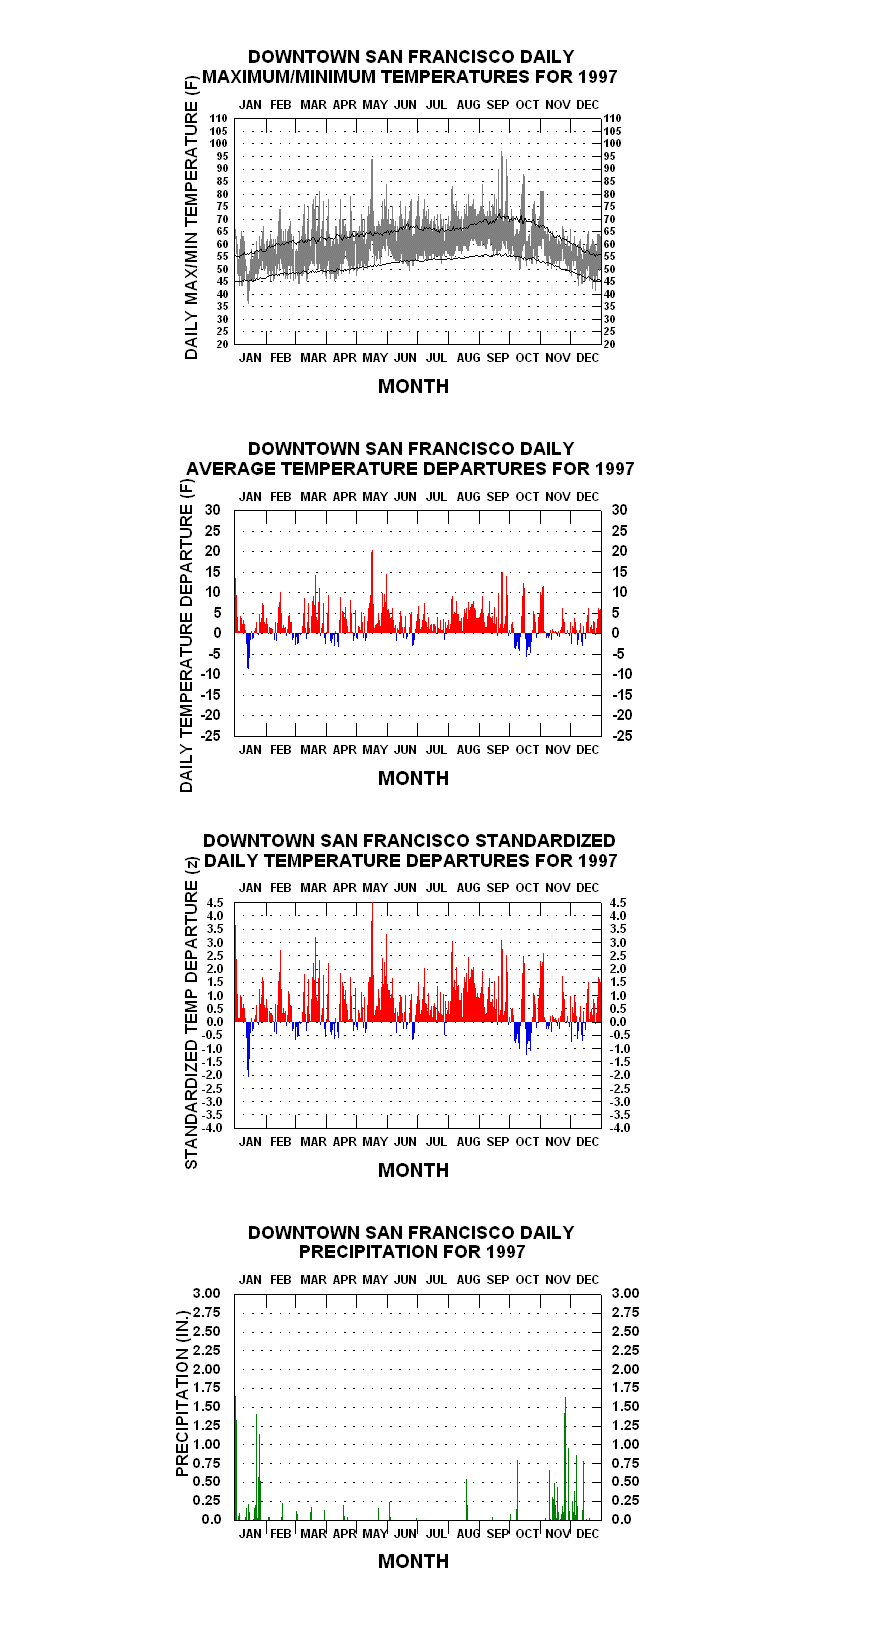
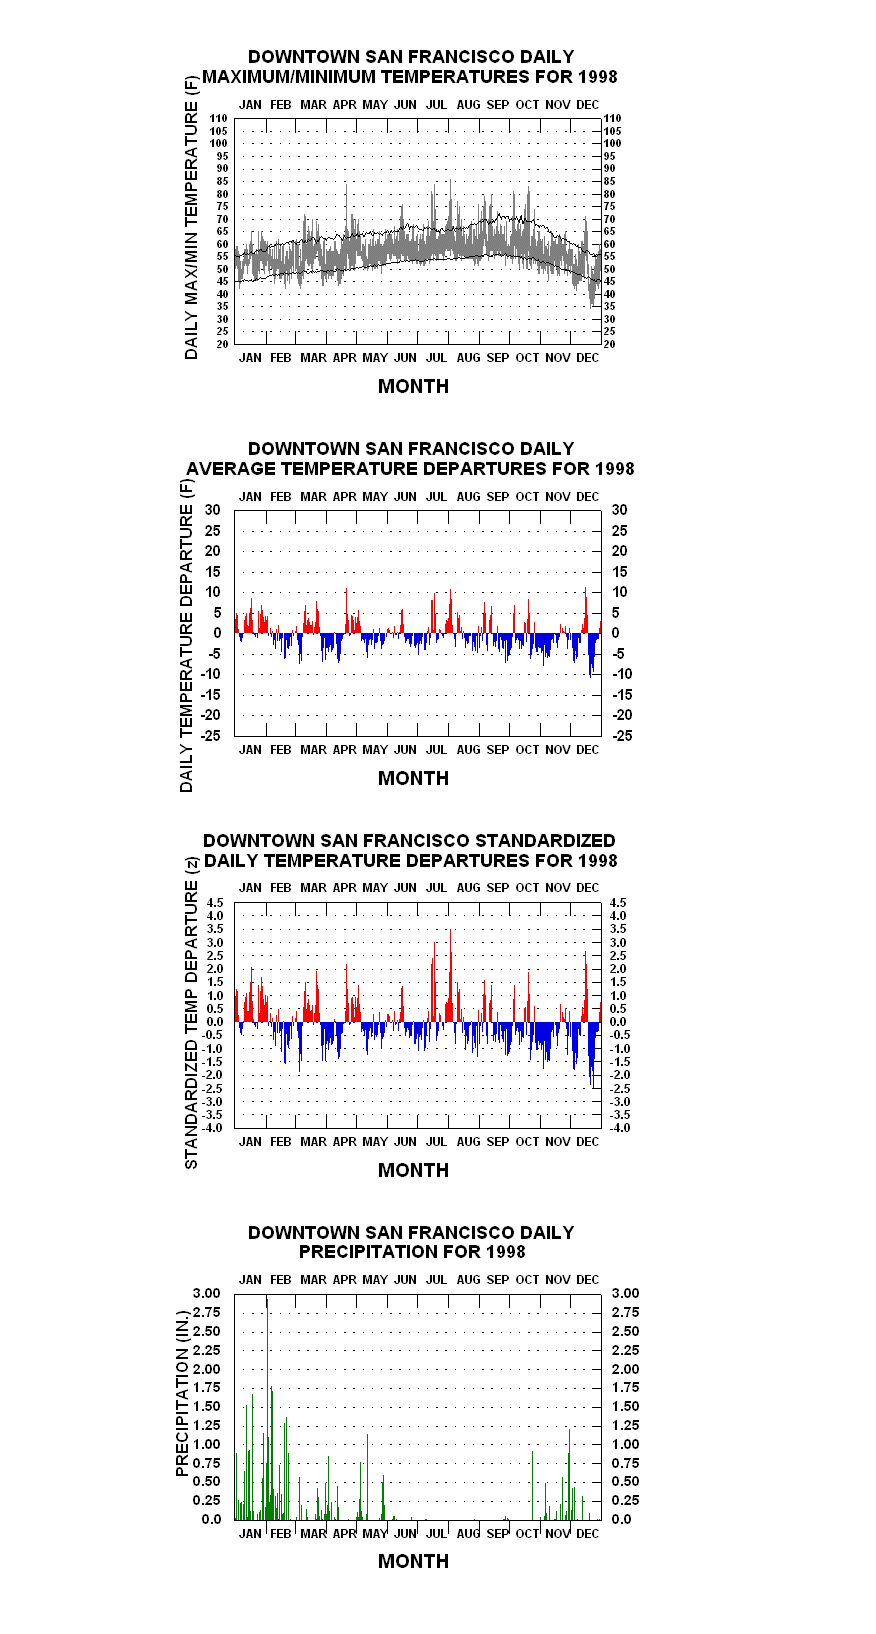
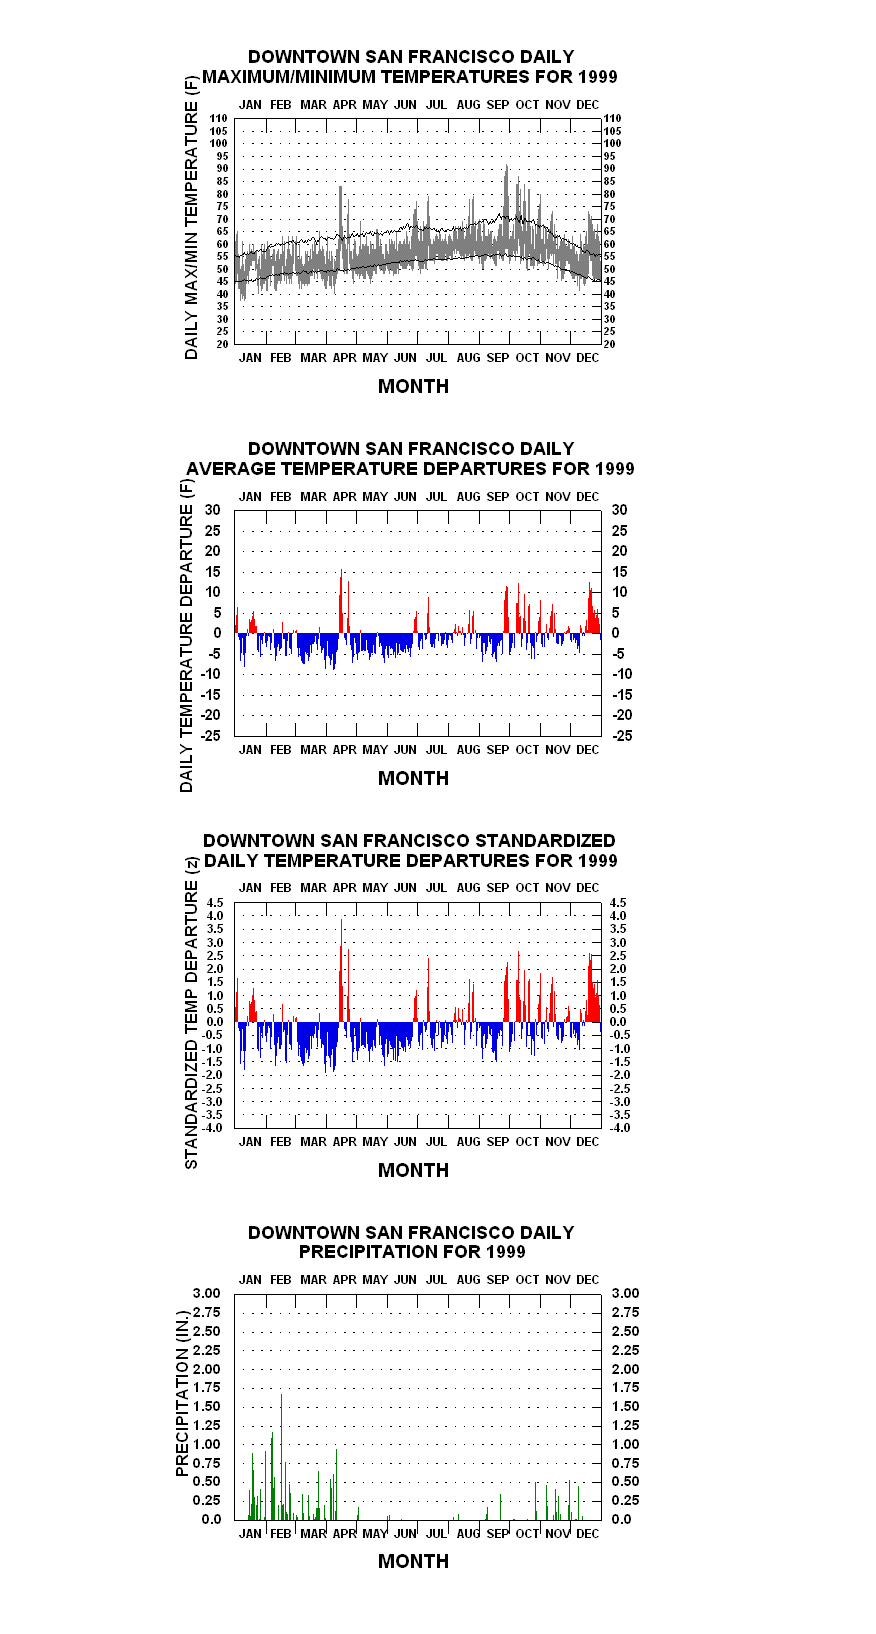
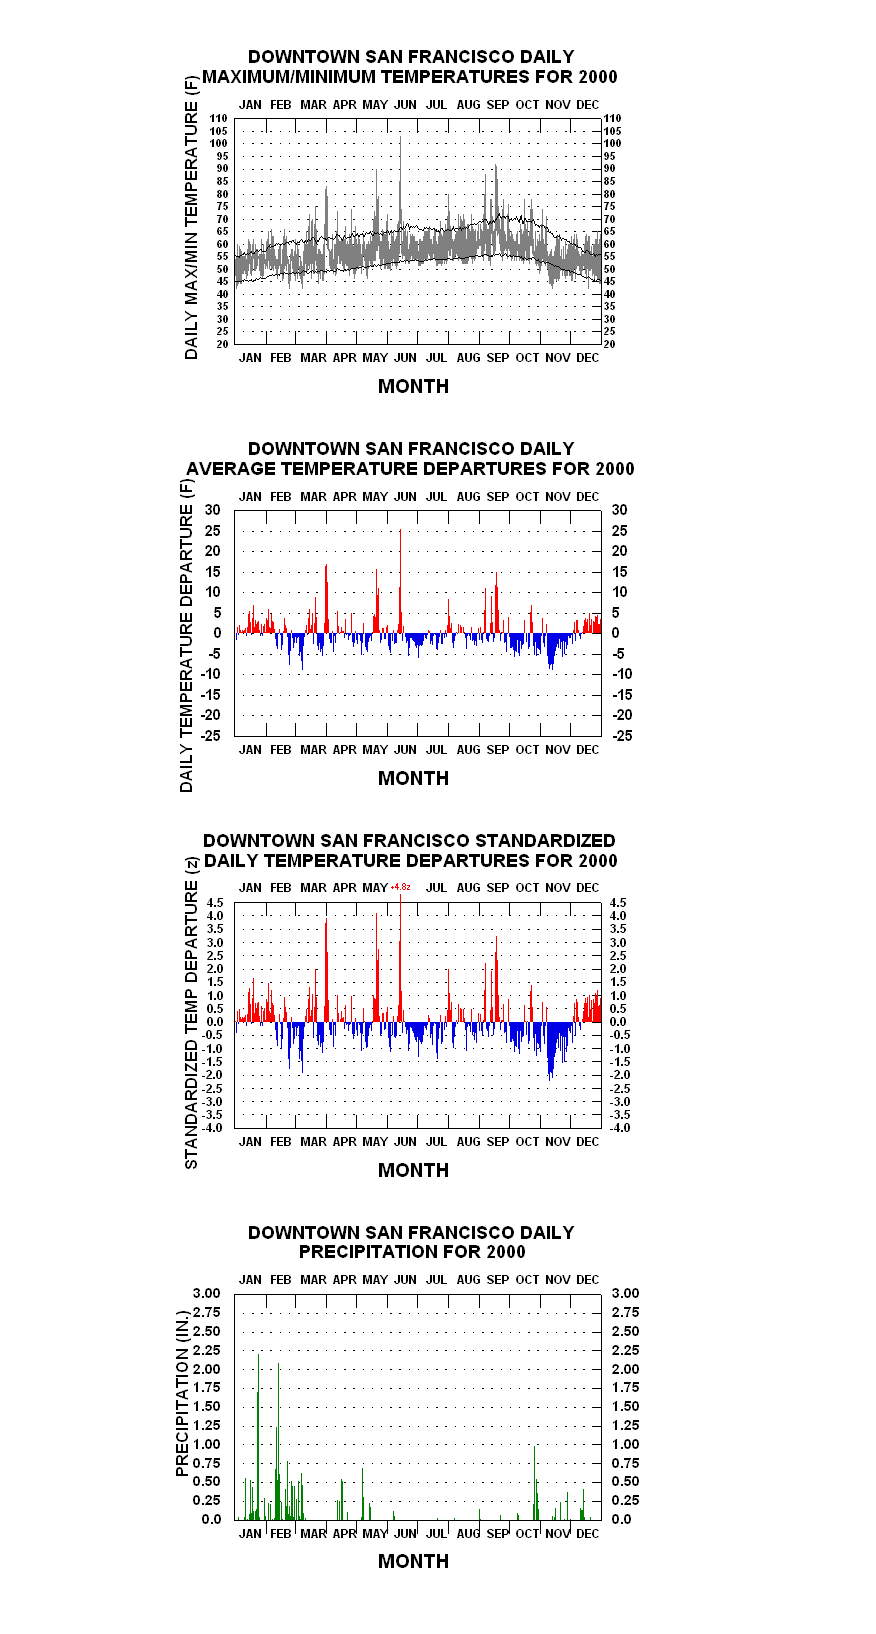
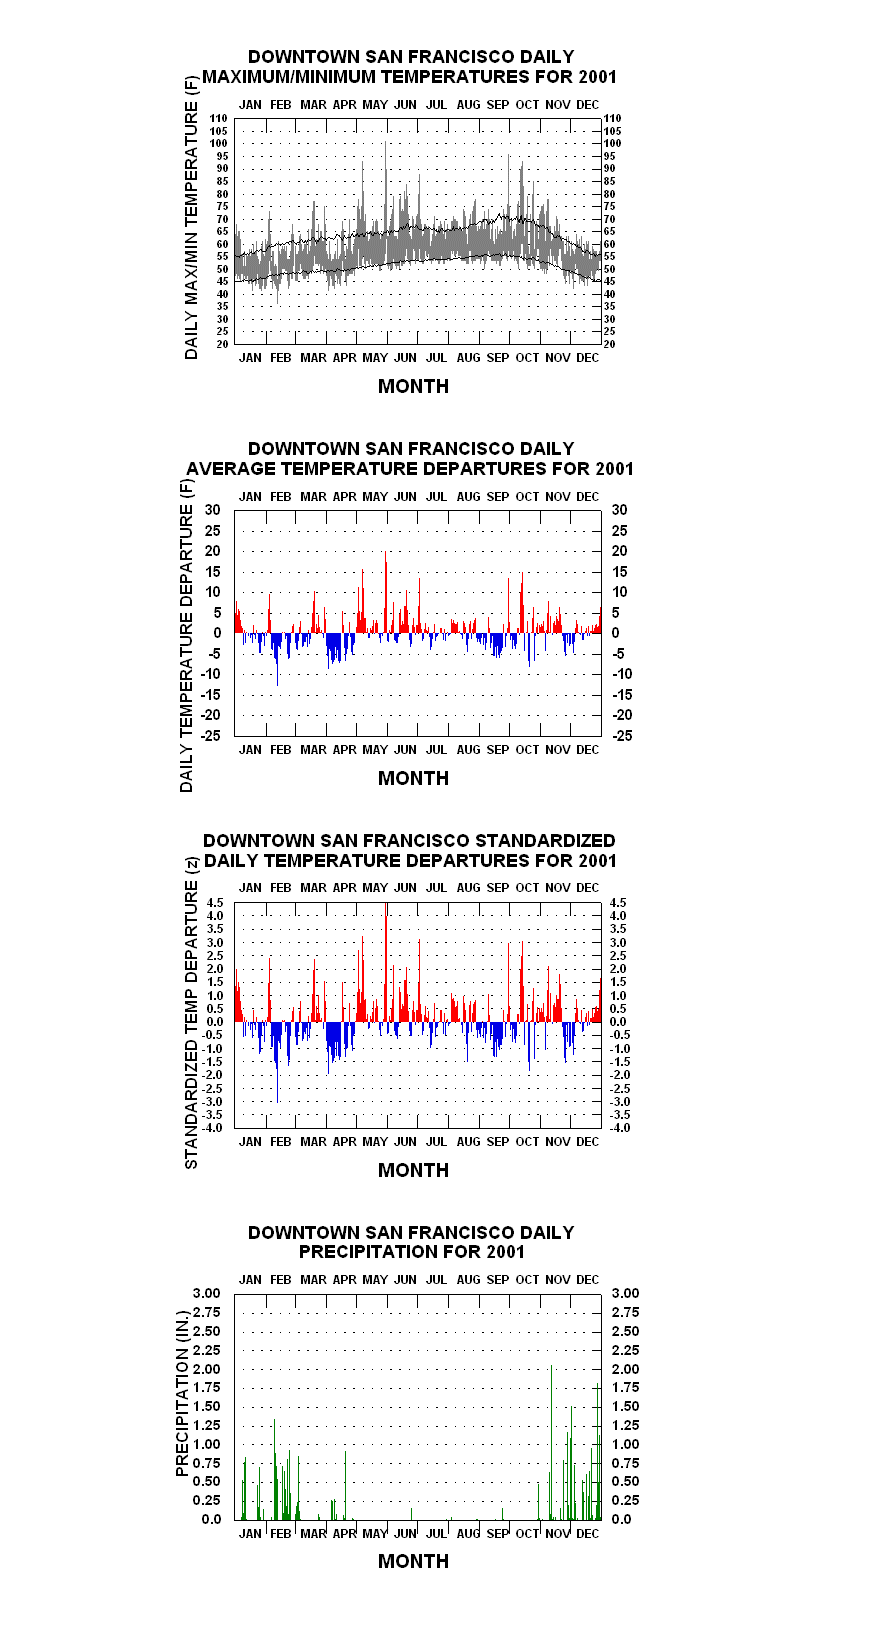
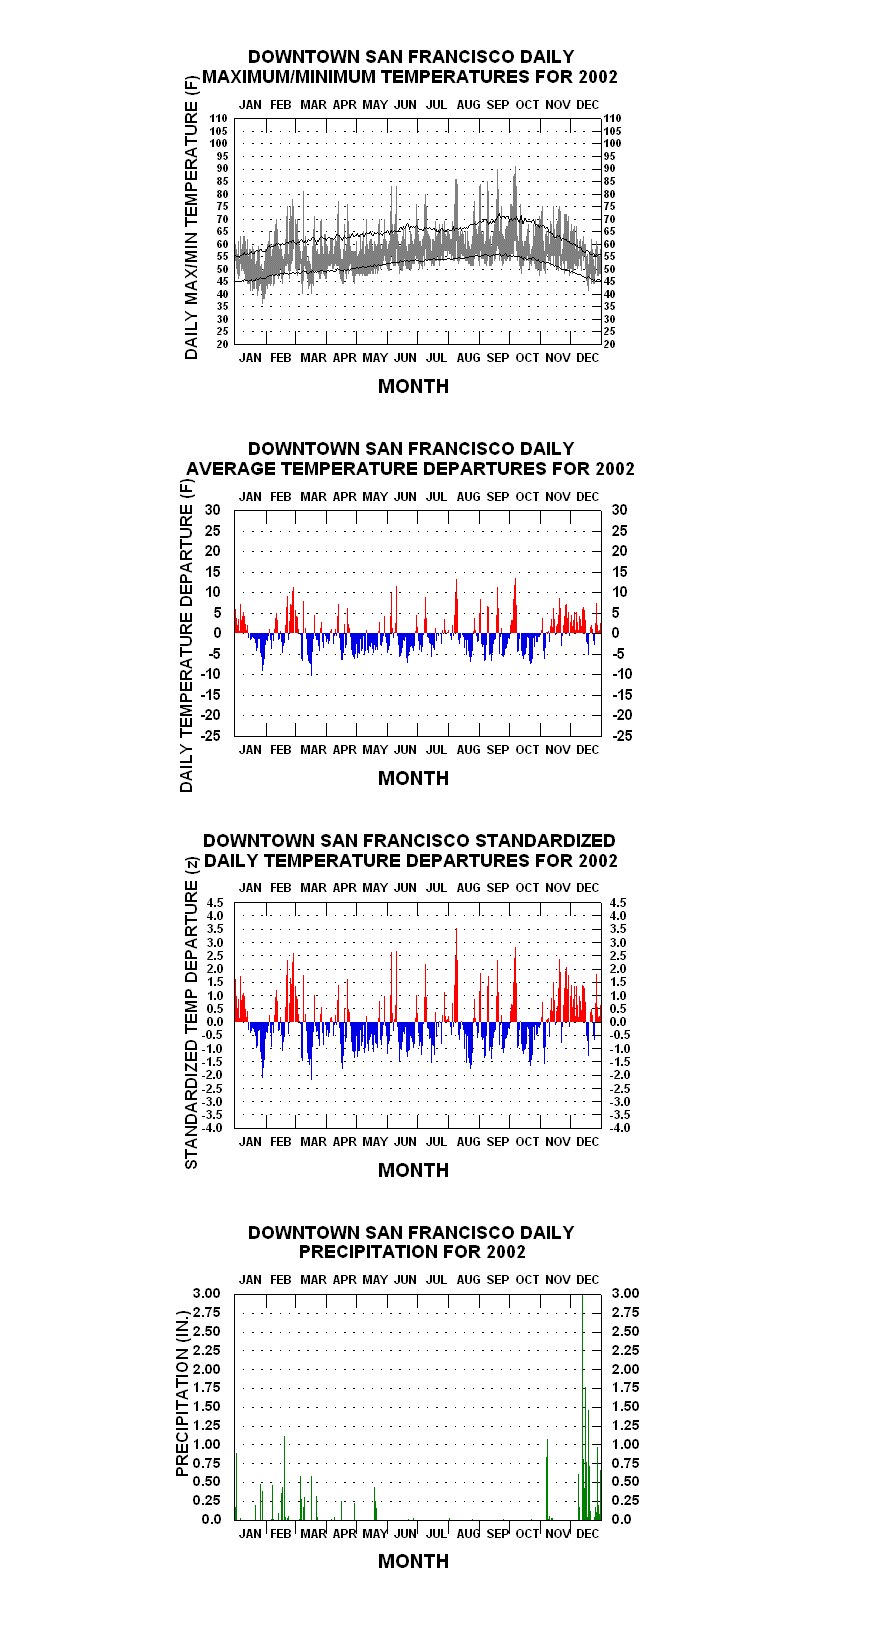
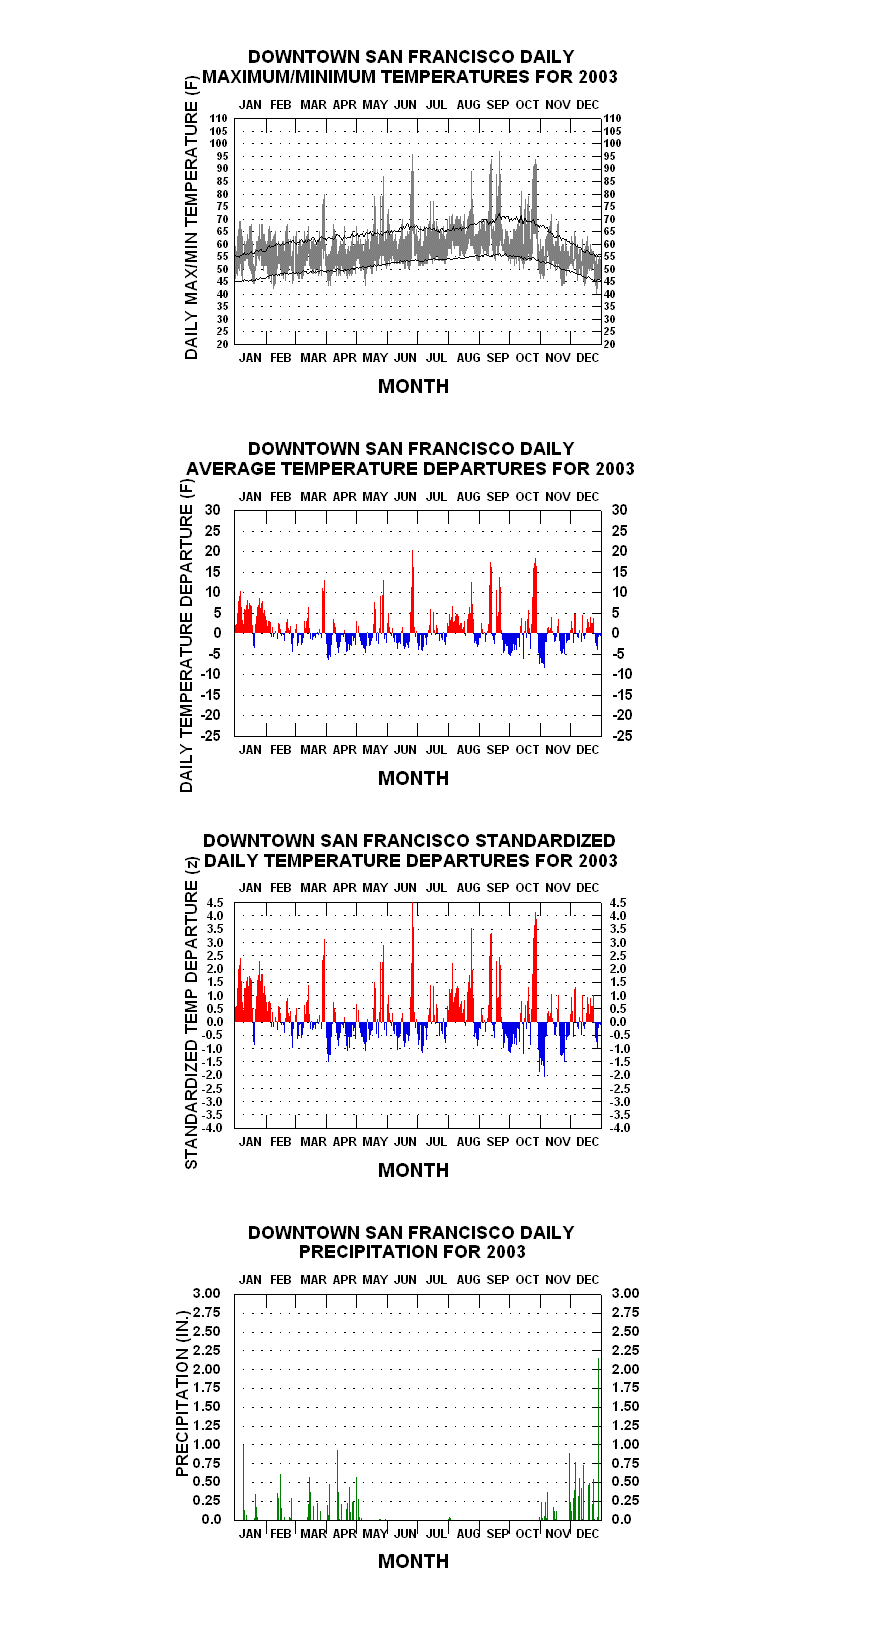
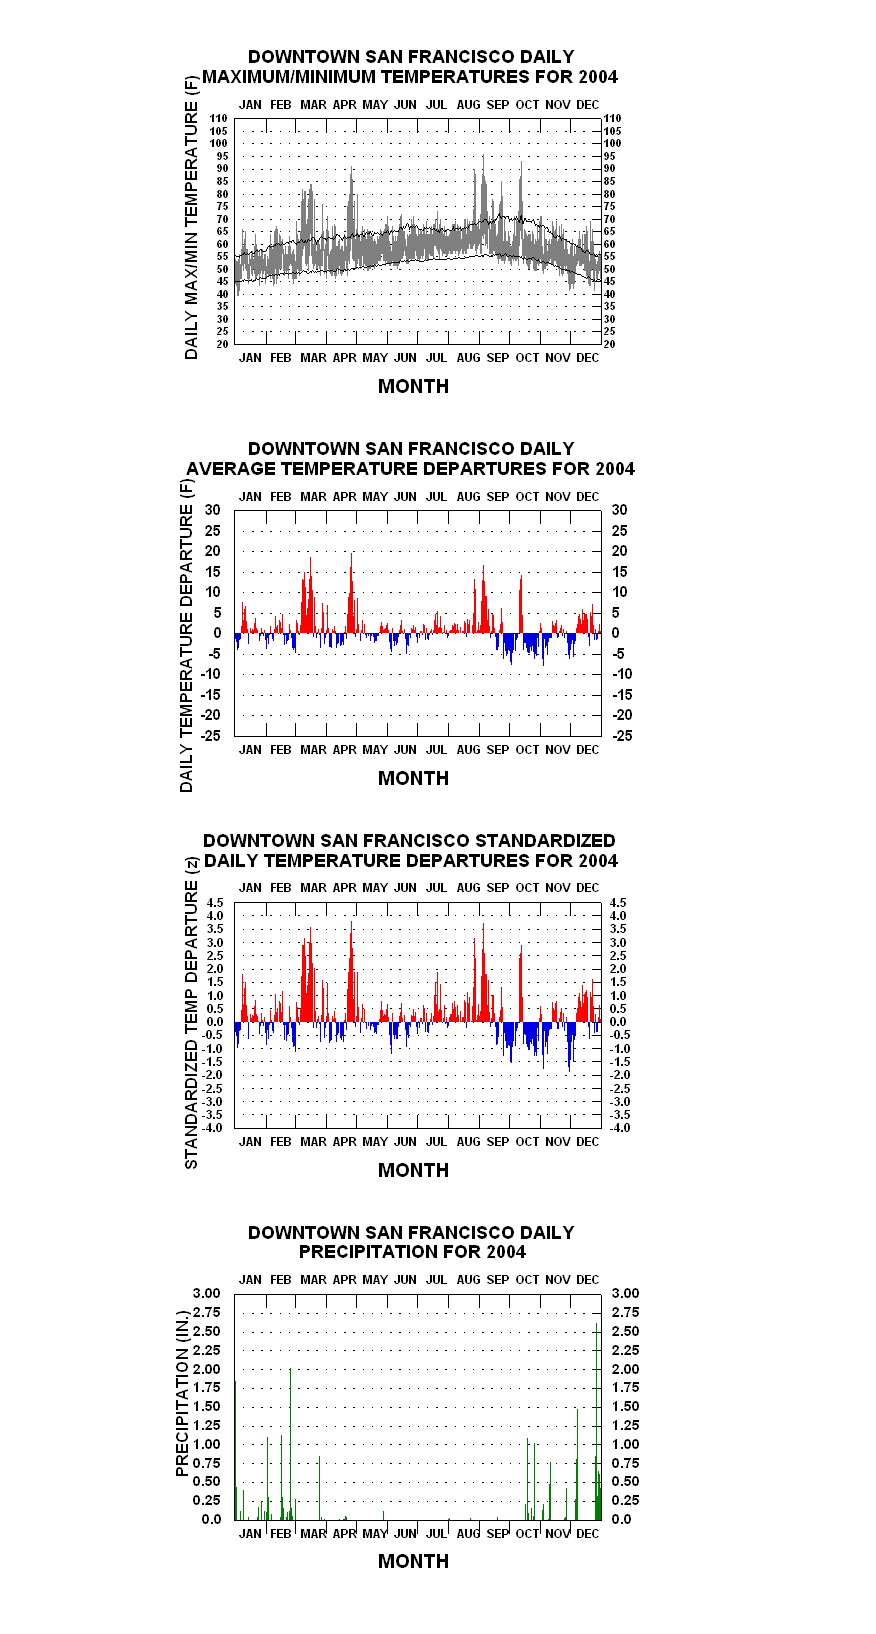
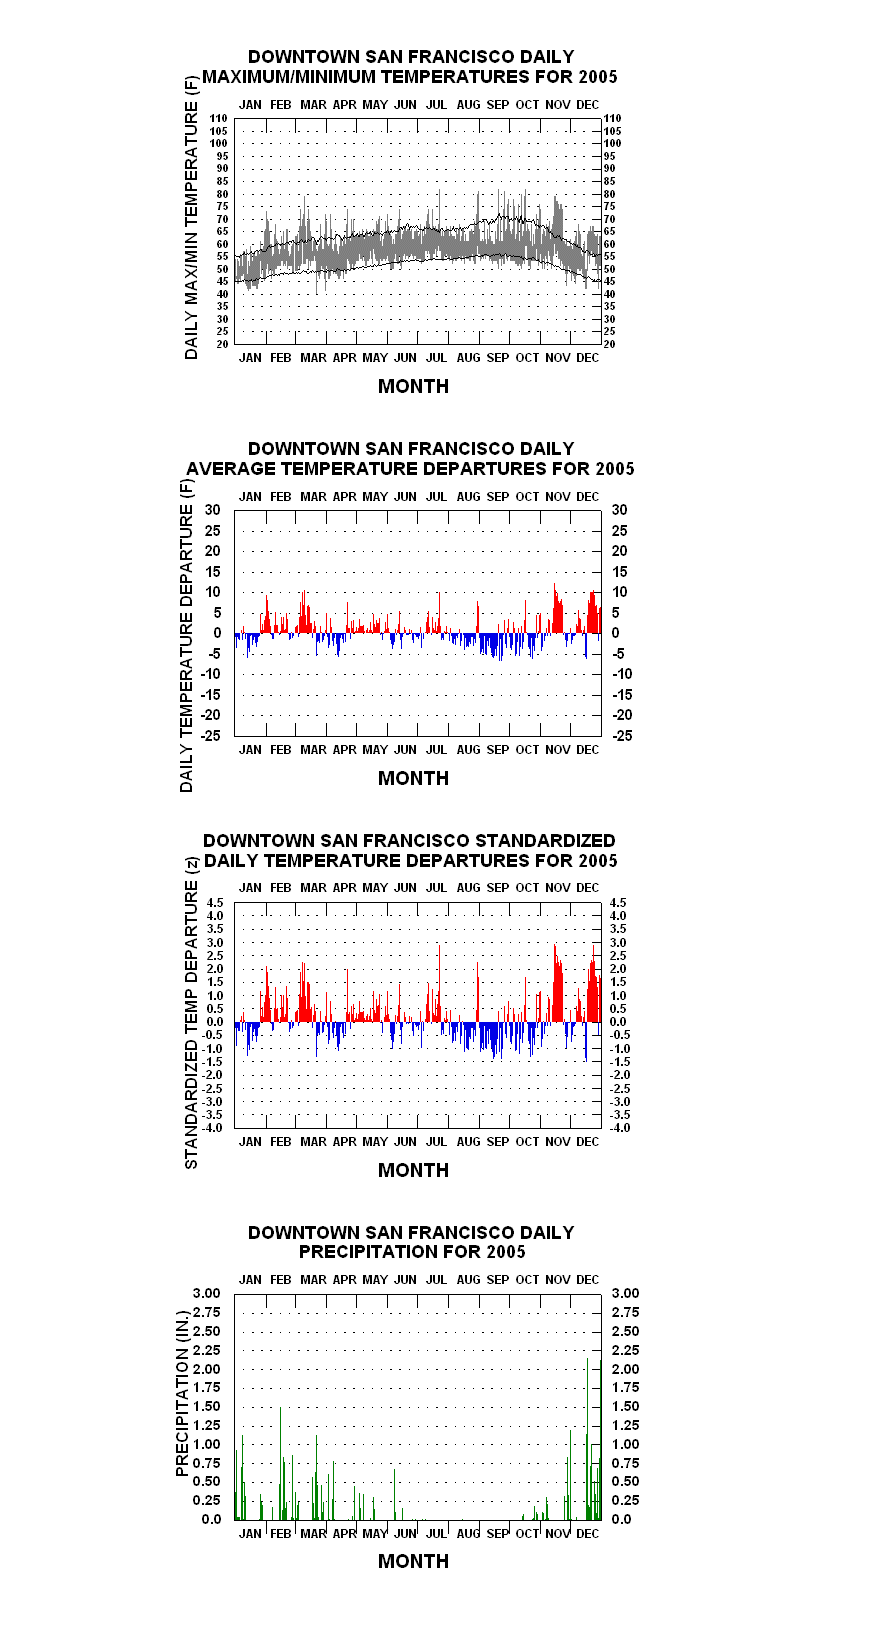
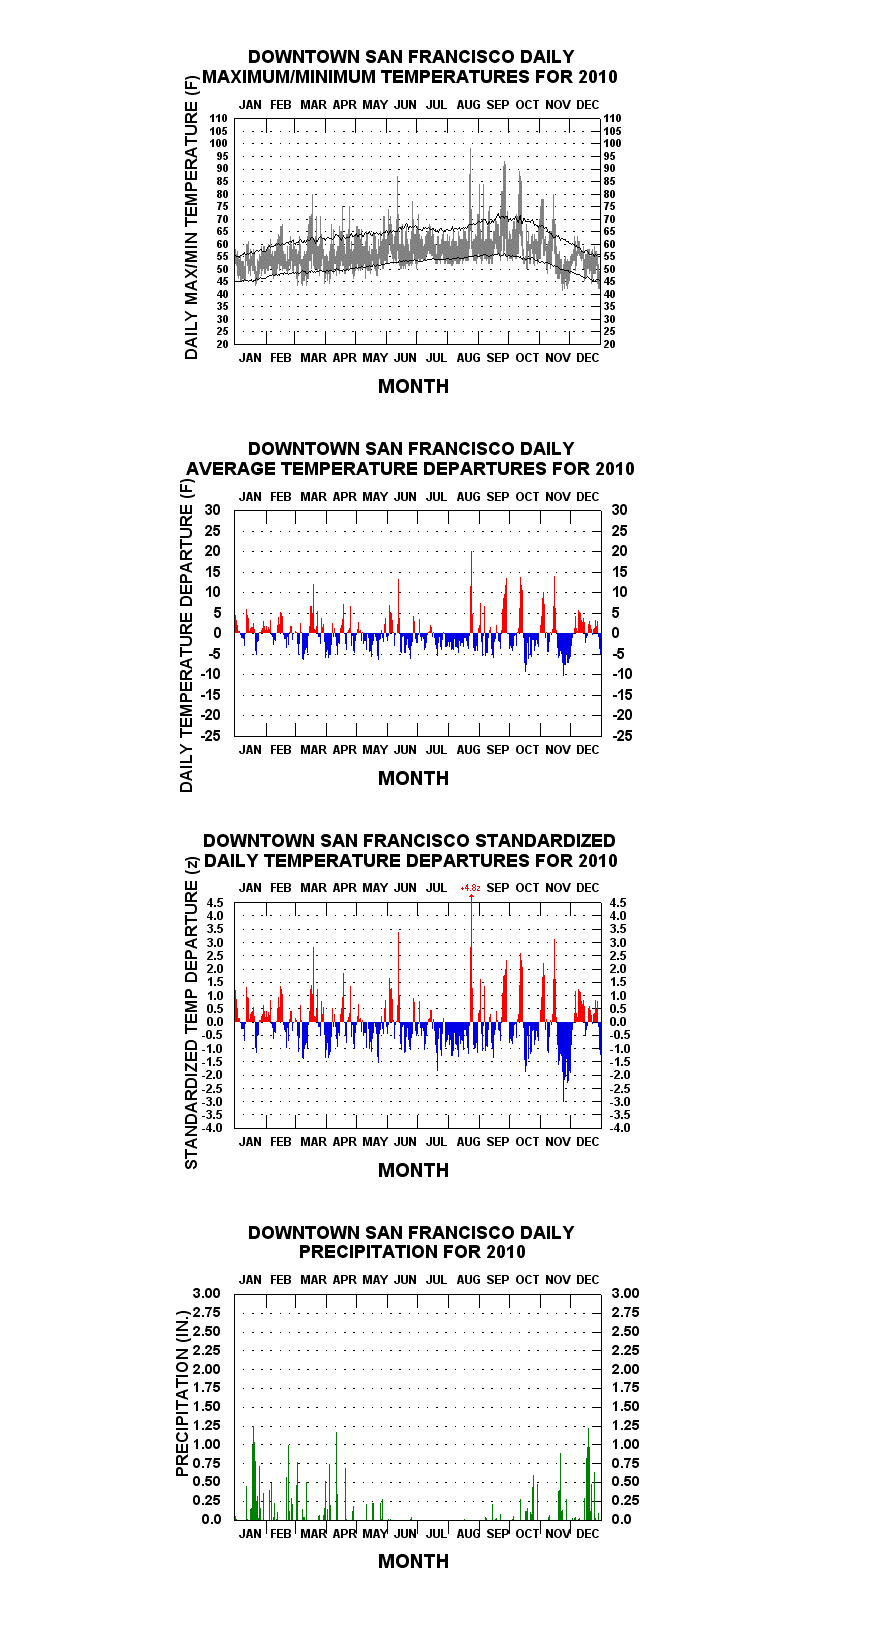
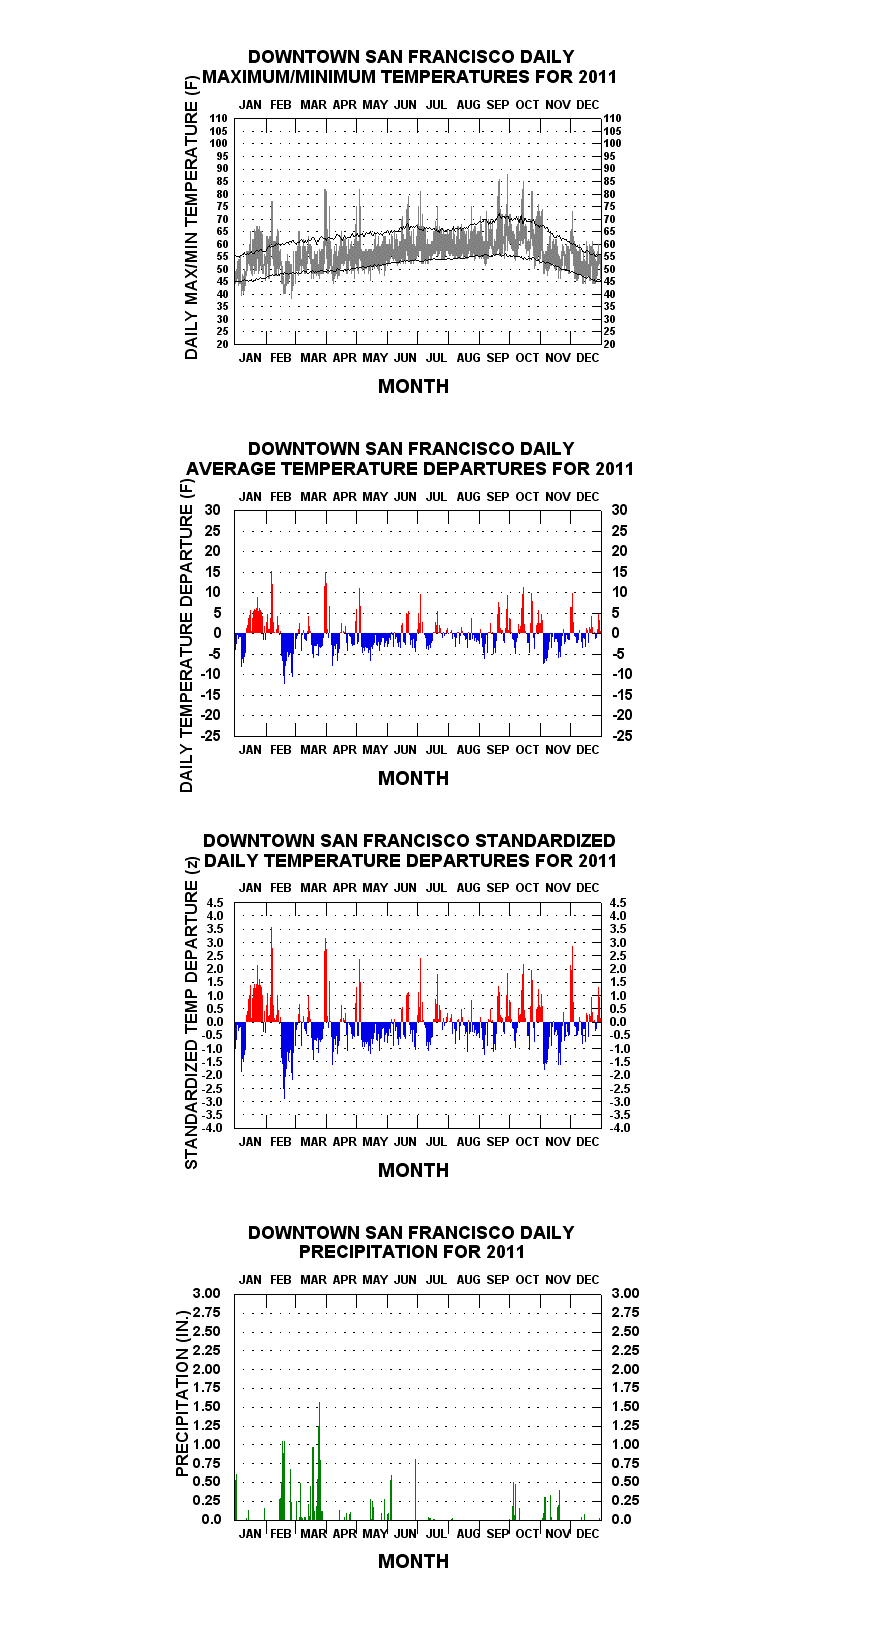
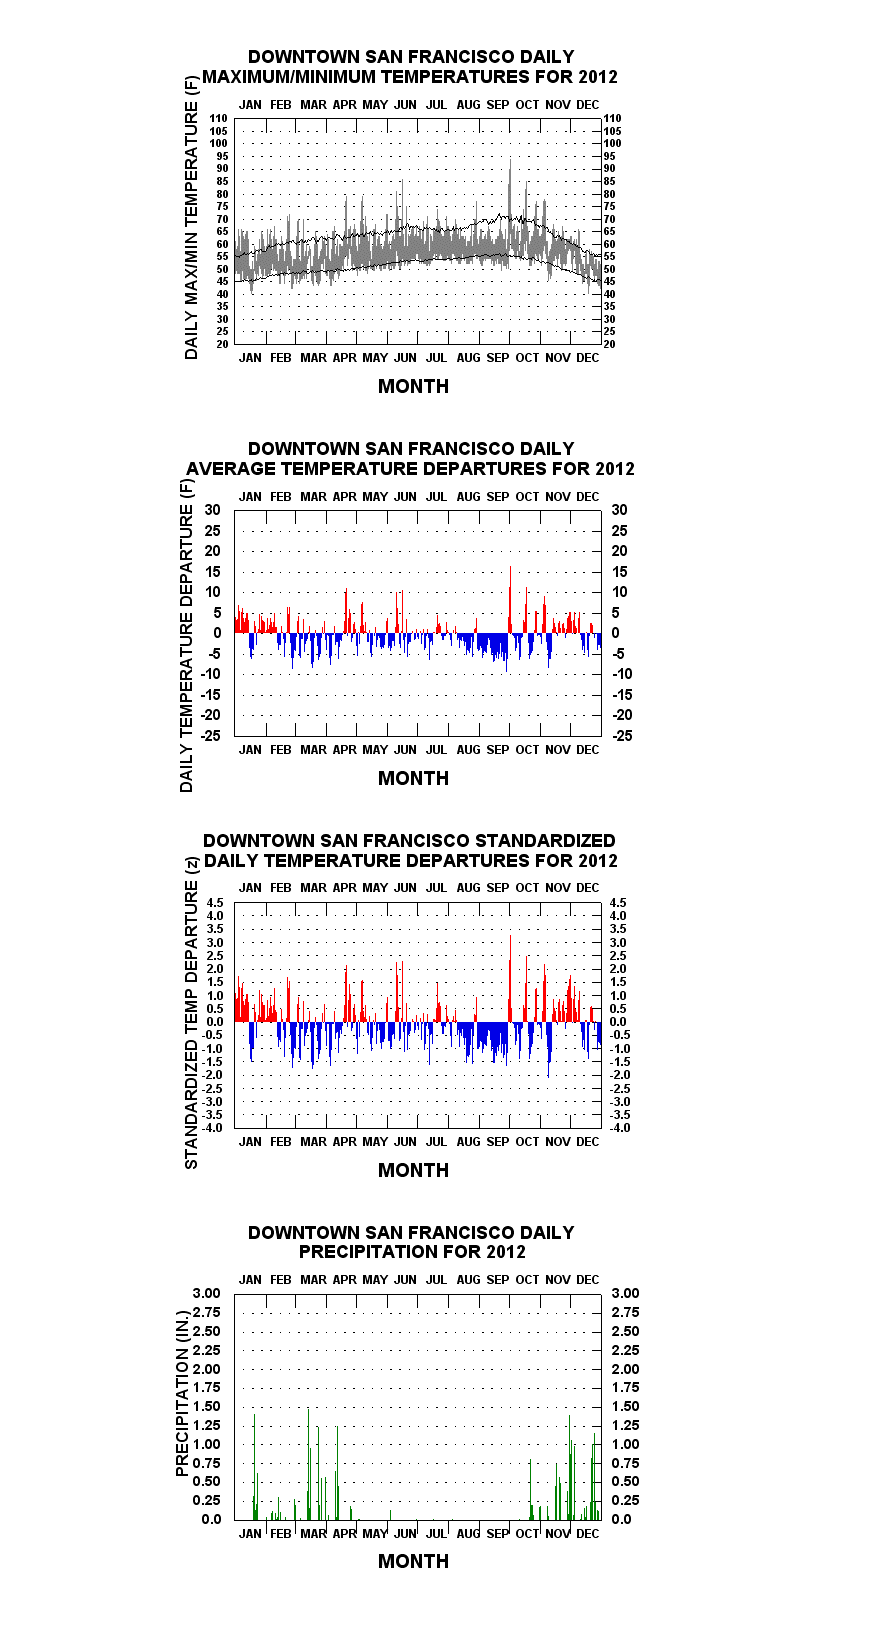
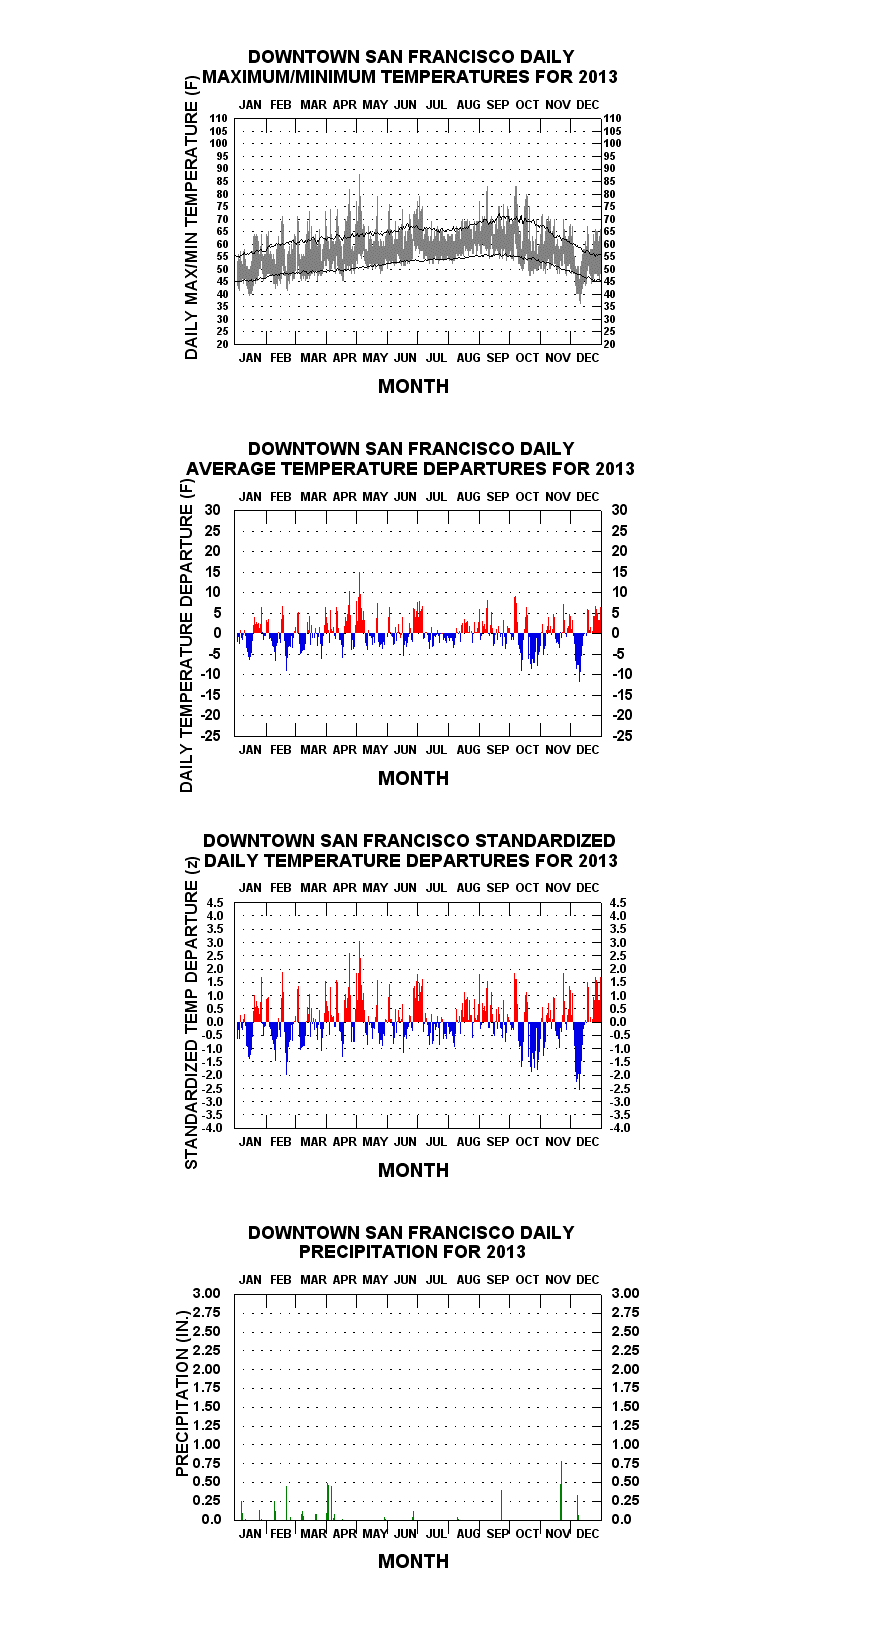
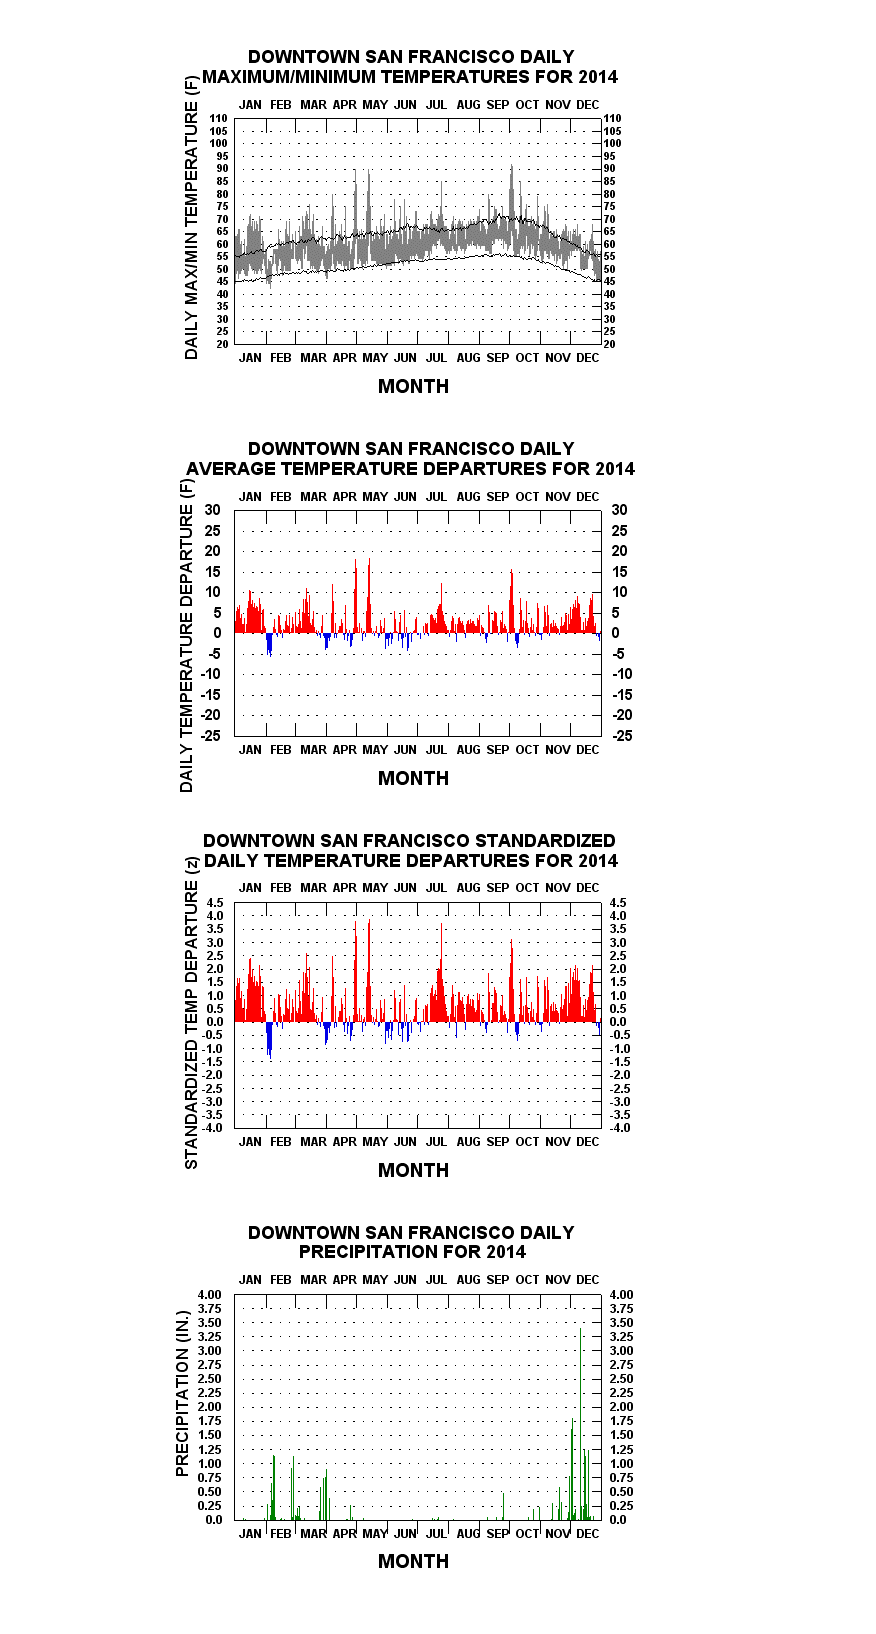
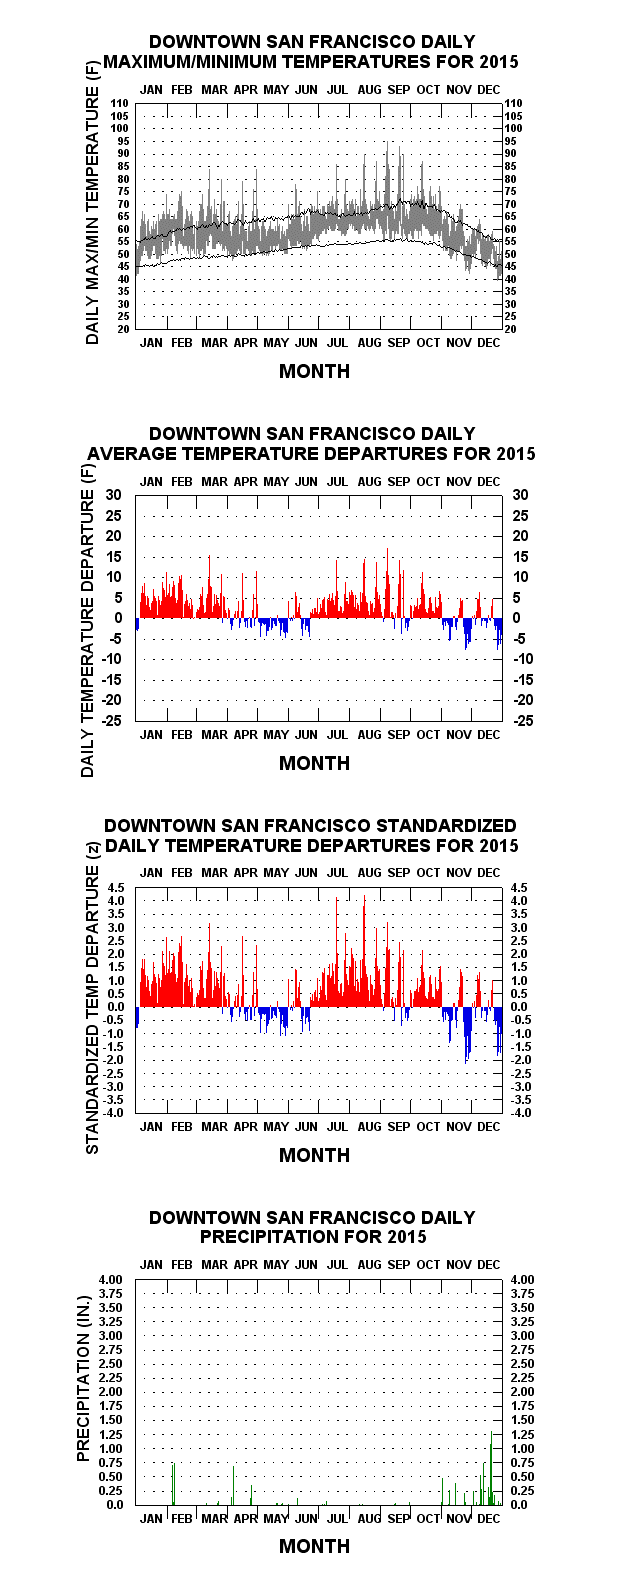
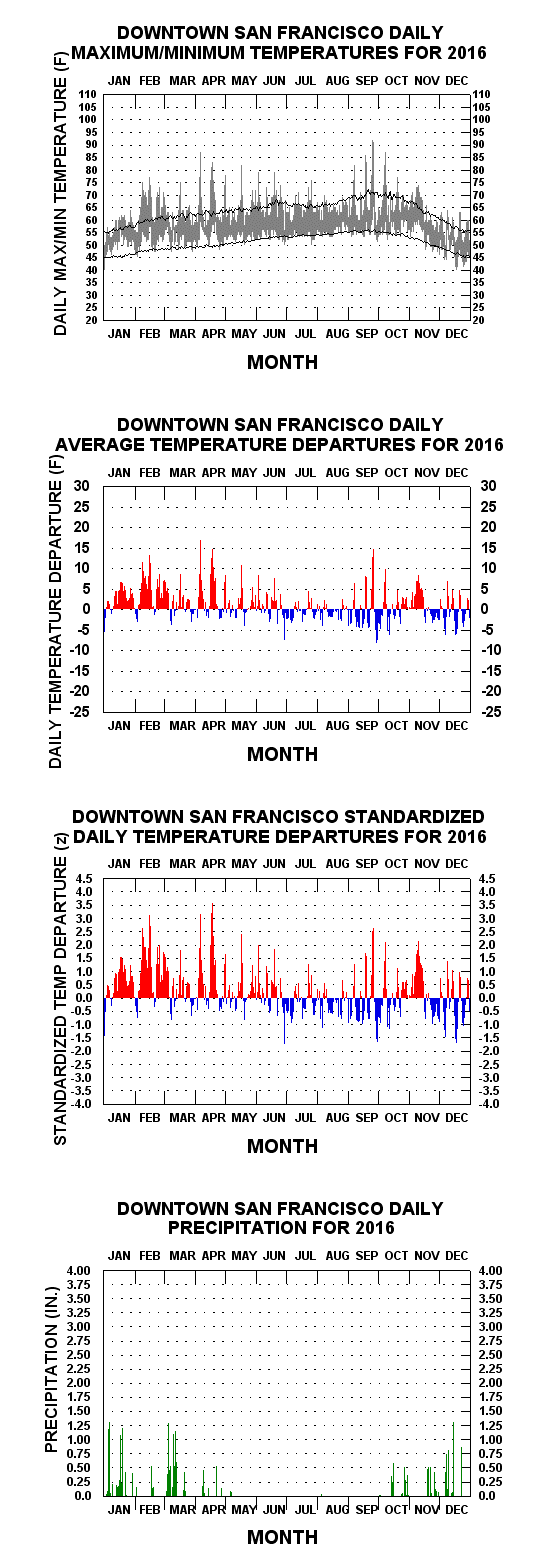
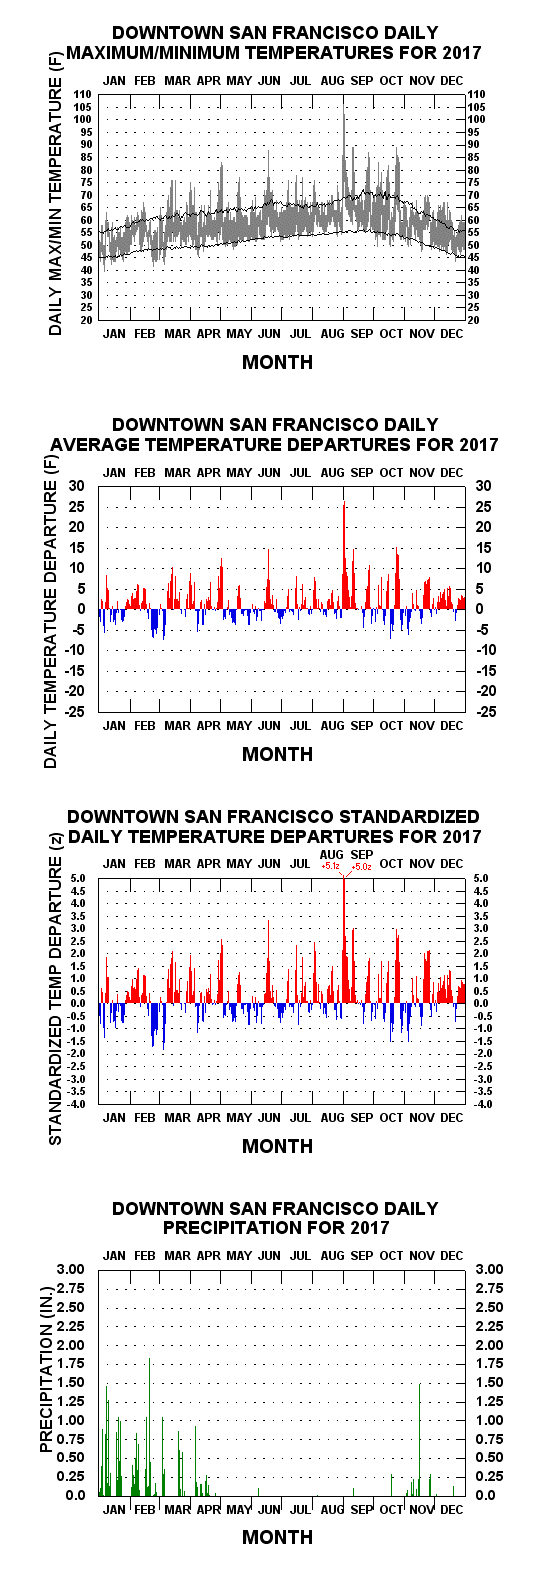
The uppermost chart for a given year’s page (accessed by the links below) are “floating-bars” of the year's daily maxima and minima temperatures. Superimposed on the bars are two line traces, the upper one connecting 1875 to present mean daily maxima, the lower one mean daily minima. The bars depict the varying diurnal, synoptic, long-wave, seasonal, and sea-surface temperature influences on San Francisco temperature over time.
The second chart down shows the day-to-day mean temperature anomalies (daily mean temperature less the day's respective long-term climatological mean). Vertical lines extending upward from the zero line indicate above average means for the day (colored red), downward ones depicting below average ones (colored blue). In general, the most extreme departures are "positive", typically reflecting abbreviated offshore flow events, visualized as upward red "spikes".
The third chart down shows the second chart’s anomalies in deseasonalized (“standardized”) form or "z-scores" (also alternatively, "sigma"). Daily scores of plus or minus 3.0 occur just 1.9% of the time; nearly all of these (96%) positively signed, reflecting the extreme warming offshore flow events described above. Magnitudes can reach spectacularly high positive magnitudes, well above 3.0 z. Greatest positive in the record is +6.0 z for 17 July 1988 , greatest negative –5.1 z for 11 December 1932 .
The bottom chart depicts daily precipitation totals, as high as 5.54 inches (5 November 1994 ).
(Note: Clicking on the floating-bar charts a second time after they appear on the screen will enlarge them even further).
Year-To-Year Graphs — OLDER YEARS
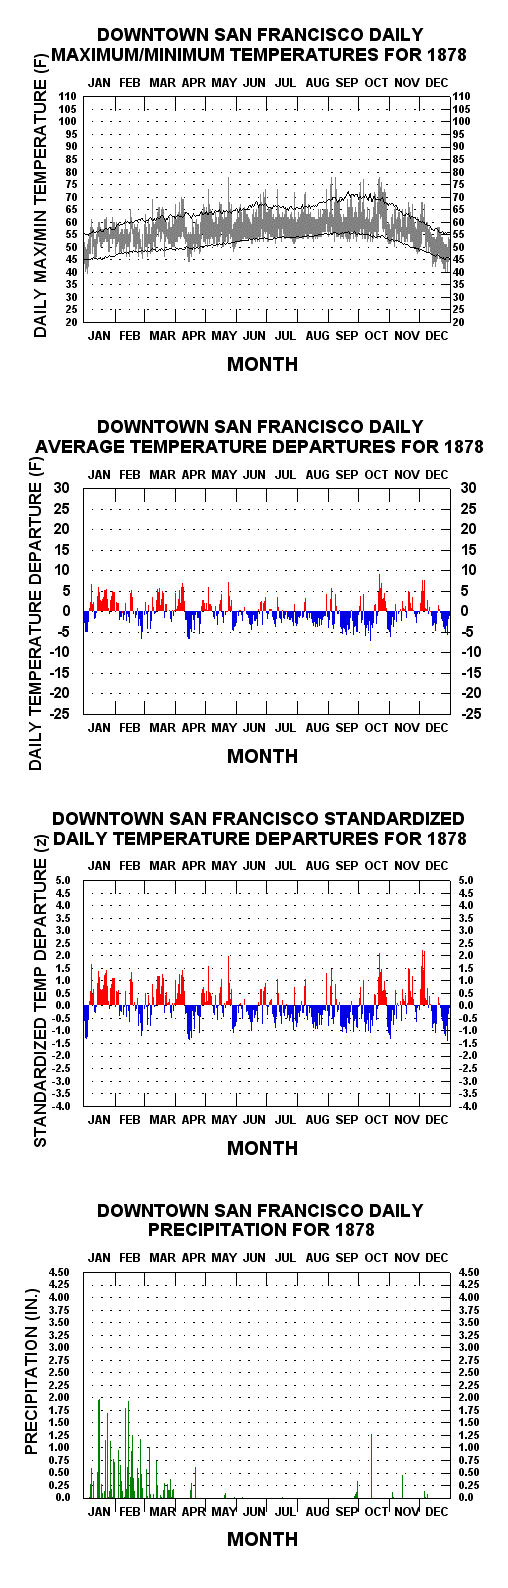
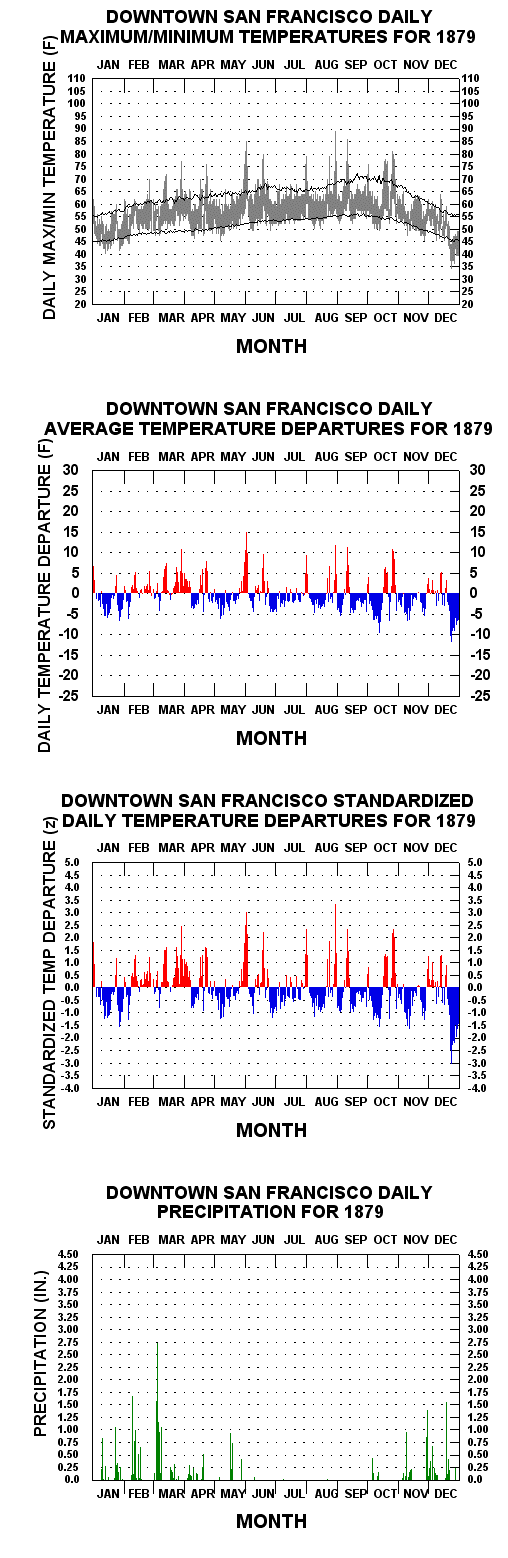
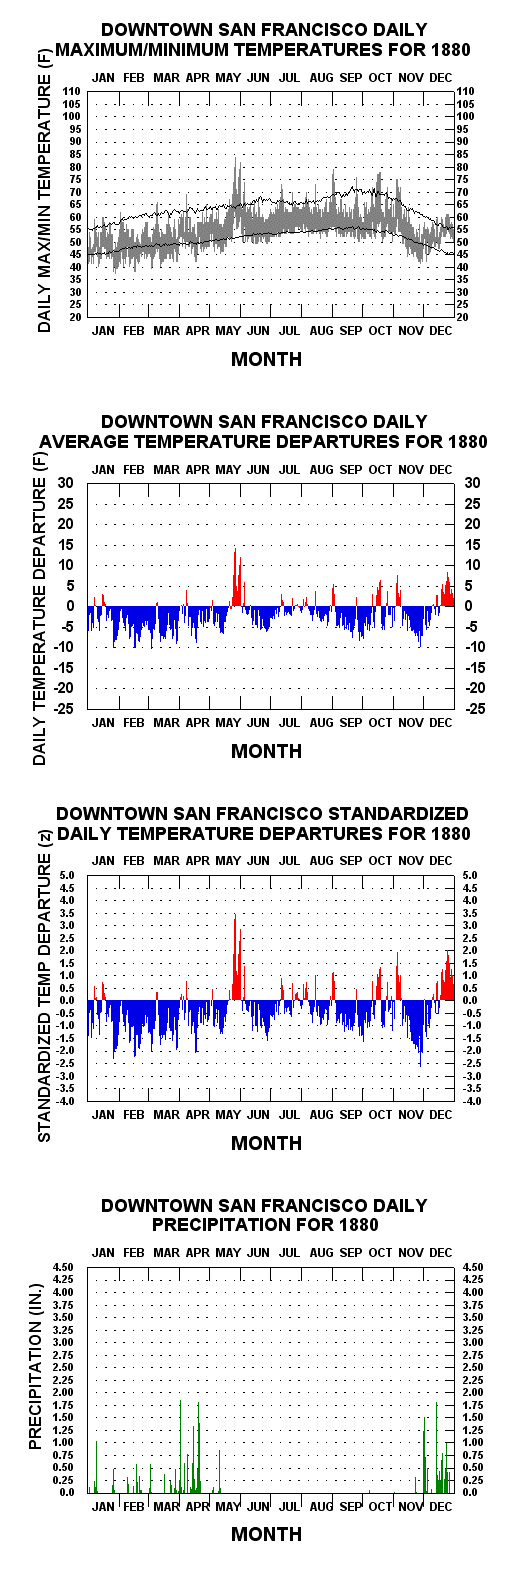
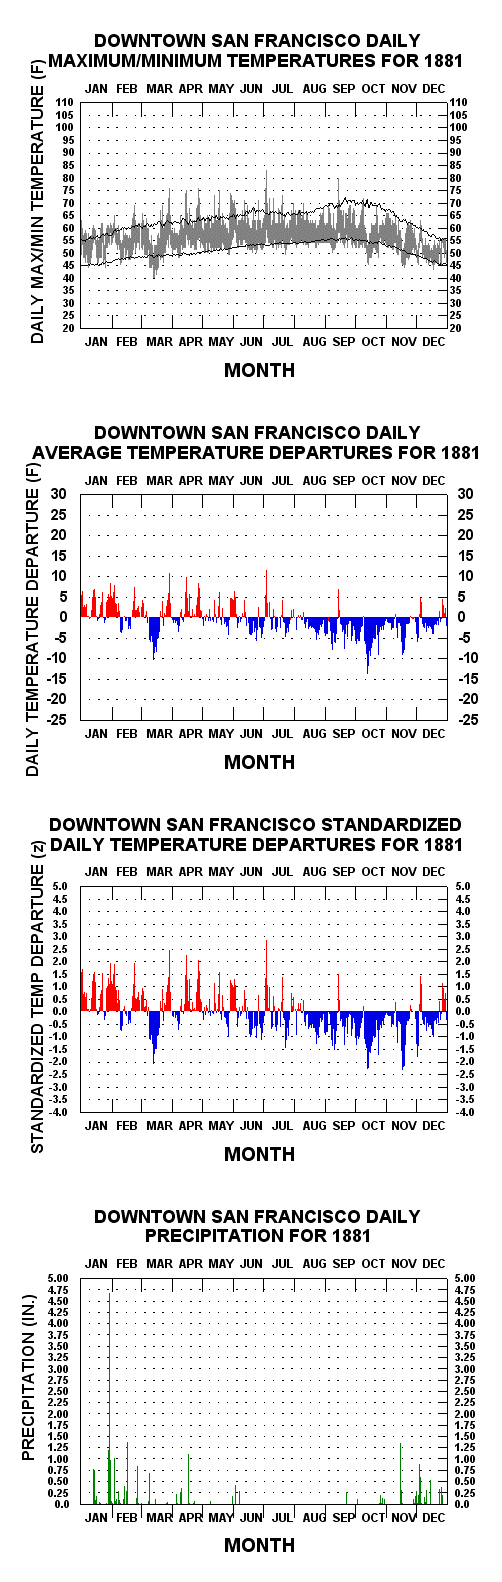
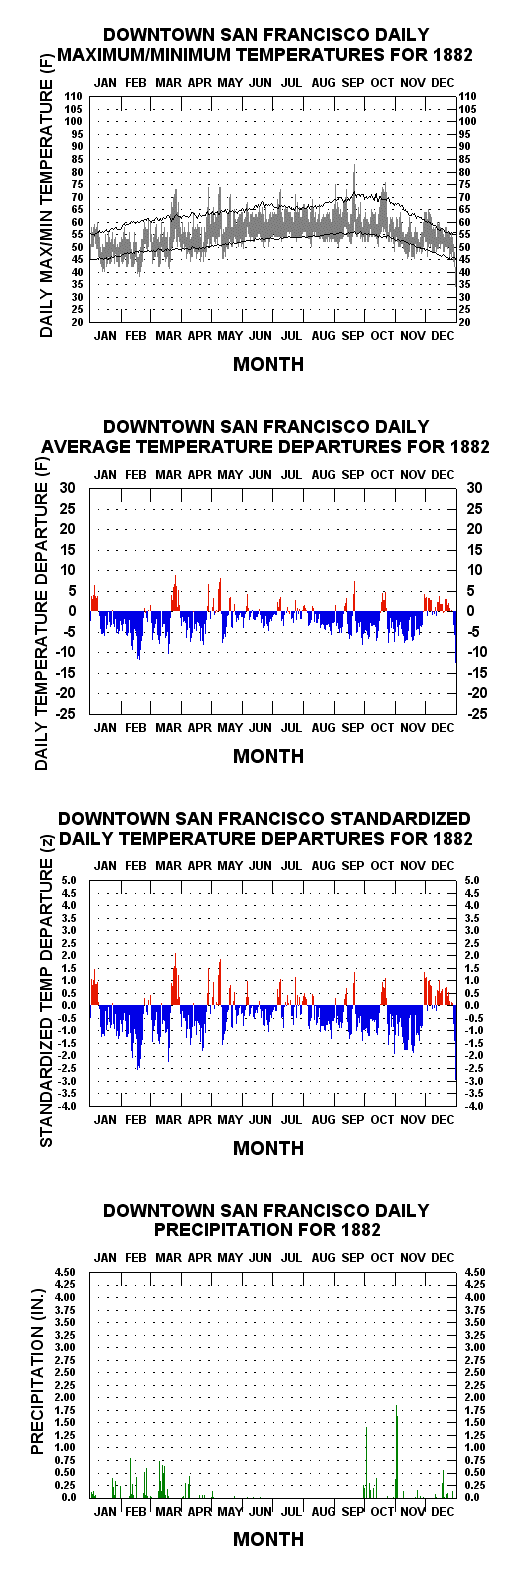
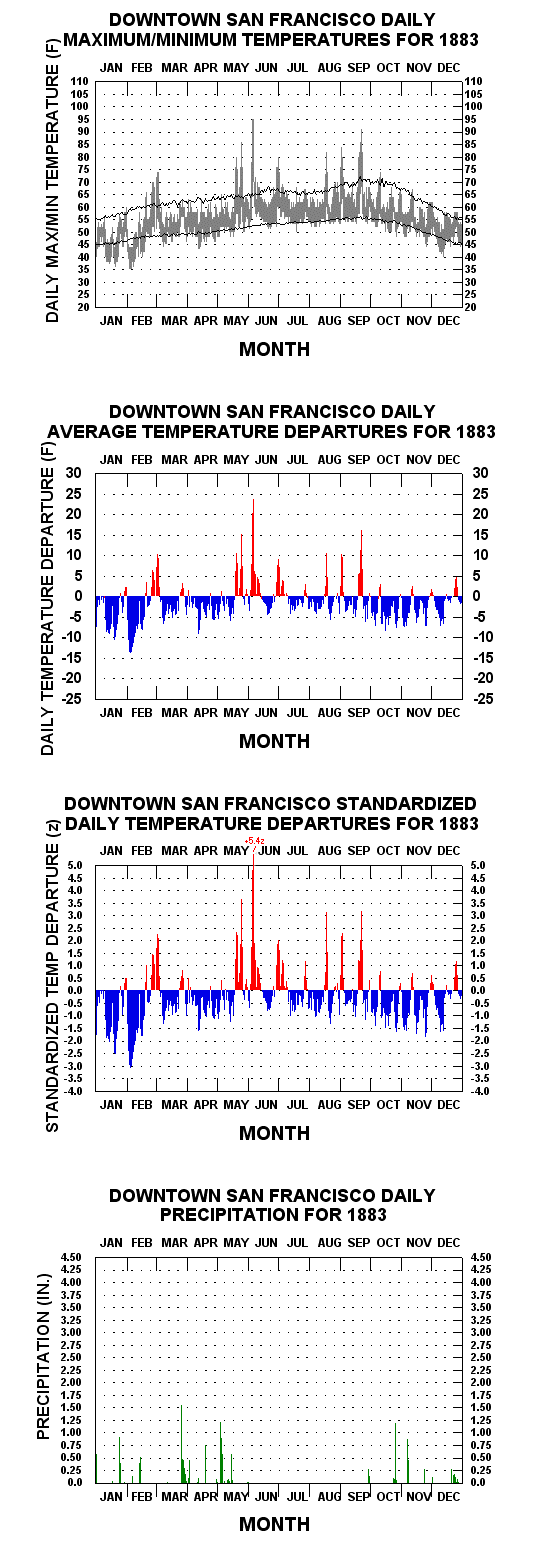
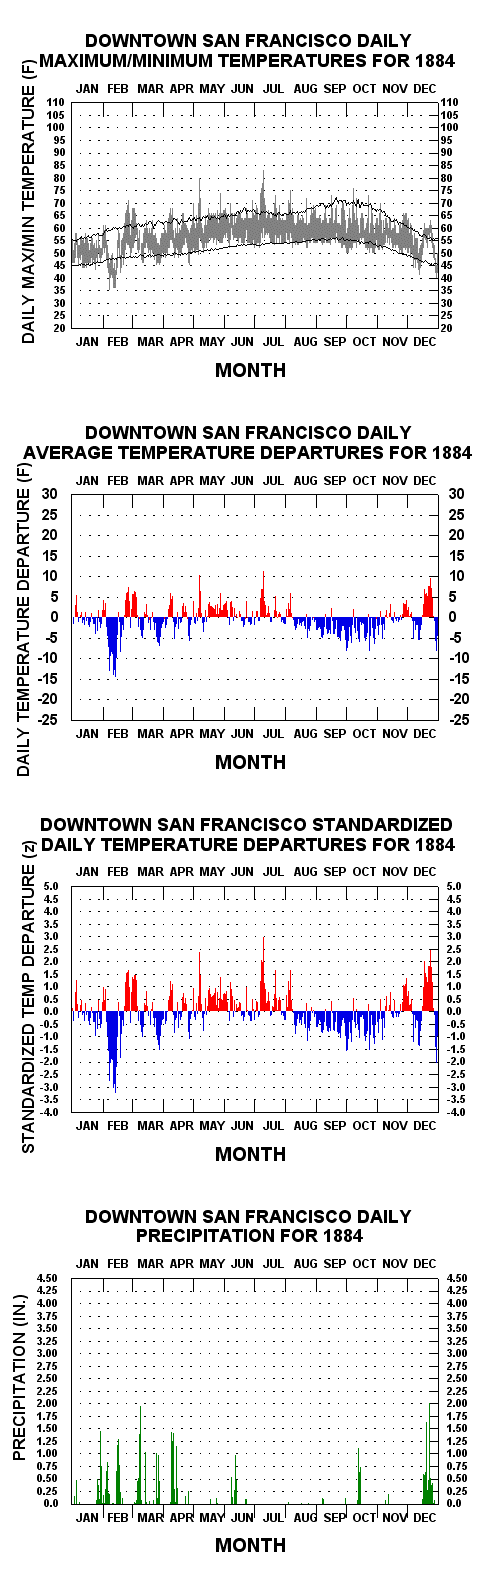
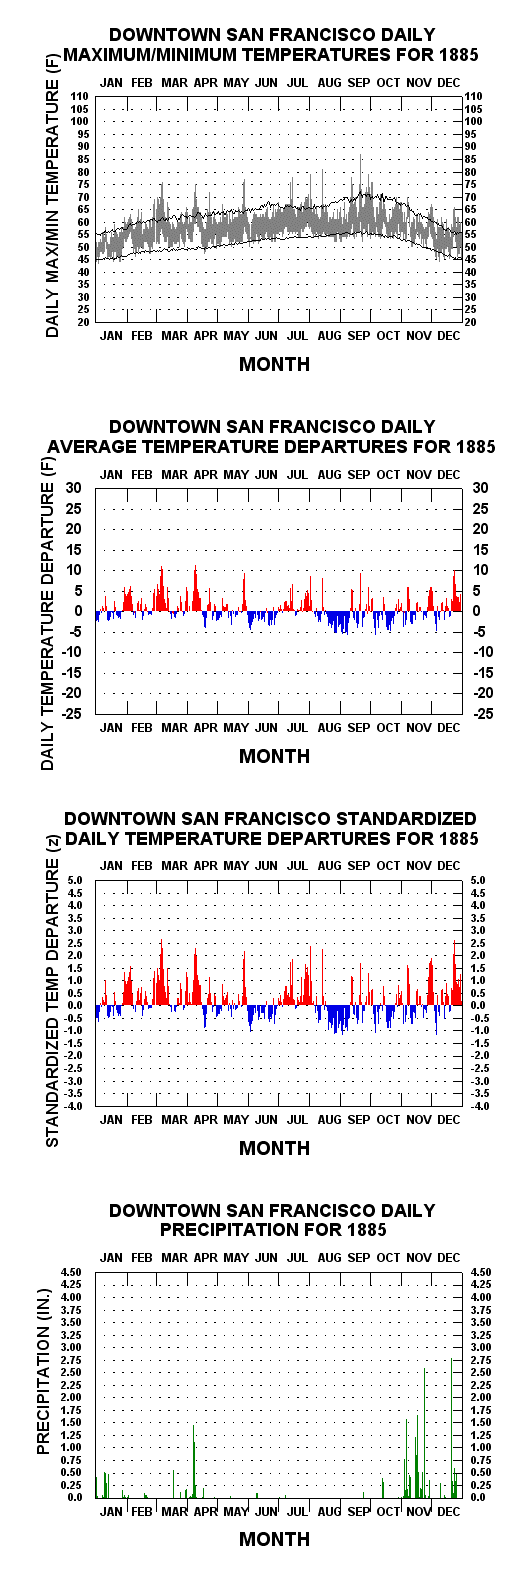
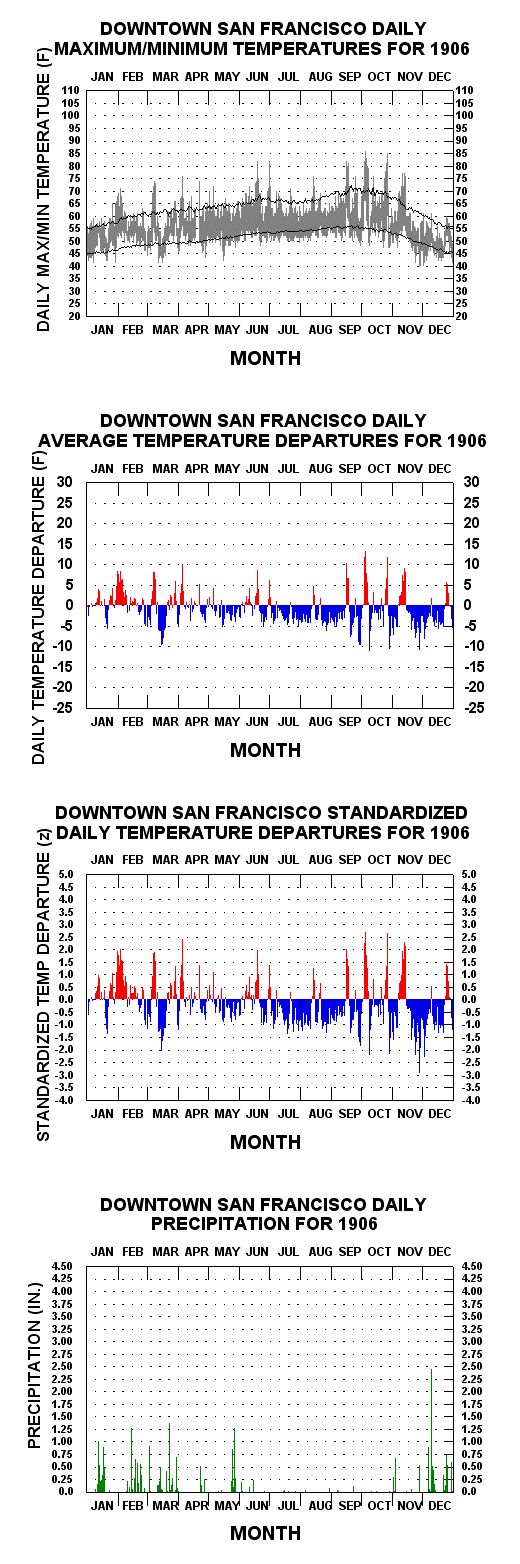
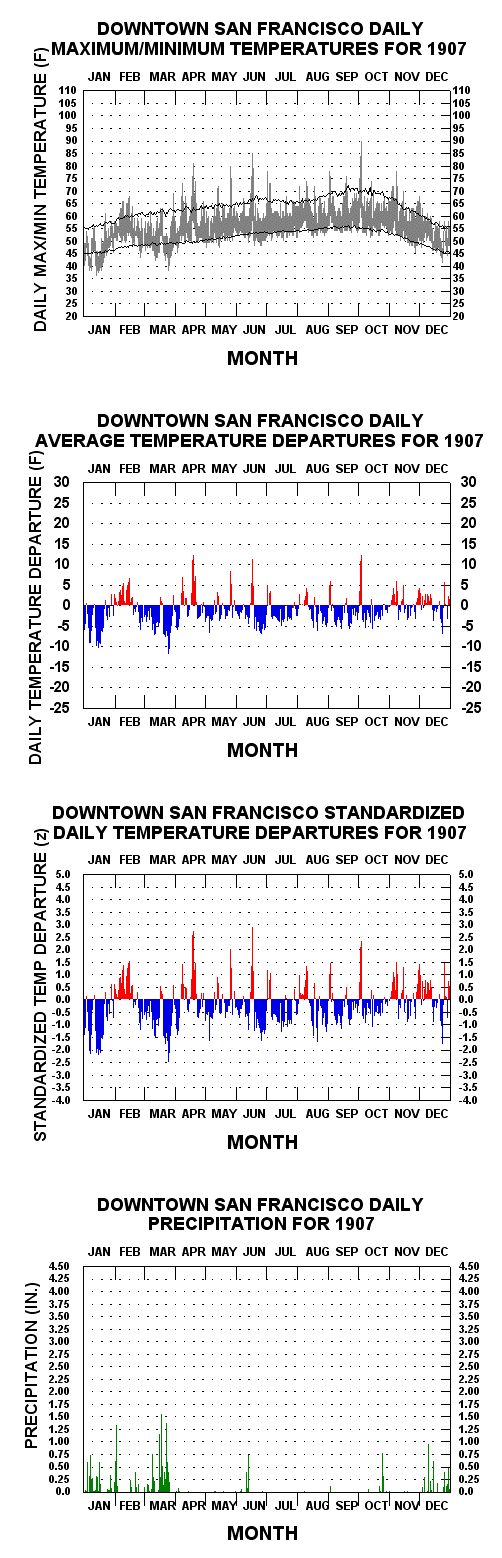
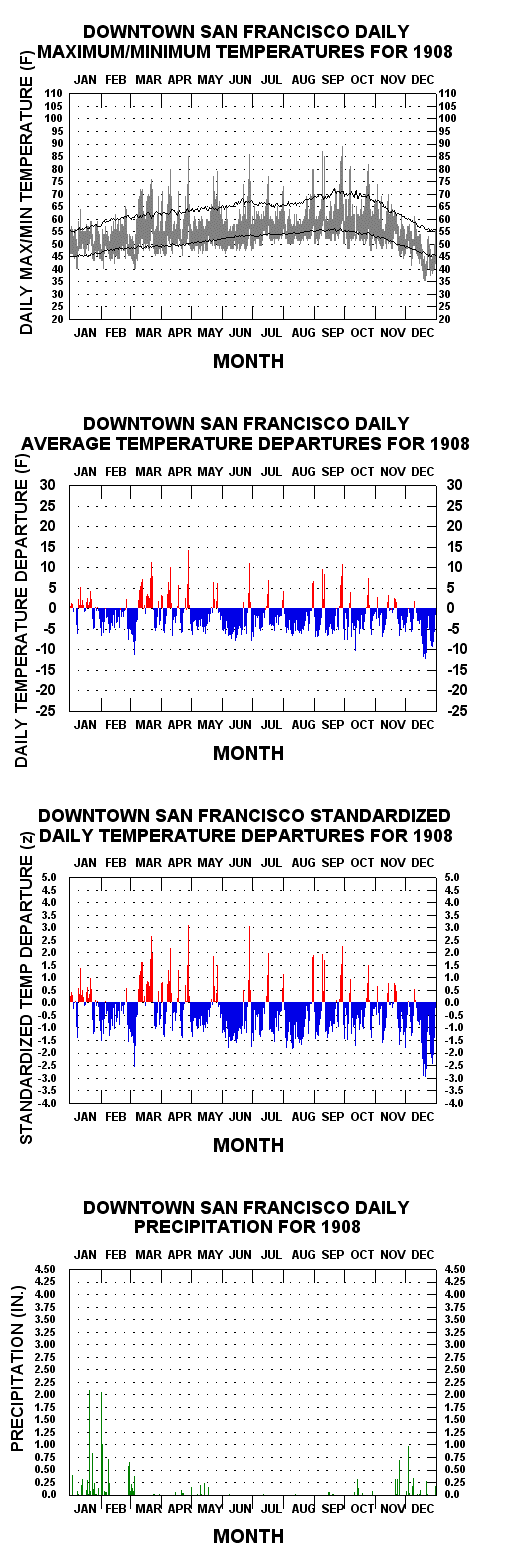
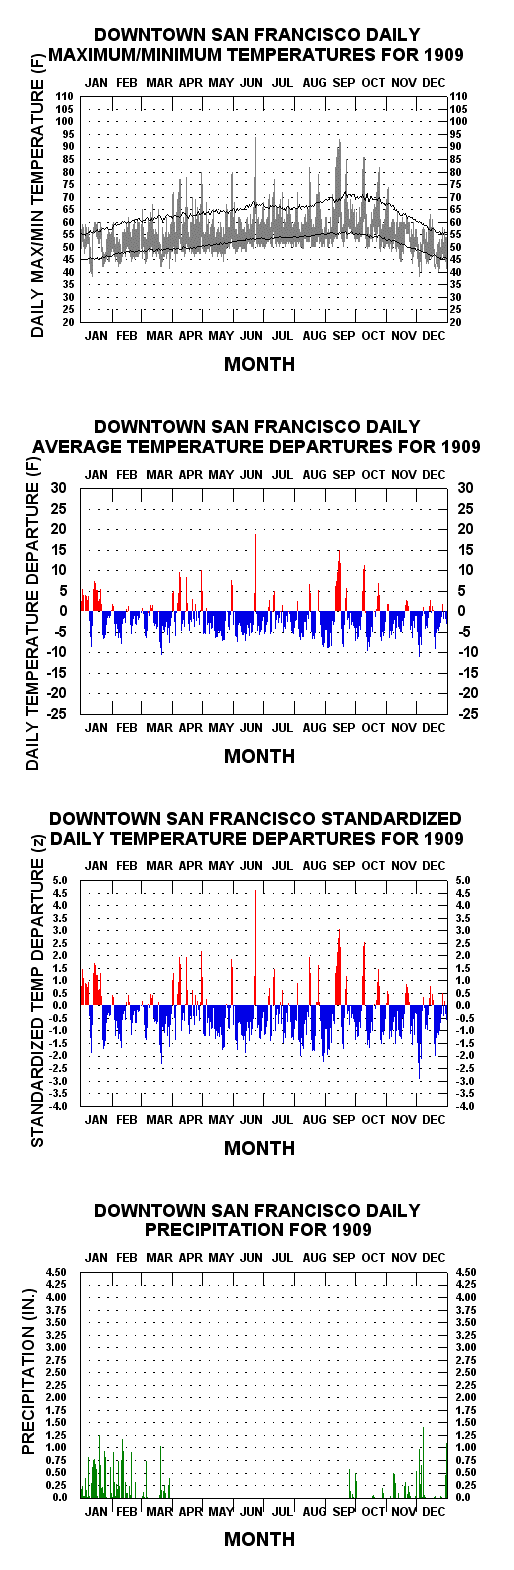
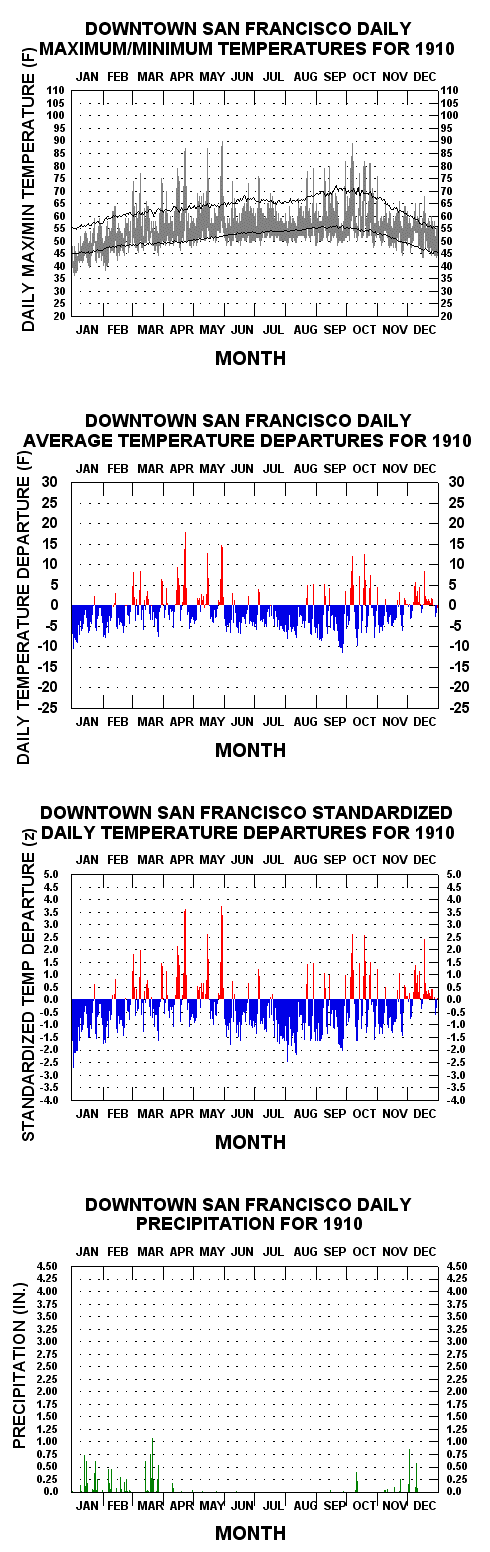
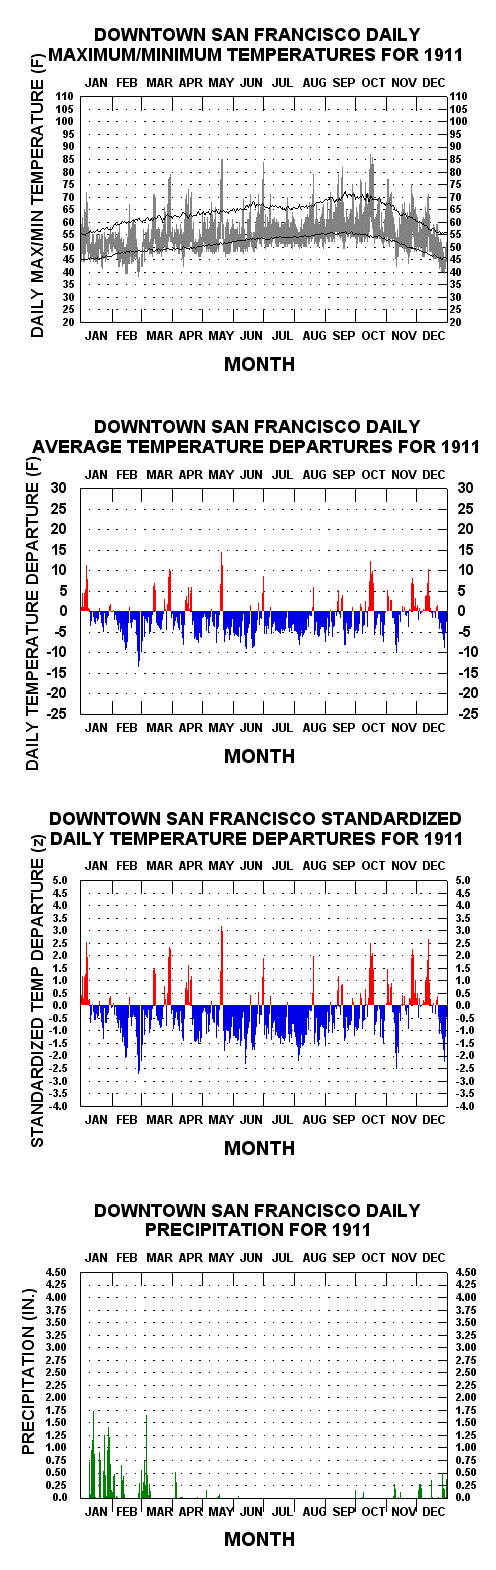
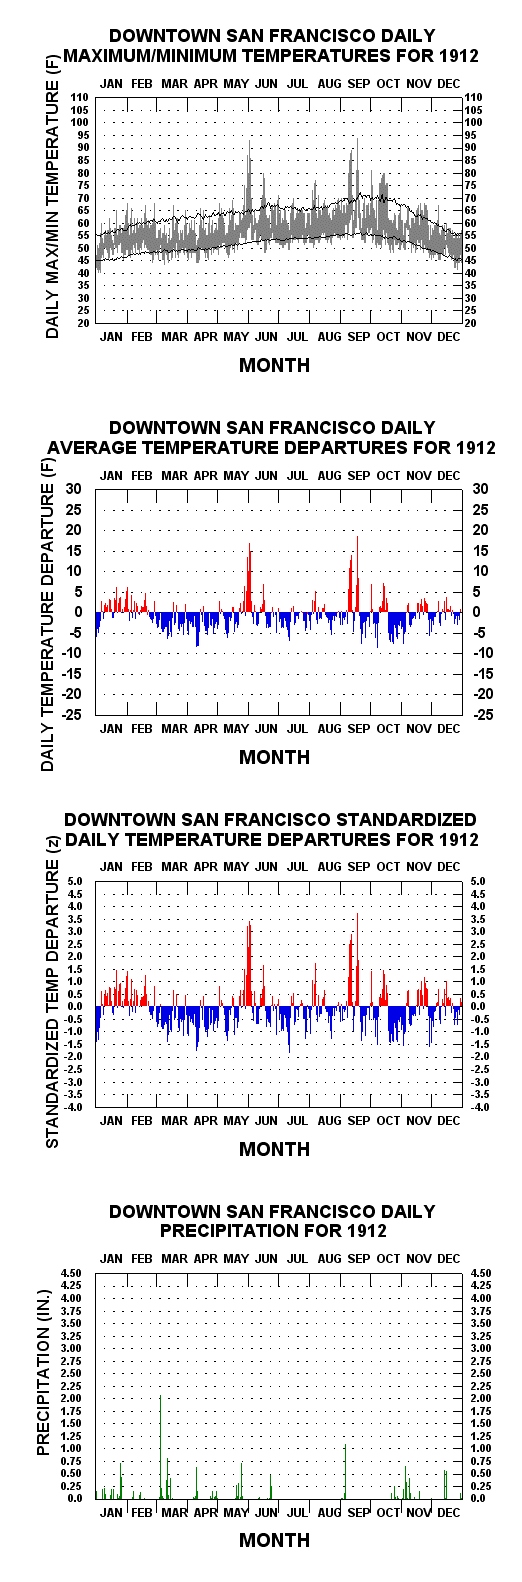
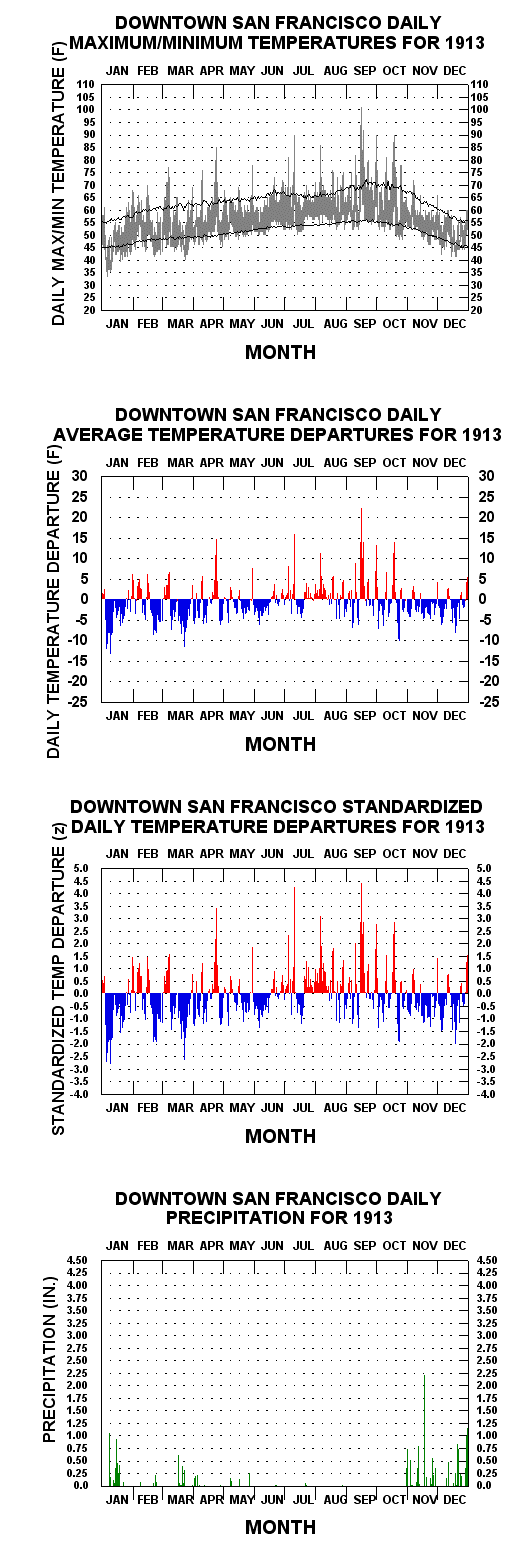
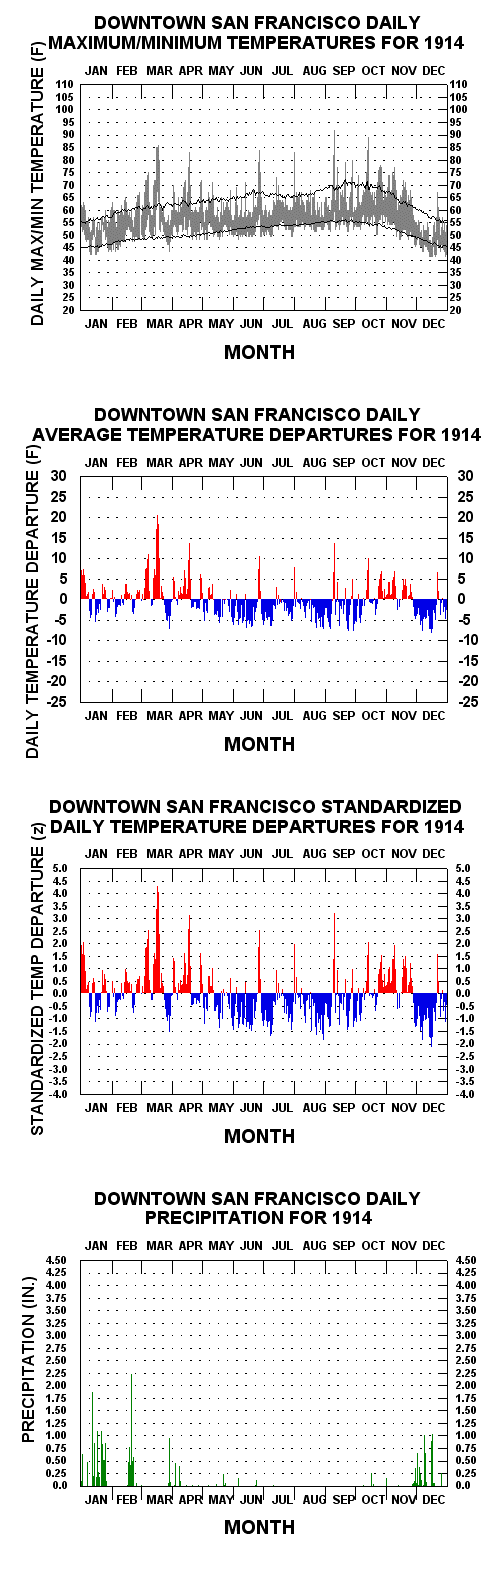
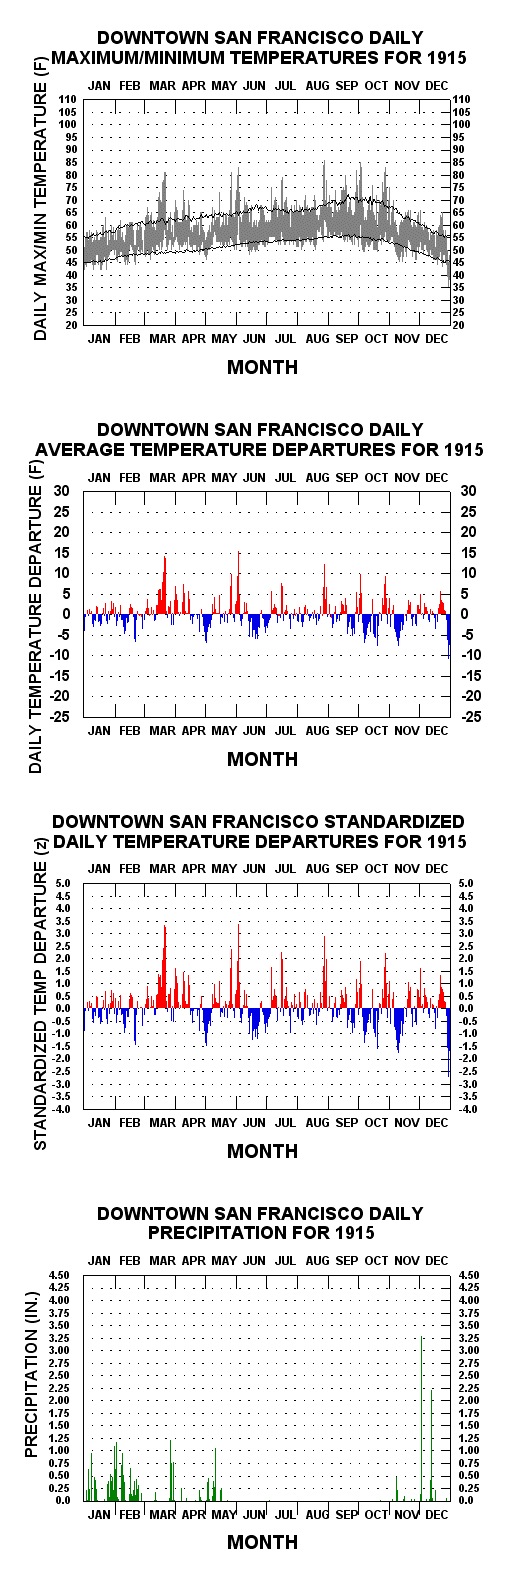
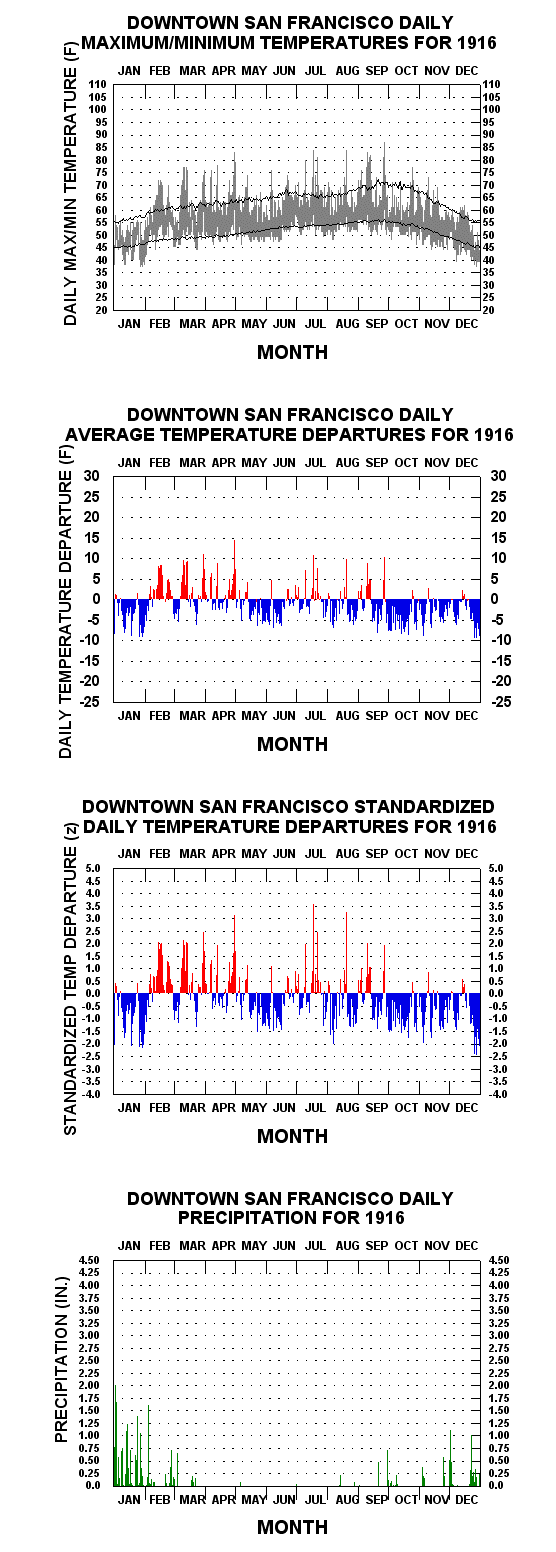
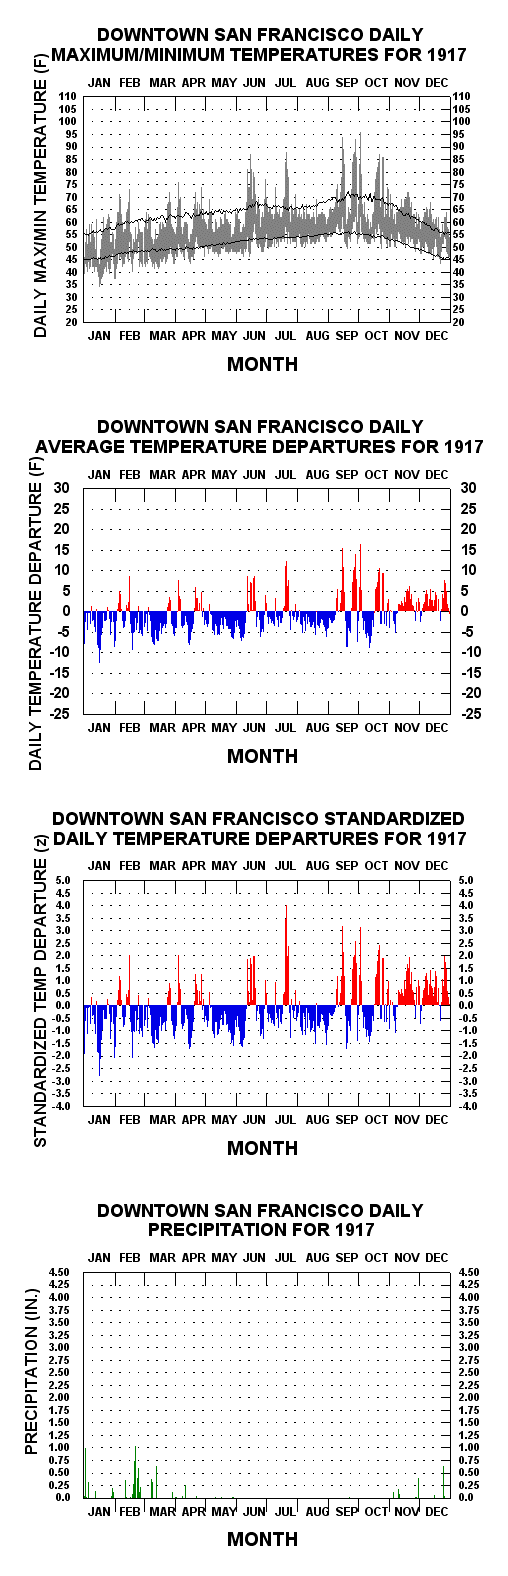
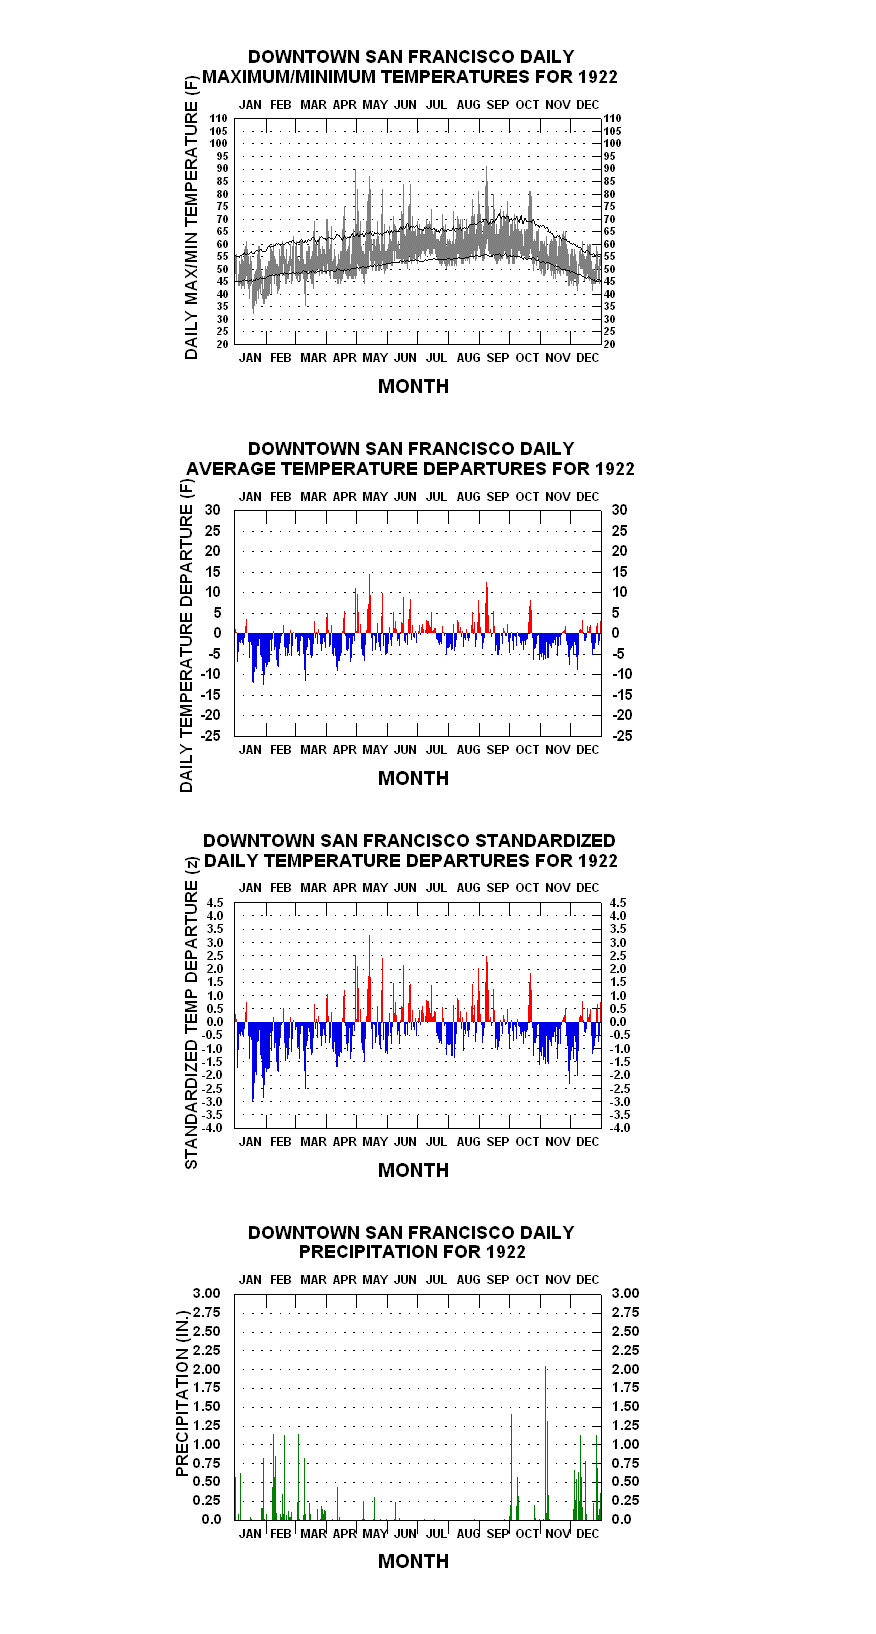
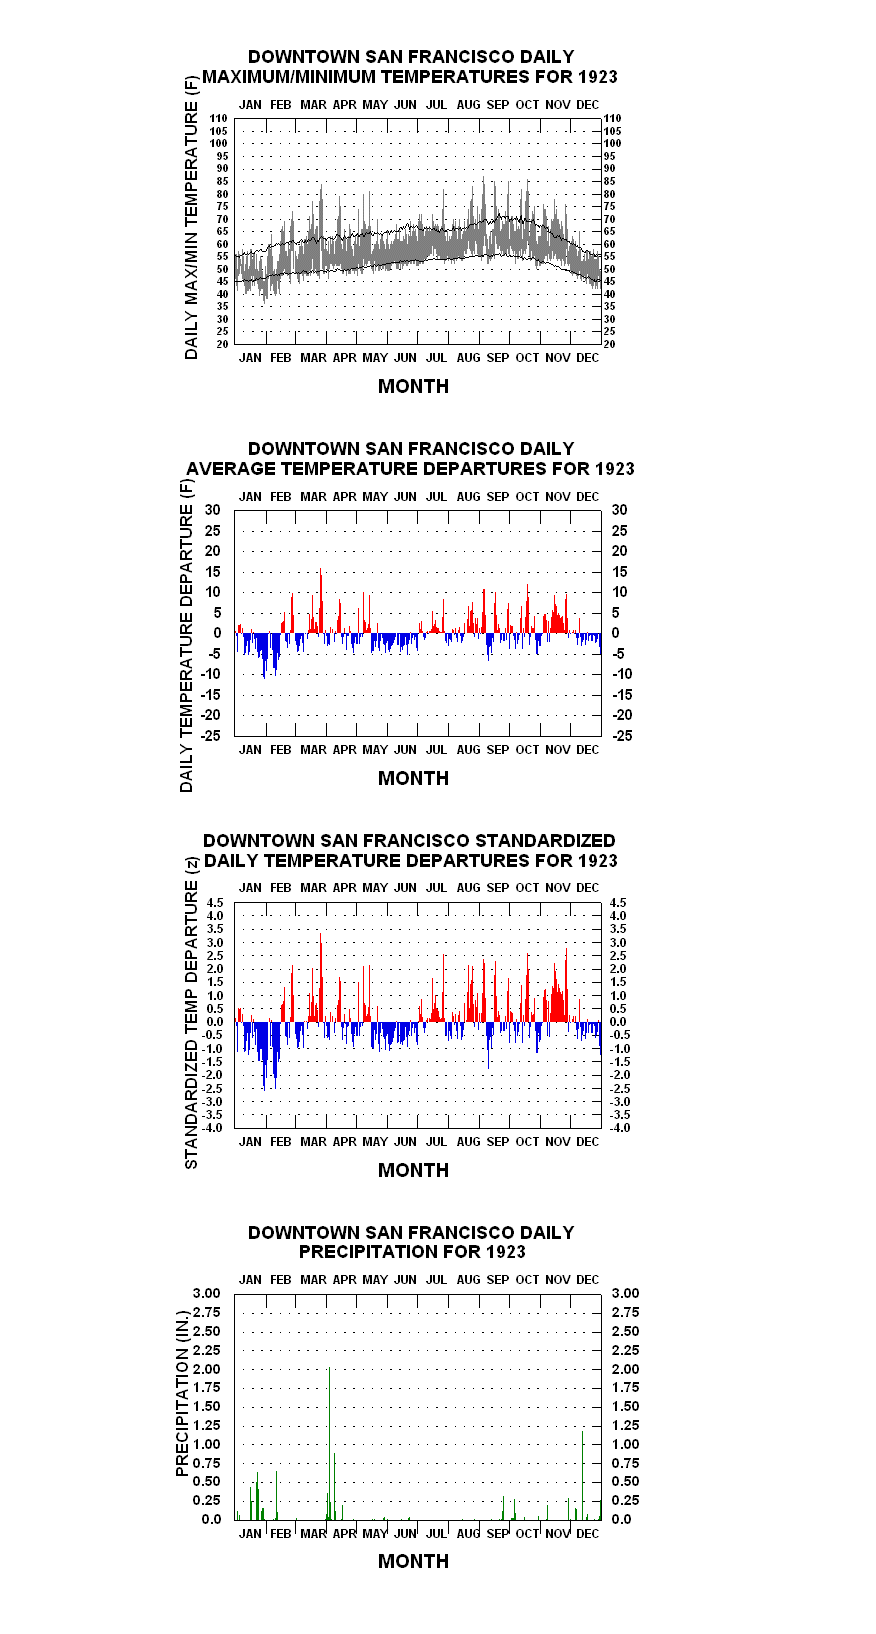
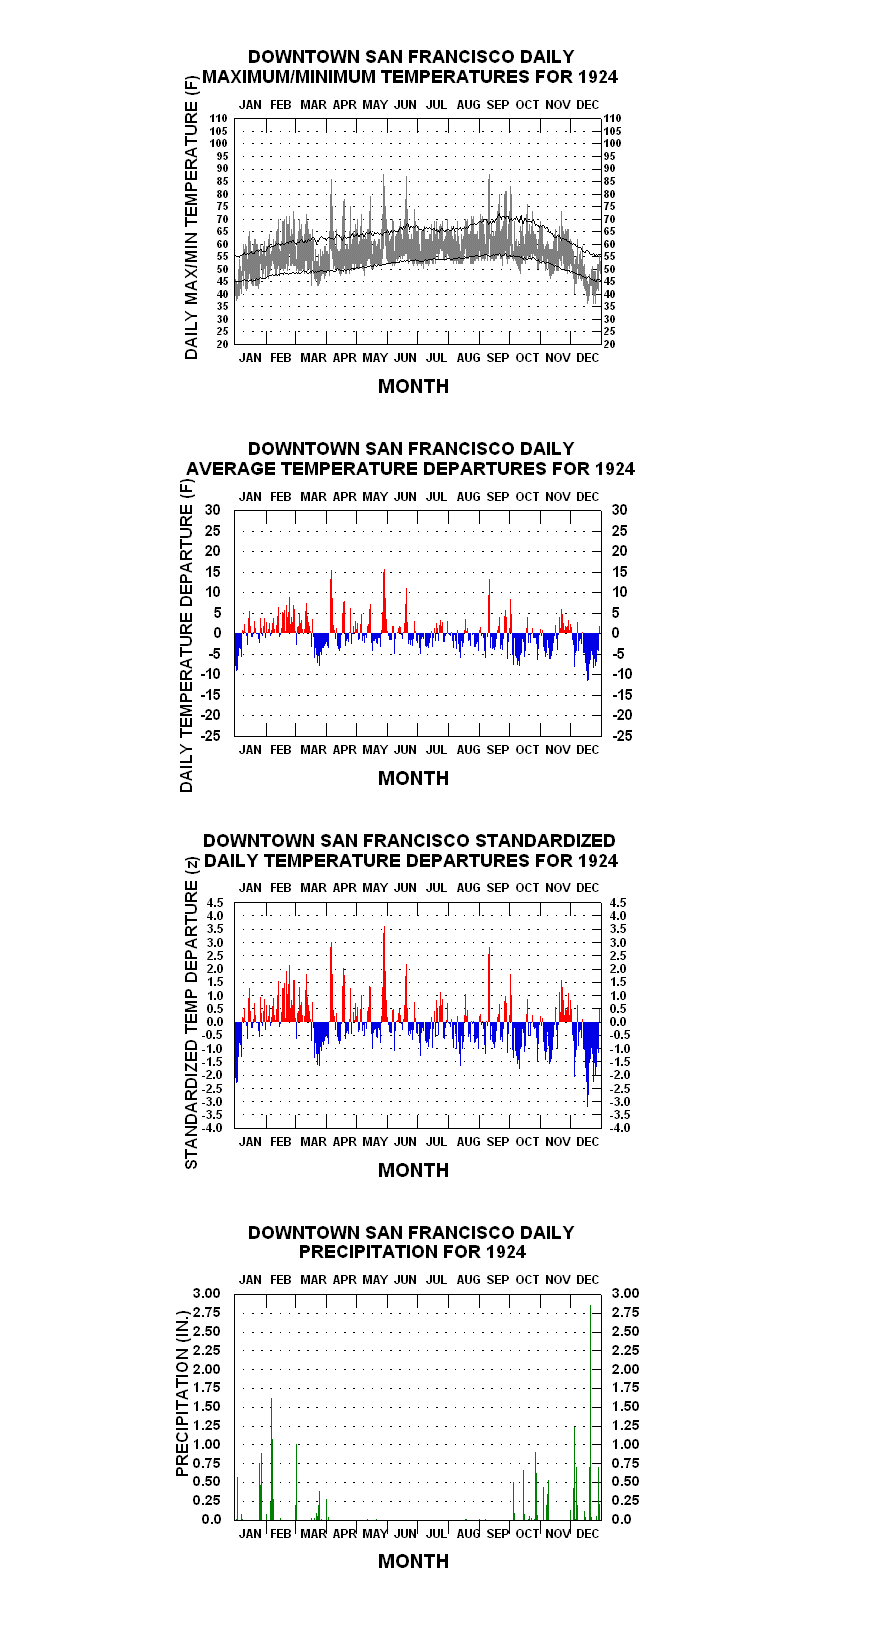
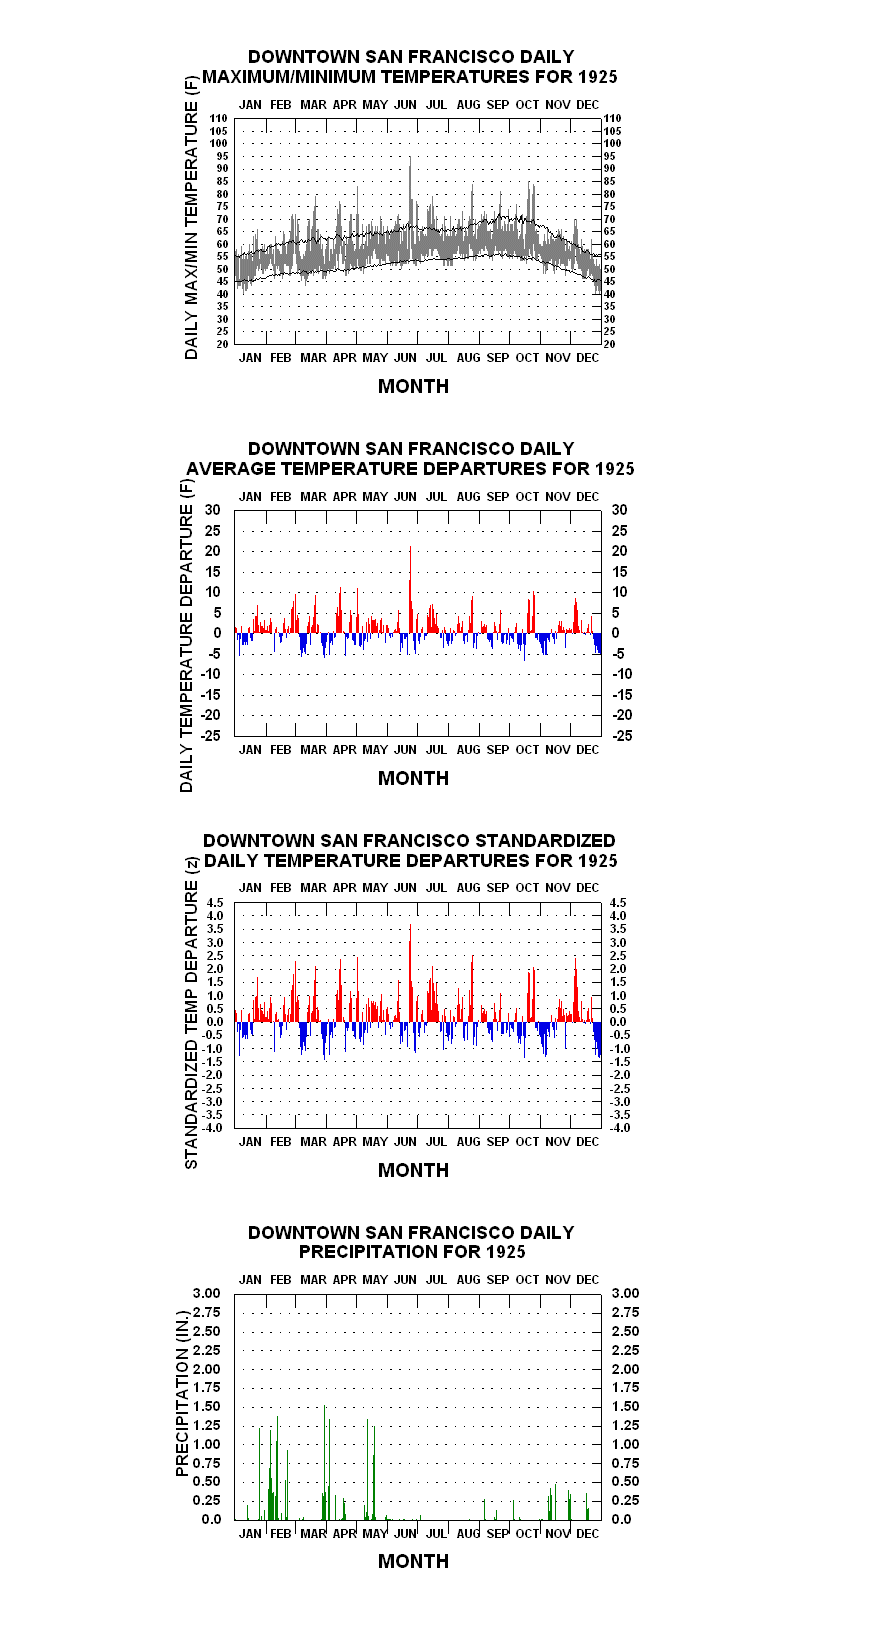
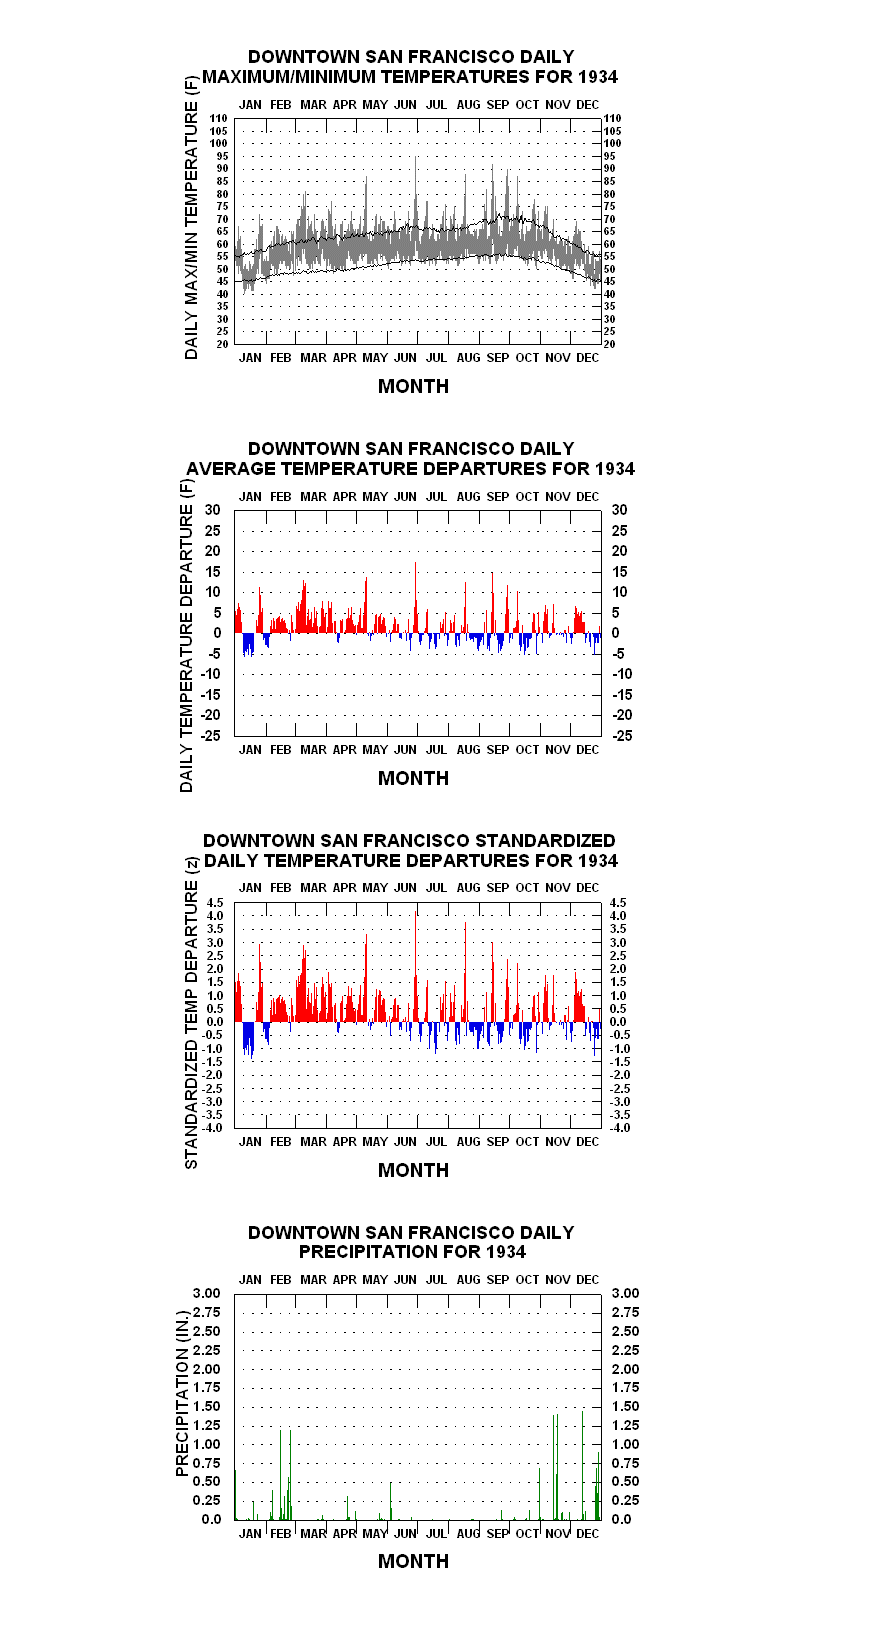
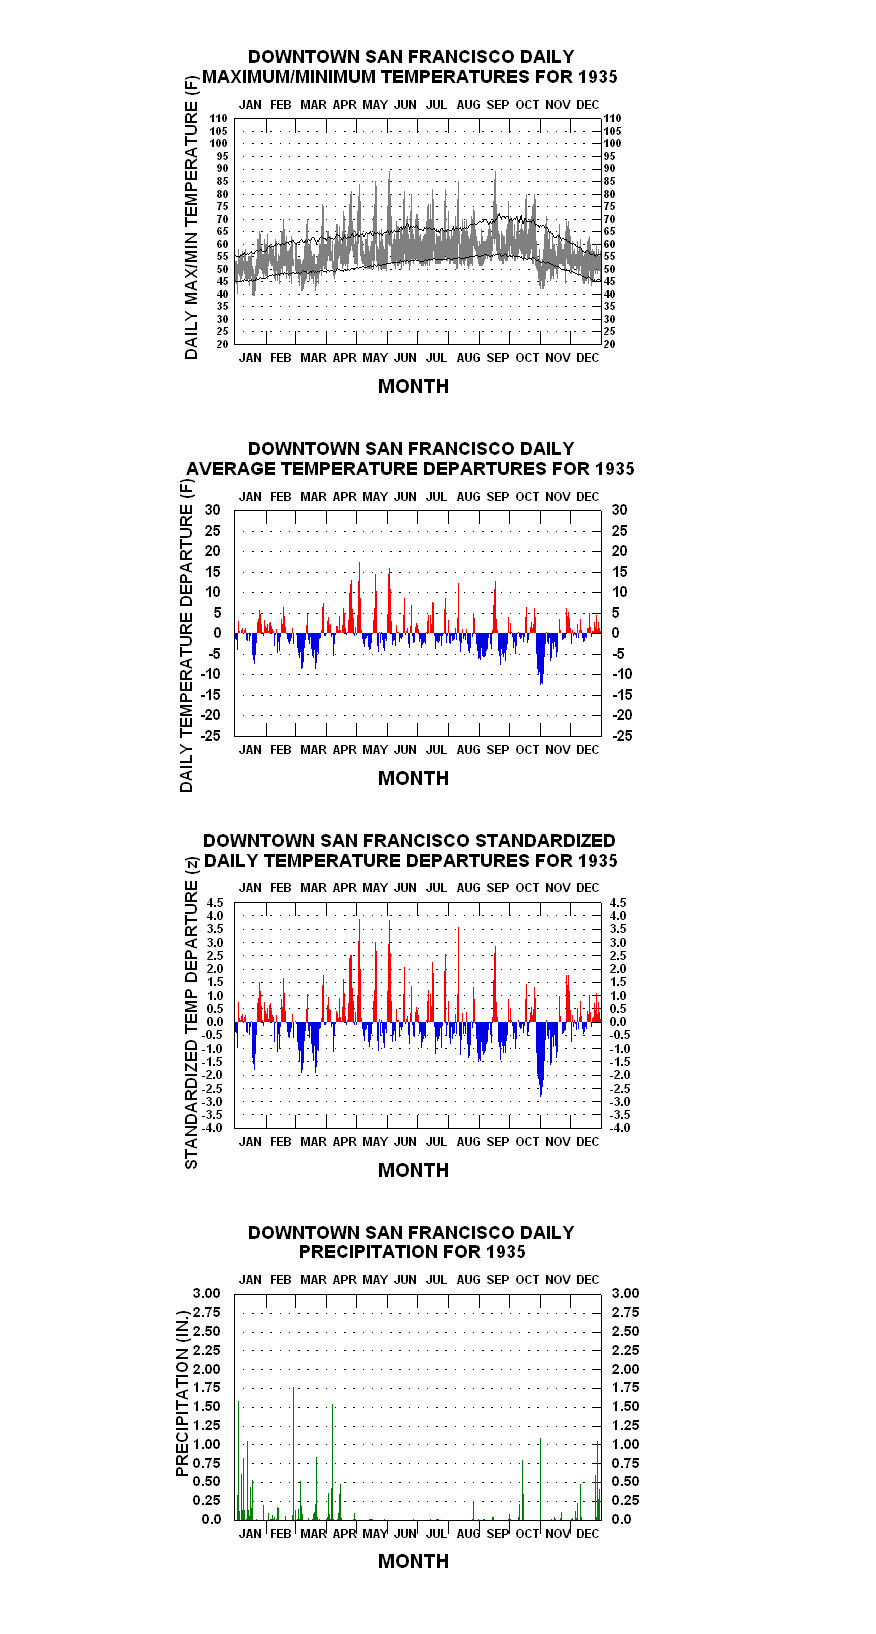
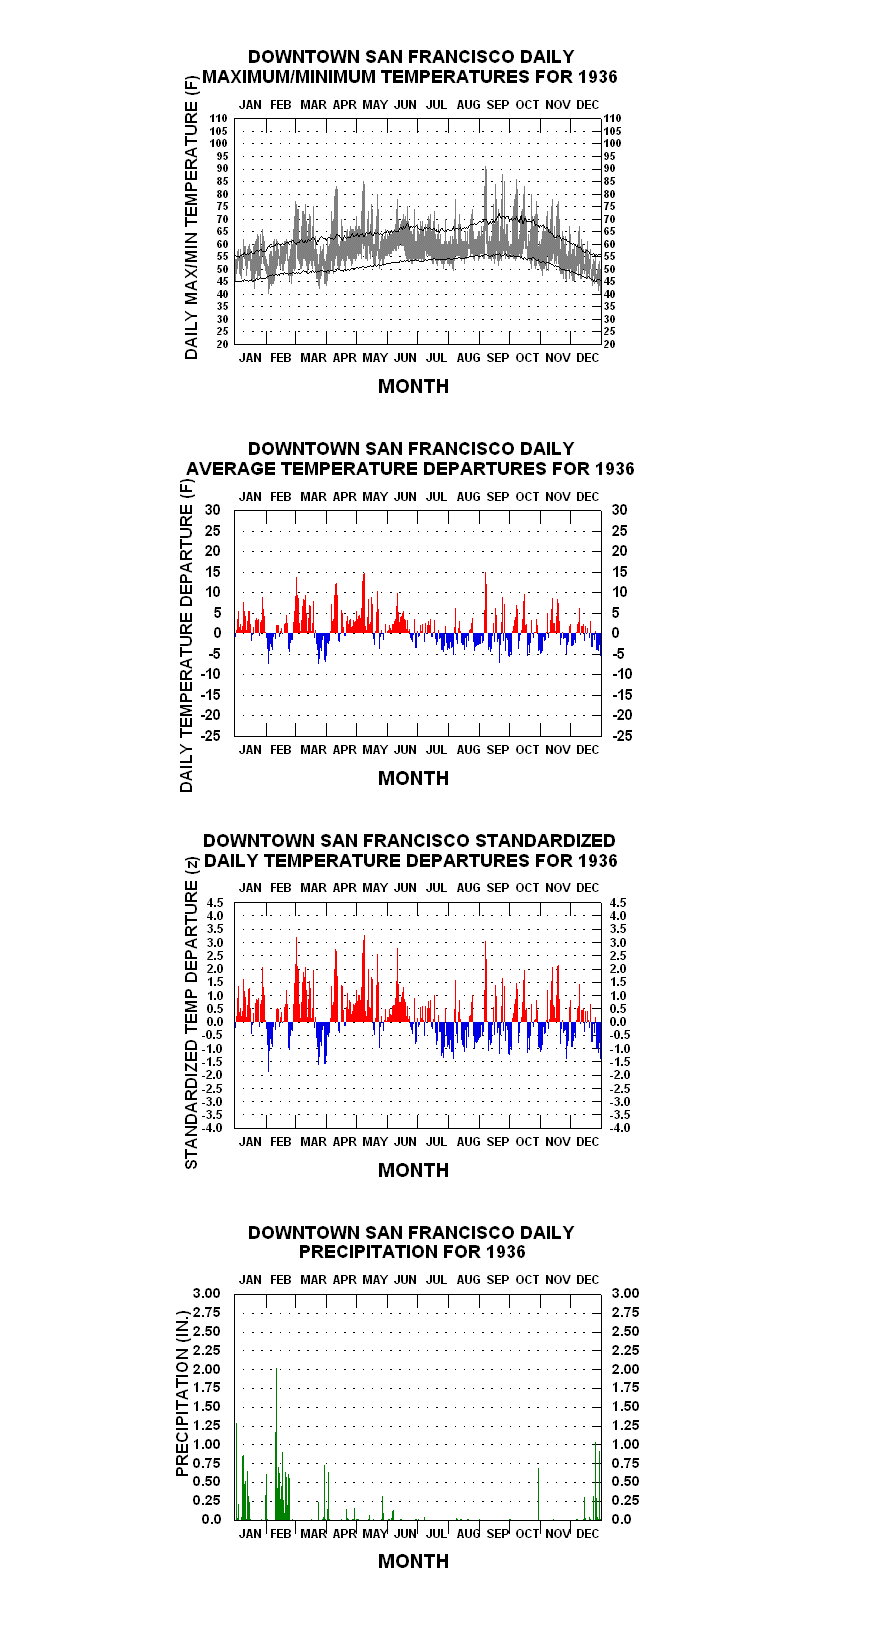
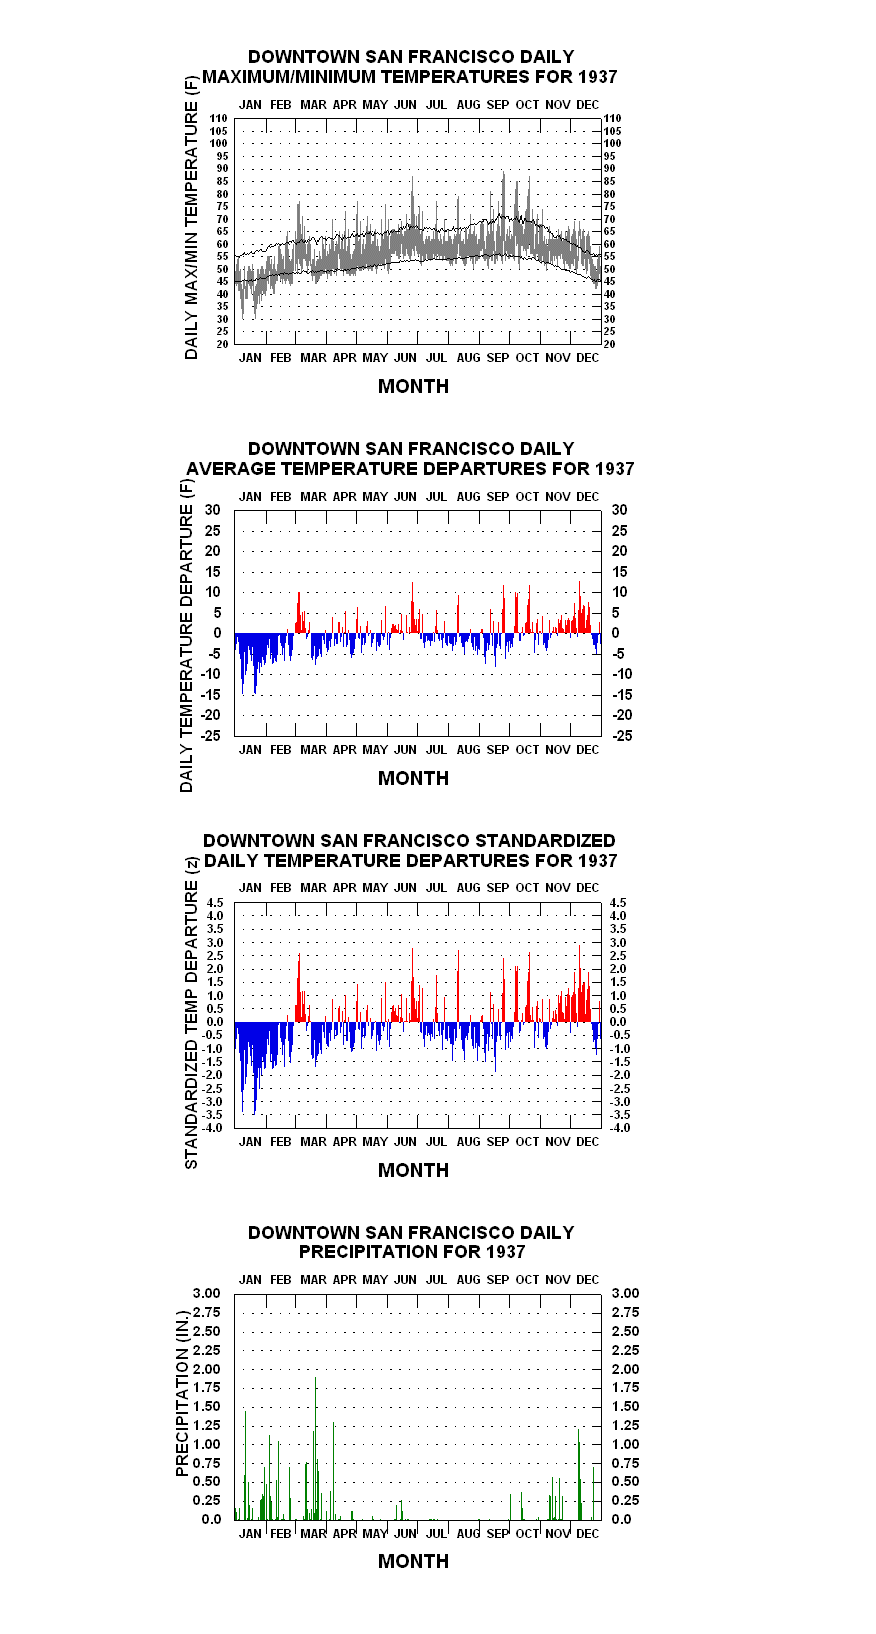
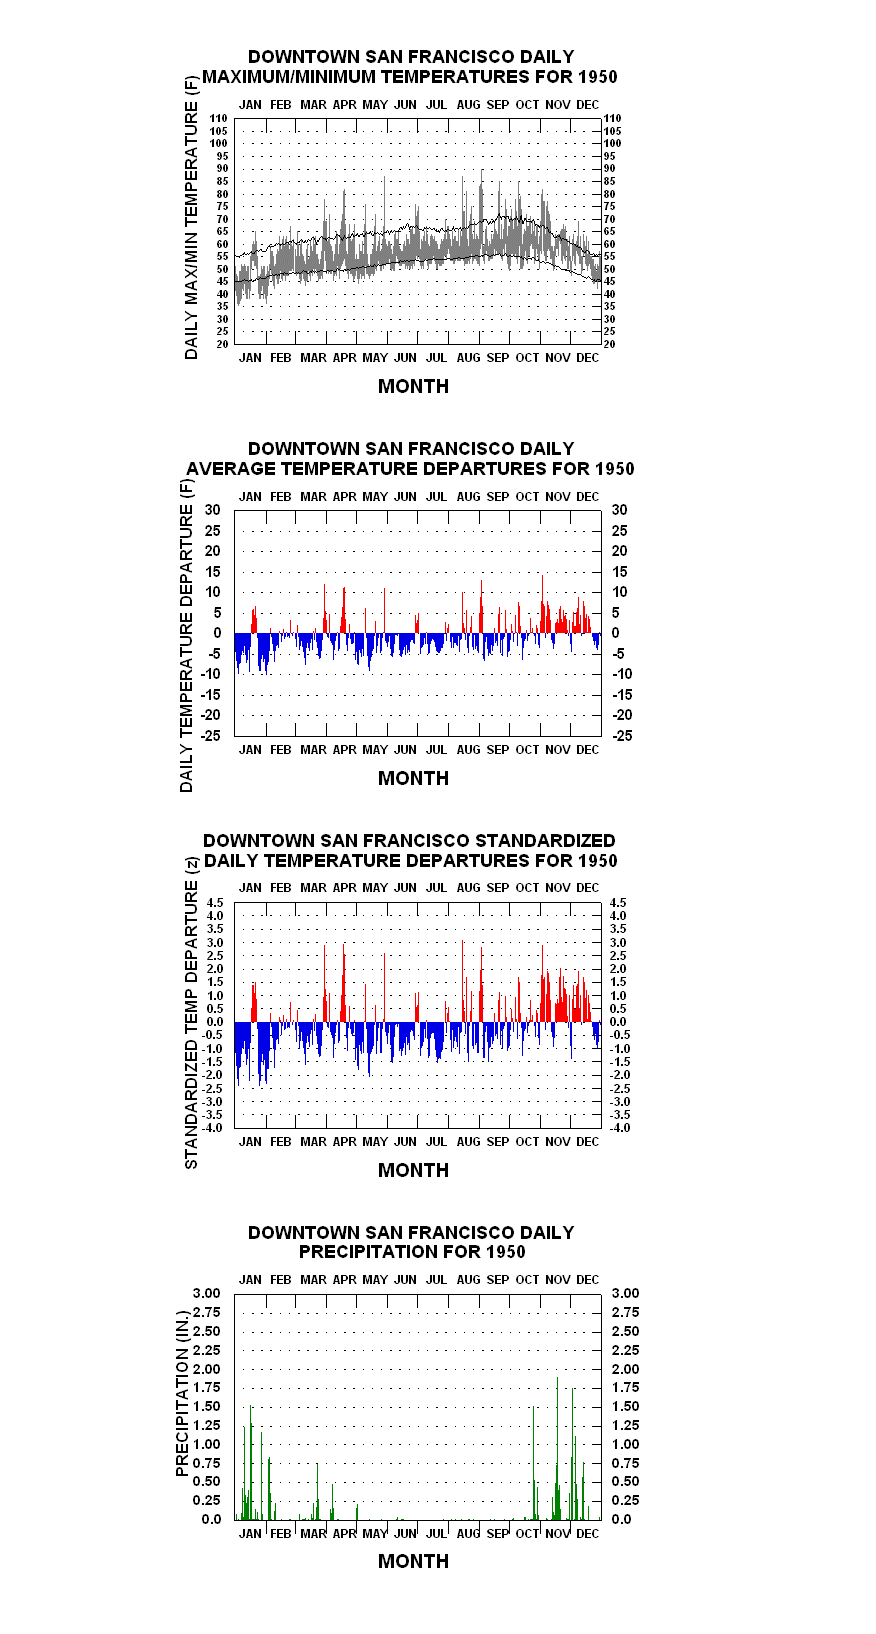
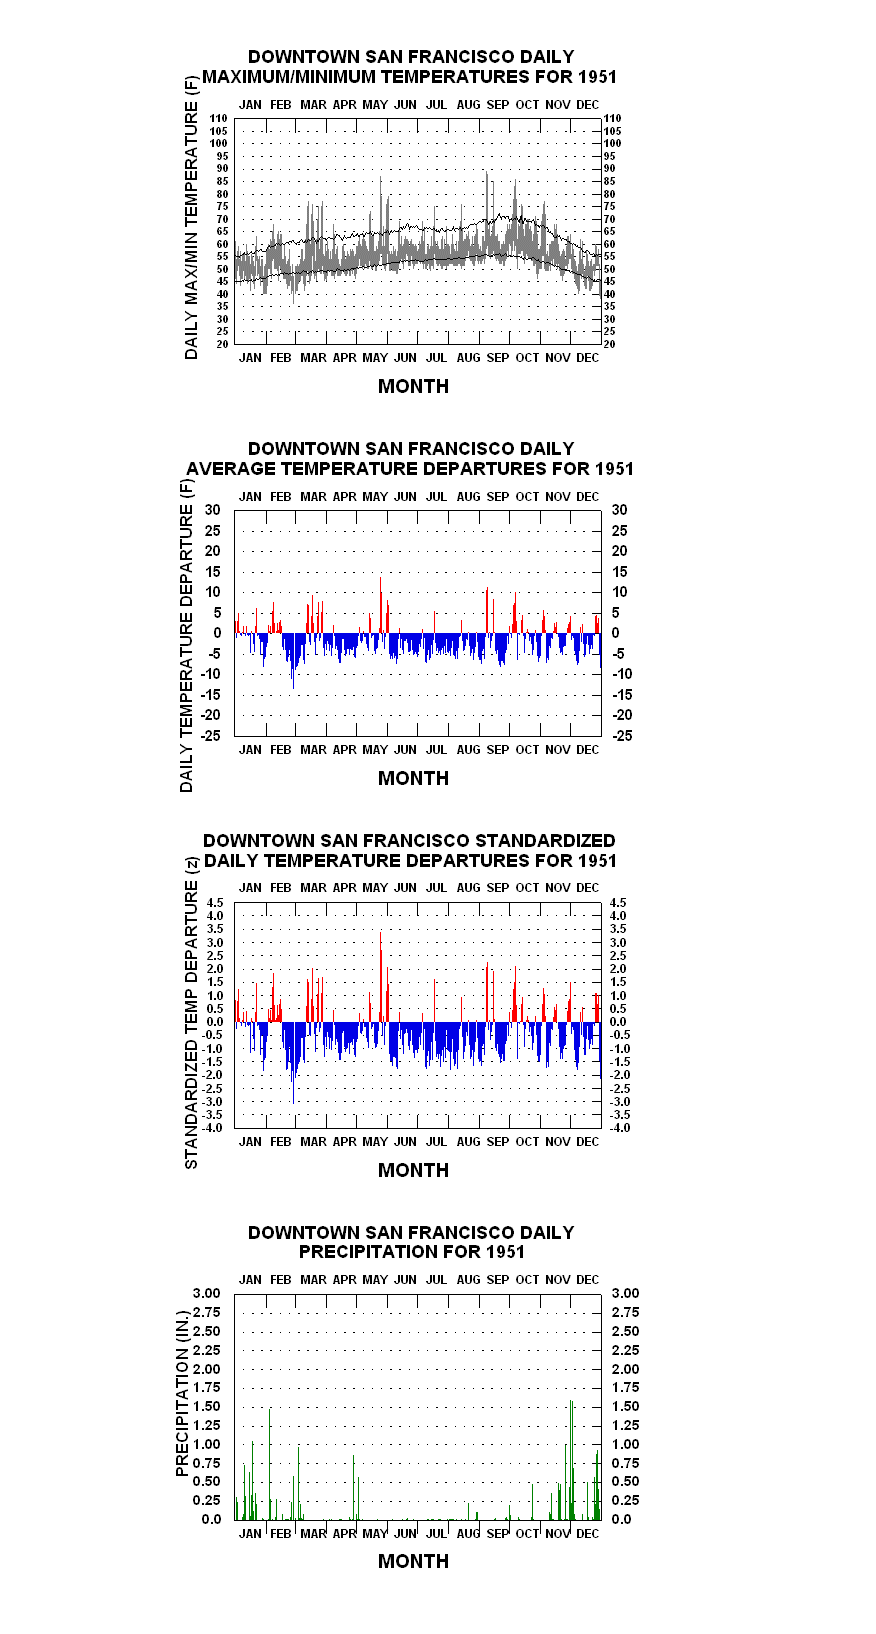
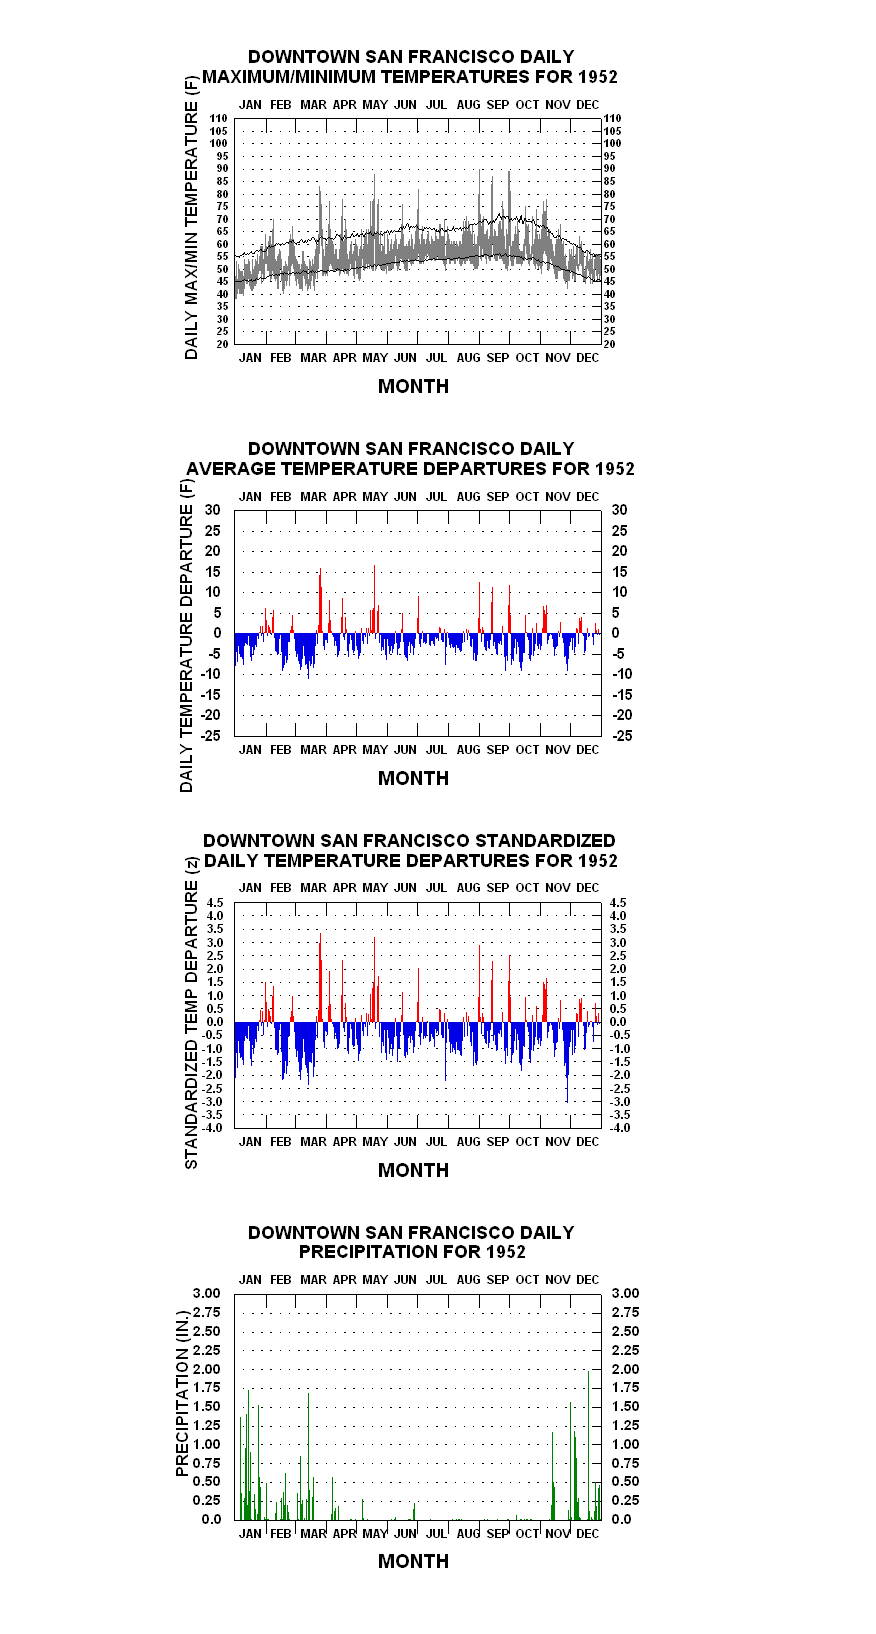
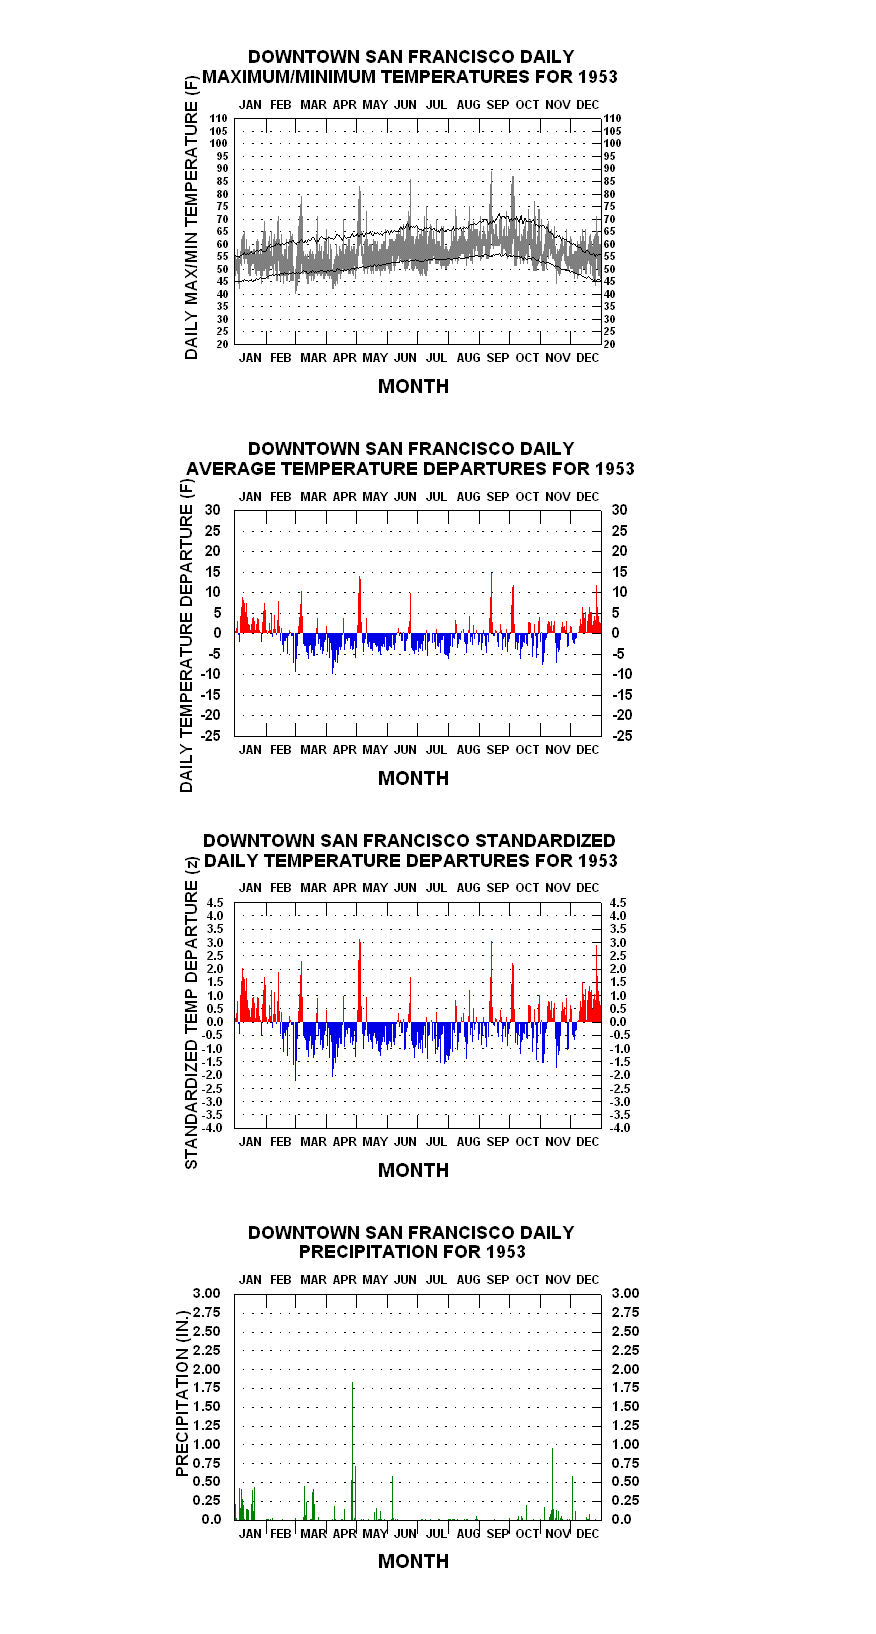
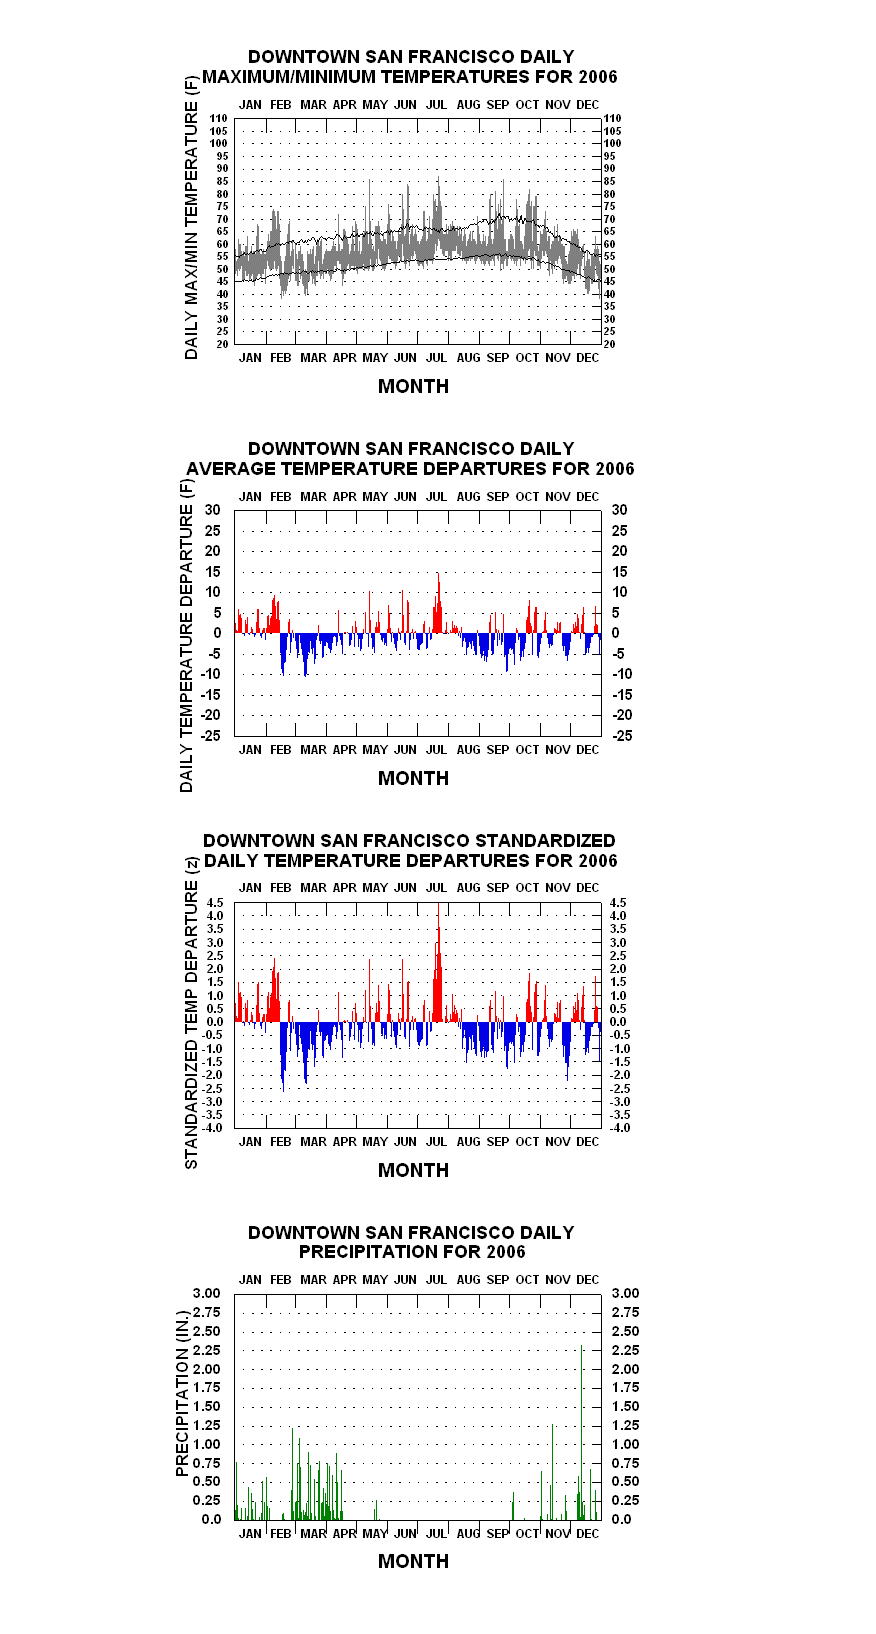
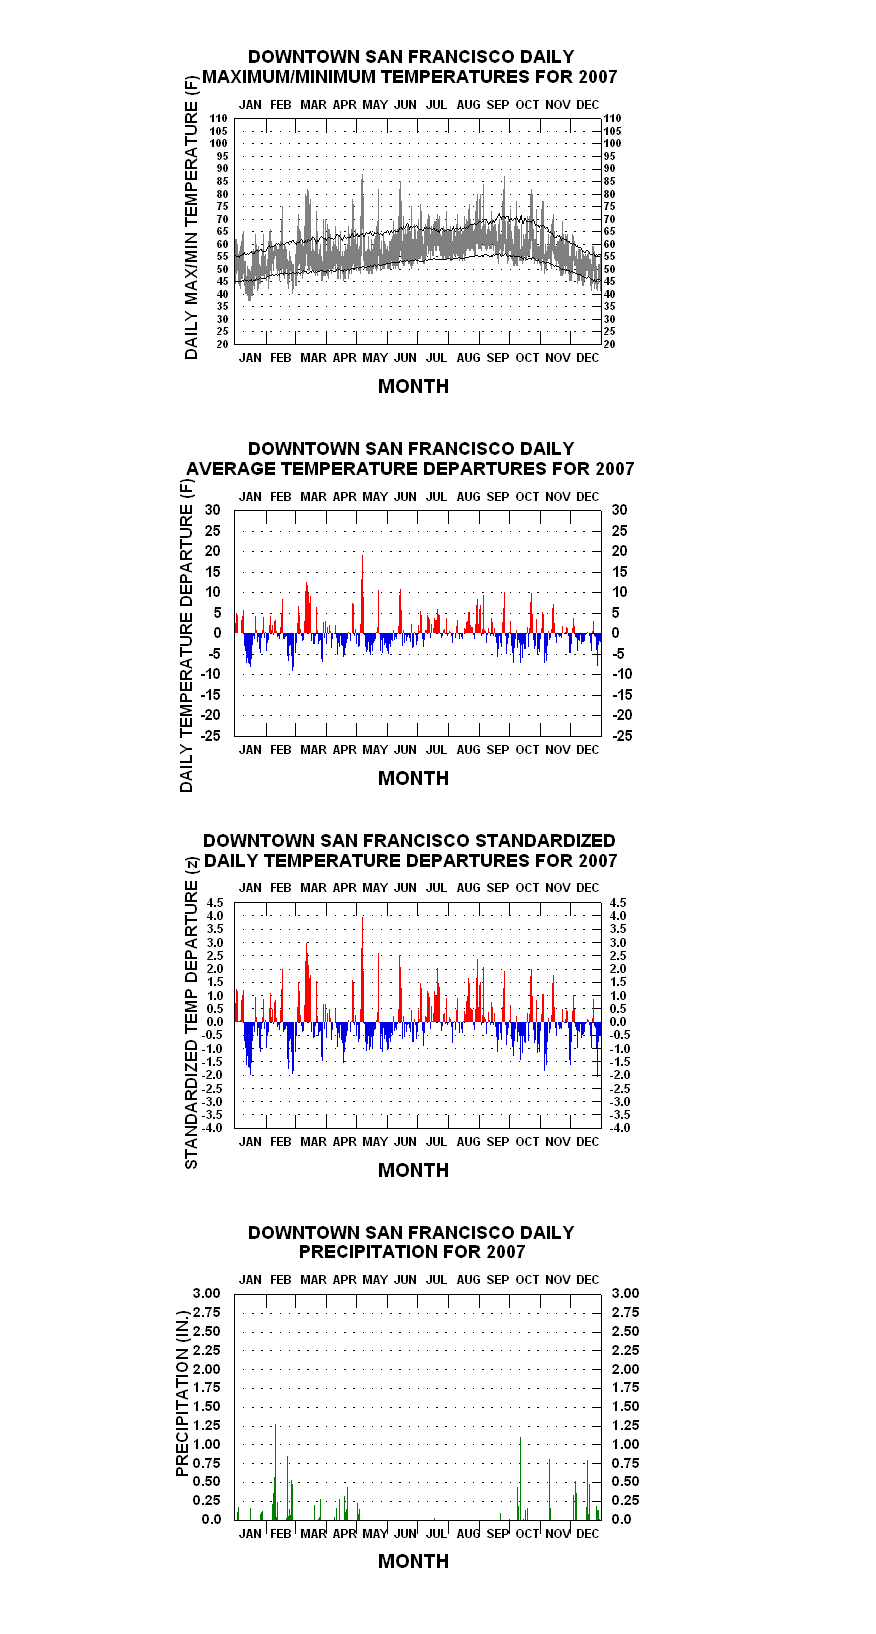
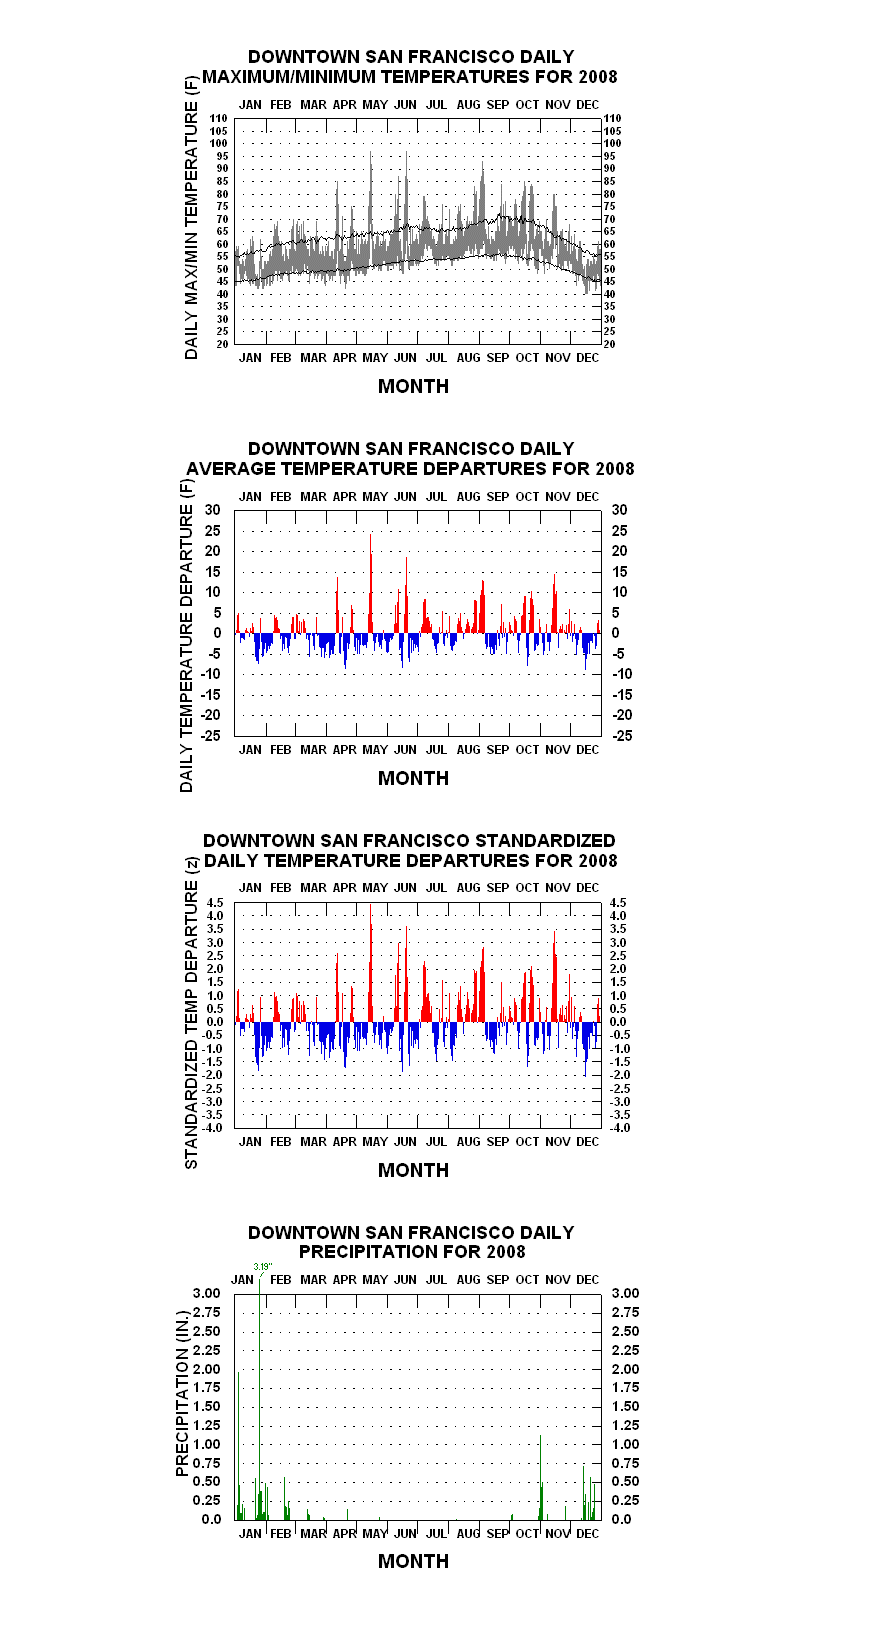
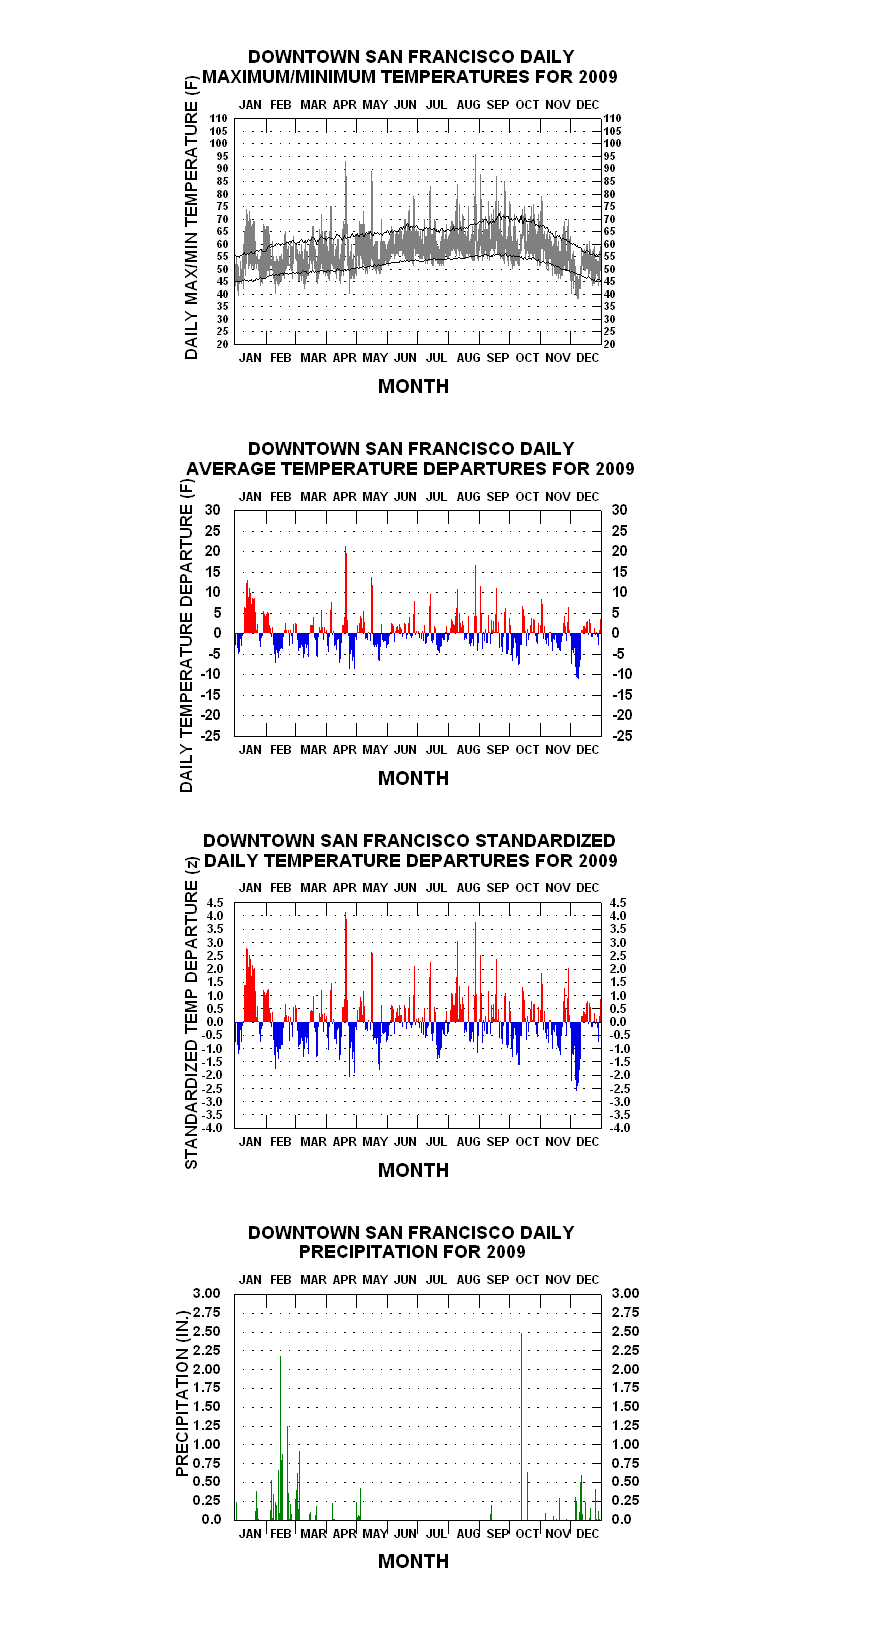
Links To Yearly Graphs Of Particular Interest, With Accompanying Notes
Five-day "spike" of warm offshore flow in early June. Daily max temps all surpass 85 F.
An otherwise cool year punctuated by several-day offshore flow events
Wettest (38.13") calendar year until 1983. Heavy Rains as late as June.
29 F on both 14-15 January, coldest daily minima until December 1932.
Gyrating early year temperature spells.
Long stretch of below average temps, mid-March thru September
First recorded 100+ F temperatures - 100 F and 101 F, respectively. on 7-8 September.
July 7th 5.8 standard deviations above the long-term daily average (daily range: 98 F/66 F)
Coolest year down to the present.
and 1917 - Unusual mix of both above and below normal temperature spells for each year.
1916 and 1917 - Unusual mix of both above and below normal temperature spells for each year.
As influenced by a strong El Nino, warmest March, April, and May since the start of the official mean monthly history (in 1871). Also warmest year to date.
Steady above normal warmth over first half of year. Second warmest year to date
Sharp December cold snap over the 8th-14th. Coldest week-long period (38.9 F) of the 1875 to present era. Max/min temperature only 35/27 F on the 11th.
Coldest January in all history. First 52 days of the year each below average in mean temperature. .
Nineteen consecutive measurable rain-days over late January to mid-February.
Warmest September on record up to this time, the 17th to 23rd the warmest week-long period (79.3 F) in all history down to present. 1940-41 – Strong El Nino episode. Wettest July-June water year (35.05”) since 1889-90. 1949 – Very cool January and February help produce coldest winter in all history (Dec. ’48 – Feb ’49).
Coolest Summer (Jun.-Aug.) since 1911 and coolest Summer through the present. 1957-58 – Strong El Nino. Wettest July-June water year (36.48”) since 1889-90. 1962 – Second wettest October (5.51”) in history. Rainstorms interrupt 1962 World Series. 1967 – Irregular anomaly pattern in temperature and rainfall over course of year. Coldest April in all history. 1970 – Another highly irregular temperature anomaly pattern over course of the year – Mix of short and long-term warm/cold spells. 1971 – In an otherwise cool year, hot Sepember day in Downtown San Francisco history (101 F/ 72 F) on 14th.
Annual mean temperature ties 1934 for warmest in history up to this time. Eight of the next fifteen years including 1983, equal to or warmer than 1934. Wettest March (9.04”) and warmest Summer up to this time.
September warmest calendar month in all history (69.4 F).
Warmest January and February in all history, third warmest March. Warmest year to date by 1.2 F
103 F on 17 July; highest temperature yet recorded in Downtown San Francisco.
Five-day mid-summer-like spell in early April.
Intense cold spell in late December, but 1990 still ties 1934 and 1983 as warmest in history. Highest average daily temperature range (15.7 F) of 1875-present period.
Warmest year in all history (60.8 F). Also warmest Spring and Fall
Warmest Summer in all history.
Coldest and 2nd wettest November (11.49”) in all history.
Warmest July in all history.
La Nina year. Coolest year since 1975 and coolest Spring since 1911.
103 F on 14 June, ties July 1988 mark for highest temperature yet recorded in Downtown San Francisco.
Driest calendar year in history (6.18").
106 F on 1 September highest temperature ever recorded in Downtown SF.
* Member, American Meteorological Society
Data Collection 09Analytics
Sample Regimes, PCA Modes, PDFs & Extremes+
Temperature+
Regimes+
Sample analysis: group years by recurring marine-influenced temperature patterns for San Francisco, then compare transitions between common, unusual and persistent regimes. This is sample Analytics content for layout and workflow testing. Replace it with the station’s verified analysis when the final material is ready.
Extremes+
Sample analysis: review the upper and lower tails of the temperature record for San Francisco and identify years that merit detailed chart interpretation. This is sample Analytics content for layout and workflow testing. Replace it with the station’s verified analysis when the final material is ready.
Wind+
PCA Modes+
Sample analysis: demonstrate how leading modes can separate broad wind-direction and speed variability from shorter-lived anomalies at San Francisco. This is sample Analytics content for layout and workflow testing. Replace it with the station’s verified analysis when the final material is ready.
PDFs+
Sample analysis: compare the central distribution and tail behavior of wind speed observations at San Francisco. This is sample Analytics content for layout and workflow testing. Replace it with the station’s verified analysis when the final material is ready.
Continue Exploring
Compare Climate History Across Every Station
Browse domestic and international climate archives, long-term trends and original statistical visualizations.