

Station Overview
Graphical Climatology of Minneapolis-St. Paul Area Temperatures, Precipitation, and Snowfall (1820 – Present)
The following is a graphical climatology of Minneapolis-St. Paul, Minnesota temperatures, precipitation, and snowfall, from the start of 1820 (Fort Snelling) into the present year 2026. Presented are summary overview charts, a link to a year-by-year account of early (1820-1869) Minnesota weather history, followed by year-to-year graphs depicting daily temperatures, precipitation, and snowfall. Original source data are from Fort Snelling (1820-1858), St. Paul Smithsonian recordings (1859-1872); and government weather service observations for St. Paul (1873-1890), downtown Minneapolis (1890-1938), and the Minneapolis-St. Paul International Airport (1938-present). Daily snowfall totals date from 1891, snow depth data from 1893.
Data were obtained from the National Archives, the Minnesota Historical Society, The University of Minnesota Periodicals Library, the National Climatic Data Center, the Minneapolis-St. Paul National Weather Service Office online site, and the Minnesota Climatology Working Group. Monthly updates are from the site: https://www.dnr.state.mn.us/climate/historical/lcd.html?loc=msp
Explore the Climate Data
Use these shortcuts to move directly to the principal charts, analyses and historical records.
Climate Overview Graphs — RECENT YEARS
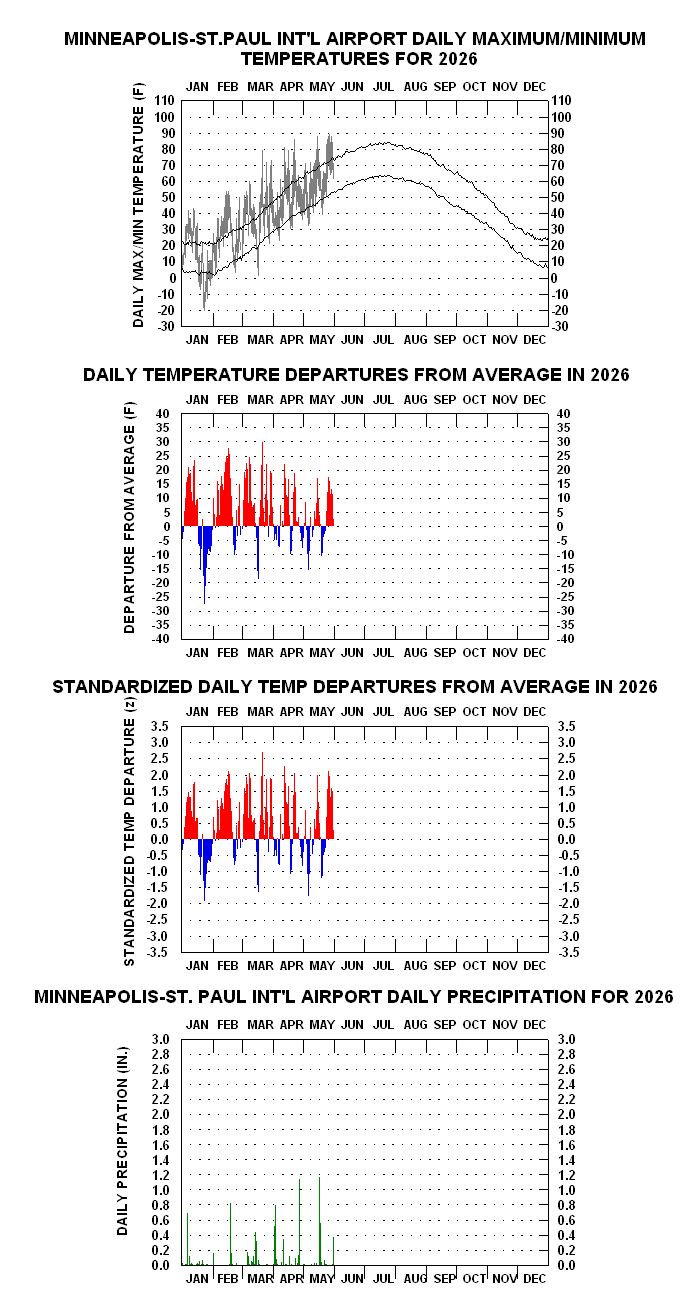
- 2026 Daily Temperature and Precipitation for Minneapolis-St. Paul NewNew (5/31/26)
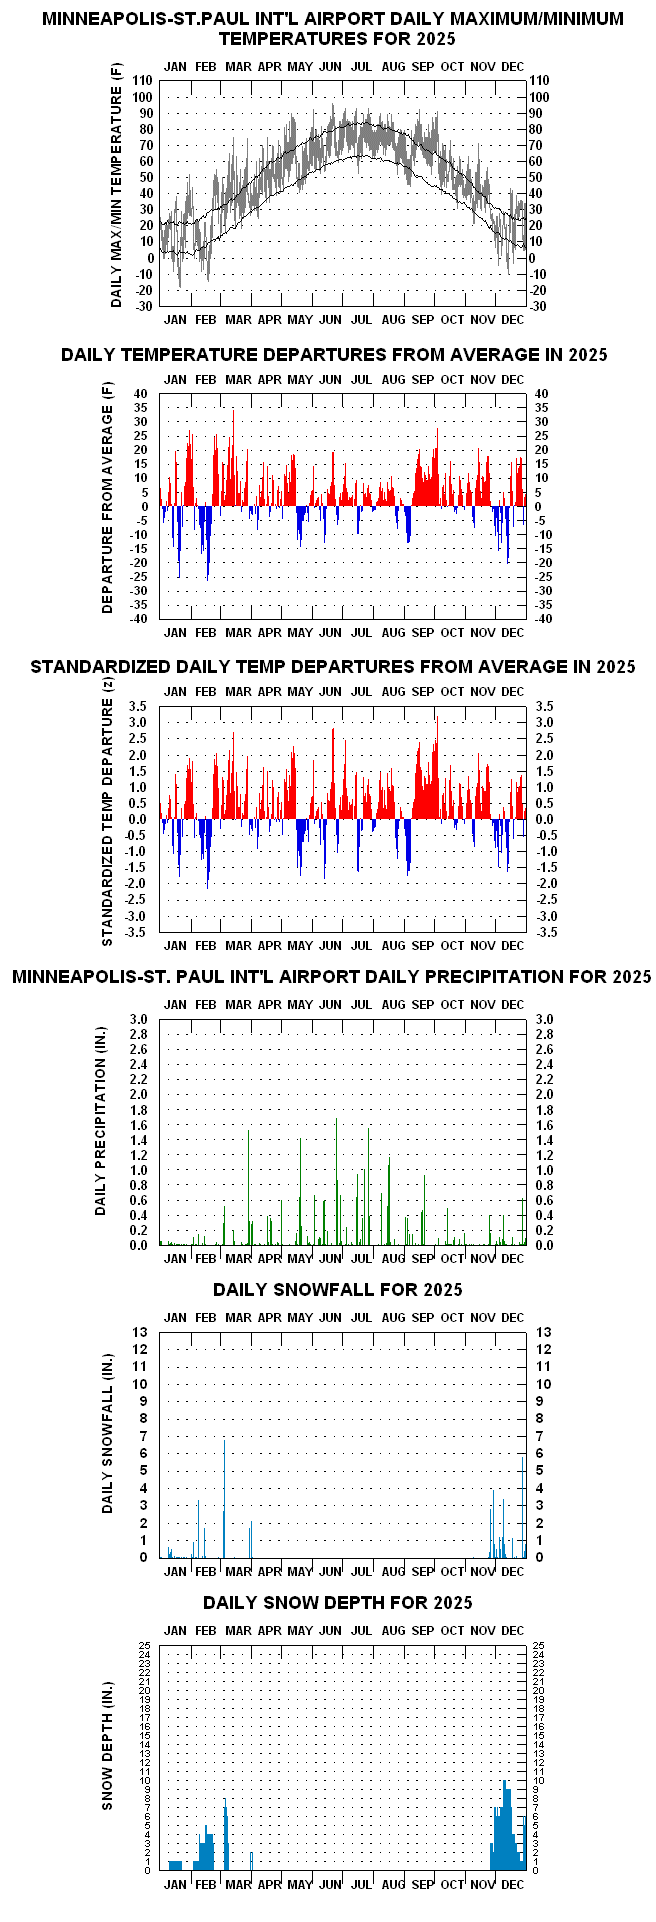
- 2025 Daily Temperature and Precipitation for Minneapolis-St. Paul
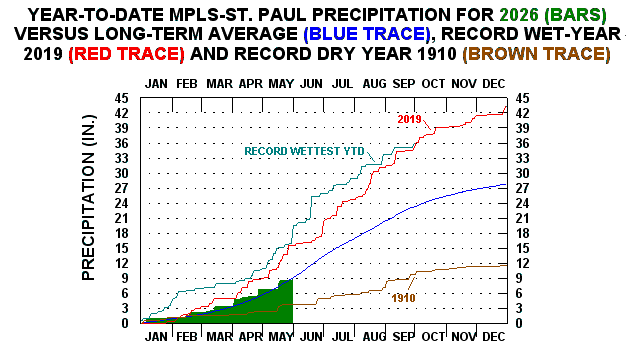
- 2026 Minneapolis-St. Paul YTD Precipitation vs. Long-Term Average & Extremes NewNew (5/31/26)
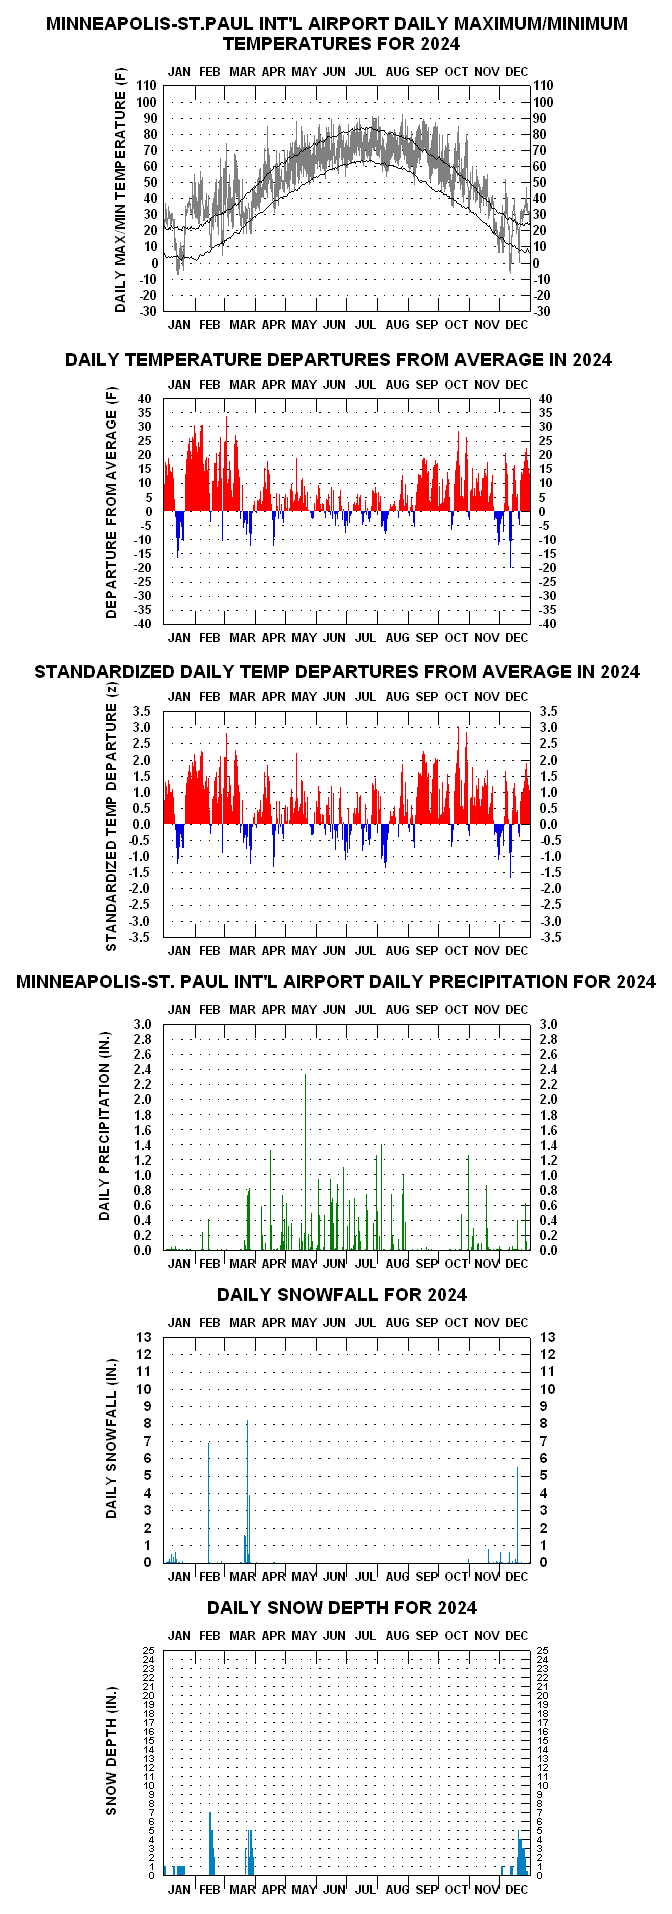
- 2024 Daily Temperature and Precipitation for Minneapolis-St. PaulWarmest Year in History (50.94 F) by 0.4 F. Surpasses 1931.
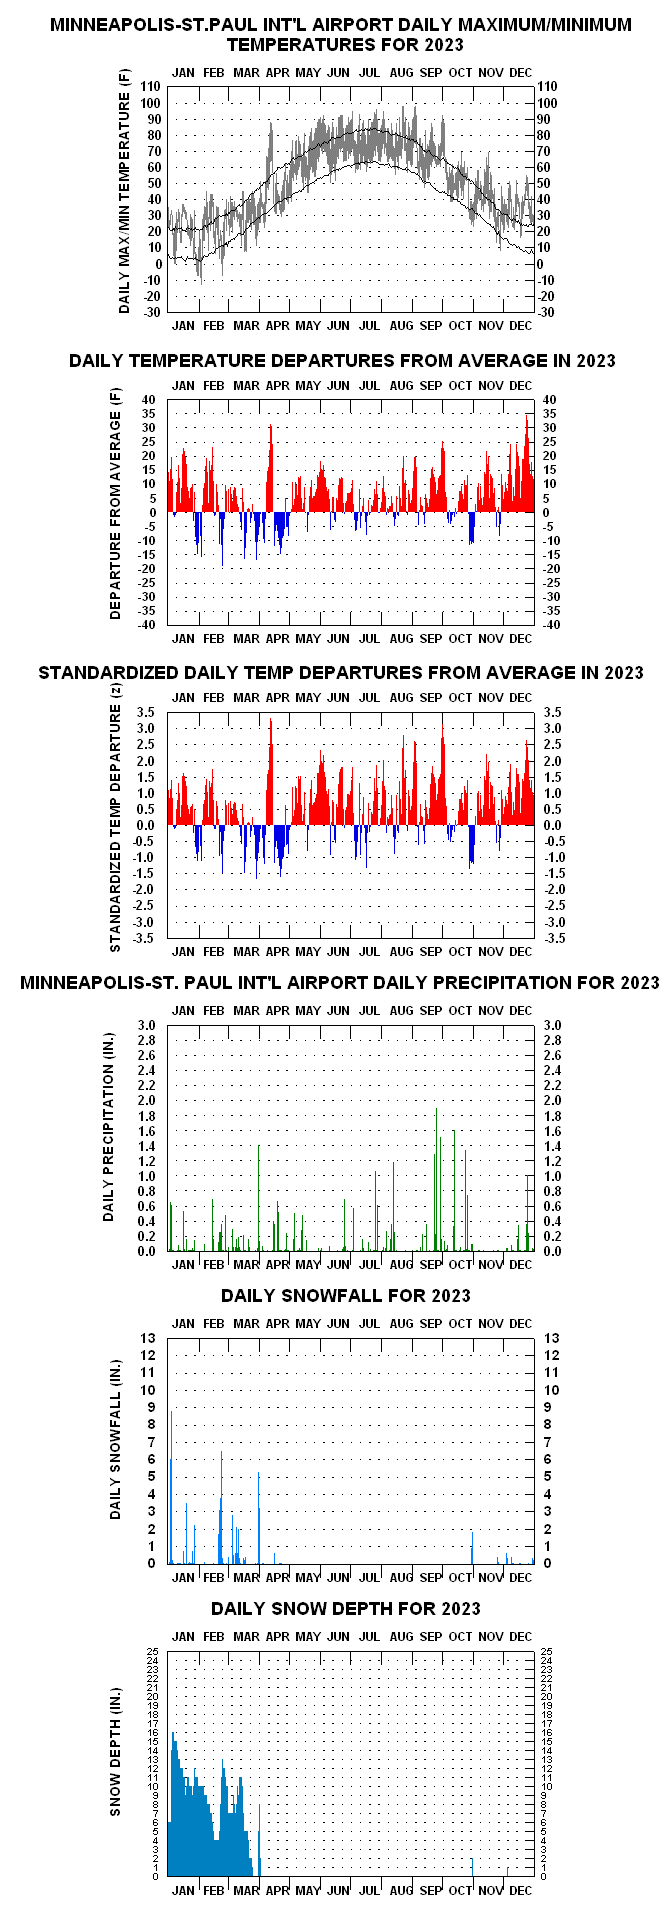
- 2023 Daily Temperature and Precipitation for Minneapolis-St.Paul
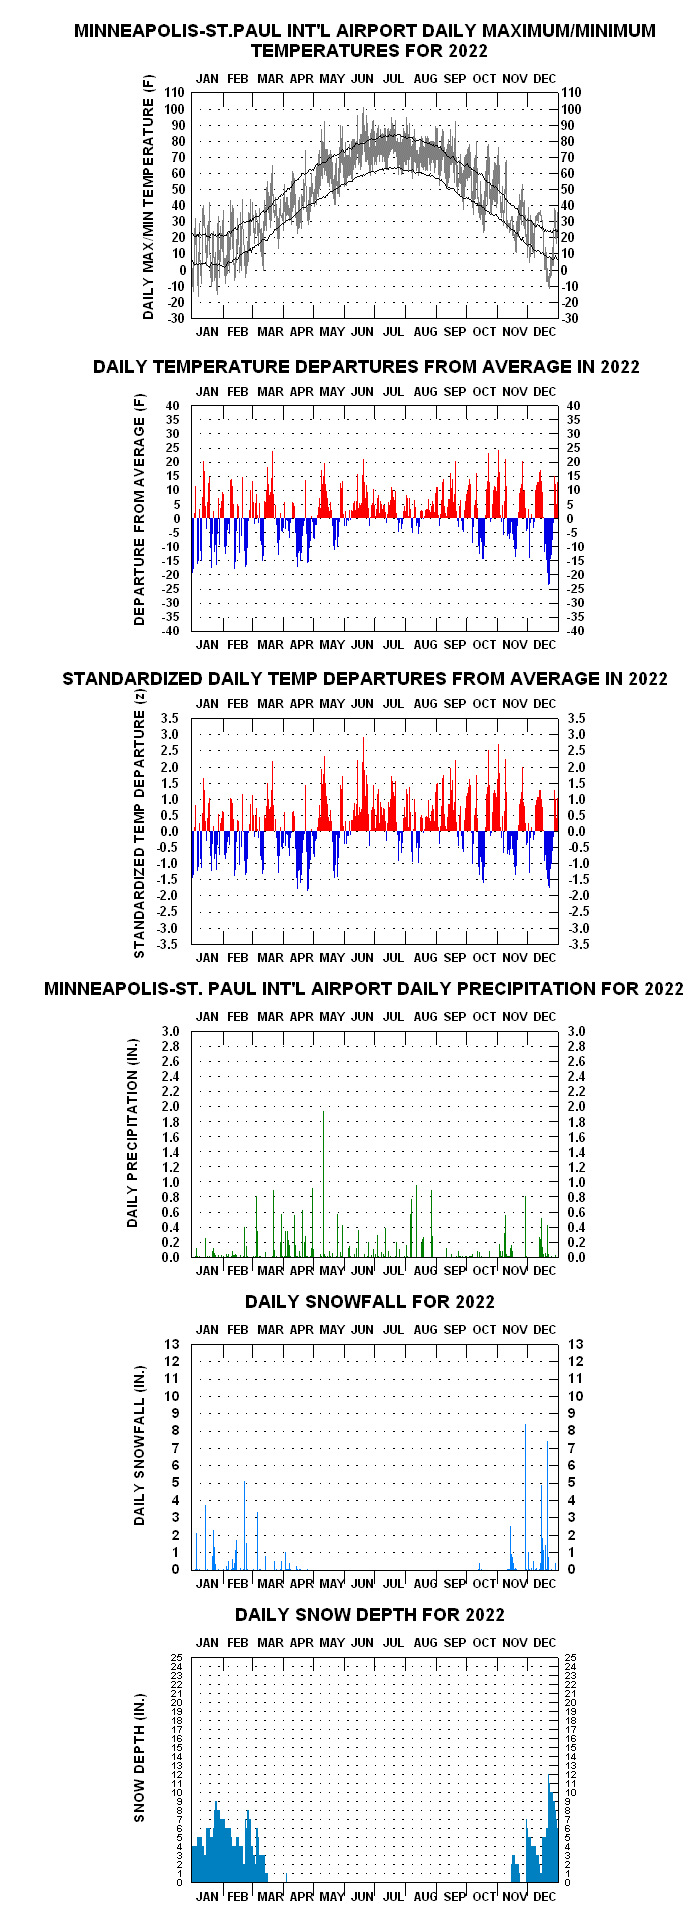
- 2022 Daily Temperature and Precipitation for Minneapolis-St. Paul
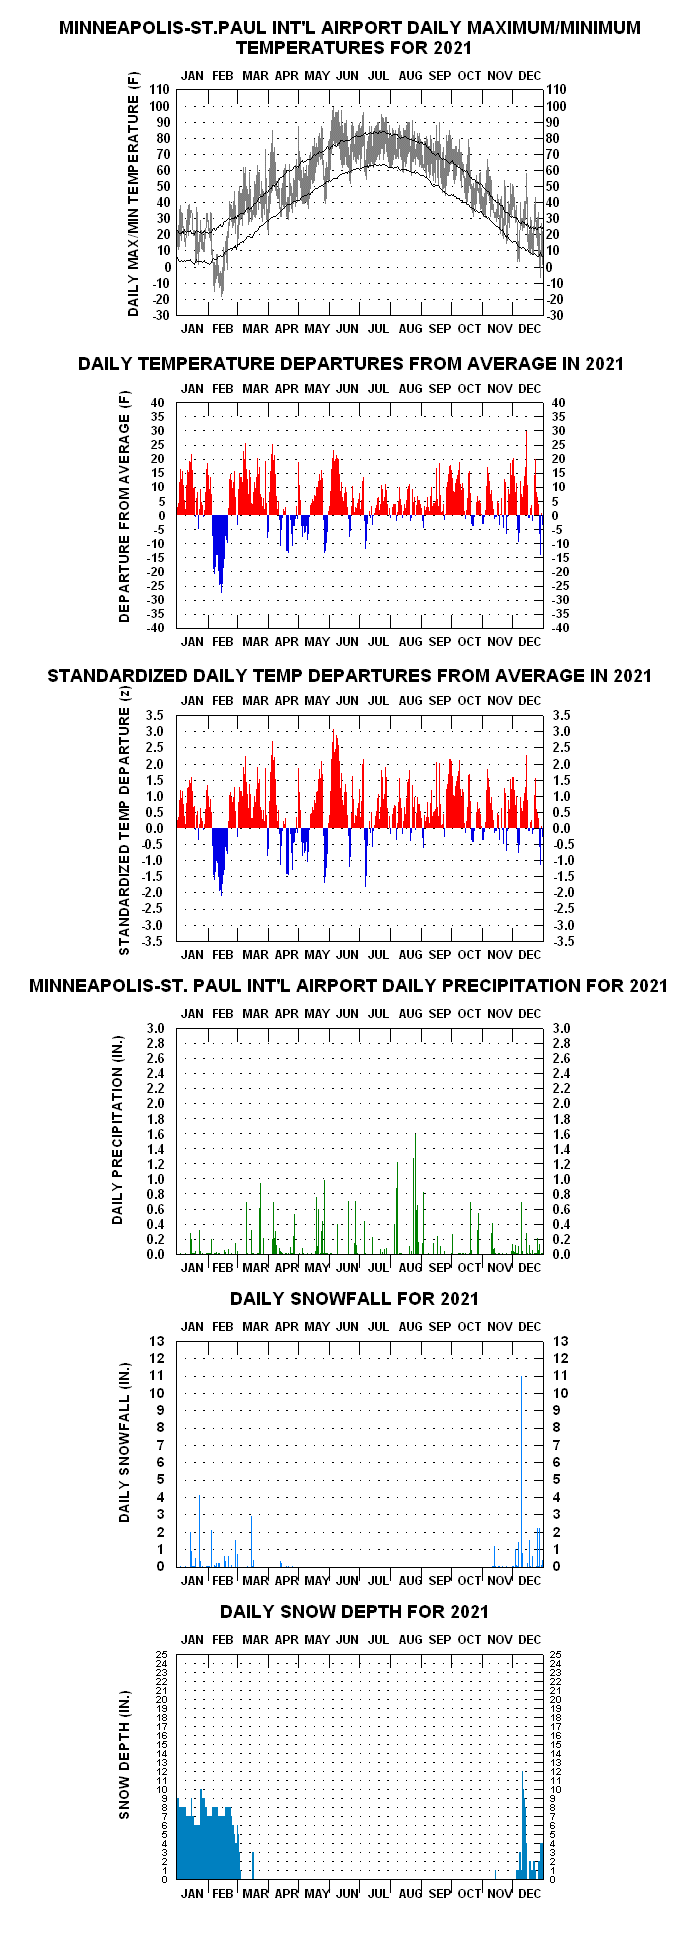
- 2021 Daily Temperature and Precipitation for Minneapolis-St. Paul
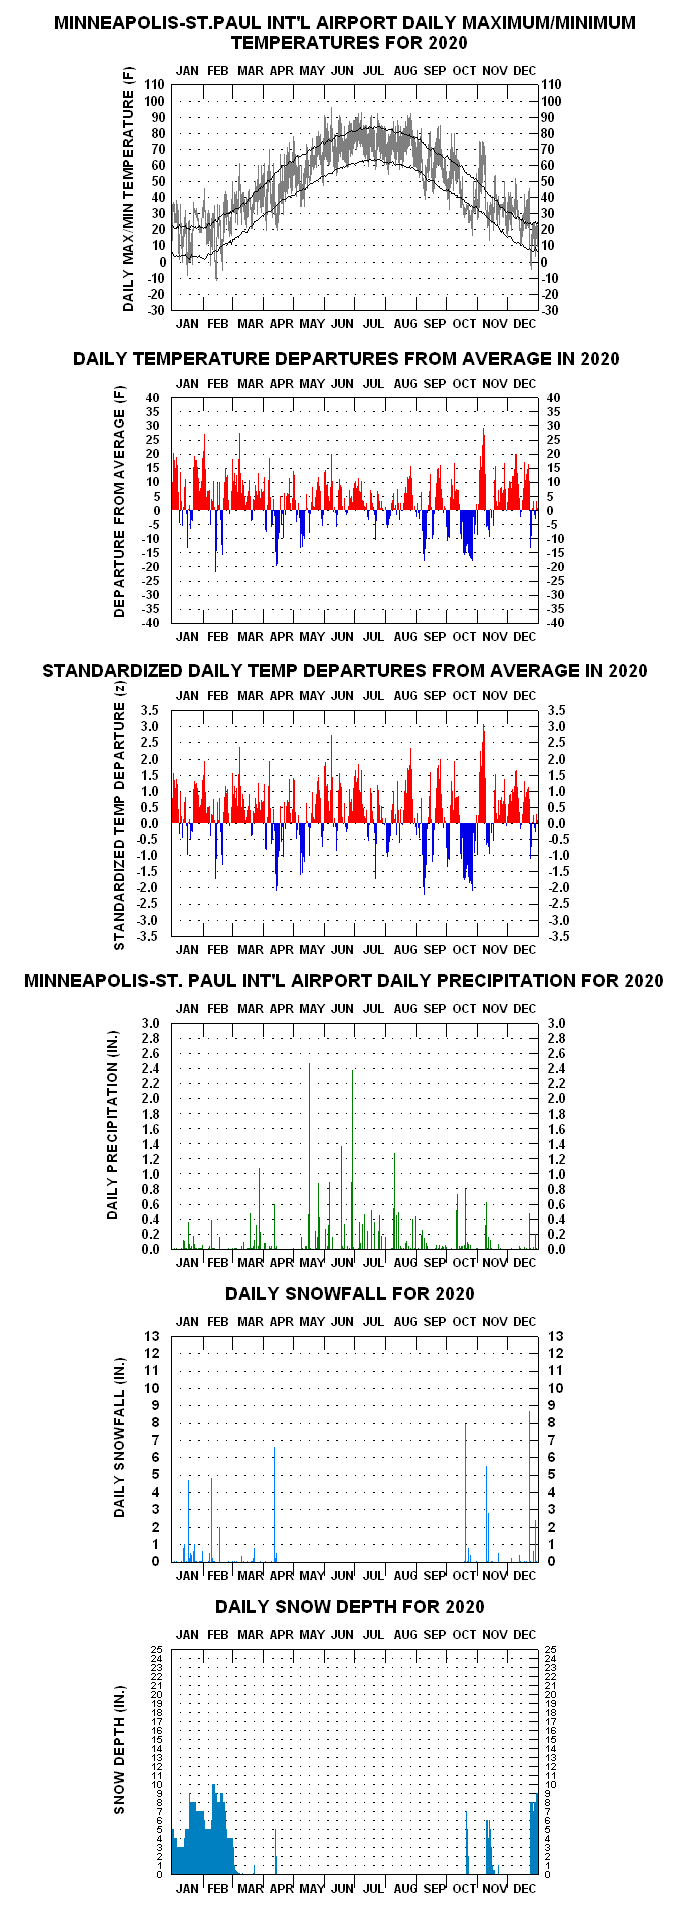
- 2020 Daily Temperature and Precipitation for Minneapolis-St. Paul
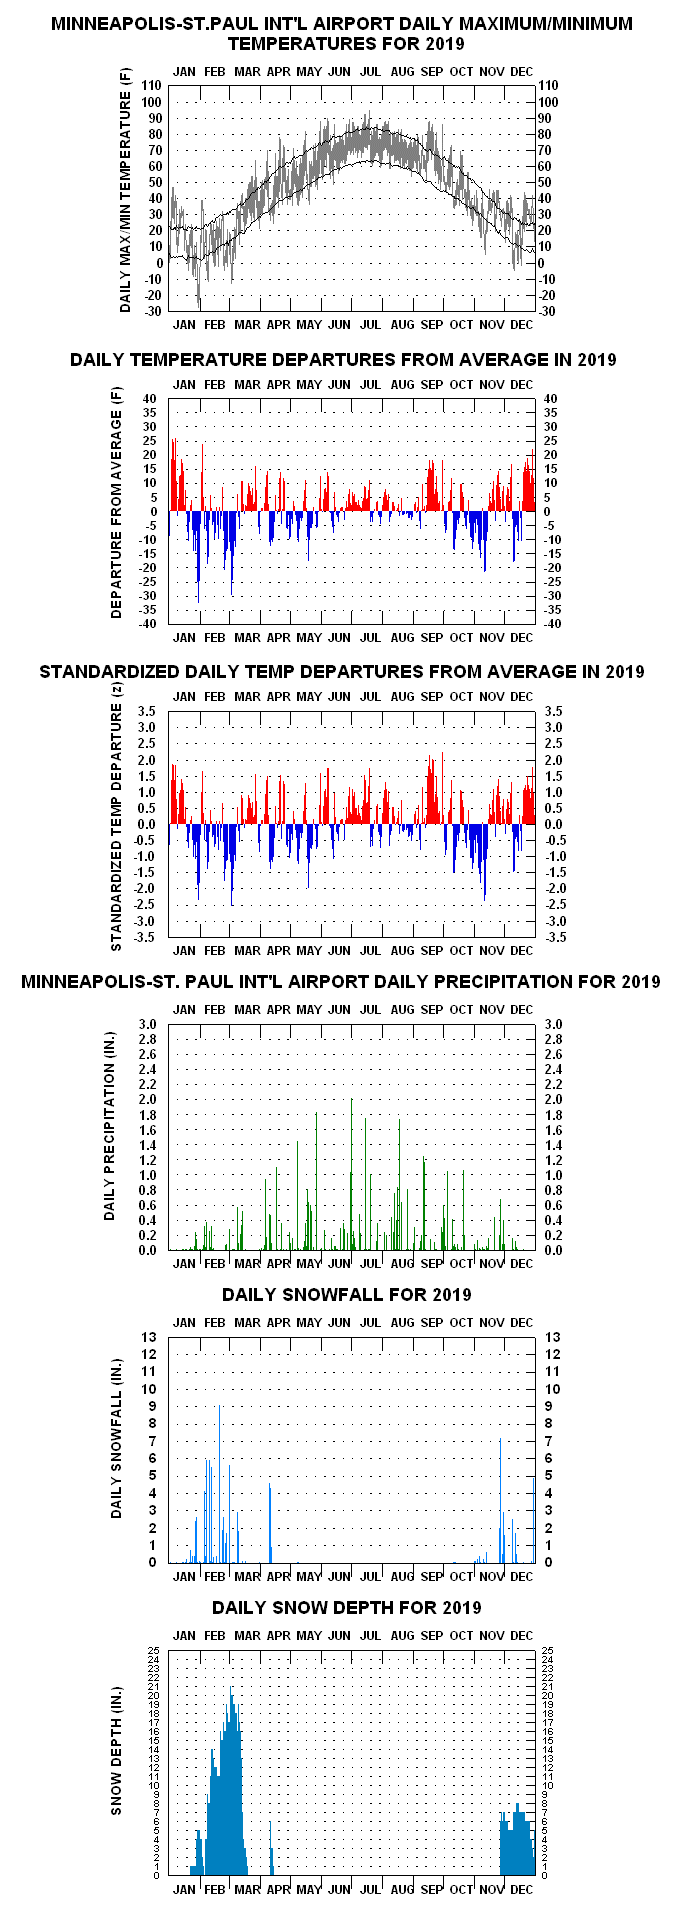
- 2019 Daily Temperature and Precipitation for Minneapolis-St. Paul
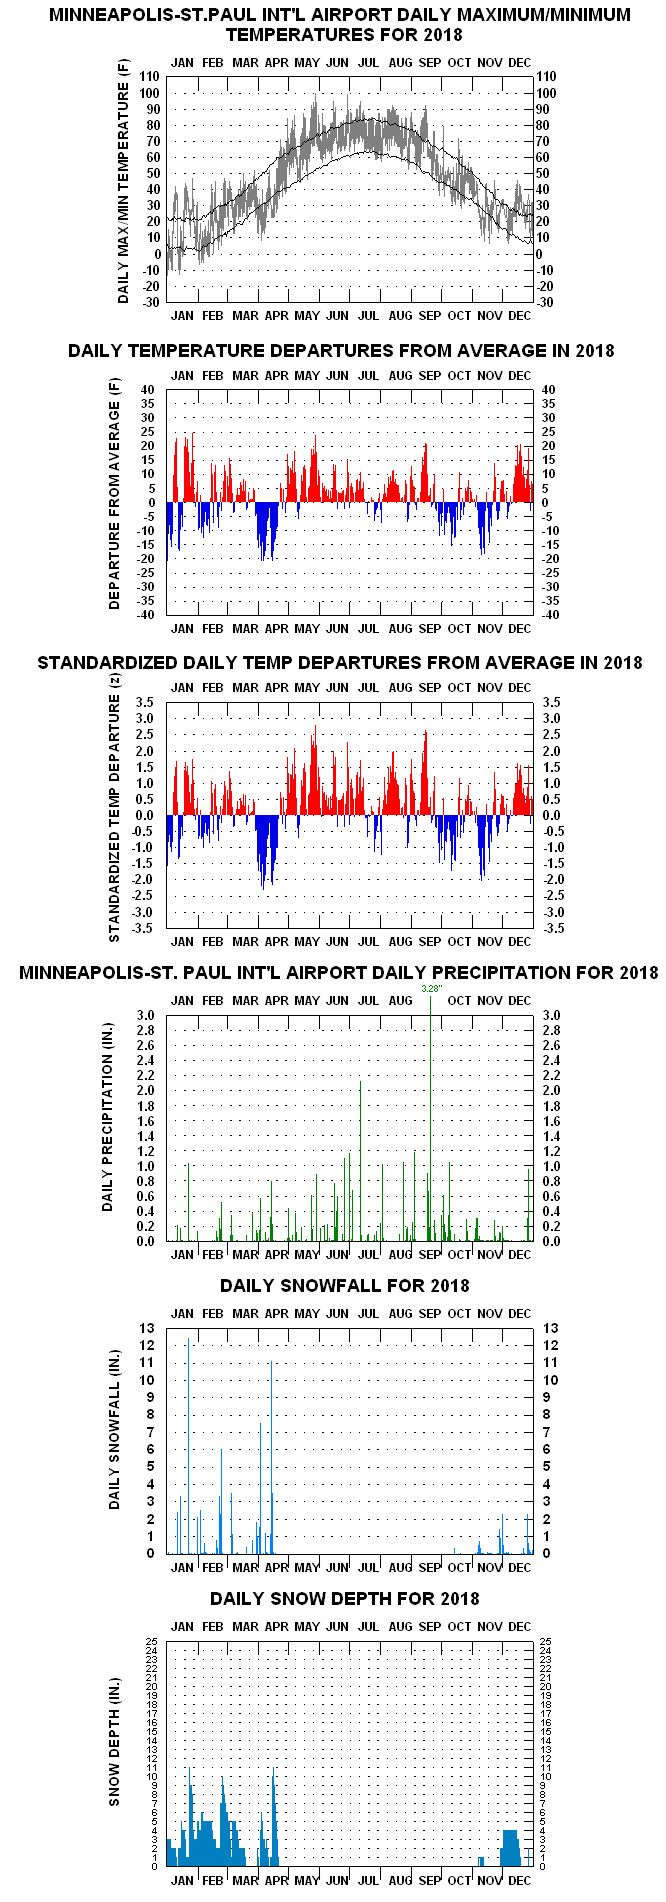
- 2018 Daily Temperature and Precipitation for Minneapolis-St.Paul
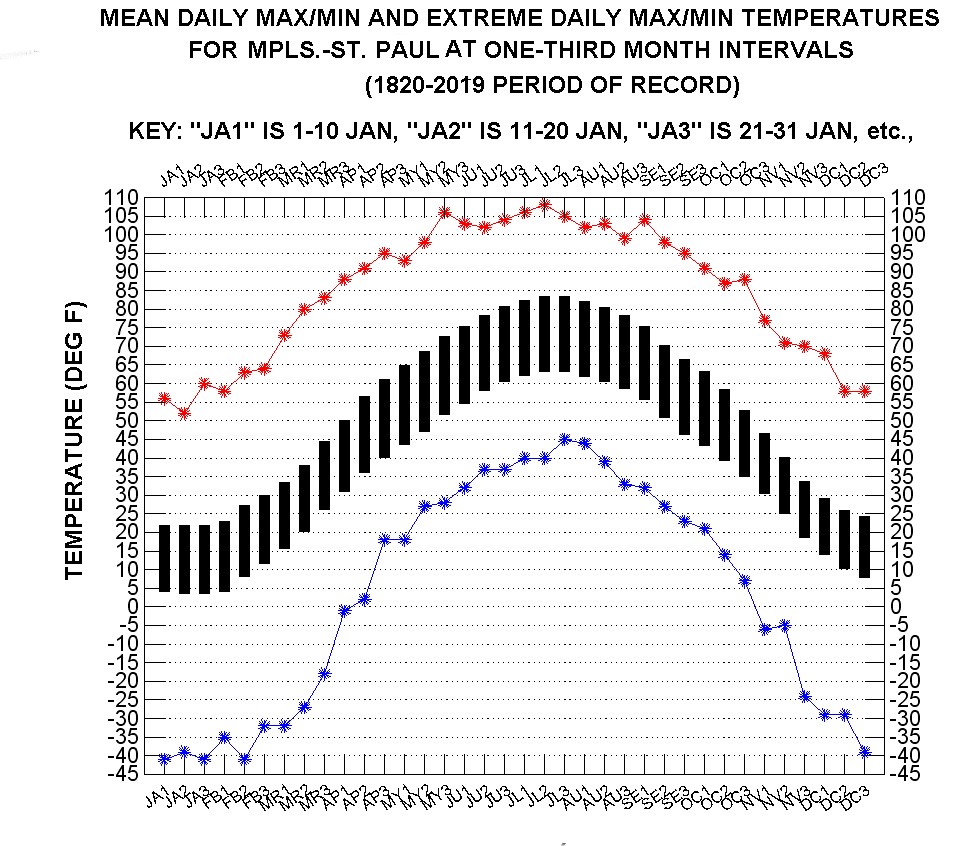
Minneapolis-St. Paul Daily Temperature Means & Extremes
Other Minneapolis-St. Paul Daily Temperature Stats And Tables
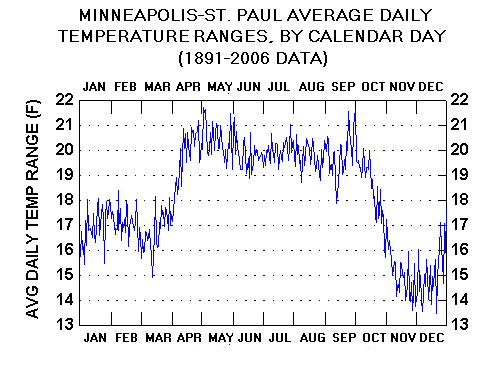
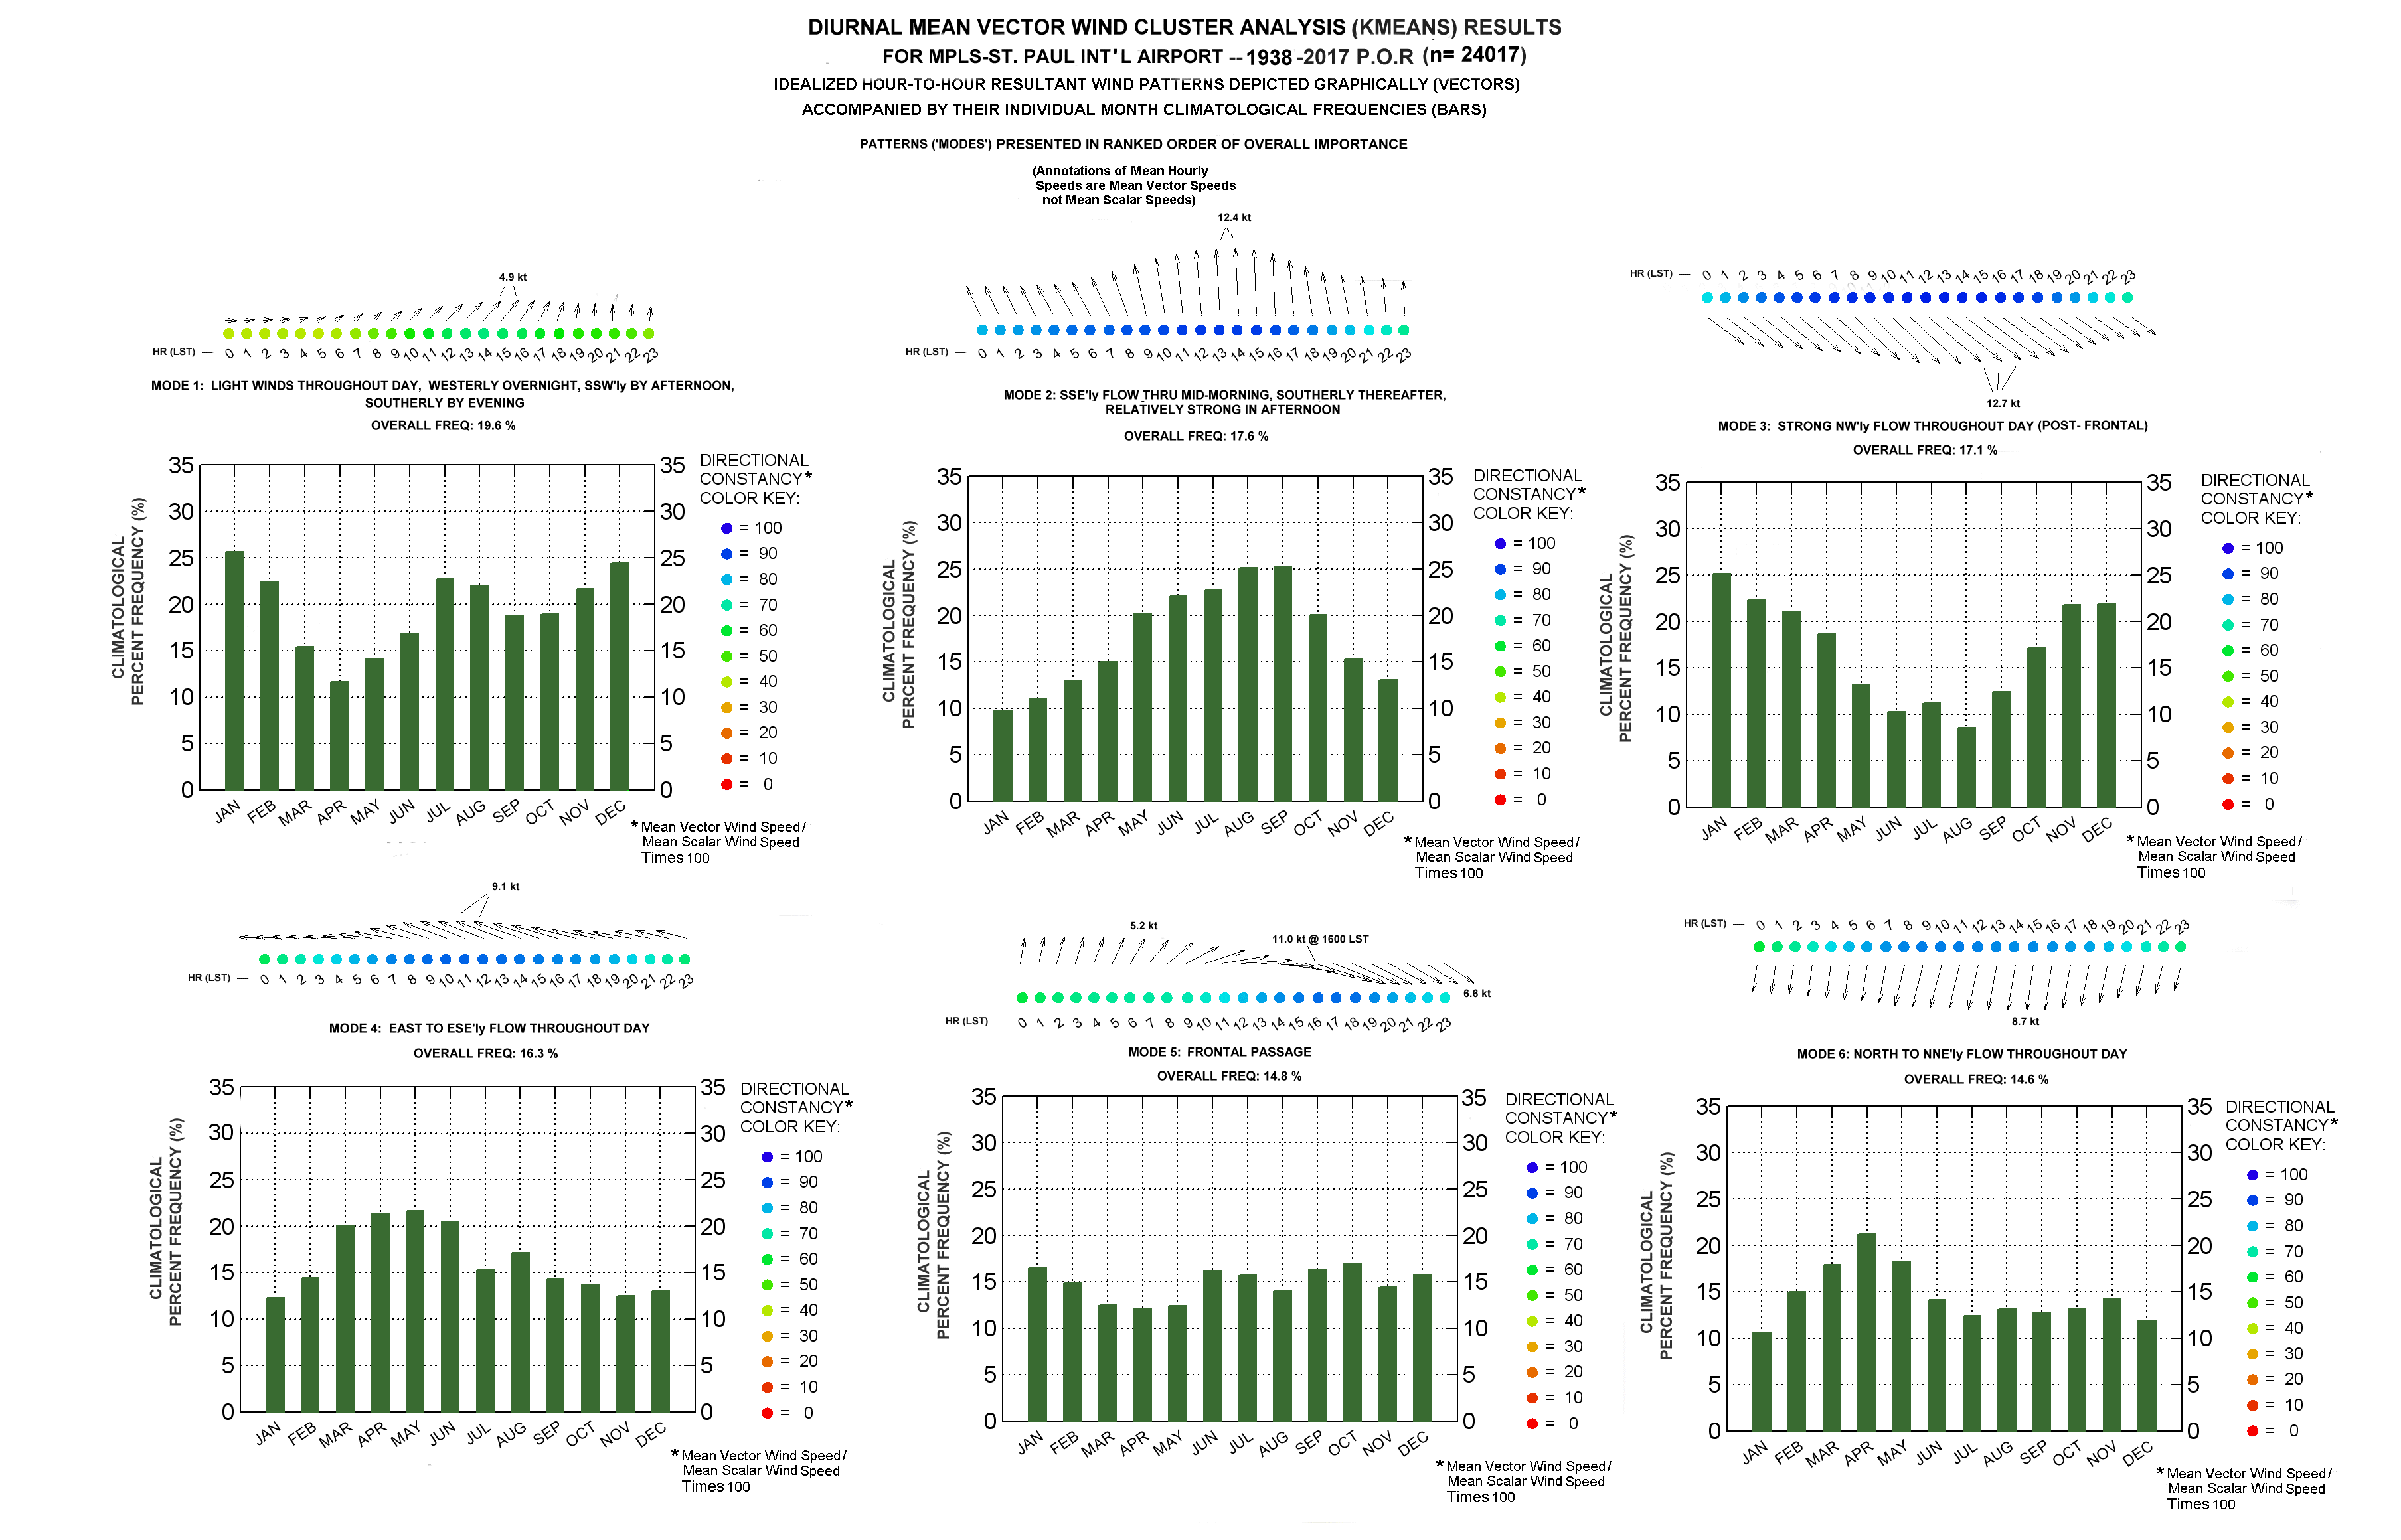
- Minneapolis-St. Paul Average Daily Temperature Ranges, by Calendar DayCluster Analysis of Minneapolis-St. Paul Midnight-to-Midnight Resultant Wind Patterns
- Cluster Analysis of Minneapolis-St. Paul Midnight-to-Midnight Resultant Wind PatternsMinneapolis-St. Paul Average Daily Temperature Ranges, by Calendar Day Cluster Analysis of Minneapolis-St. Paul Midnight-to-Midnight Resultant Wind Patterns
Annual Mean & Extreme Temperature Graphs
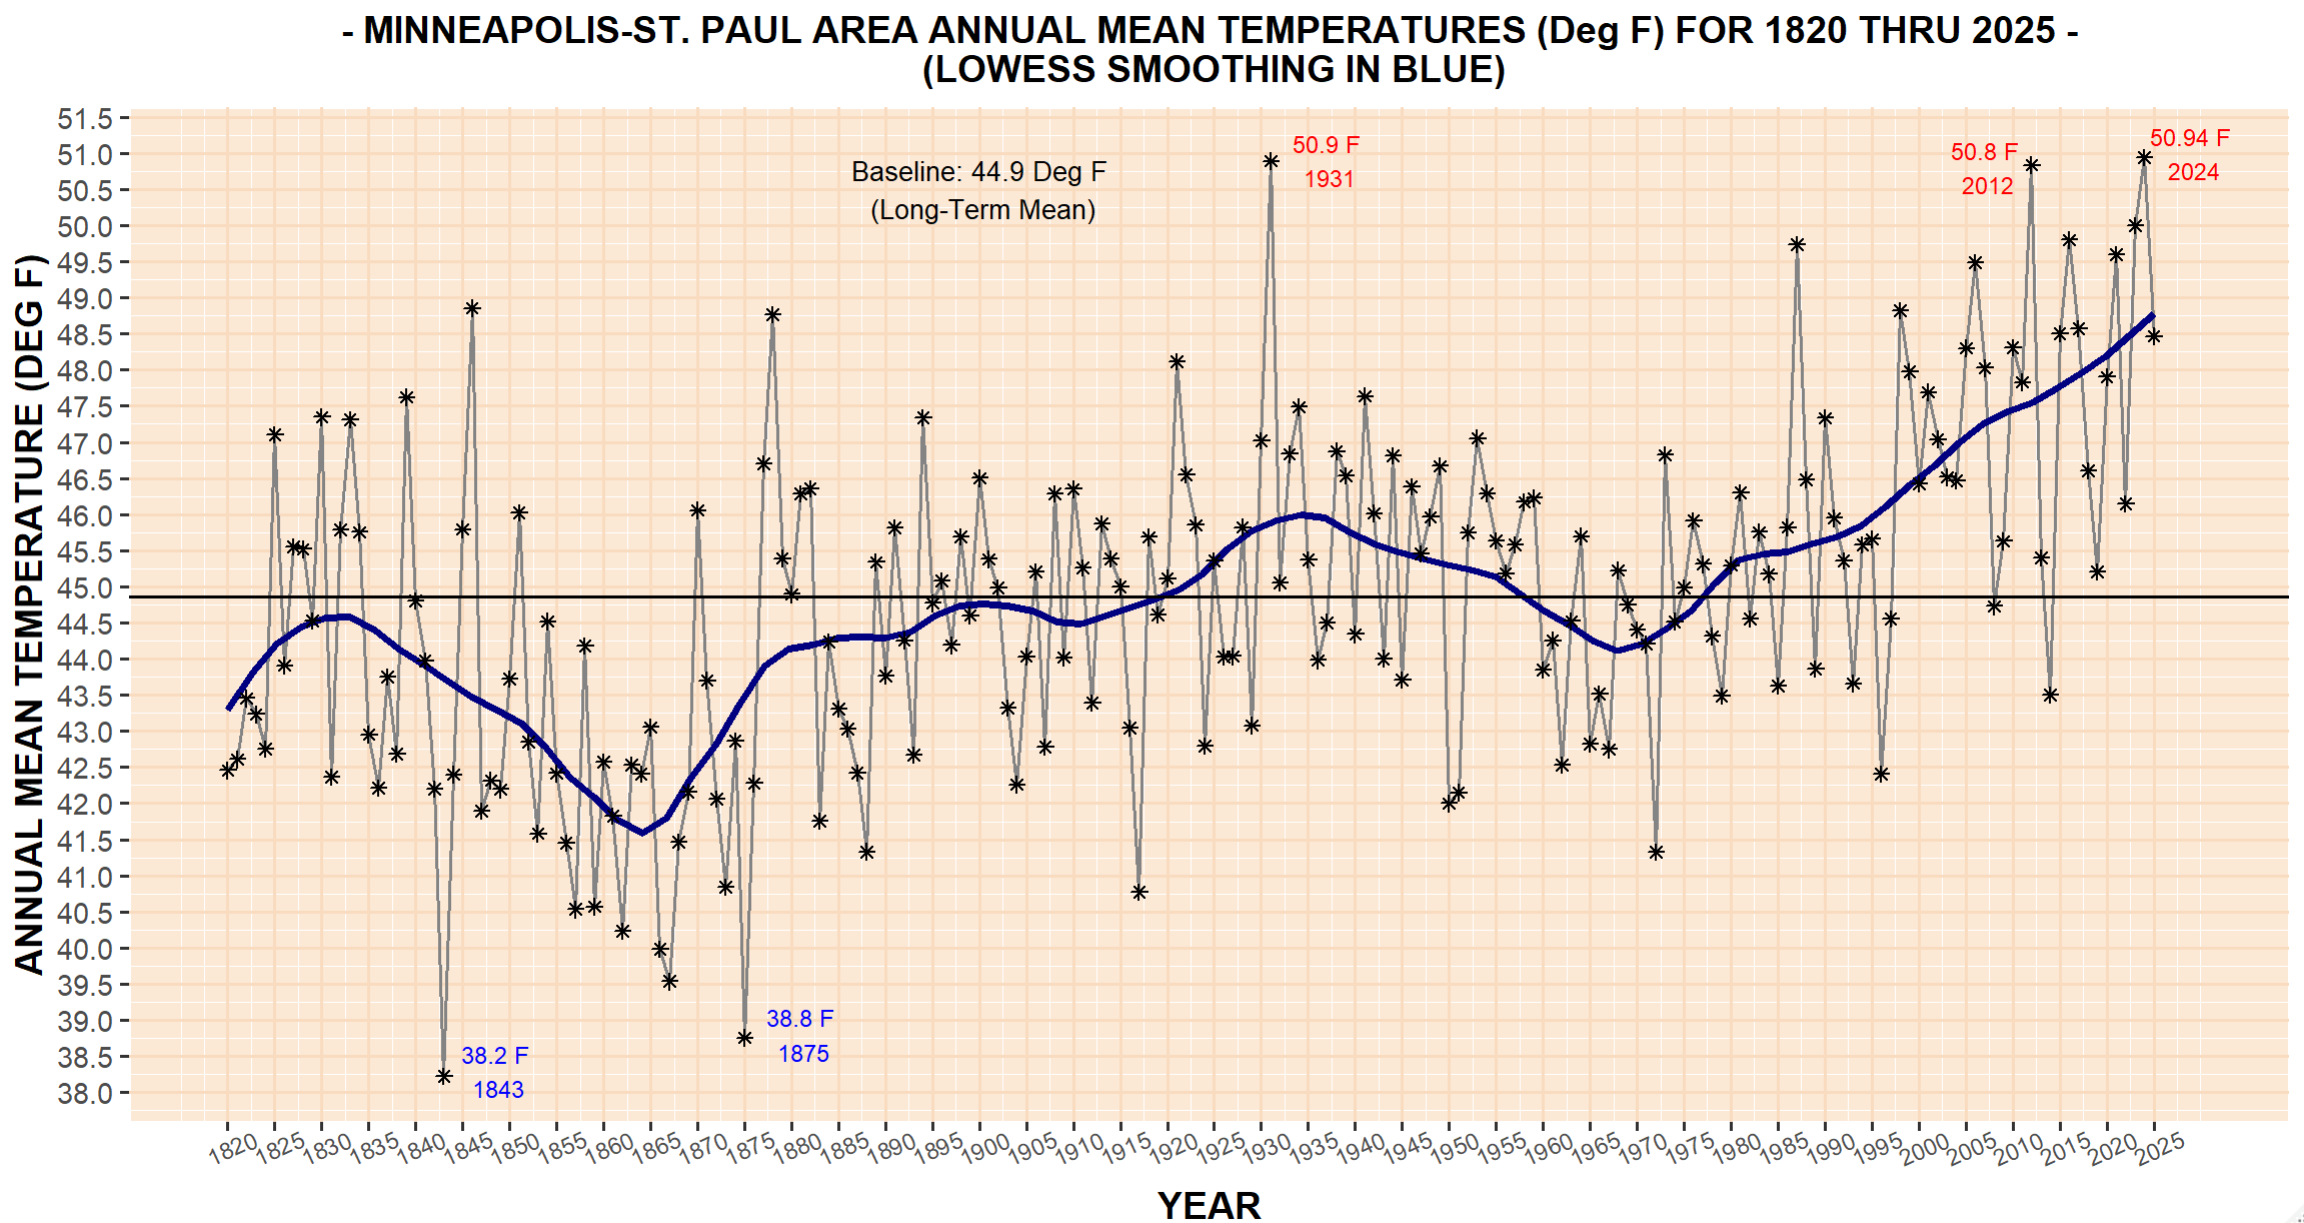
- Minneapolis-St. Paul Annual Mean Temperature History (1820-2025) NewNew (1/3/26)
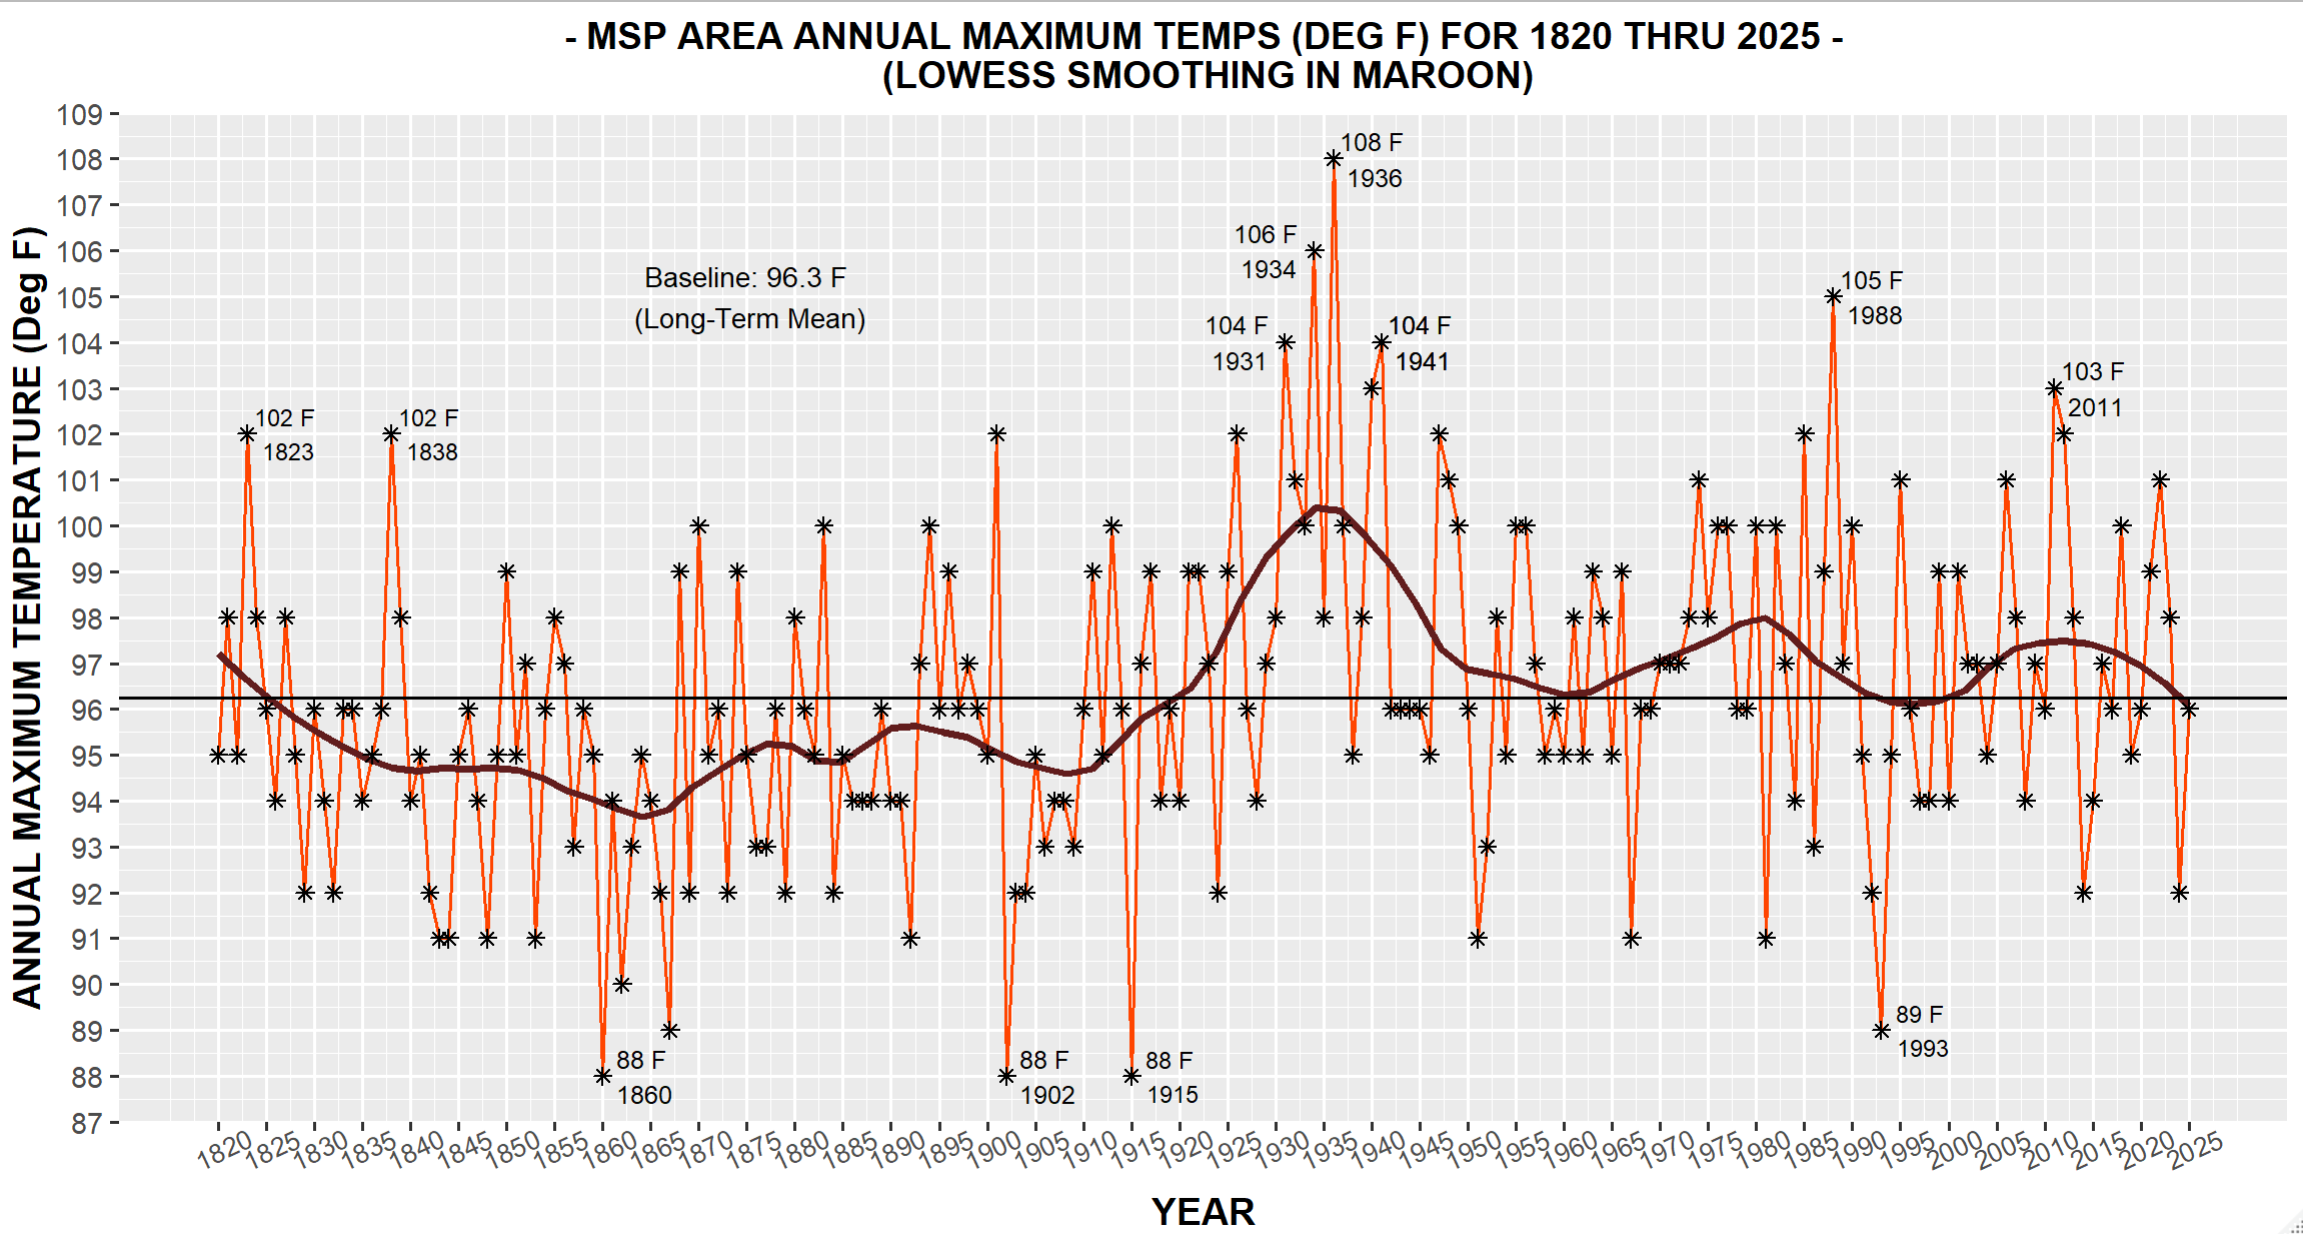
- MSP Area Annual Maximum Temperatures (1820-2025) NewNew (1/3/26)
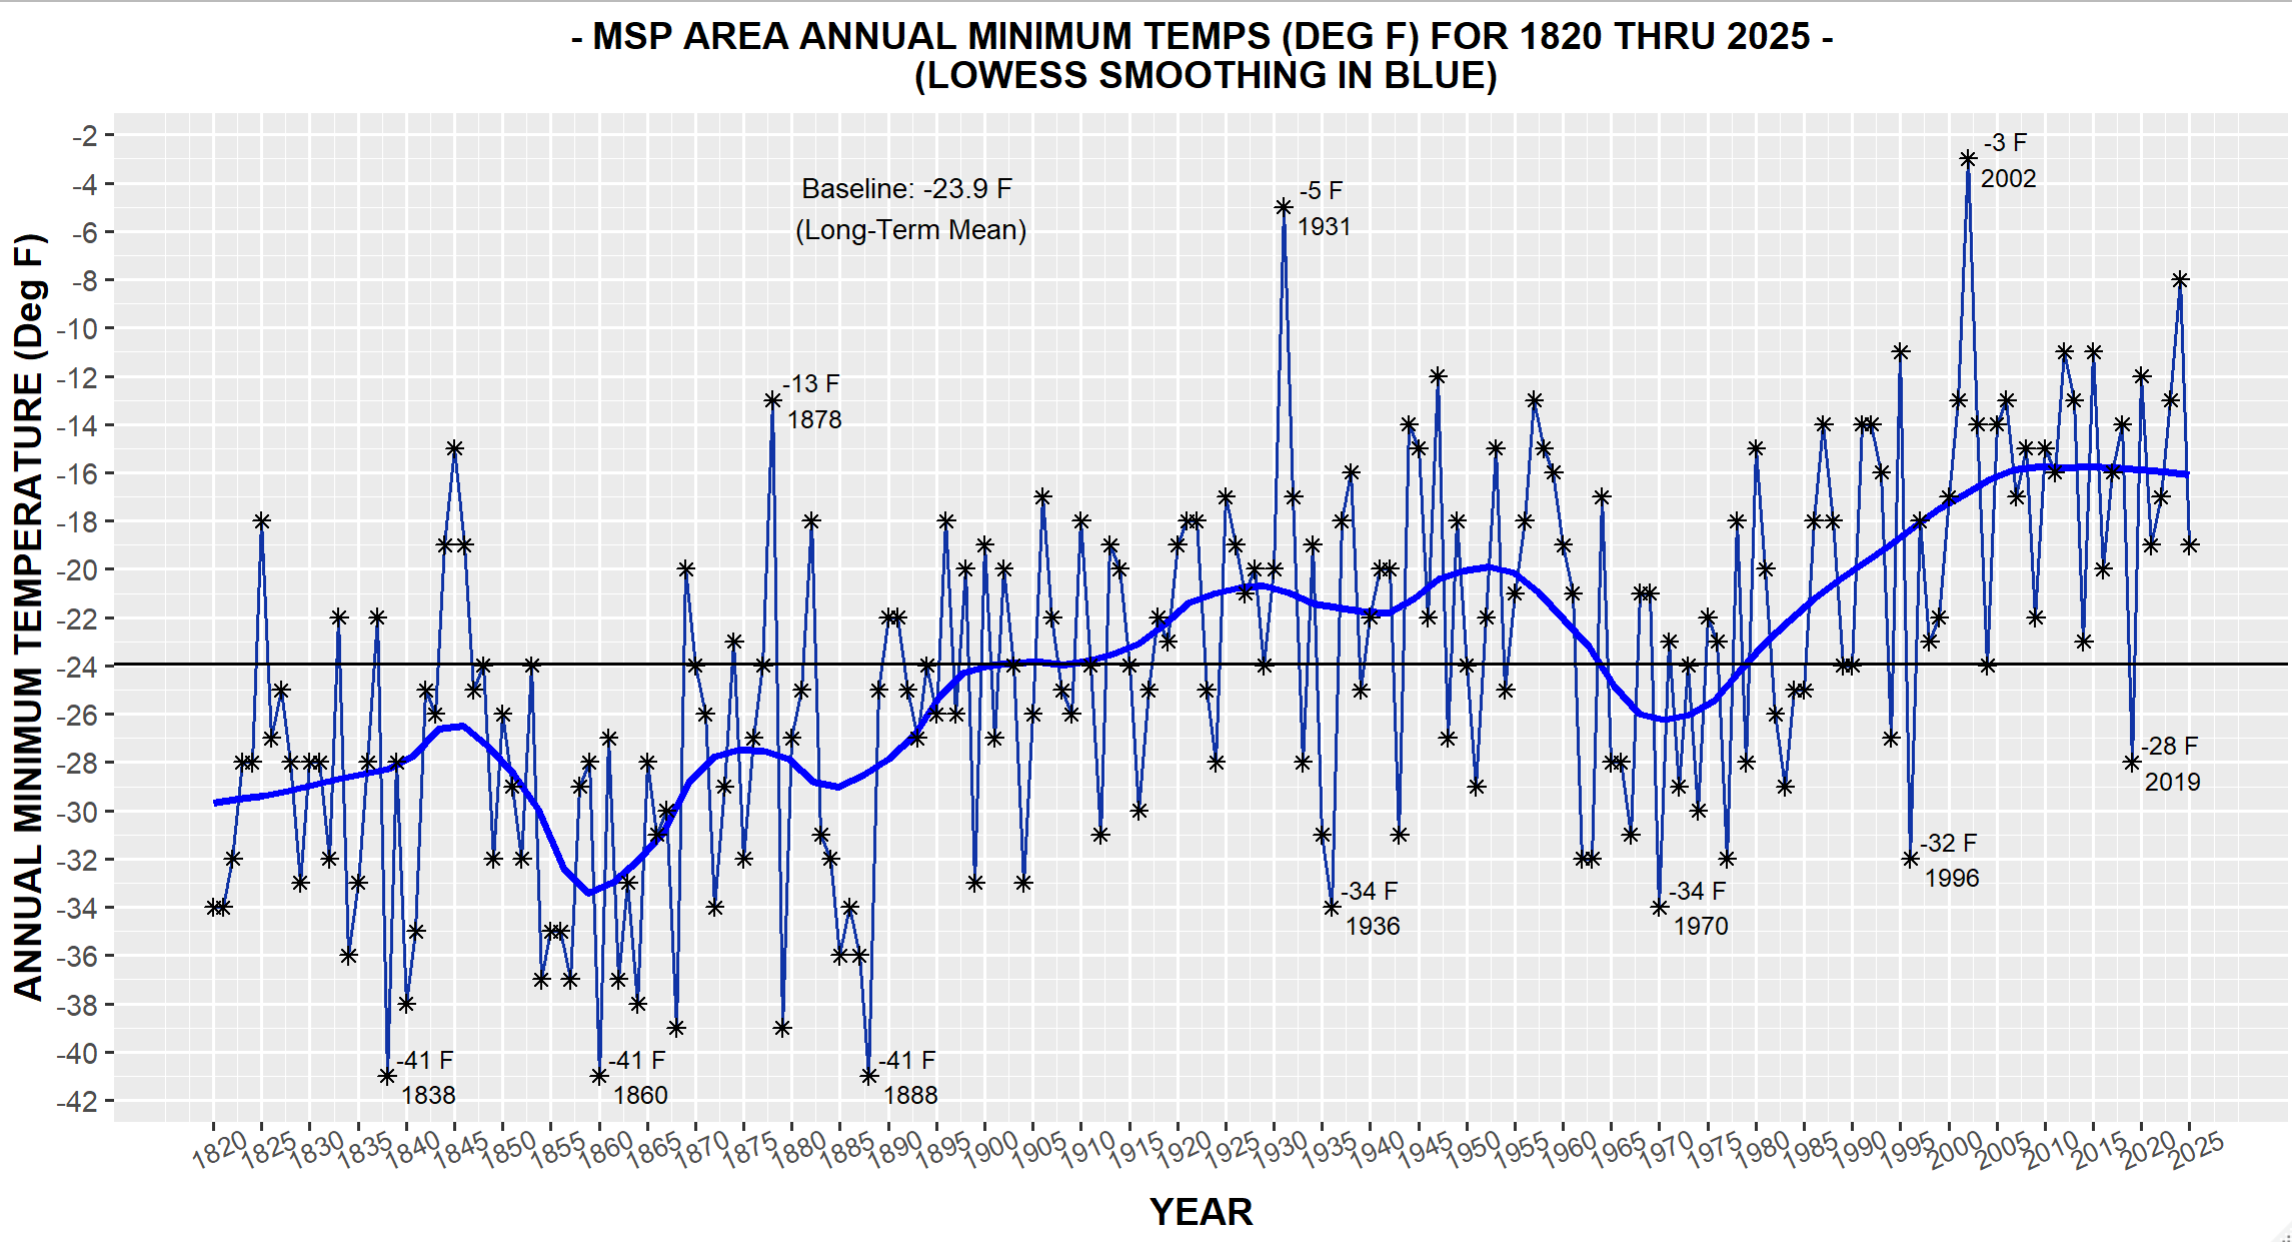
- MSP Area Annual Minimum Temperatures (1820-2025) NewNew (1/3/26)
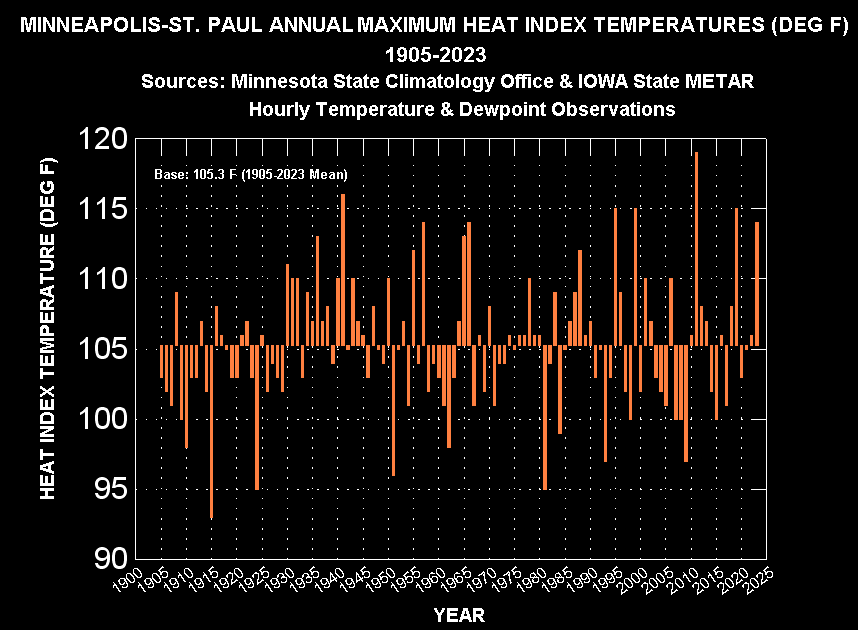
- Minneapolis-St. Paul Annual Maximum Heat Index Temperature History (1905-2023)
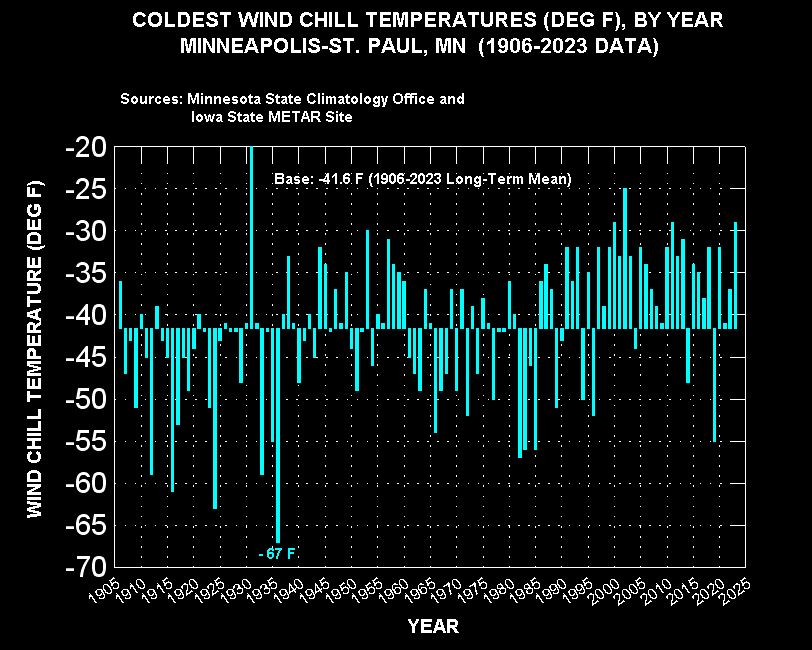
- Minneapolis-St. Paul Annual Coldest Wind Chill Temperature History (1906-2023)
Precipitation:
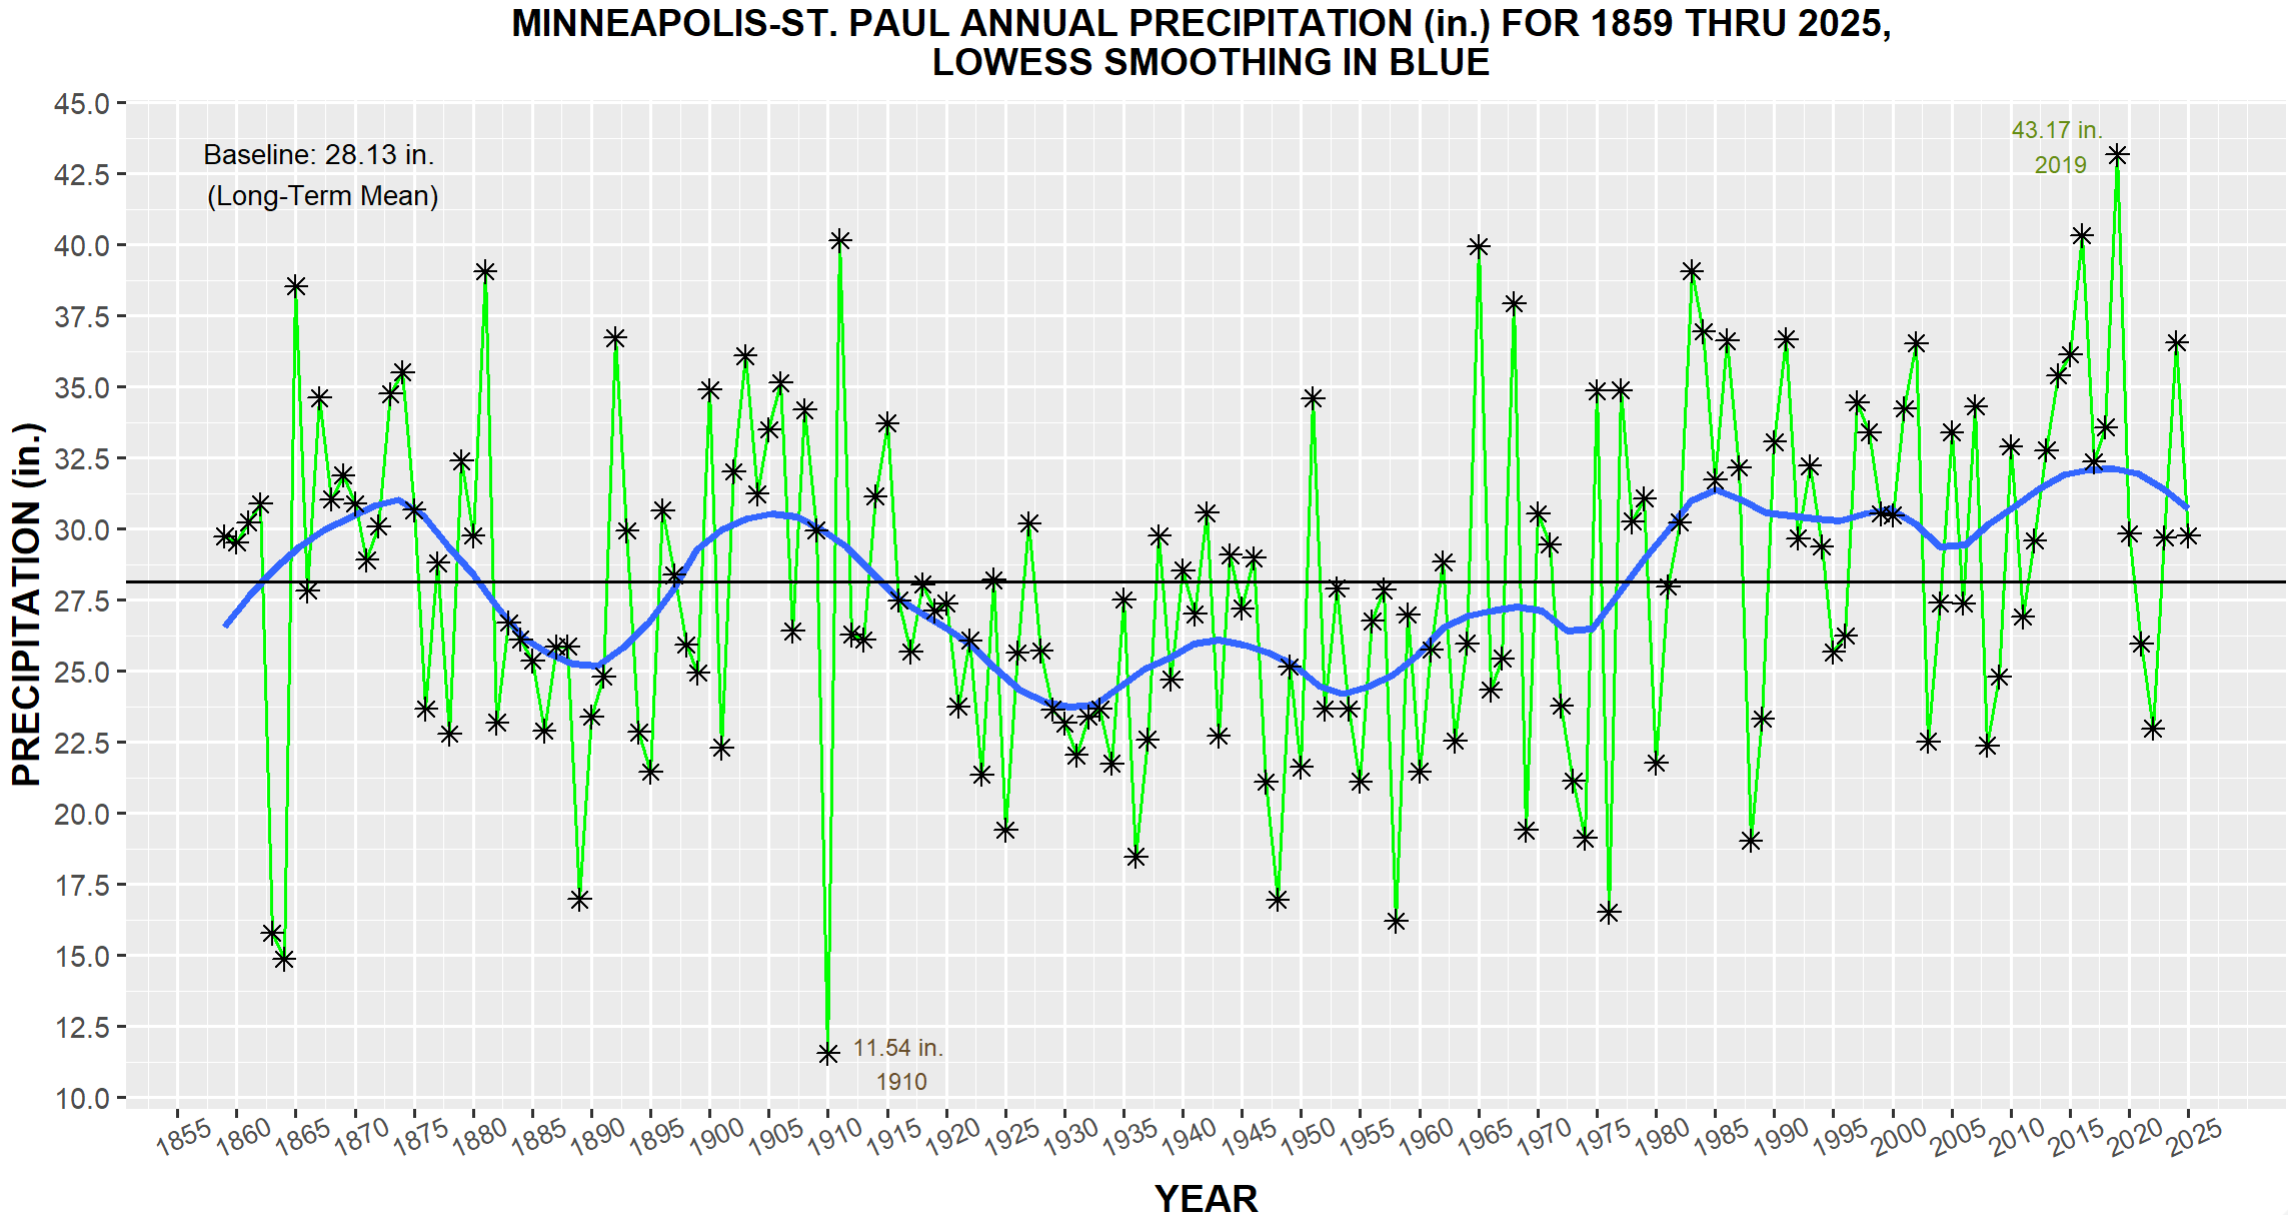
- Minneapolis-St. Paul Annual Precipitation History (1859-2025) NewNew (1/3/26)
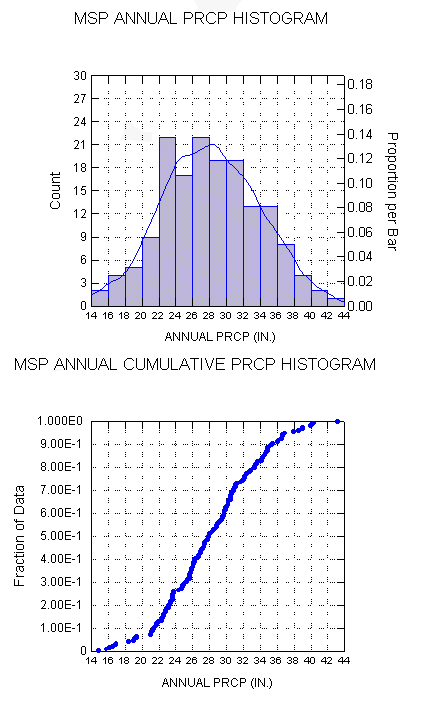
- MSP Annual Precipitation Histograms (1859-2019)
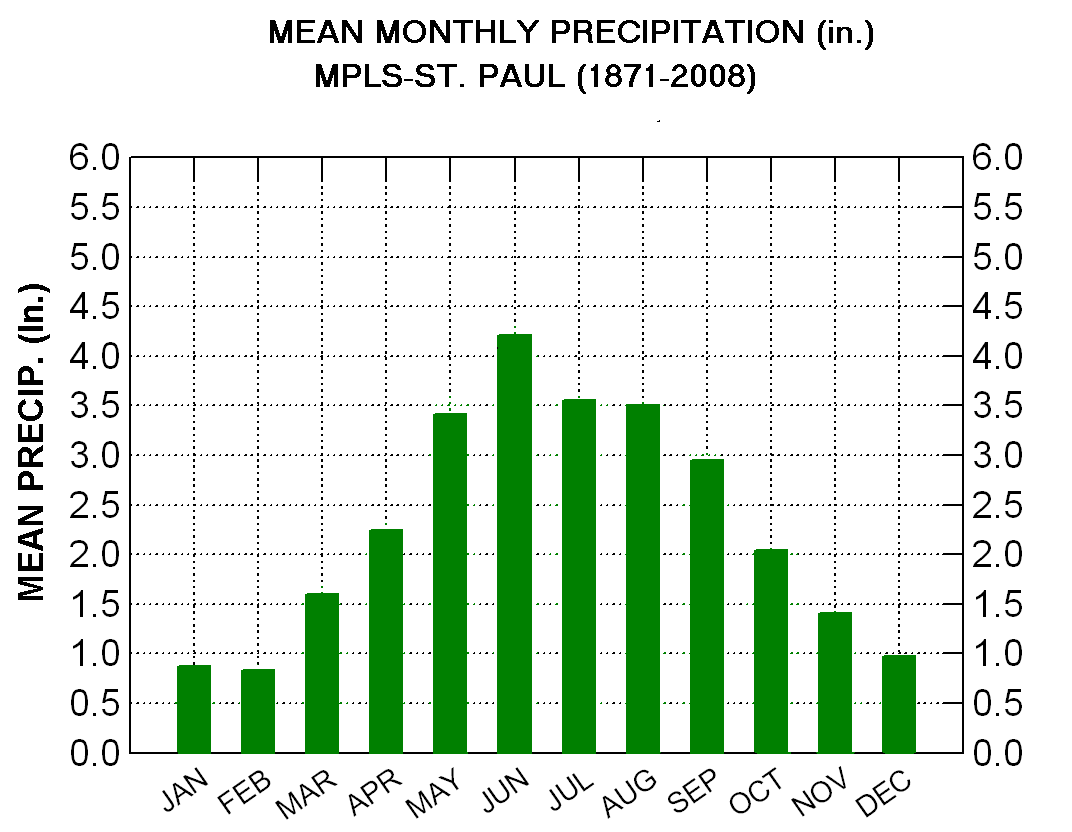
- Minneapolis-St. Paul Average Monthly Precipitation
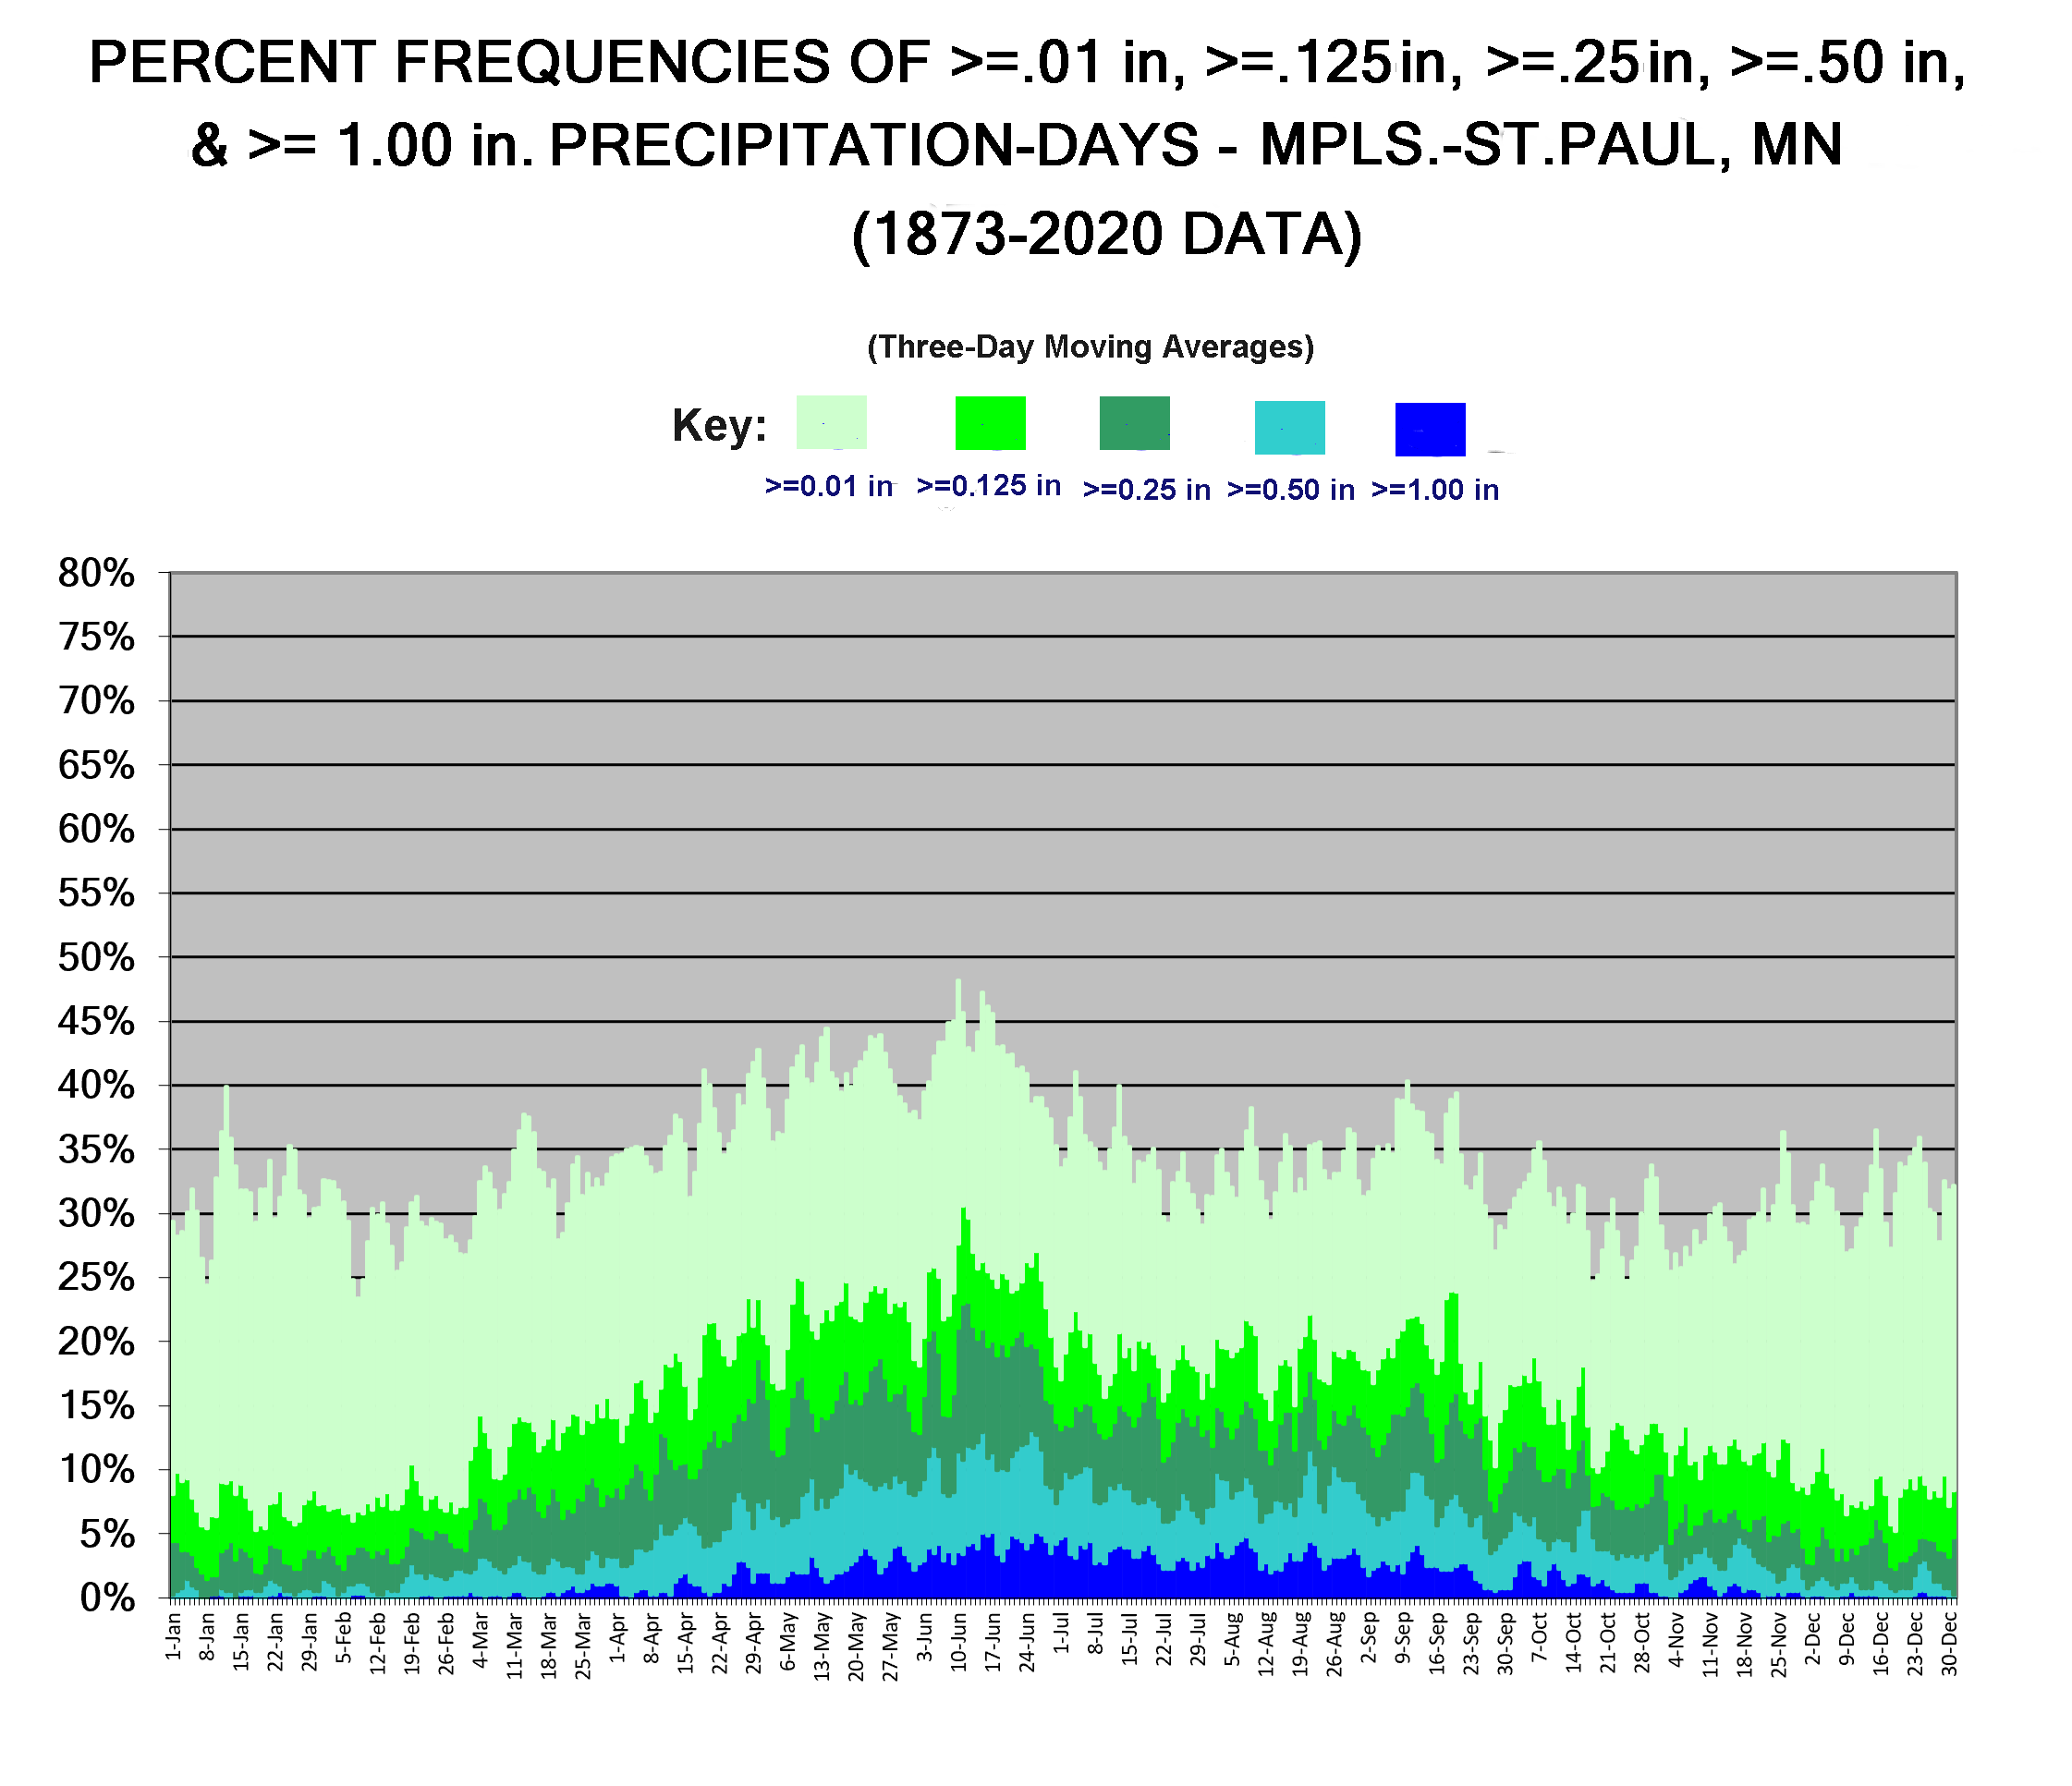
- Minneapolis-St. Paul Prcp-Day Frequencies for >=0.01″, >=0.13″, >=,125", >=0.25″, >=0.50″, & >=1.00″ Magnitudes, by Calendar Day (1873-2020 data)
Snowfall:
- MONTH/HOUR CLIMOGRAMS AND OTHER:
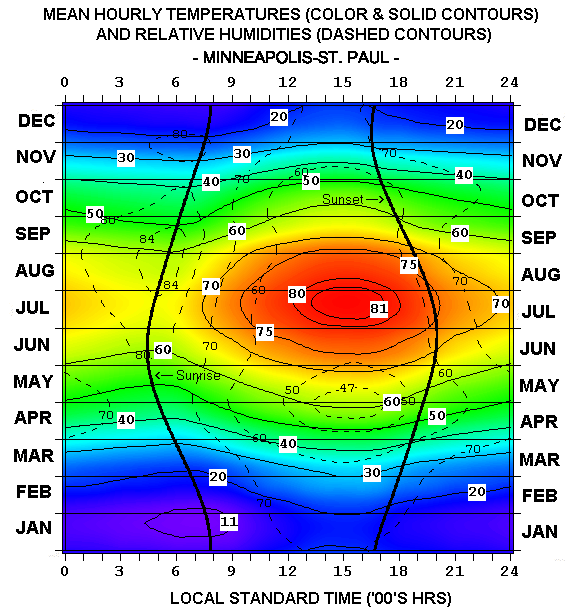
- Mean Hourly Temperature/Humidity
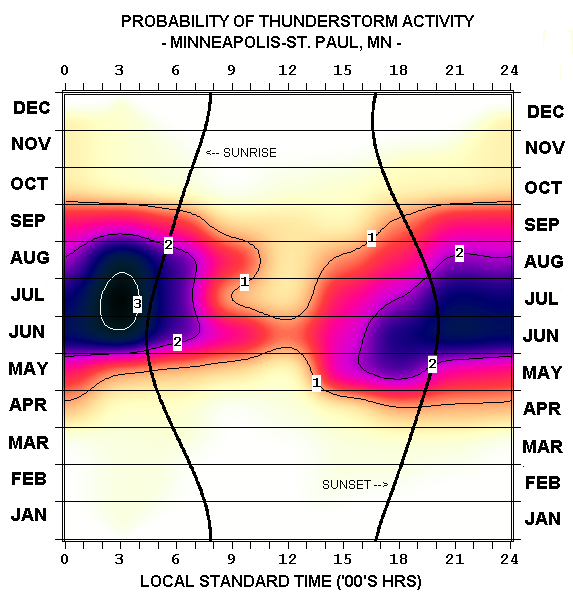
- Thunderstorm Freq
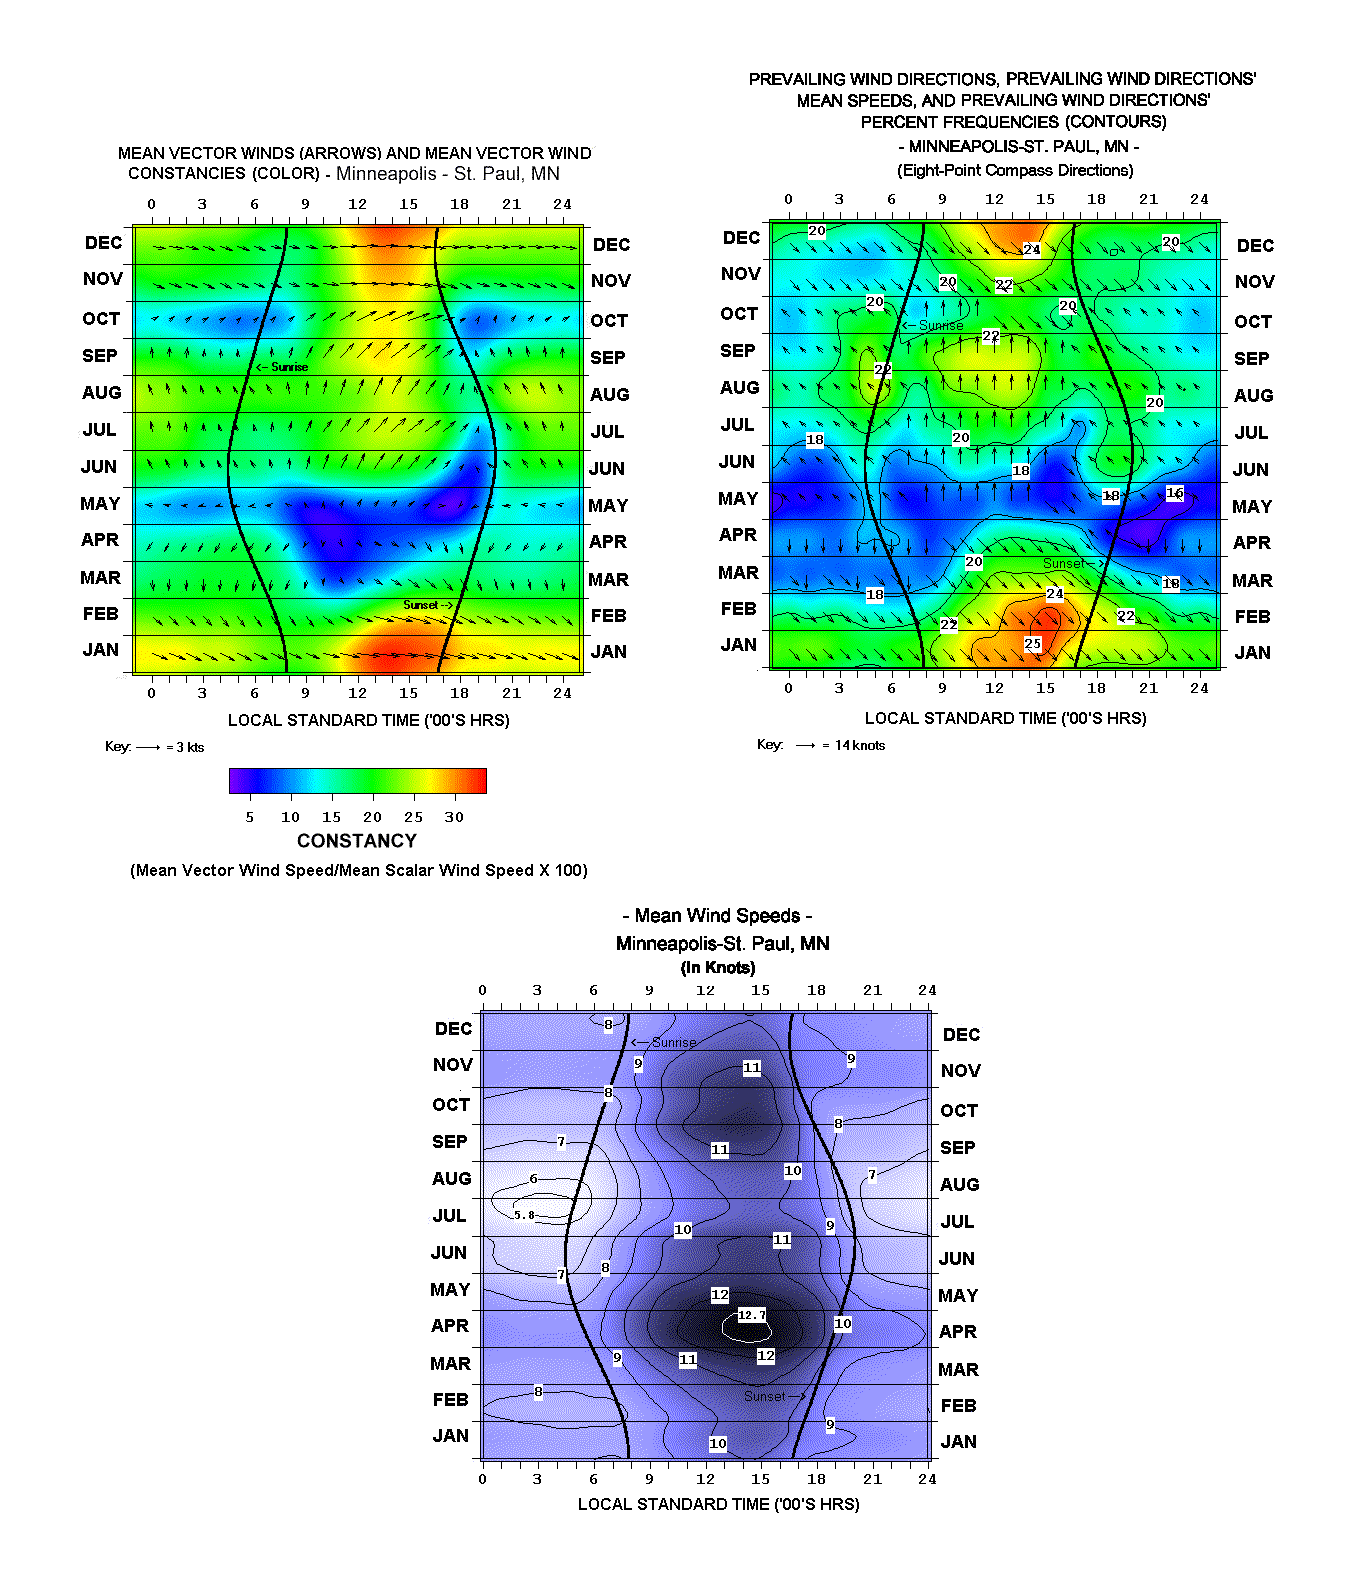
- Winds
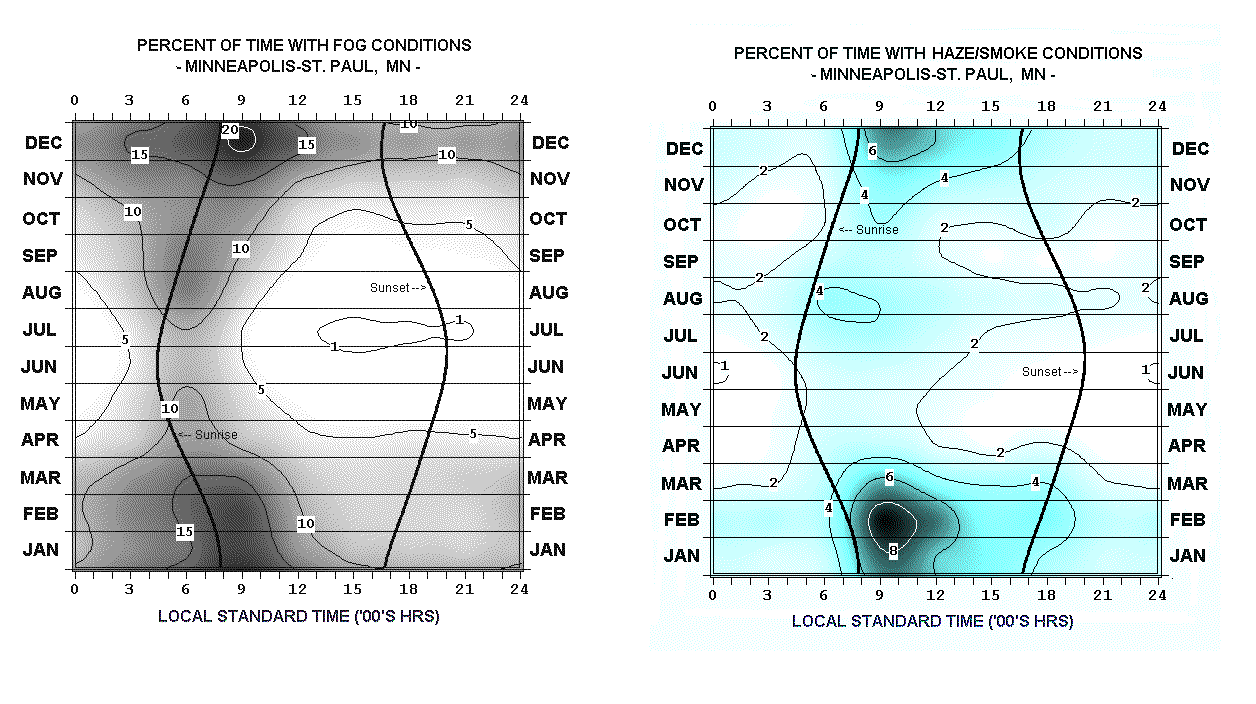
- Fog/Haze
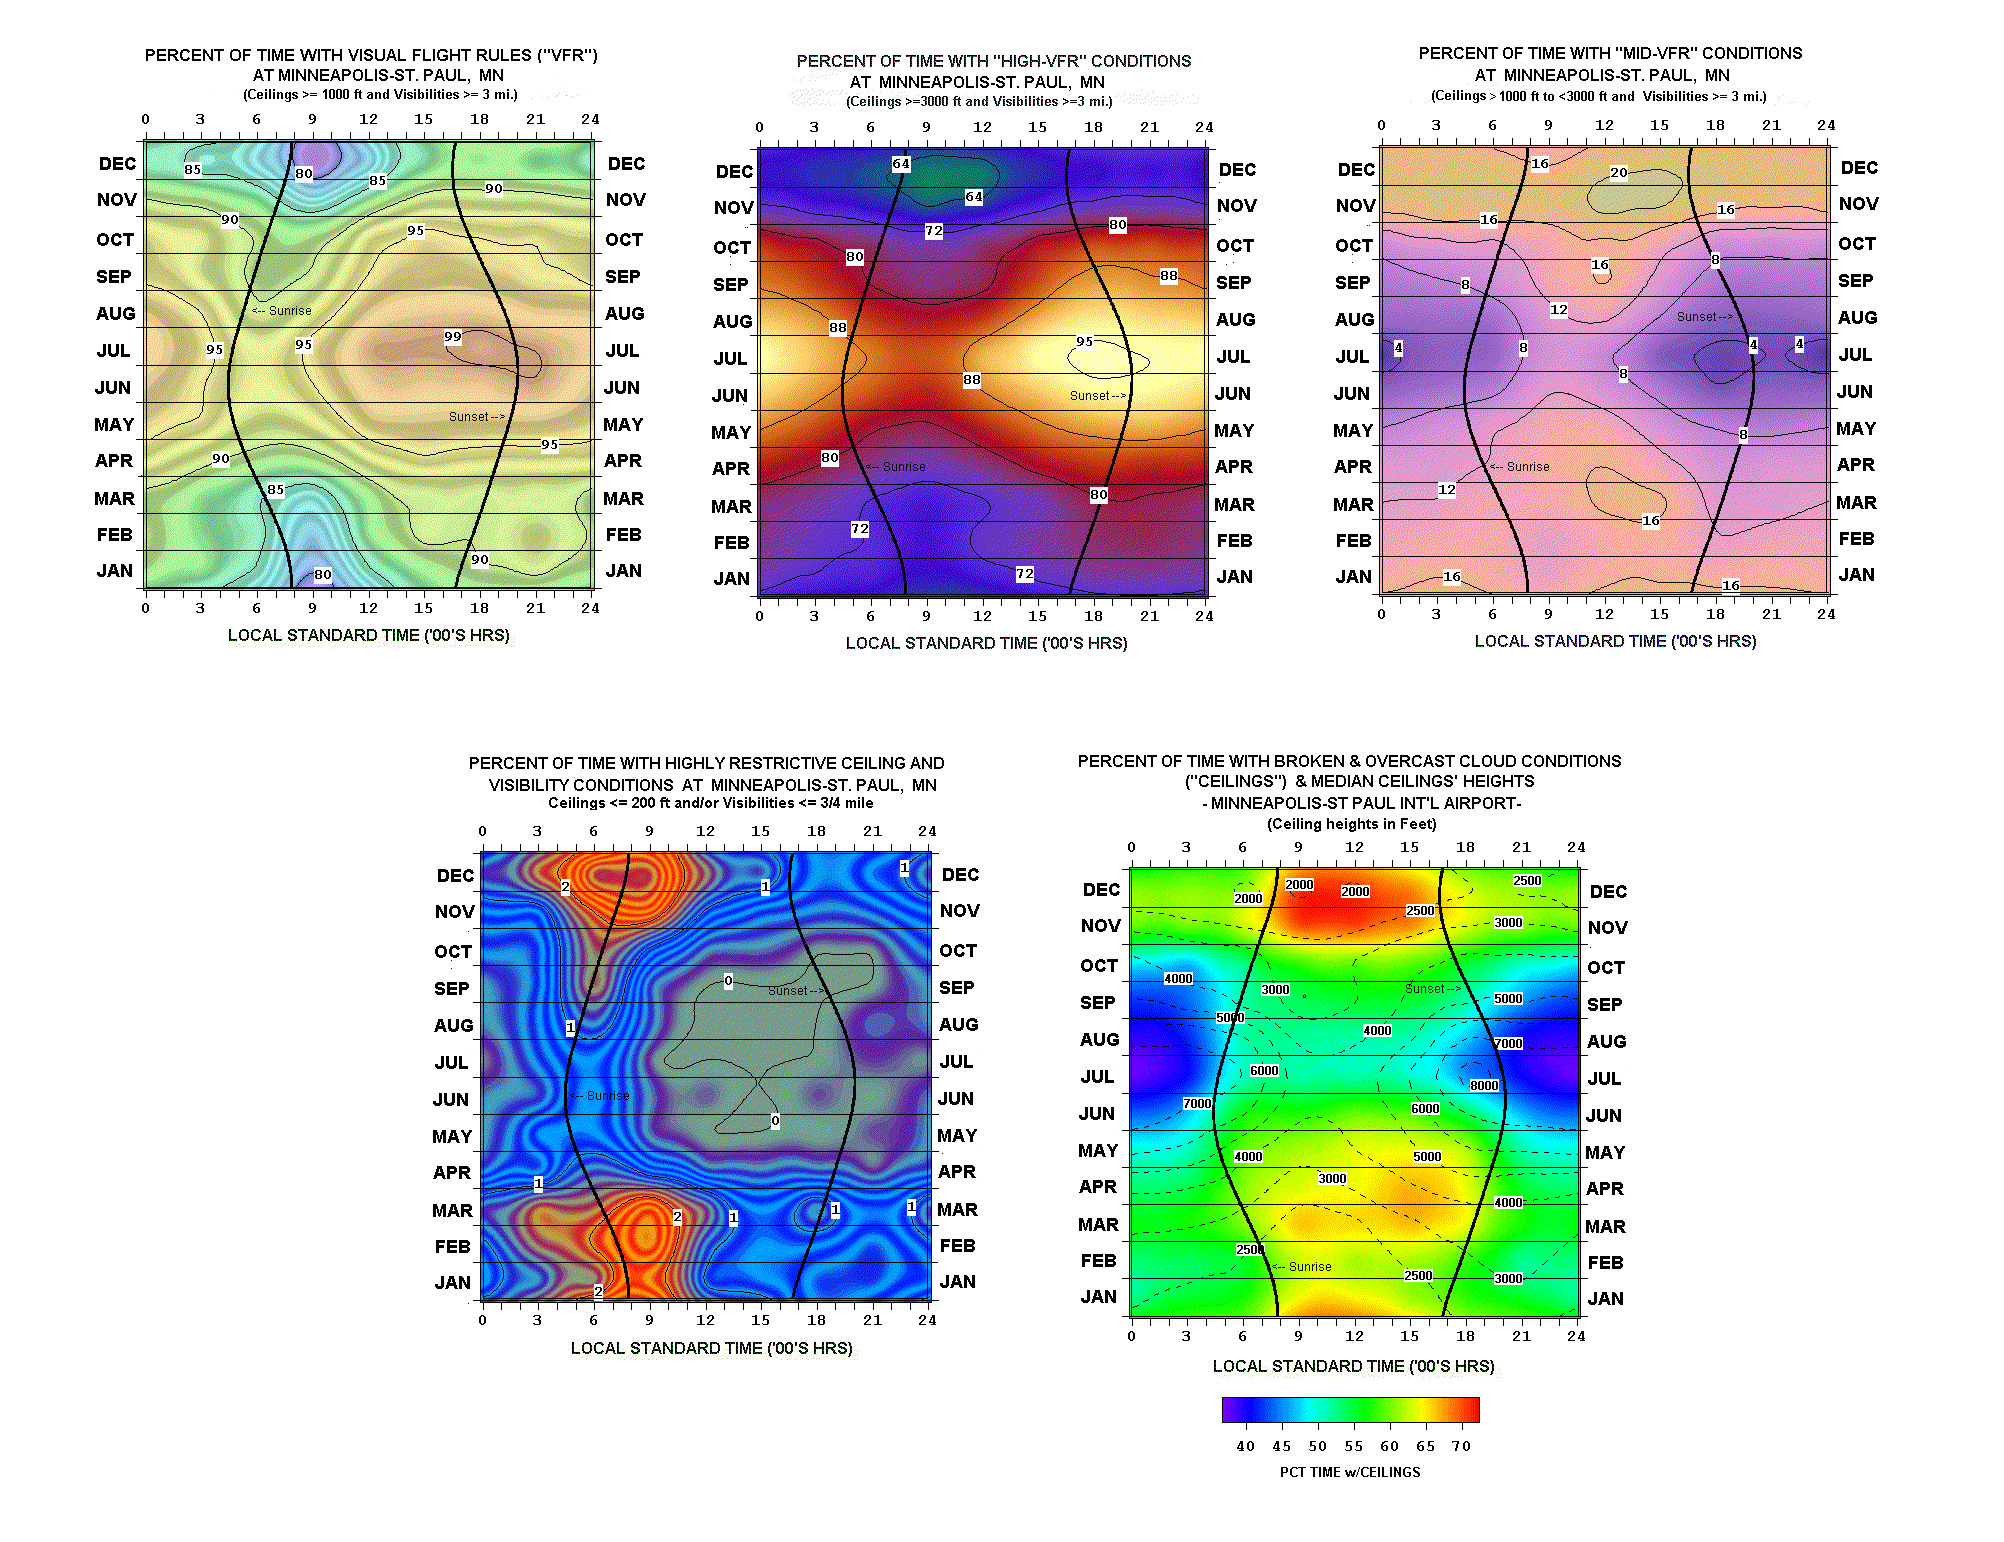
- Flying Weather/Ceilings
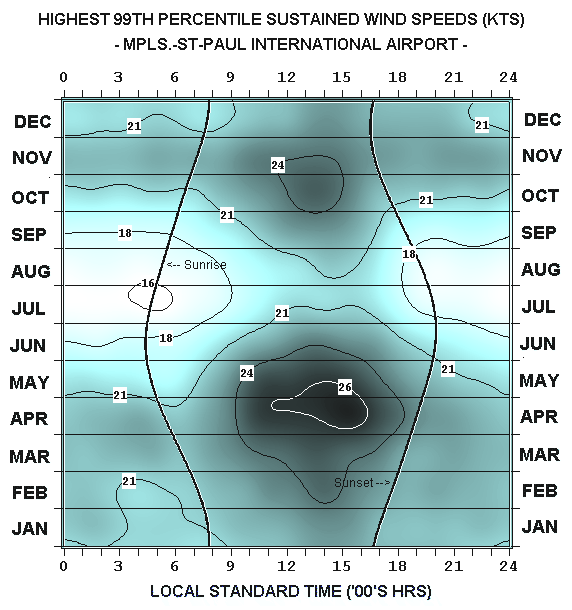
- Highest 99th Percentile Sustained Wind Speeds
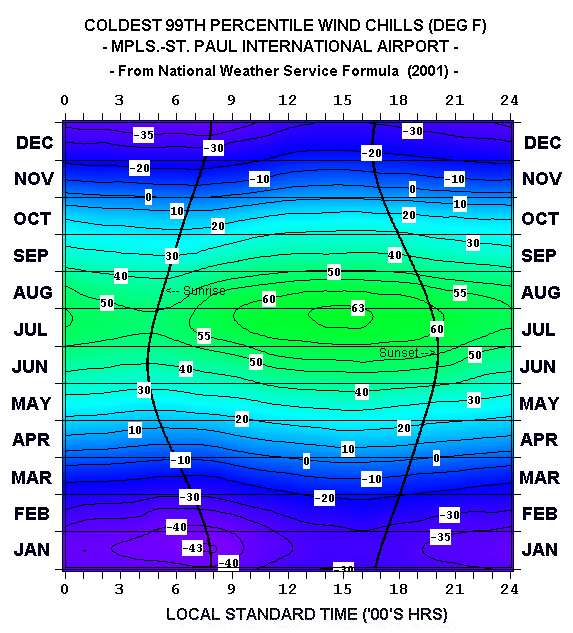
- Coldest 99th Percentile Wind Chill Temperatures
- Record Warmest Temperatures, by Hour, by Calendar Month (1934-Present)
- Record Coldest Temperatures, by Hour, by Calendar Month (1934-Present)
THE MINNEAPOLIS-ST. PAUL AREA TEMPERATURE RECORD: OFFICIAL WEATHER BUREAU OBSERVATIONS (1873-PRESENT) AND RECONSTRUCTED PIONEER ERA RECORDINGS (1820-1872)
Temperature graphs for the 1873-present period are based on official St. Paul or Minneapolis daily absolute maximum and minimum temperature observations (nearly all for the midnight-to-midnight hourly interval), the standard method of recording “summary-of-the-day” temperature statistics for first-order weather stations.
However, original summary-of-the-day temperature observations for the 1820-1872 “Pioneer” era (along with those for cloudiness, wind direction, and wind force) consisted of fixed-time scheme observations conforming to some prescribed format (e.g., 7AM, 2PM, and 9PM; or Sunrise, 9AM, 3PM, and 9PM; or others).
For methodological consistency, the 1820-1872 temperature observations were converted into midnight-to-midnight absolute maxima and minima estimates, using application of 1961-1980 statistical regression relationships between Minneapolis-St. Paul Airport temperature, cloudiness, and wind information at hours corresponding to the old fixed-scheme times, and 1961-1980 midnight to midnight absolute daily temperature maxima and minima [Fisk, M.S. Thesis, University of Wisconsin-Madison]. This reconstruction created reasonable approximations of the Pioneer era daily midnight to midnight maxima and minima, and in addition to reducing biases in (recalculated) 1820-1872 monthly mean temperatures, allowed for daily maximum/minimum temperature graphs to be constructed, in the same form throughout - 1820 to the present.
Year-To-Year Graphs – Interpretation
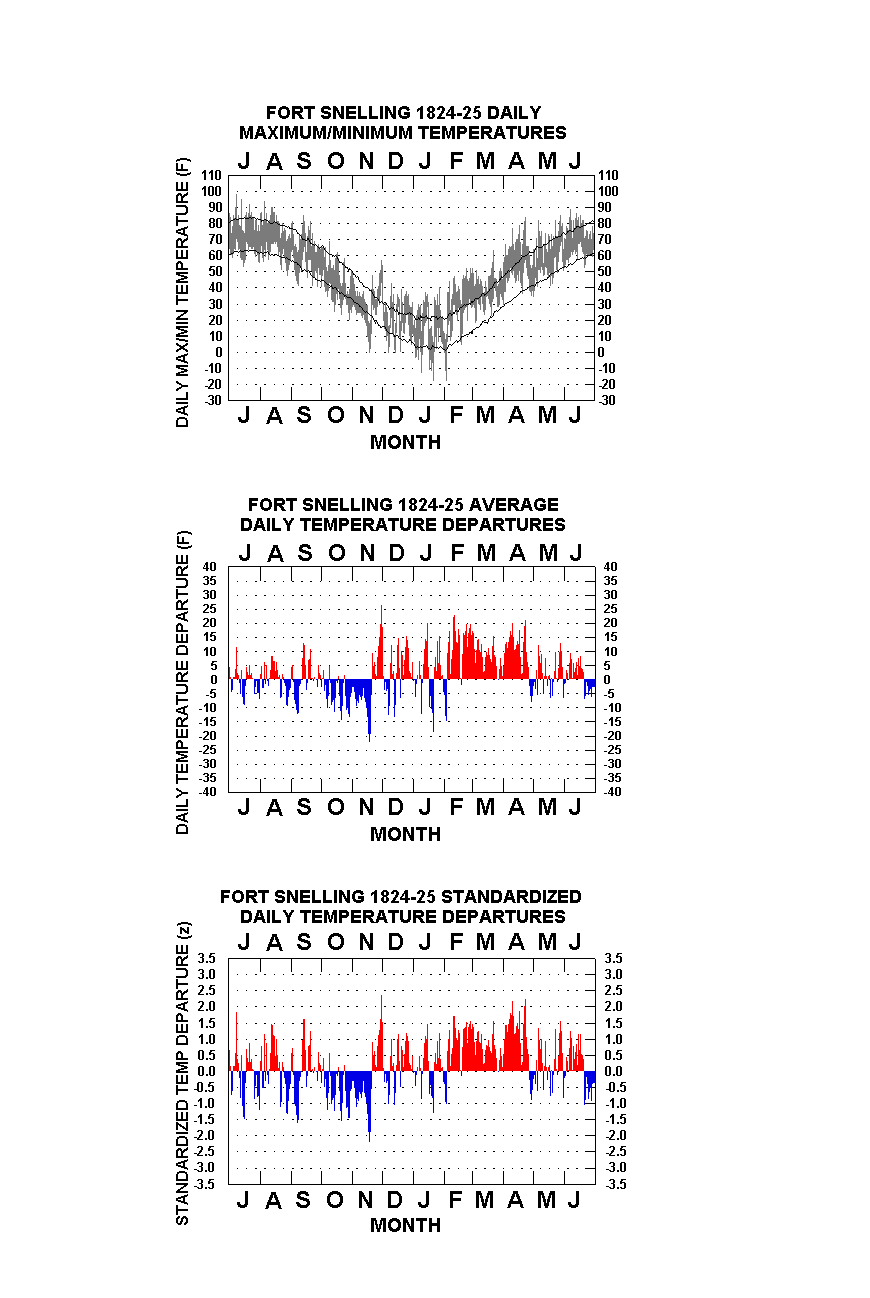
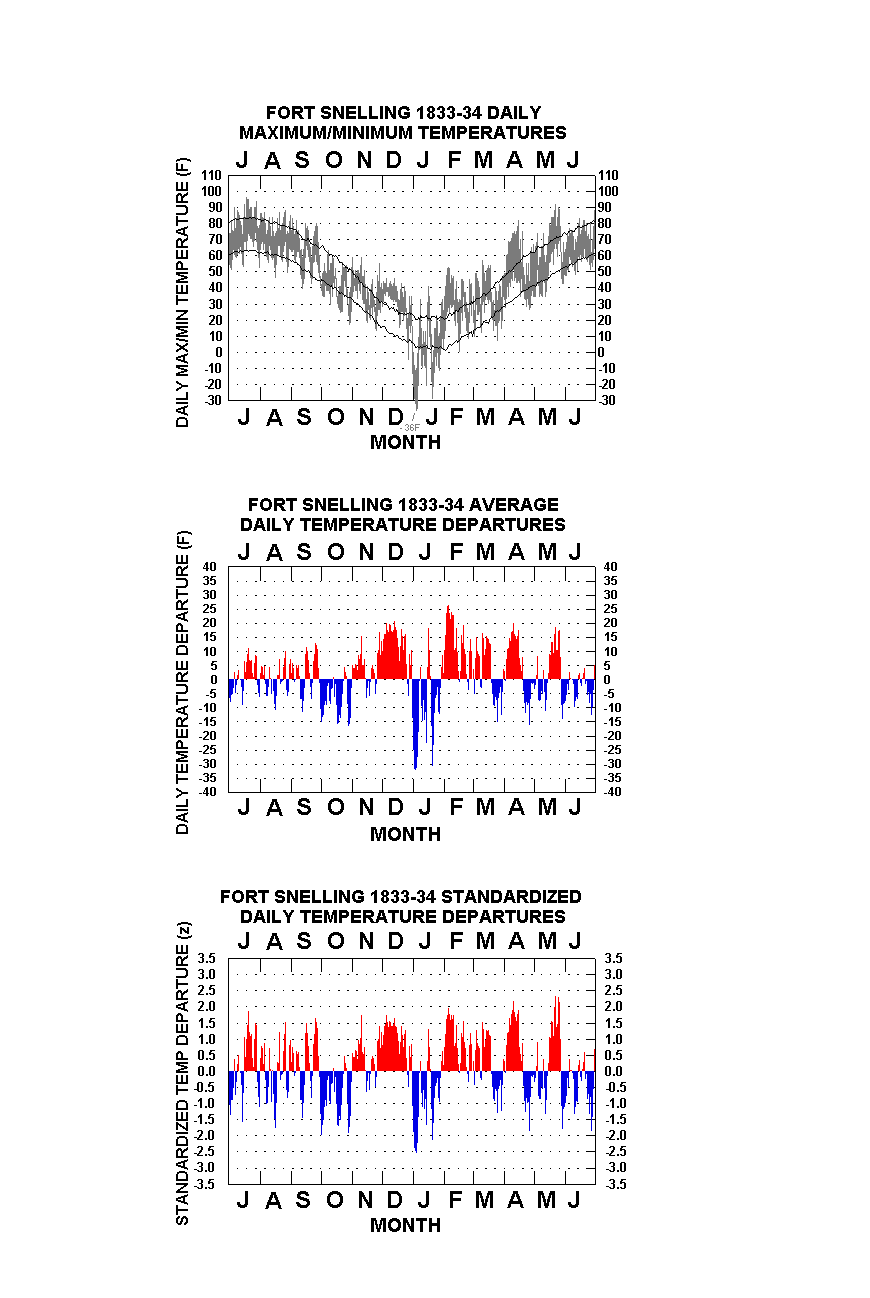
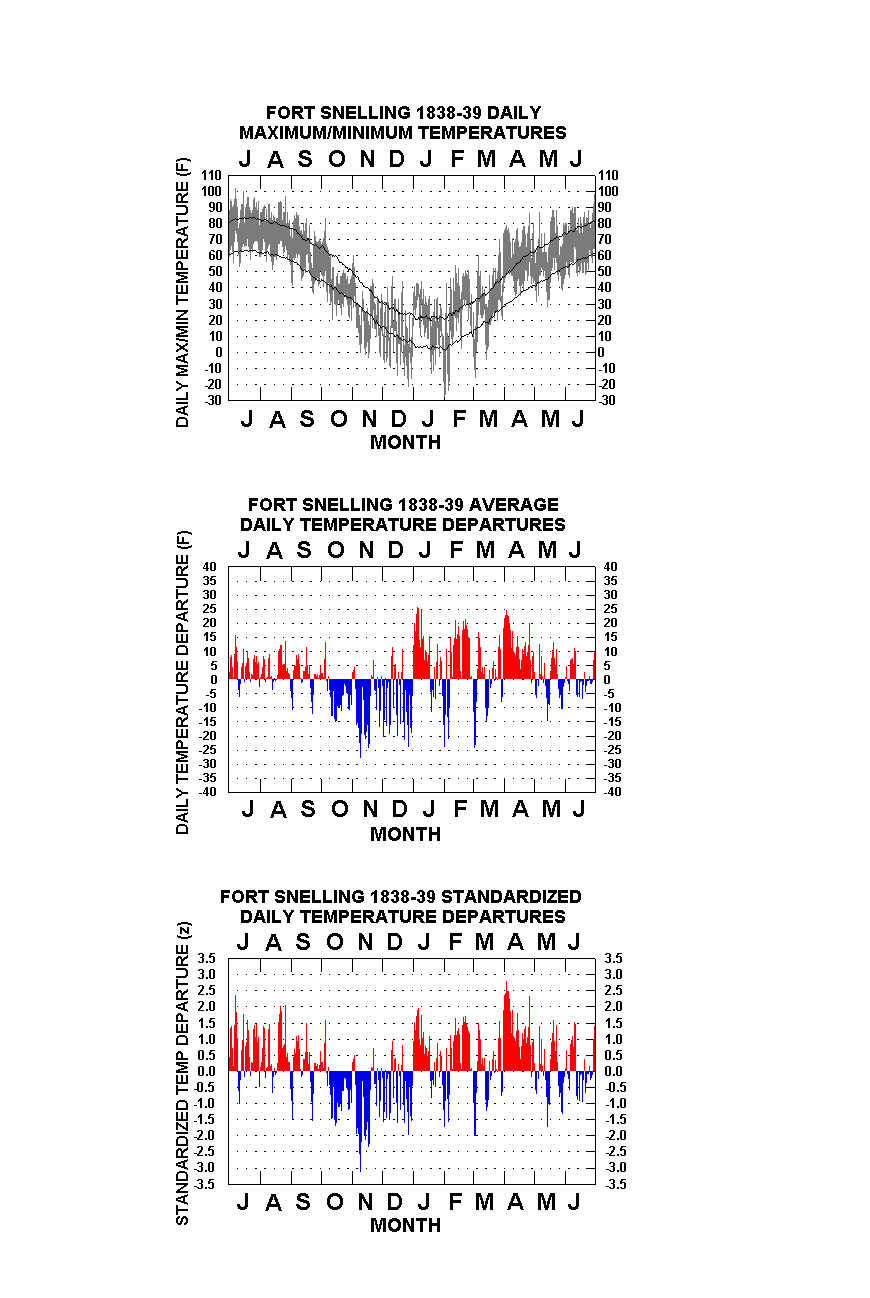
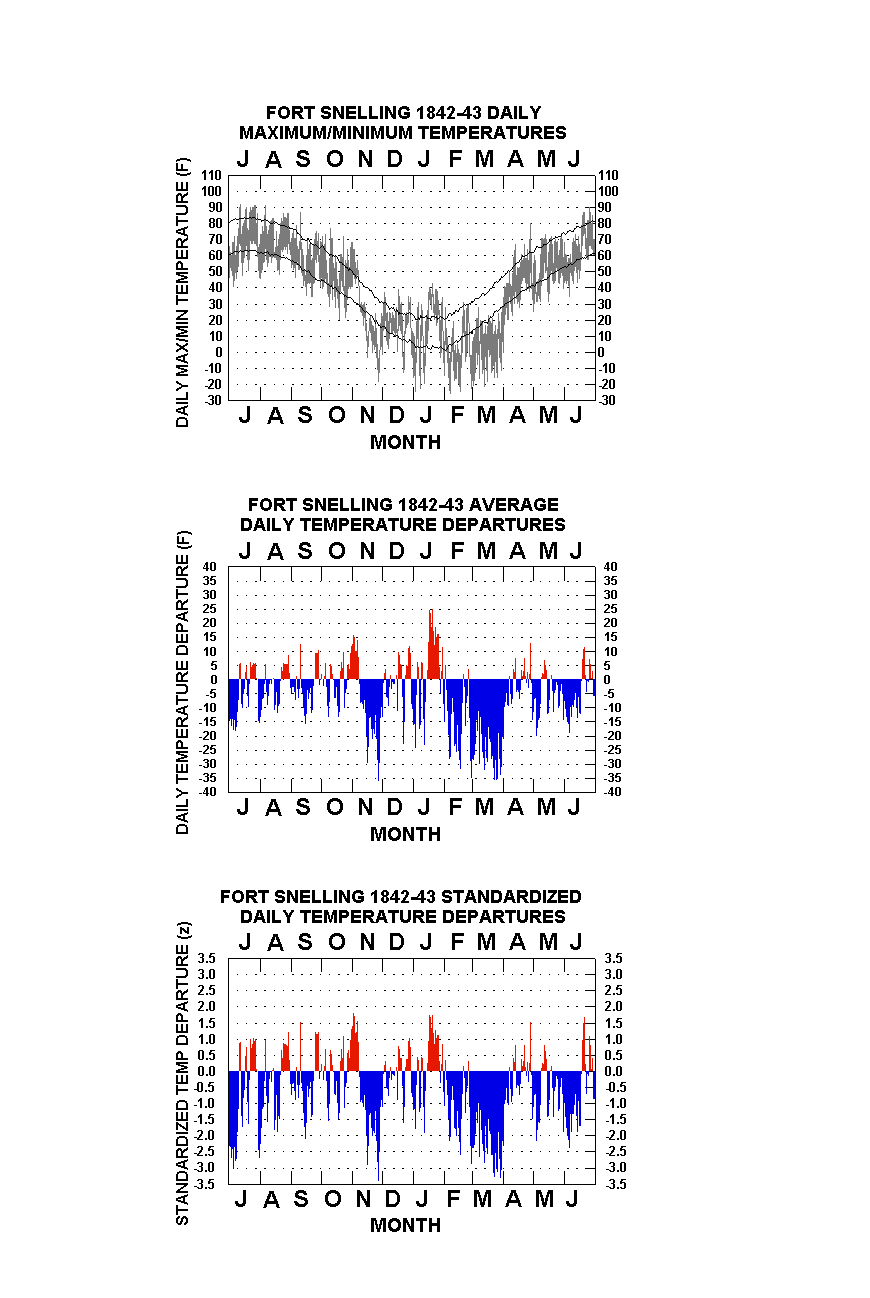
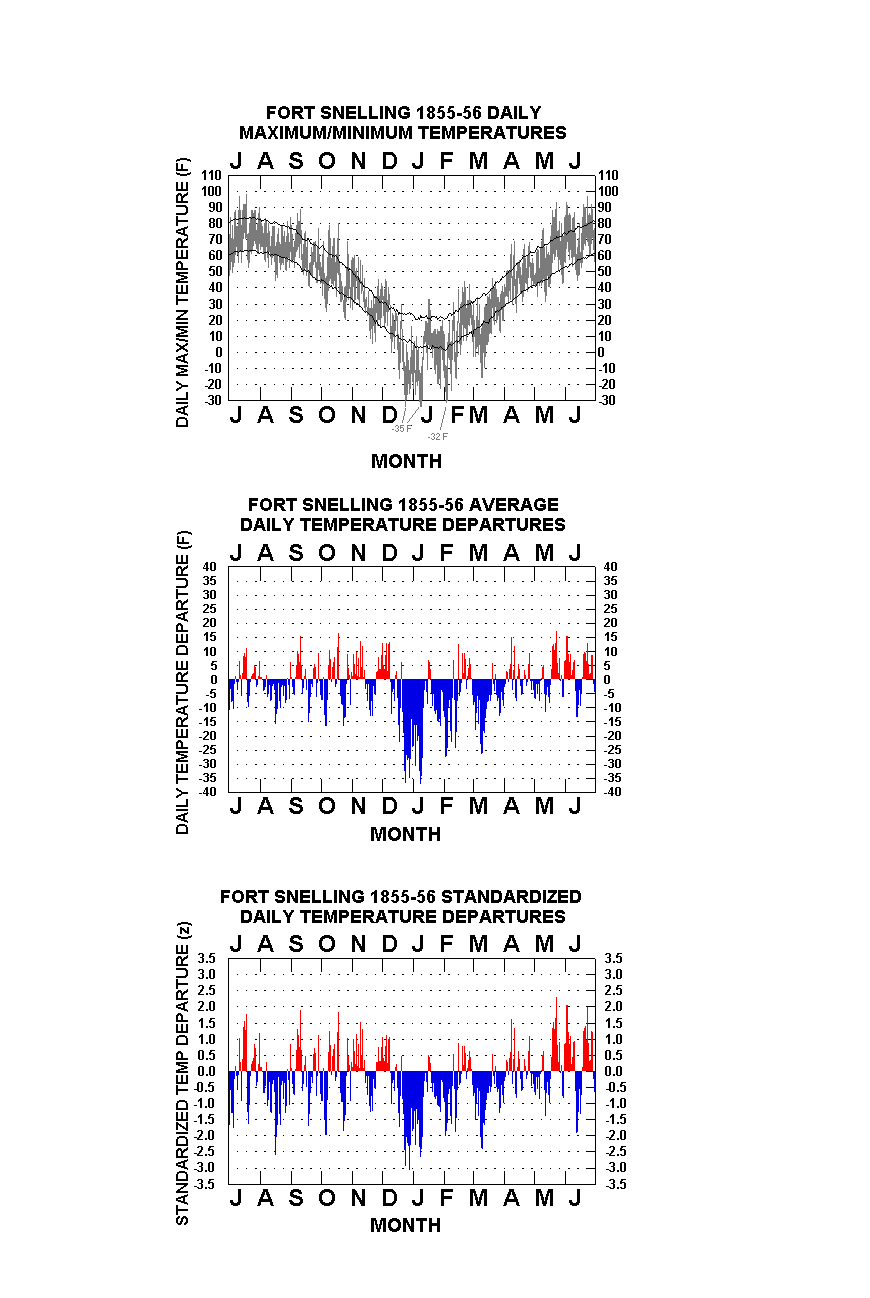
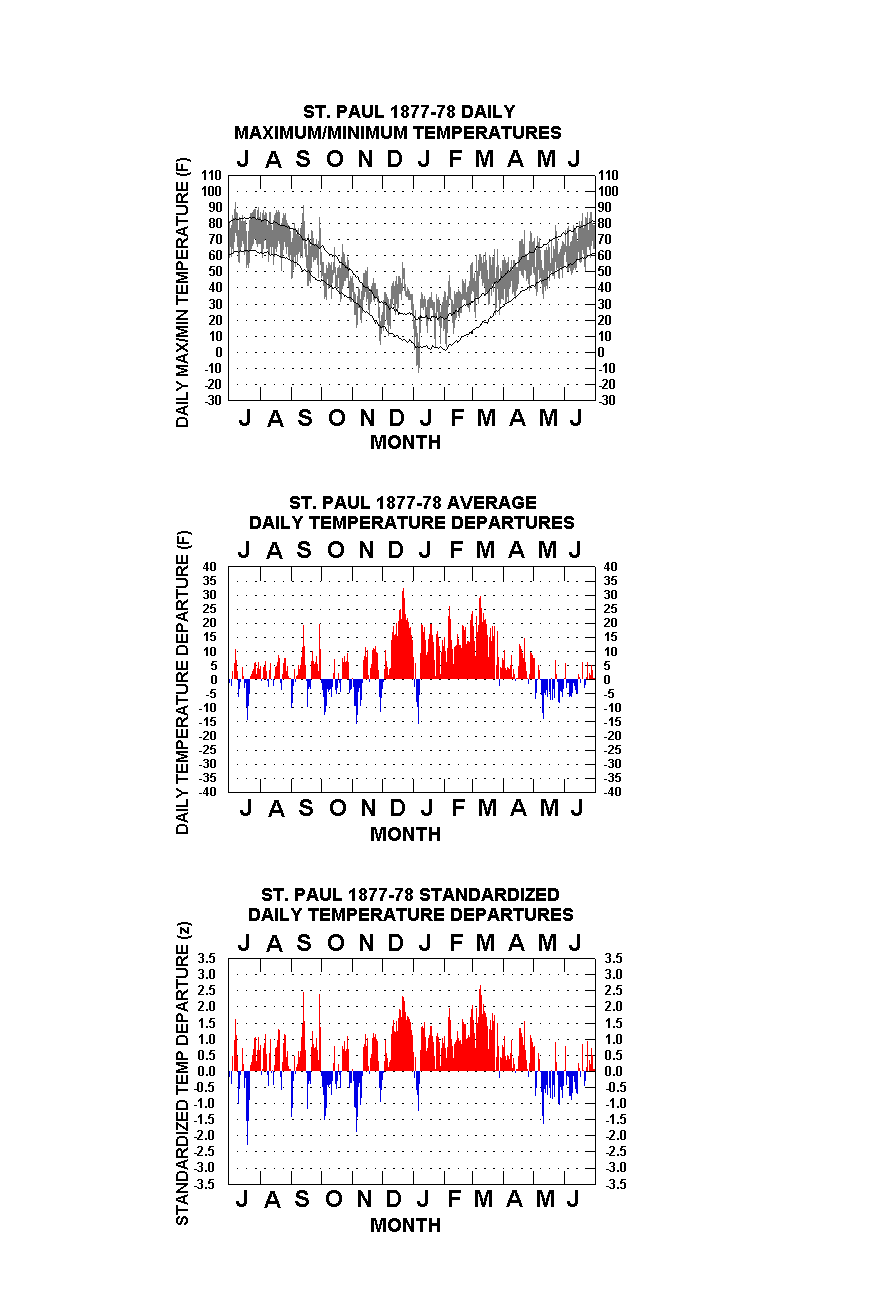
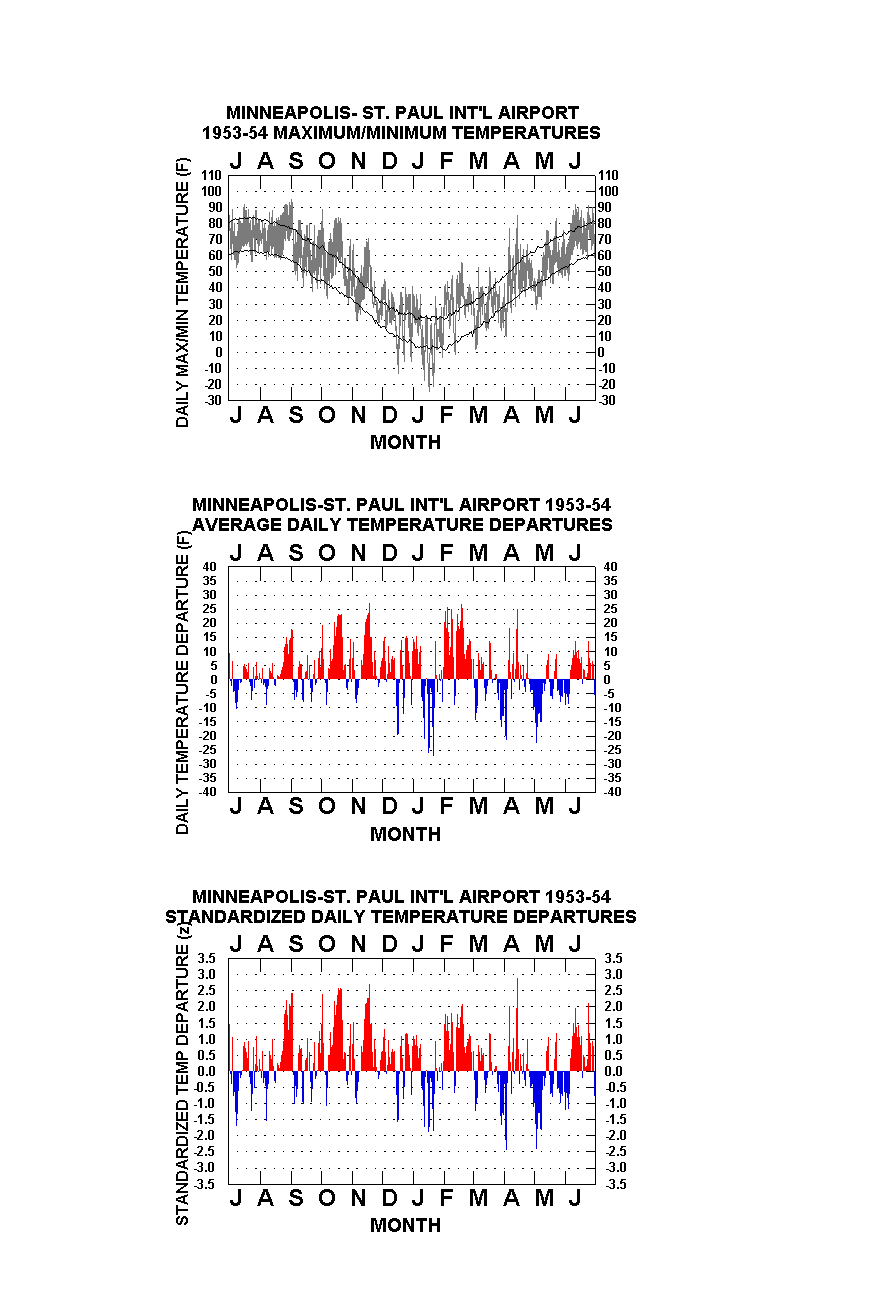
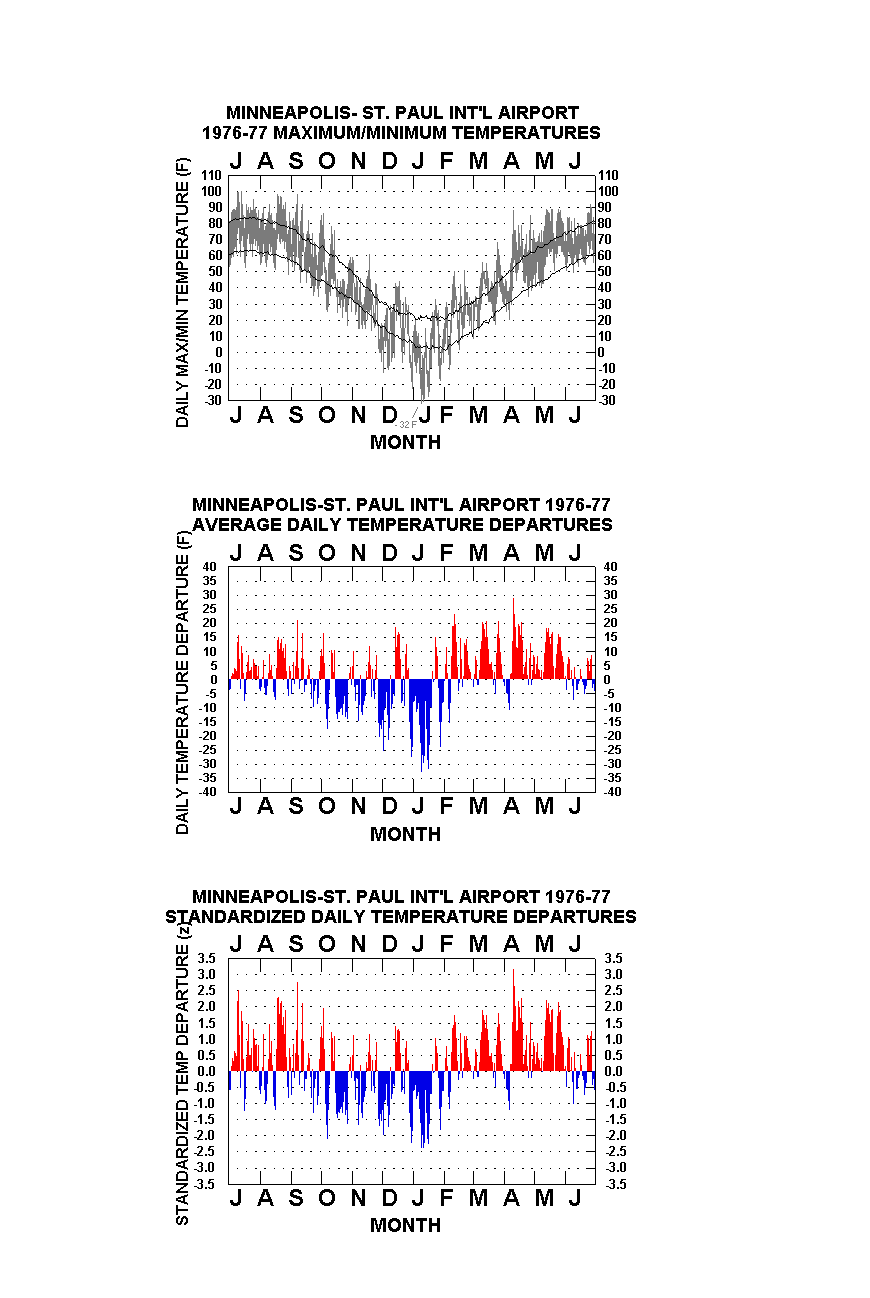
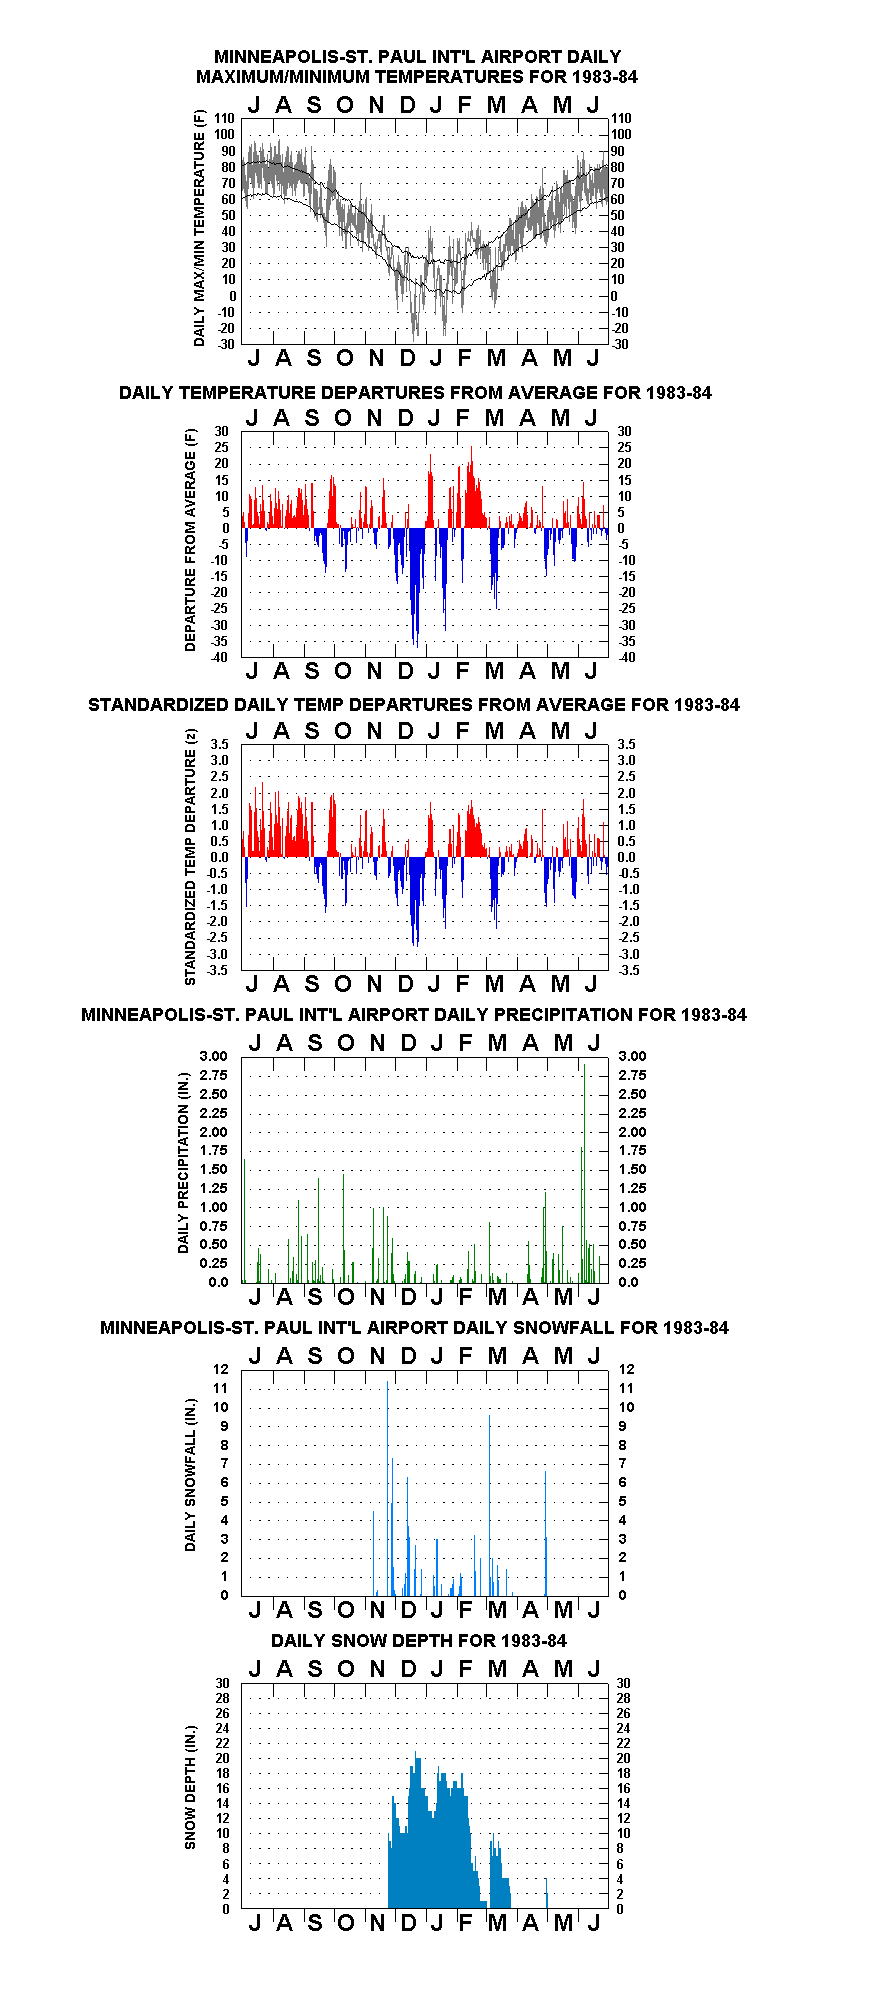
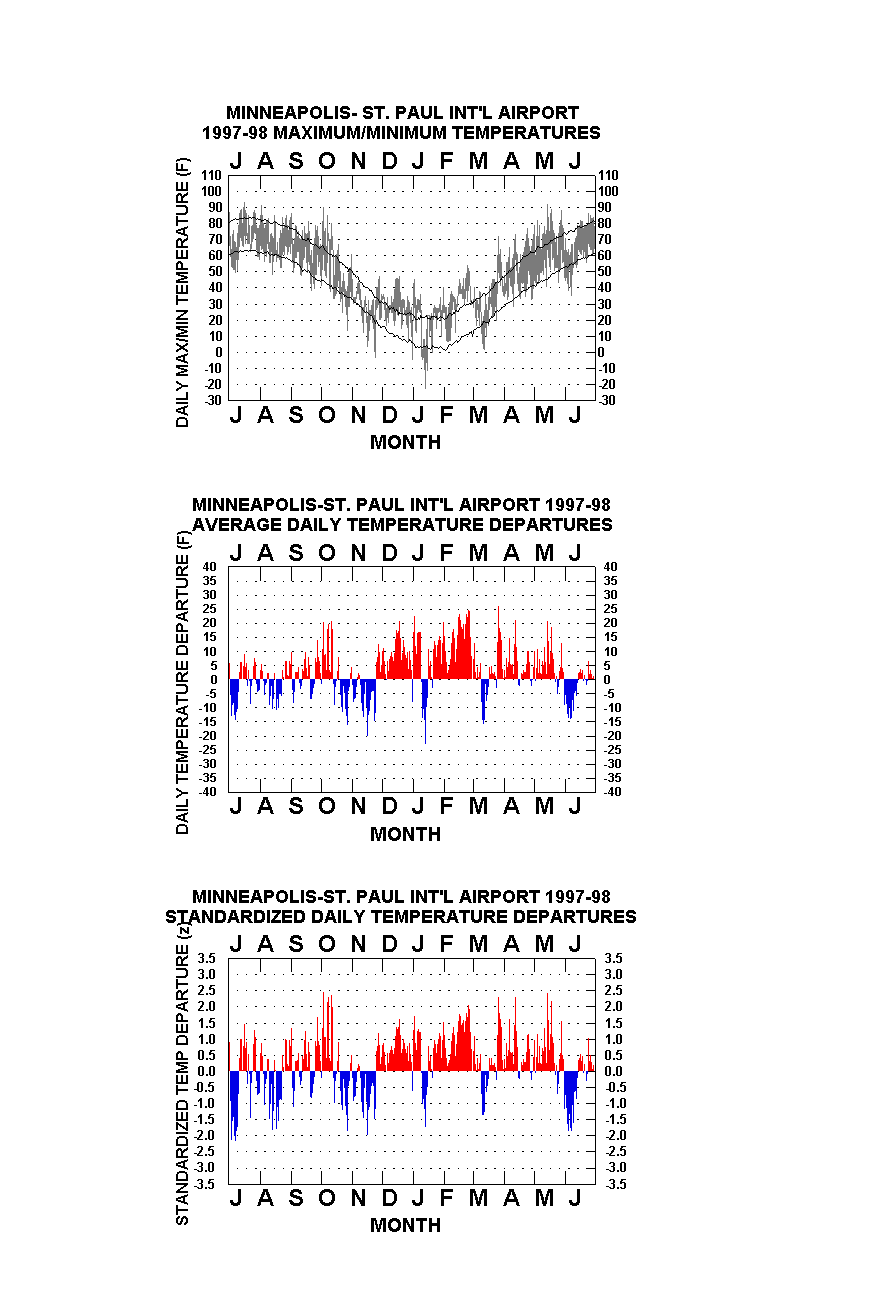
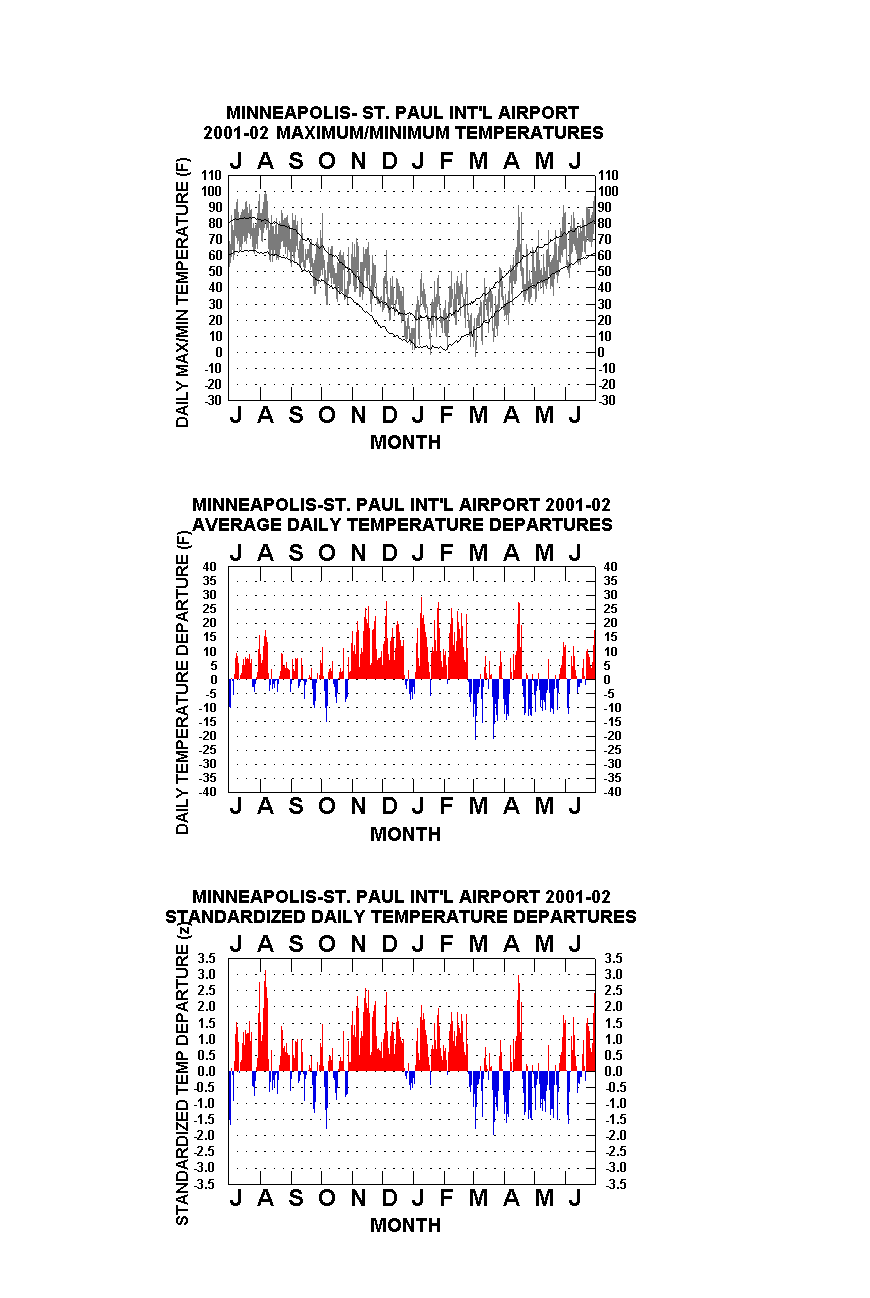
For a given year’s graphical display (see links below), the uppermost chart is a “floating-bar” chart of the daily maxima and minima. Superimposed are two line traces, the upper one connecting average daily maxima, the lower one average daily minima. The bars depict the varying diurnal, synoptic, long-wave, and seasonal influences on temperature over time, and they are deliberately adjoined with no spaces in-between, creating an enhanced "signature" effect, so to speak.
The second chart down depicts the arithmetic departures of day-to-day mean temperatures (sum of the daily maximum plus the daily minimum divided by two) less the corresponding calendar-day average means. Vertical lines extending upward from the zero line indicate above average means for the day (colored red), those extending downward indicate below average daily means (colored blue). In the entire series of more than 70,000 days, greatest positive departure for any individual day is +39 F on 17 March 2012 , the greatest negative departure -45 F for 1 January 1864 .
(It should be mentioned that clicking on the floating-bar charts a second time after they appear on the screen will enlarge them even further).
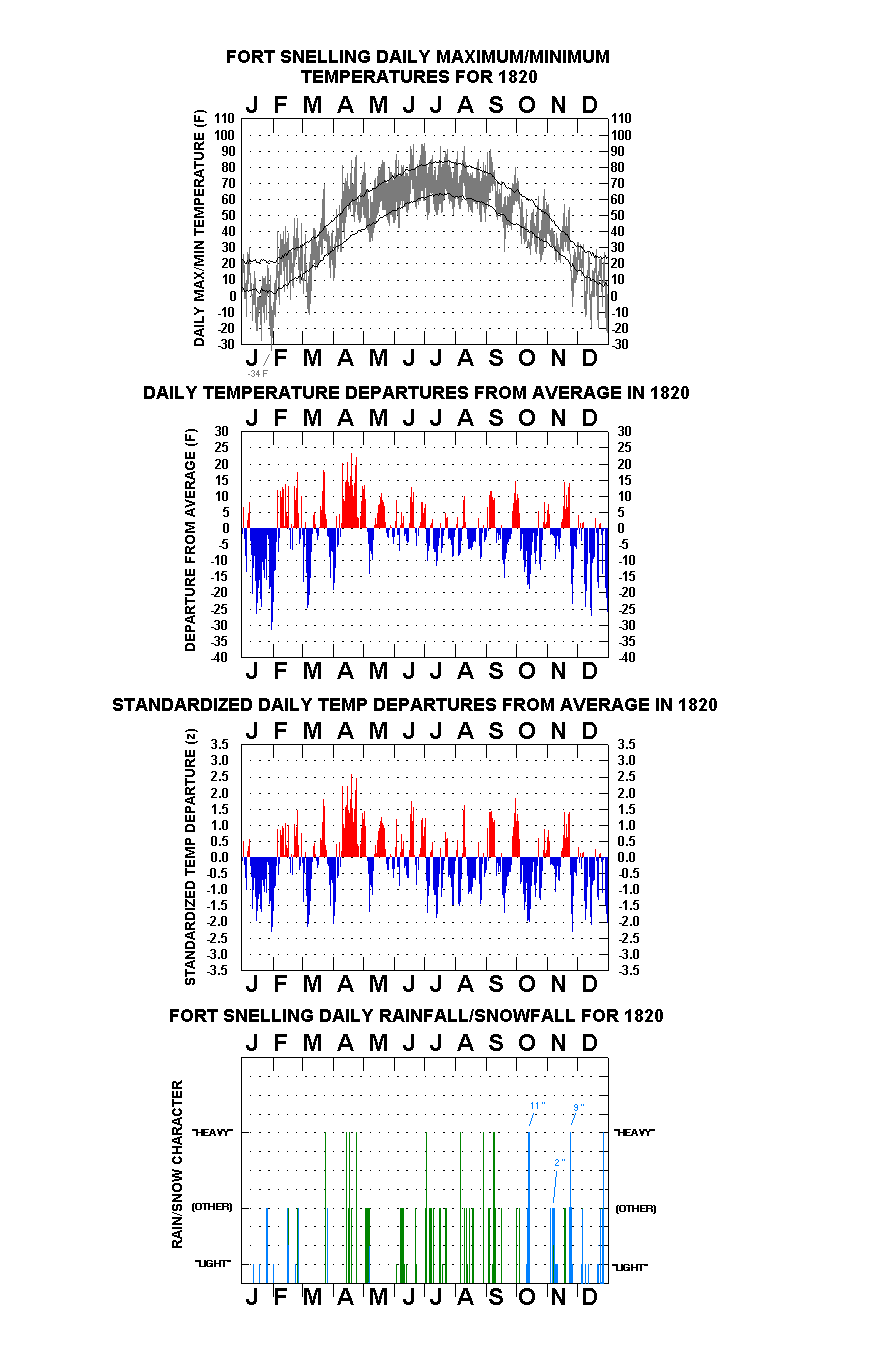
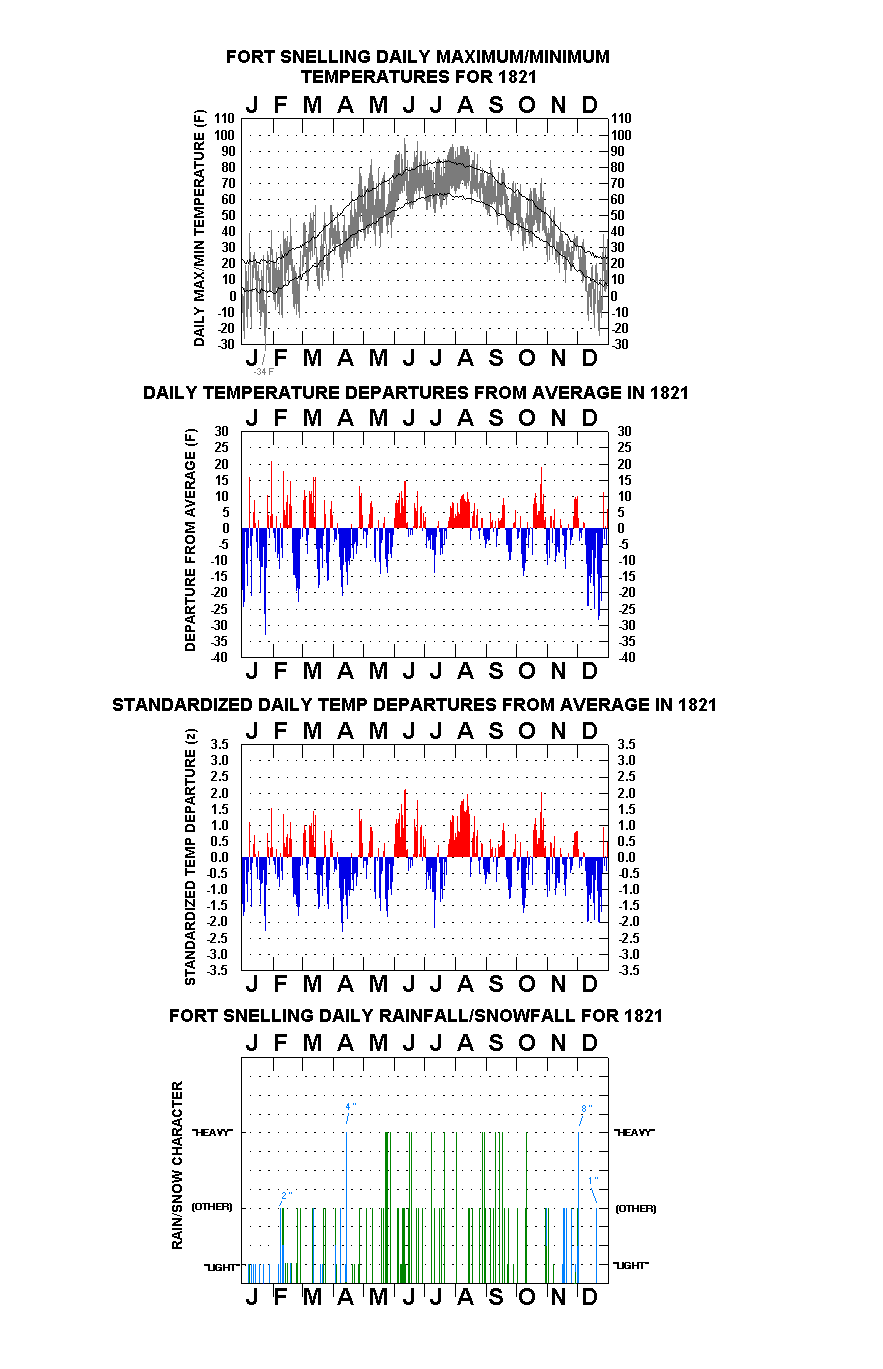
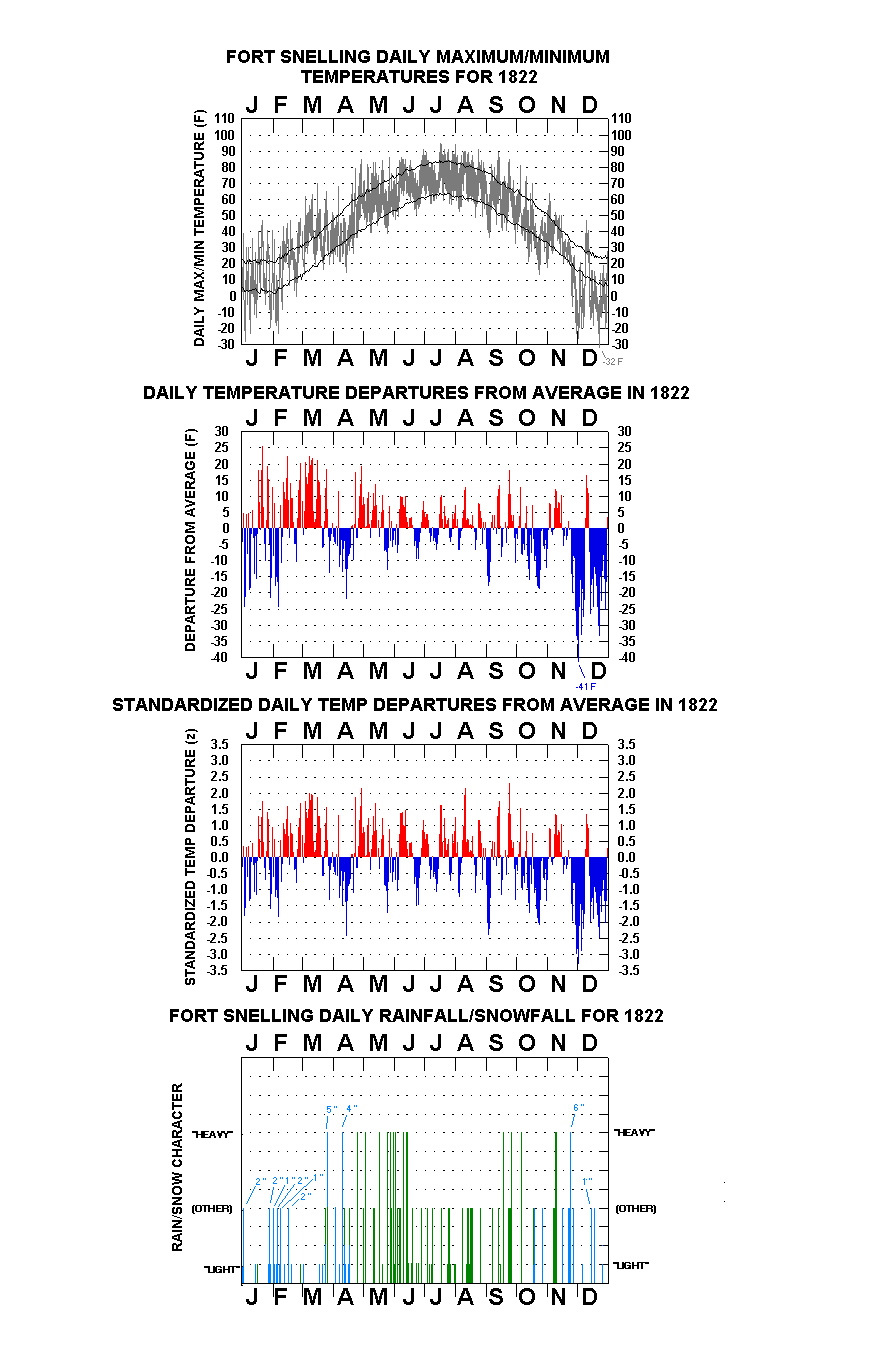
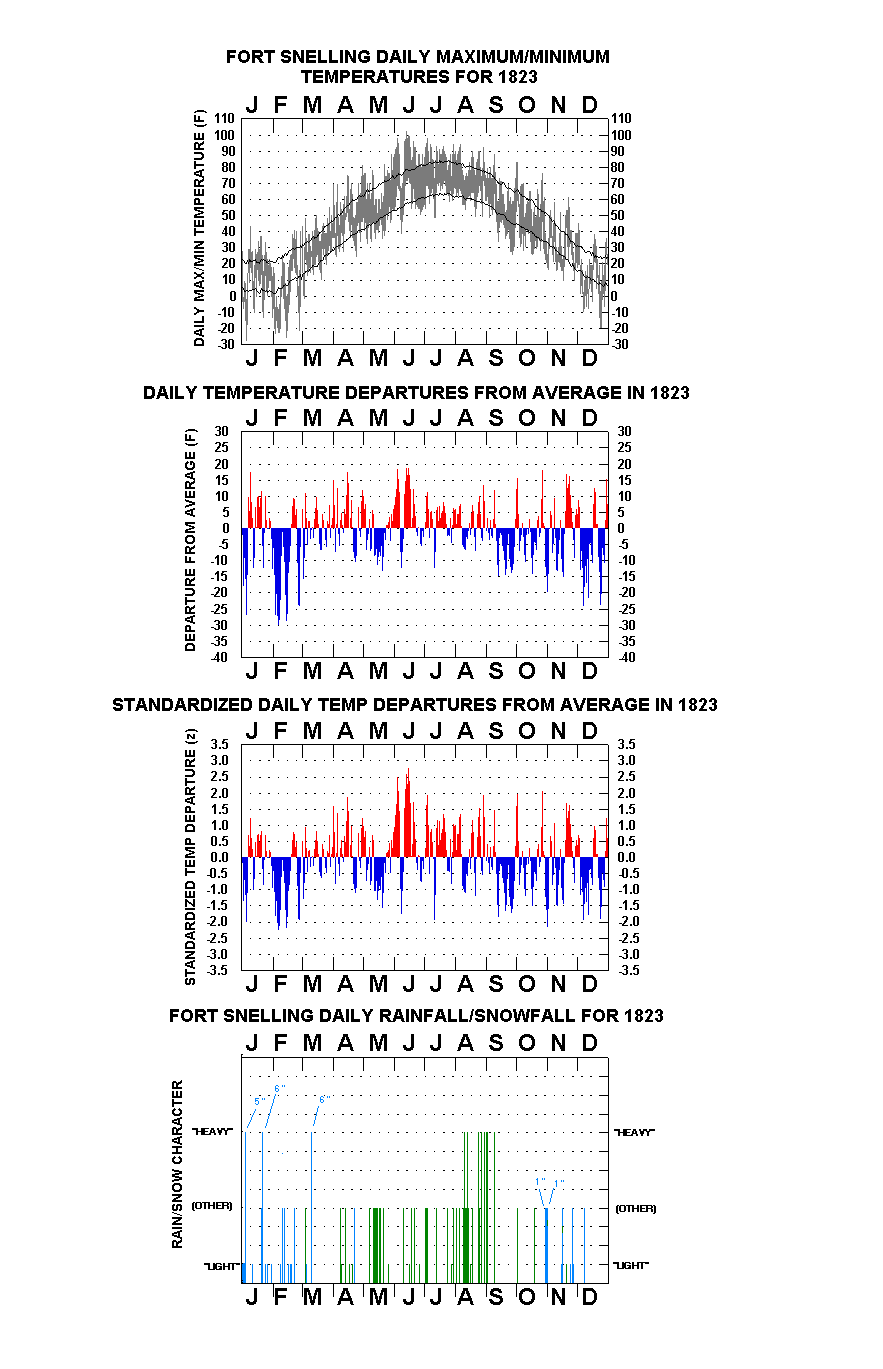
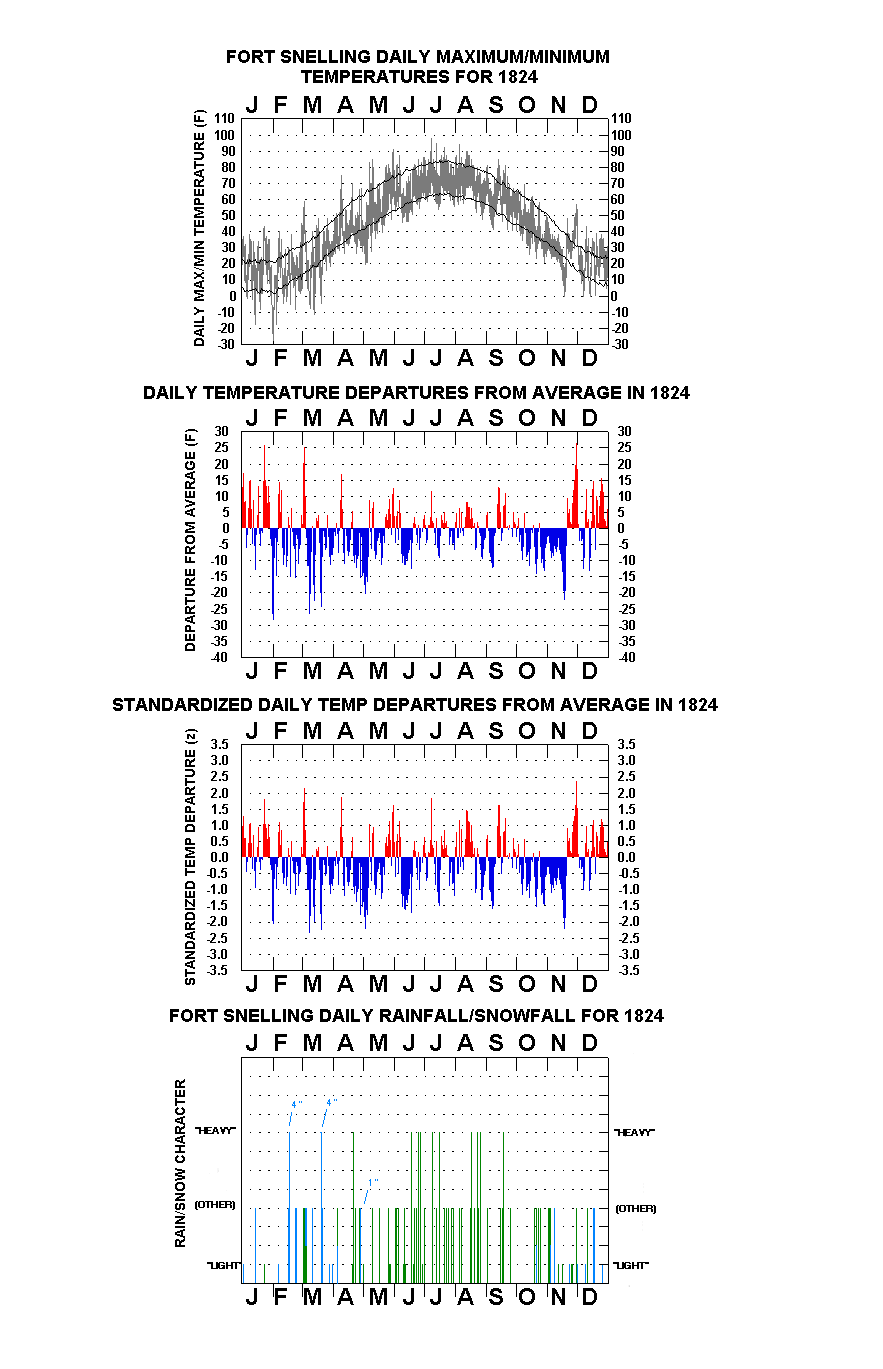
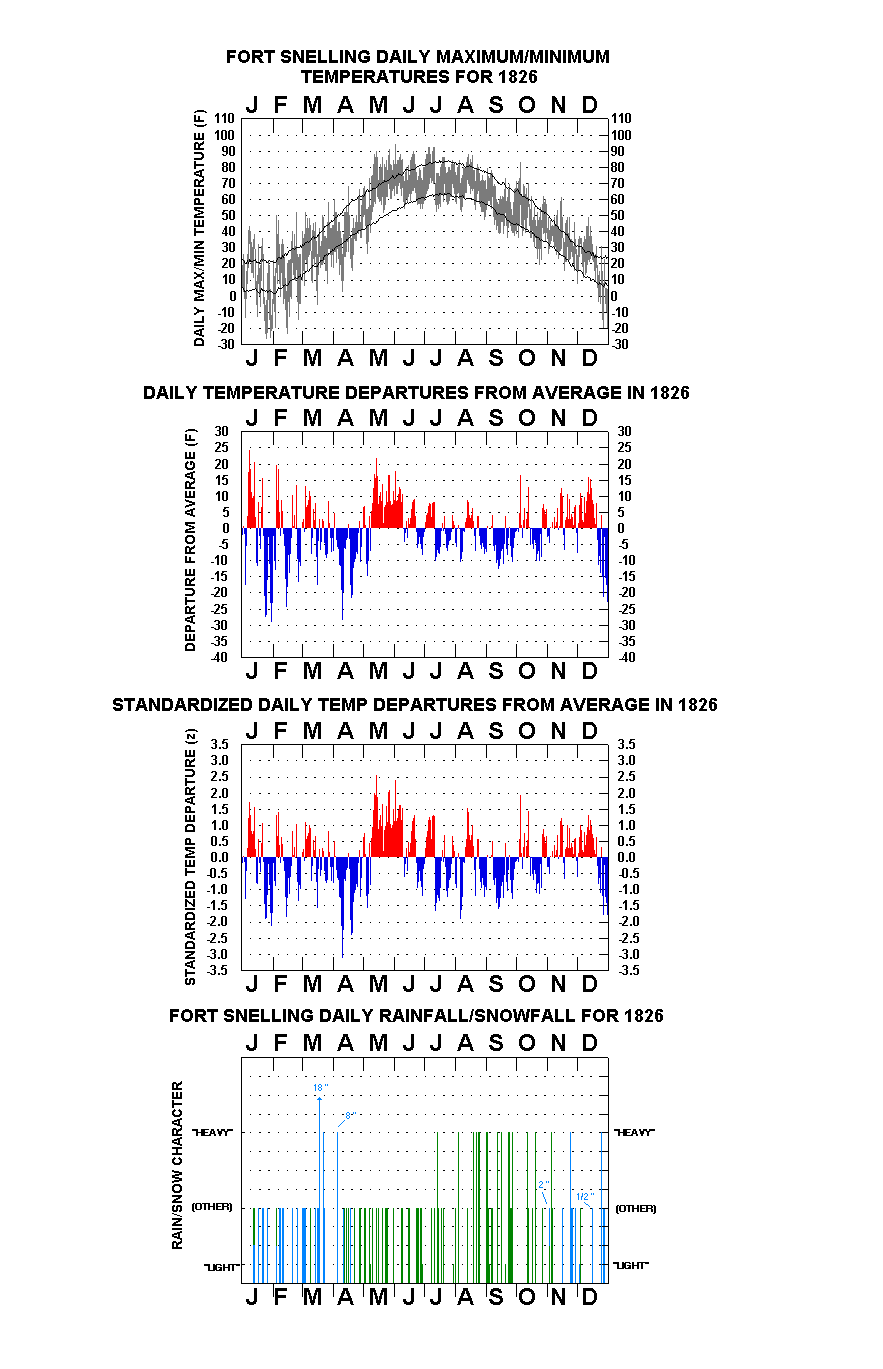
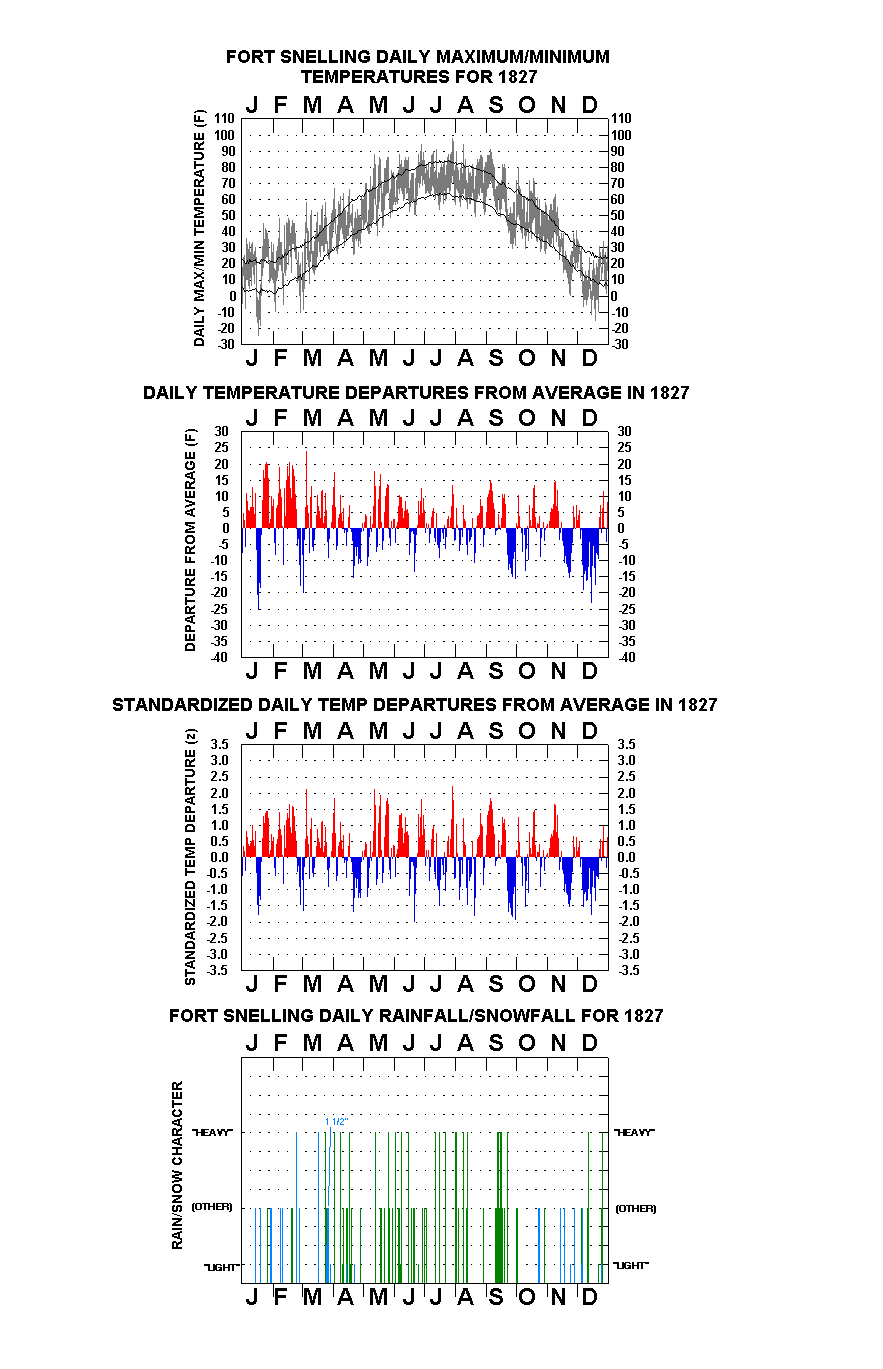
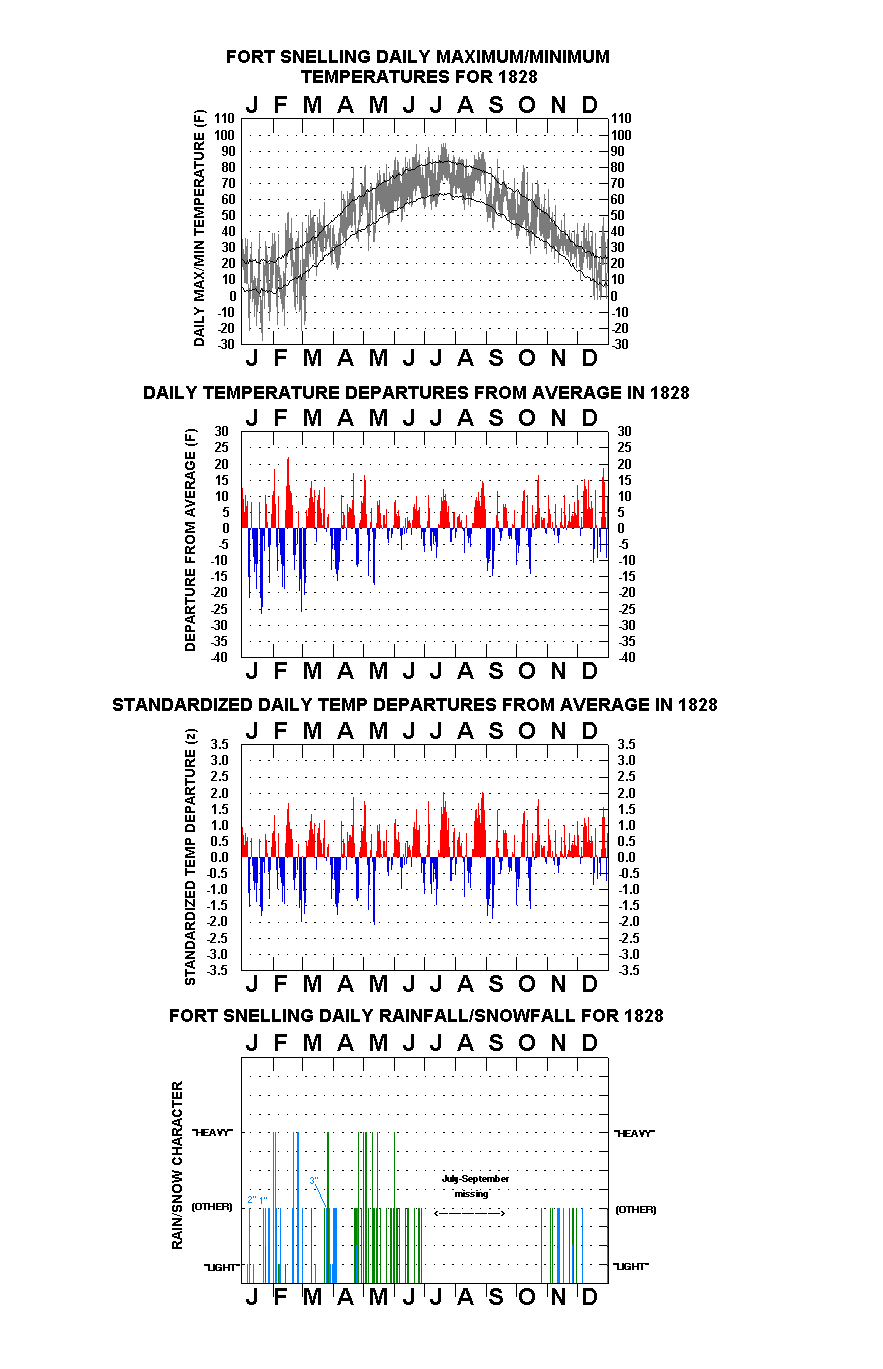
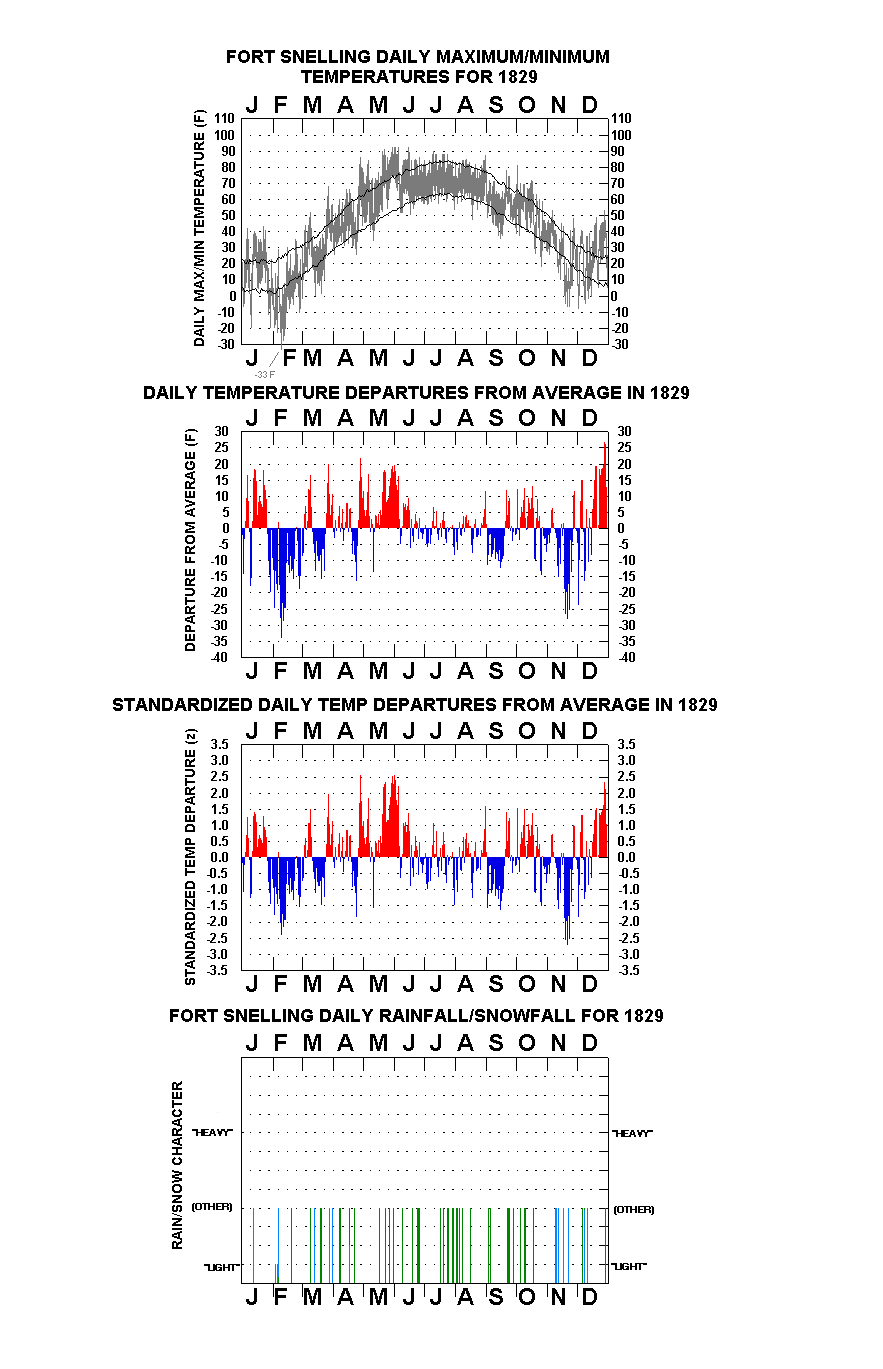
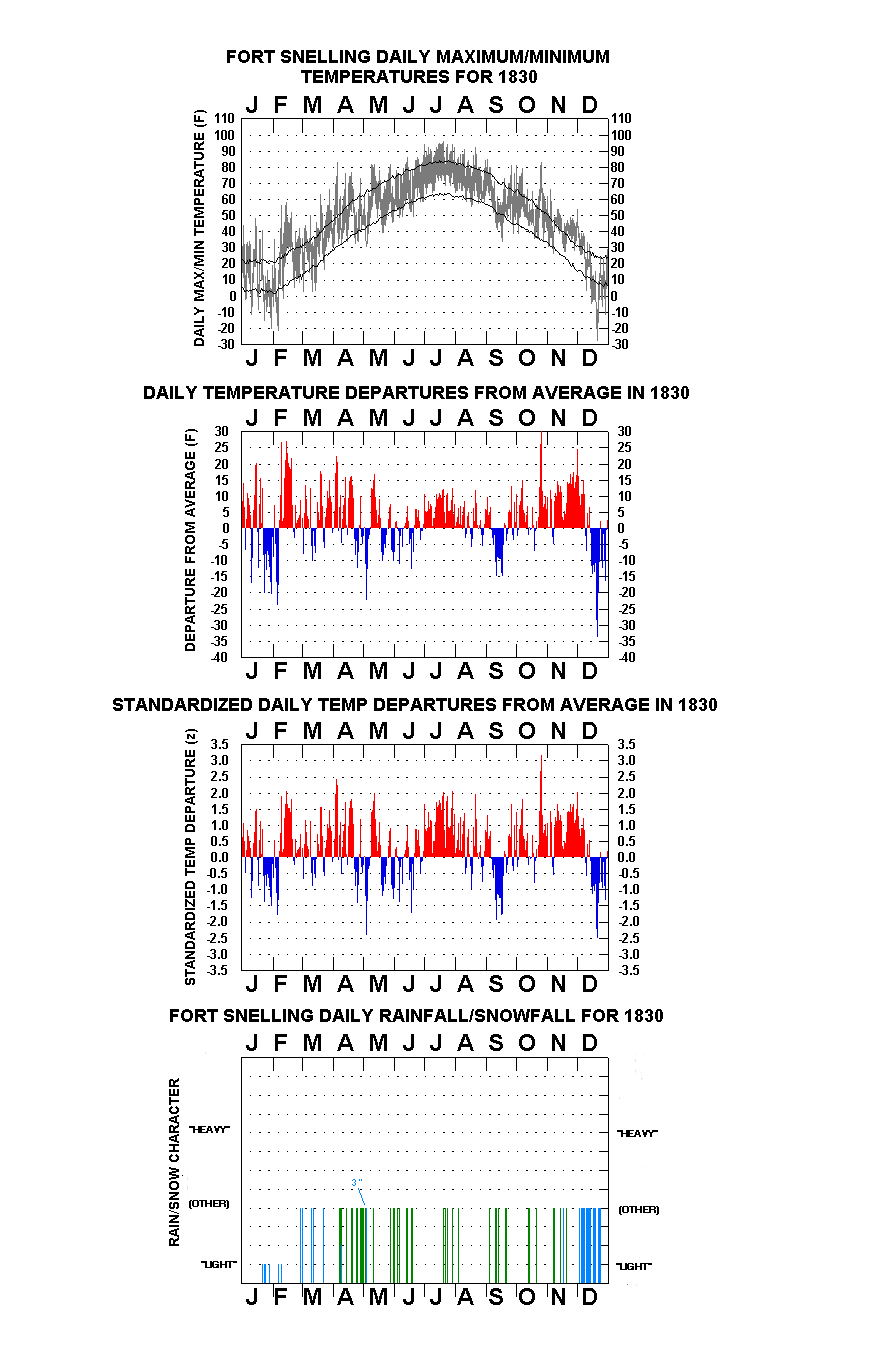
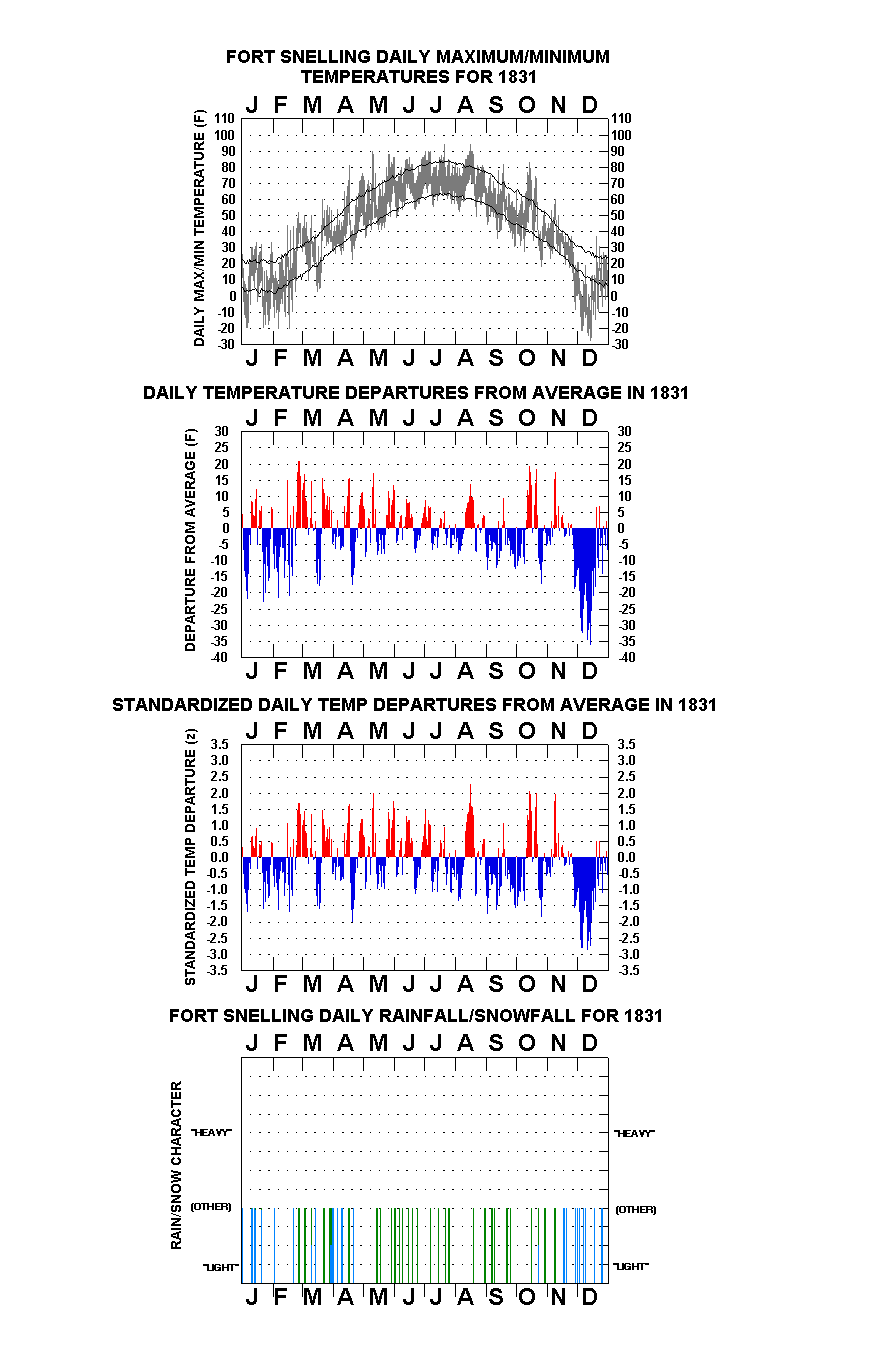
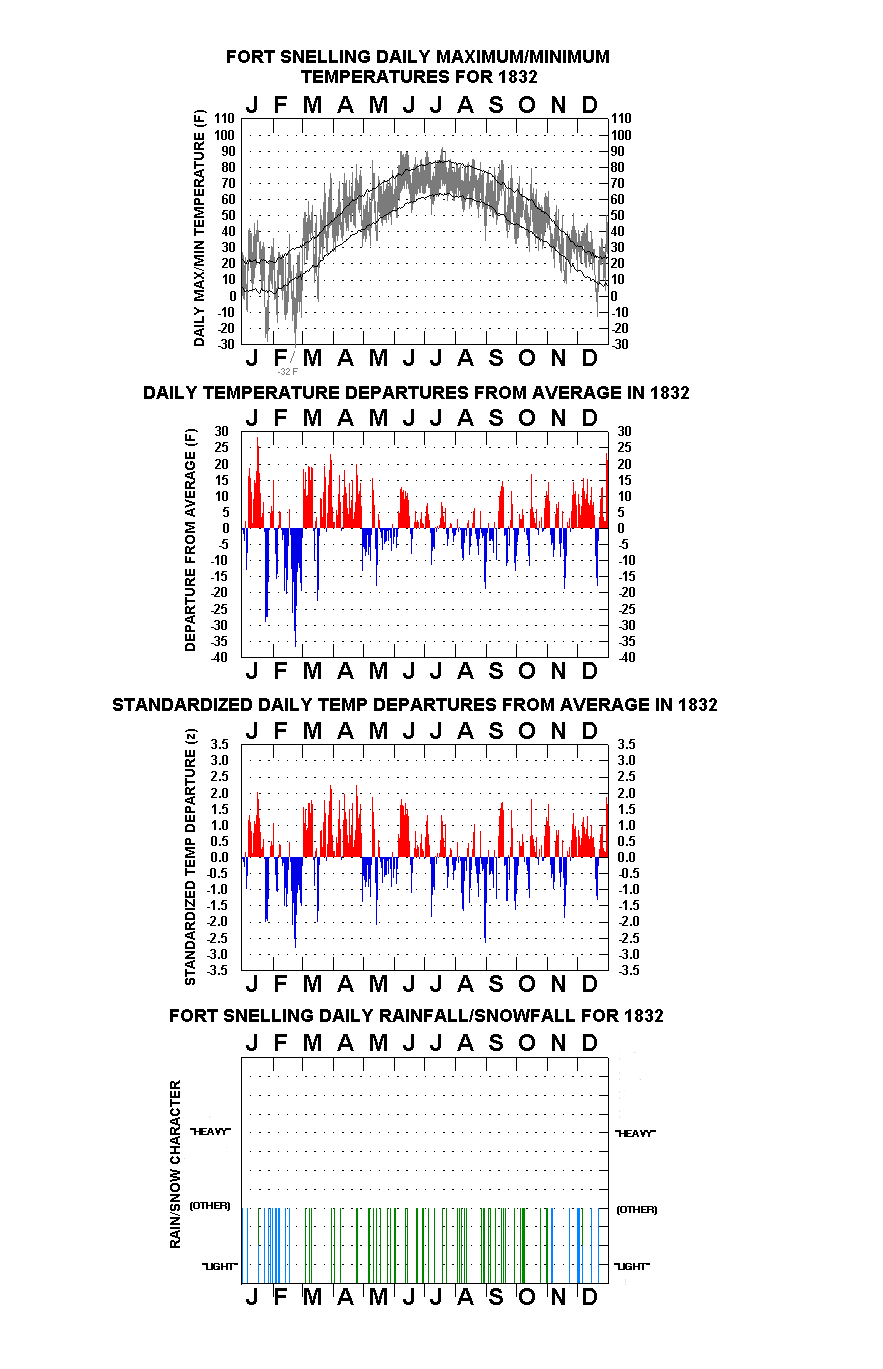
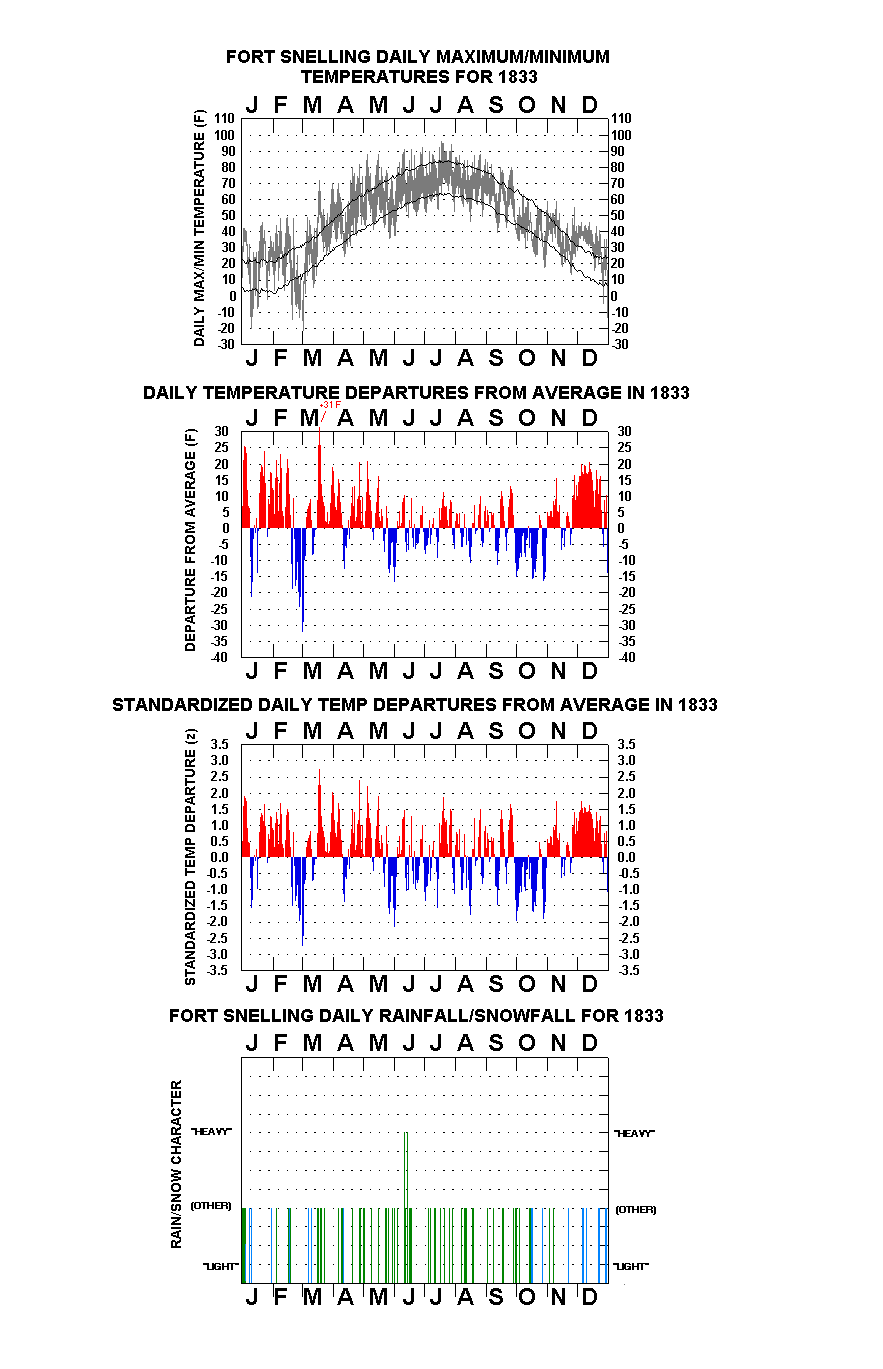
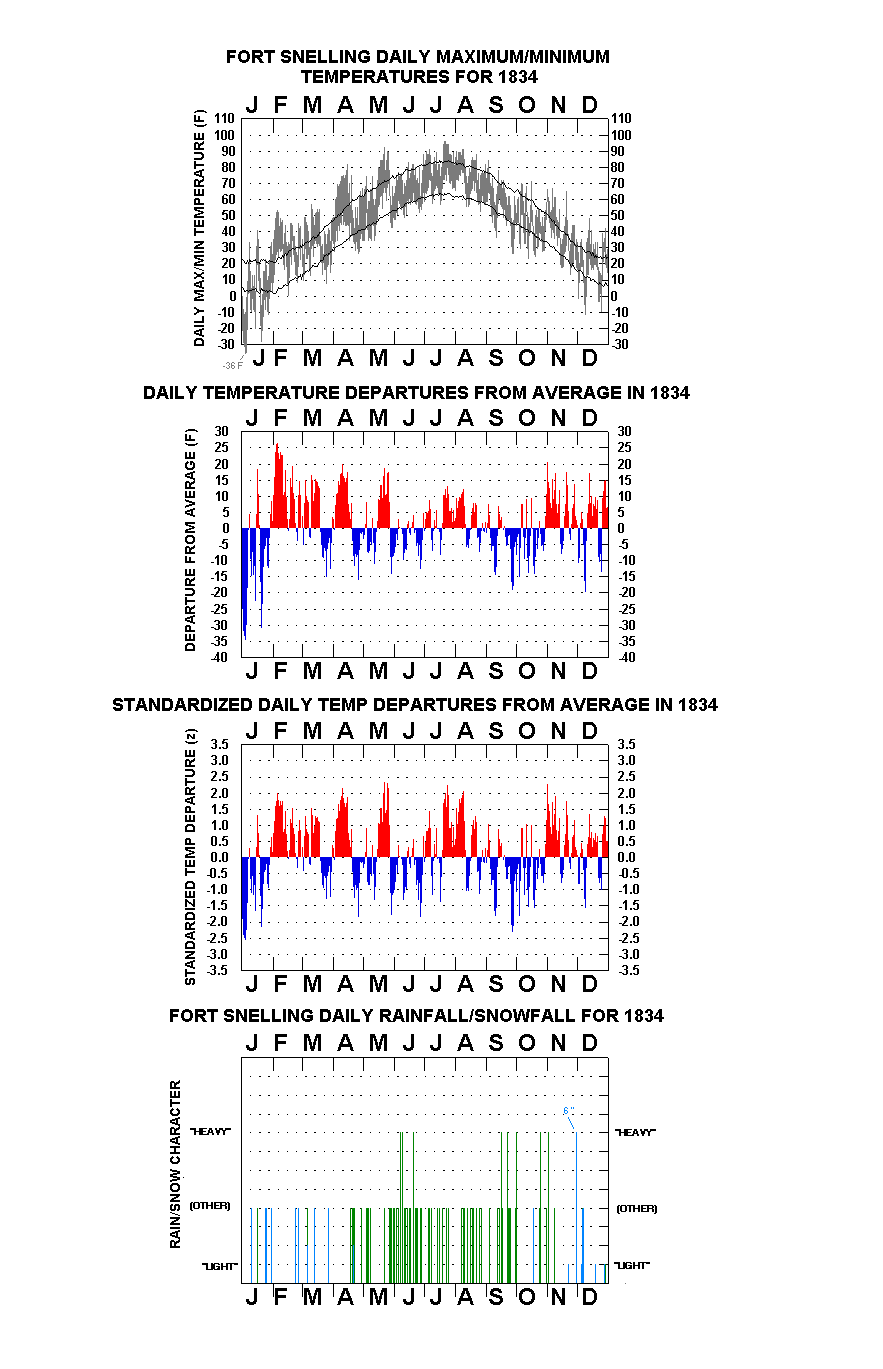
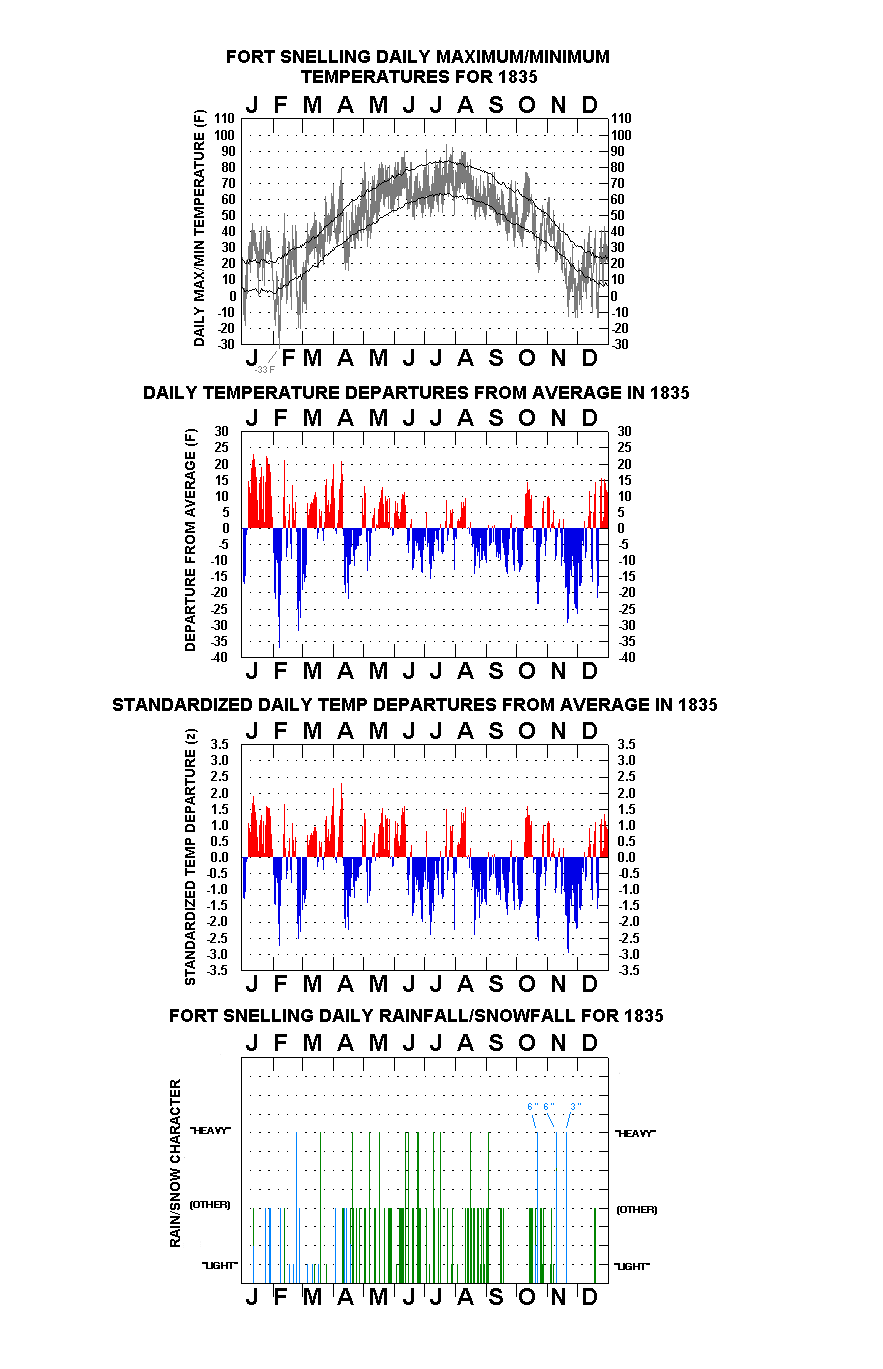
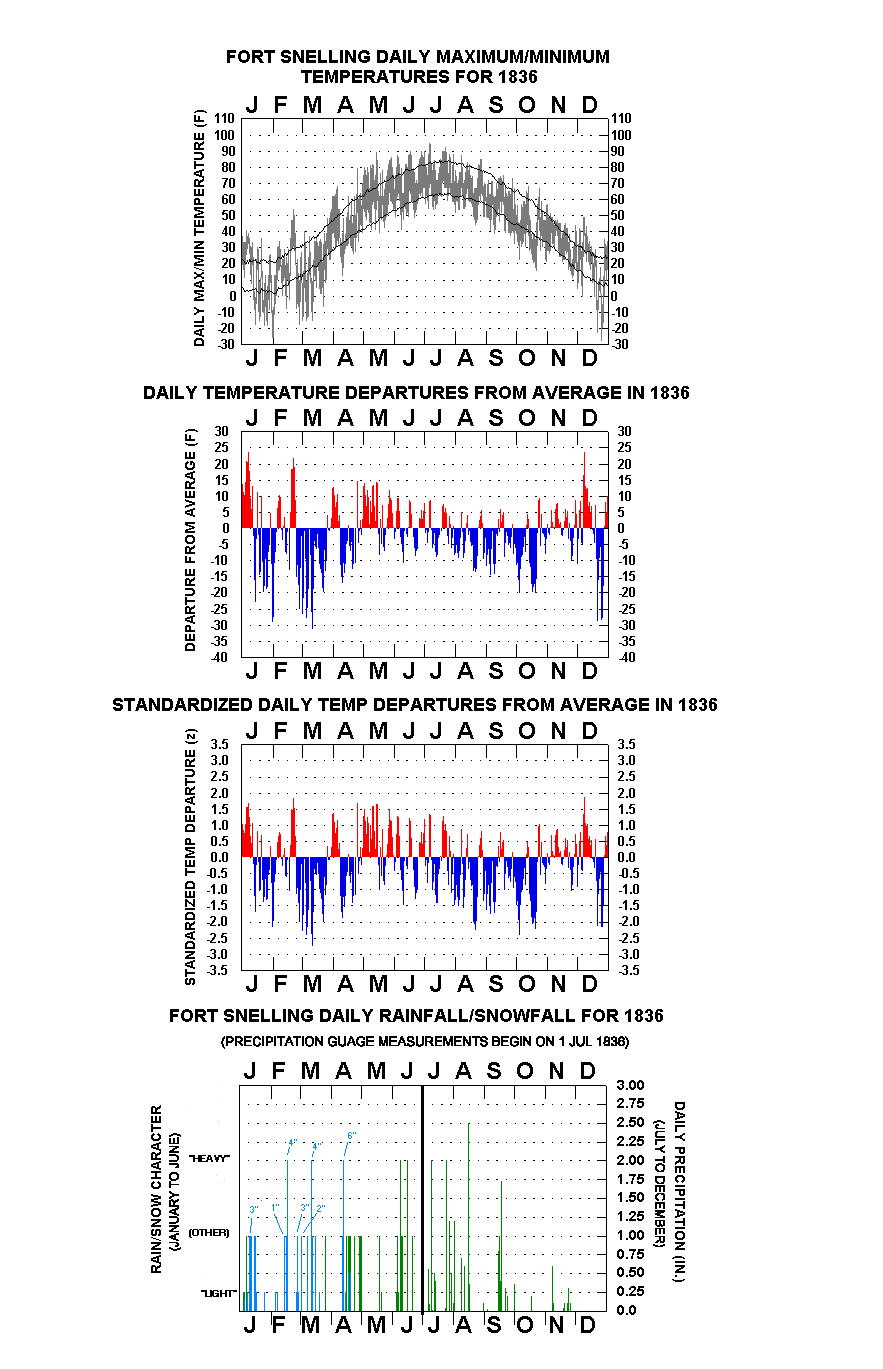
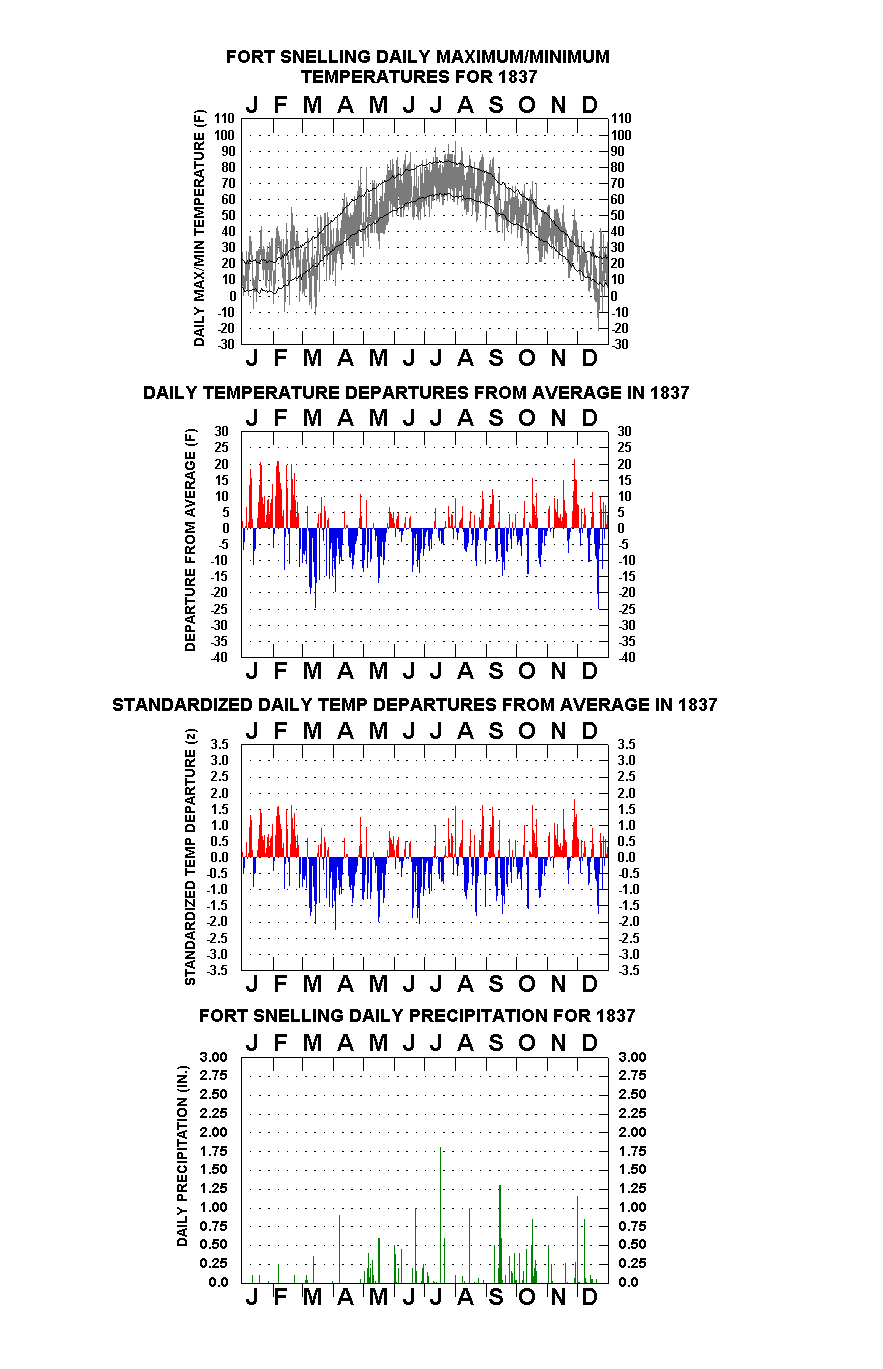
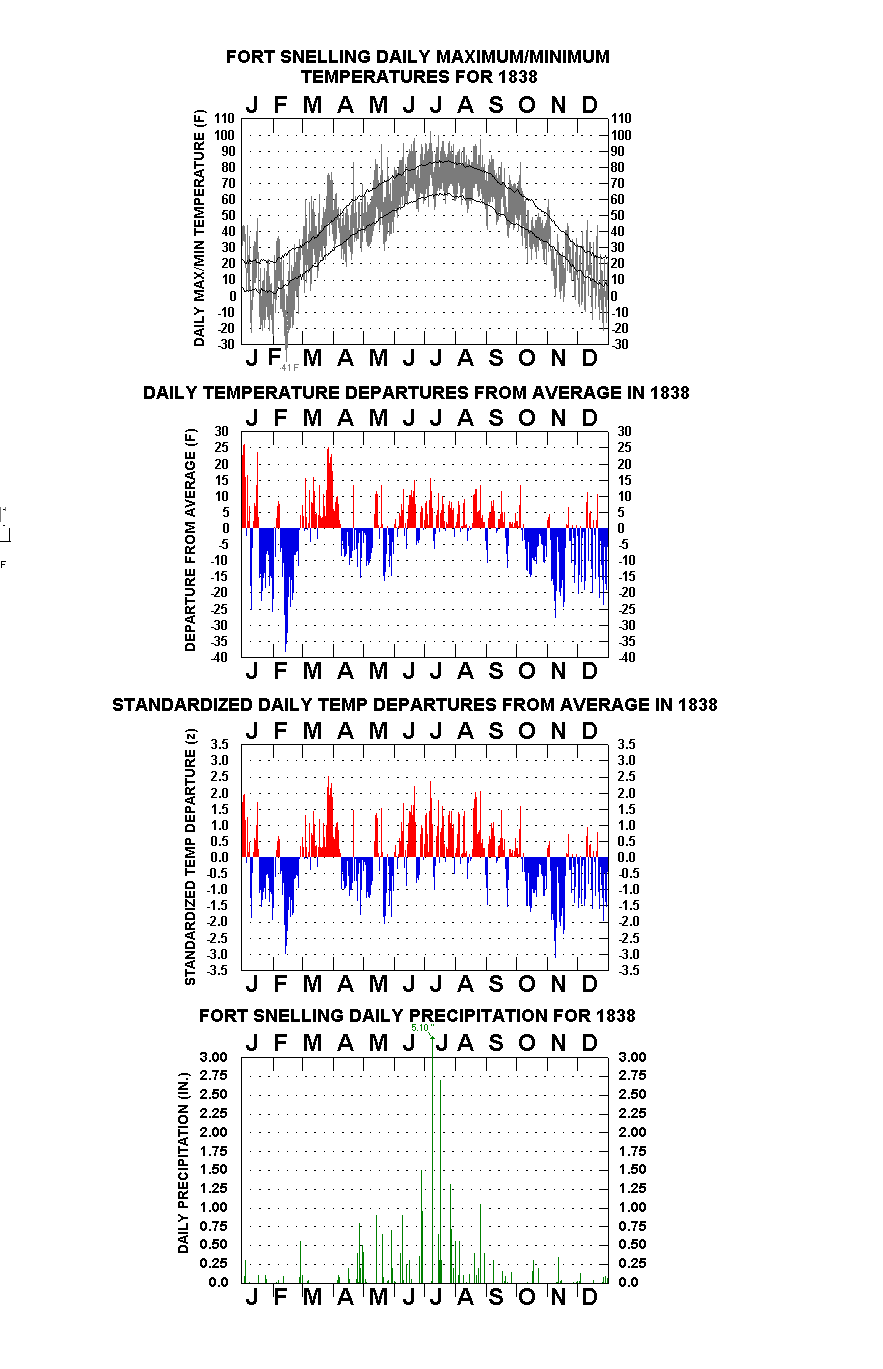
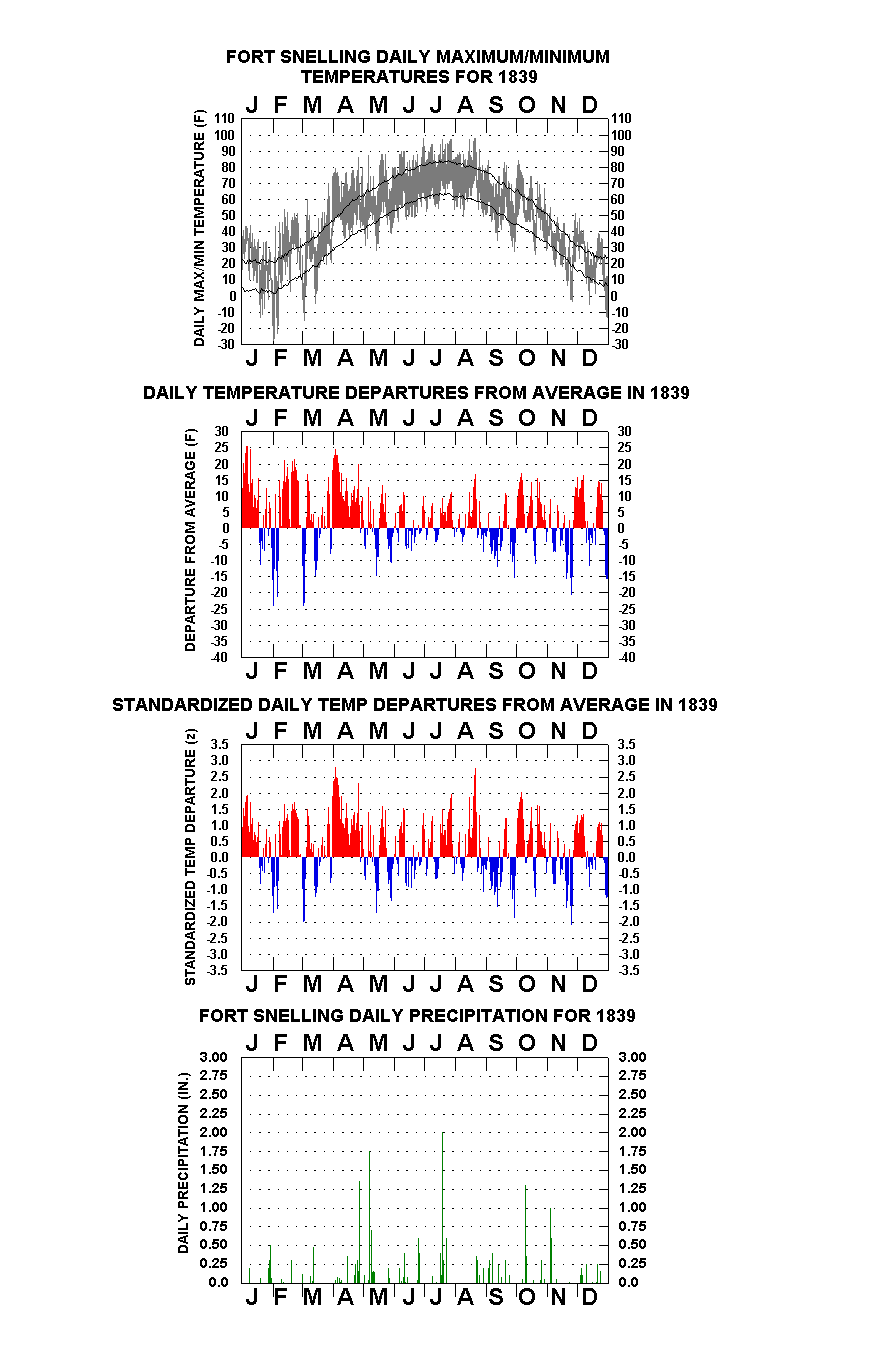
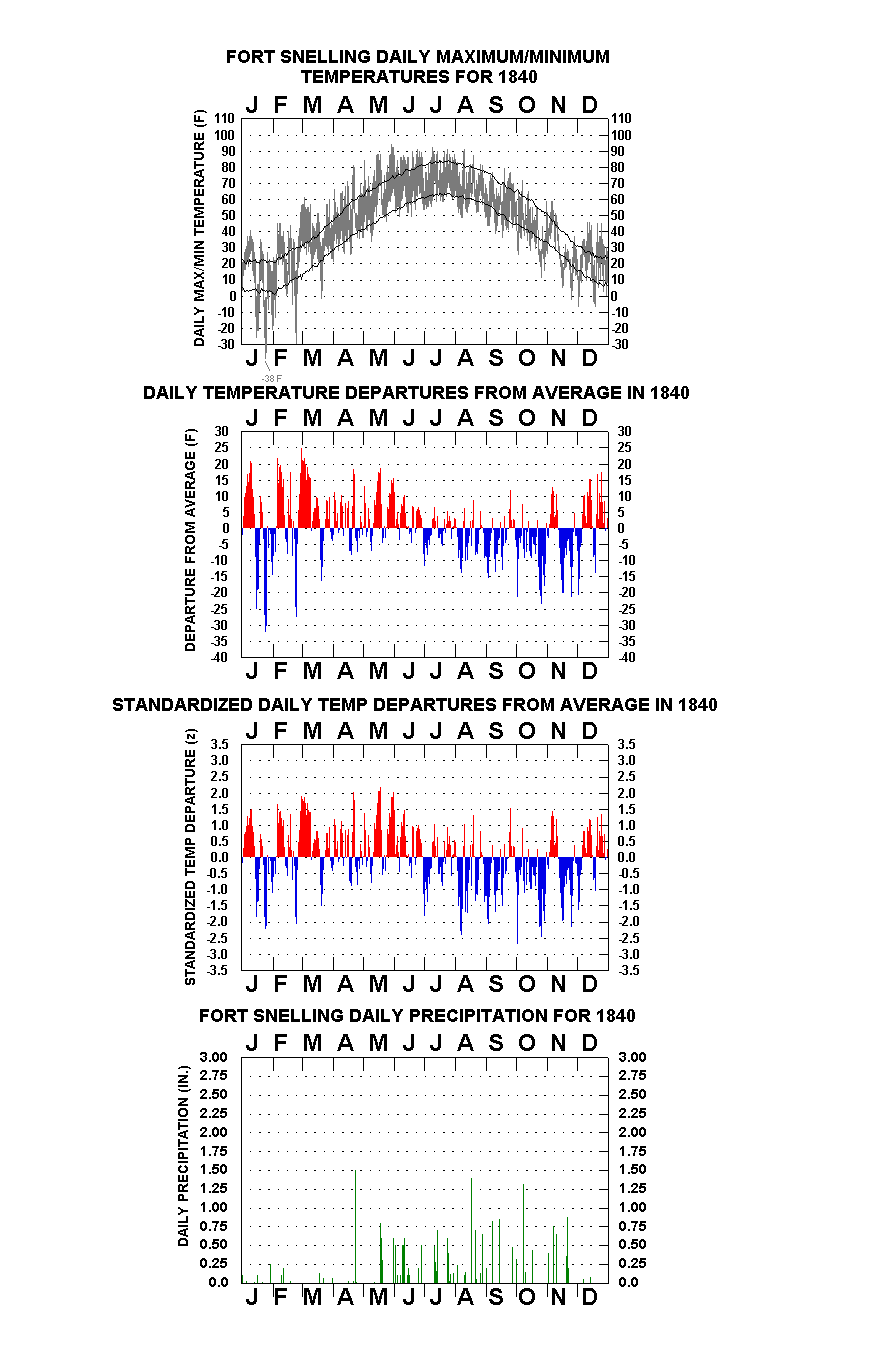
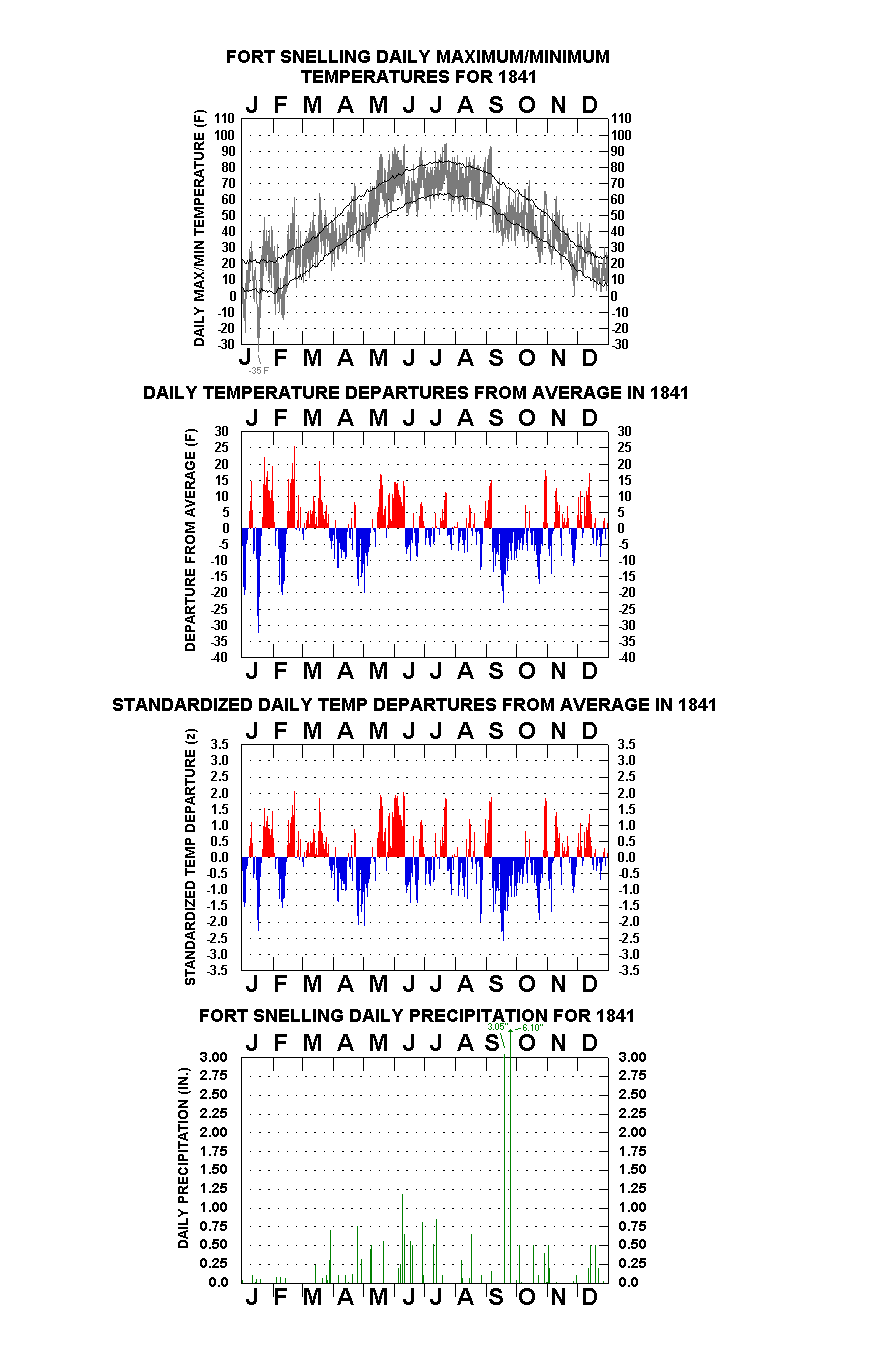
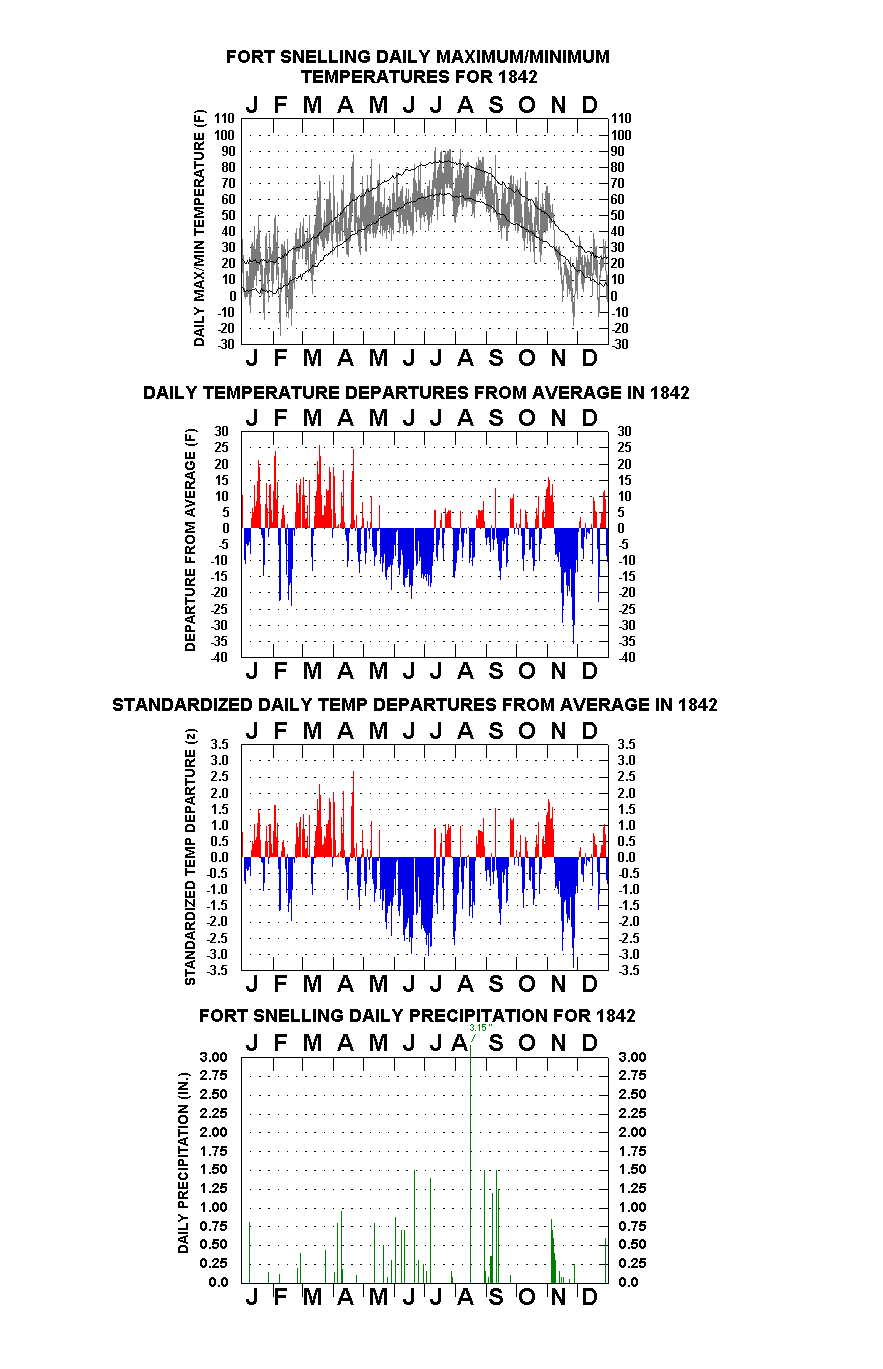
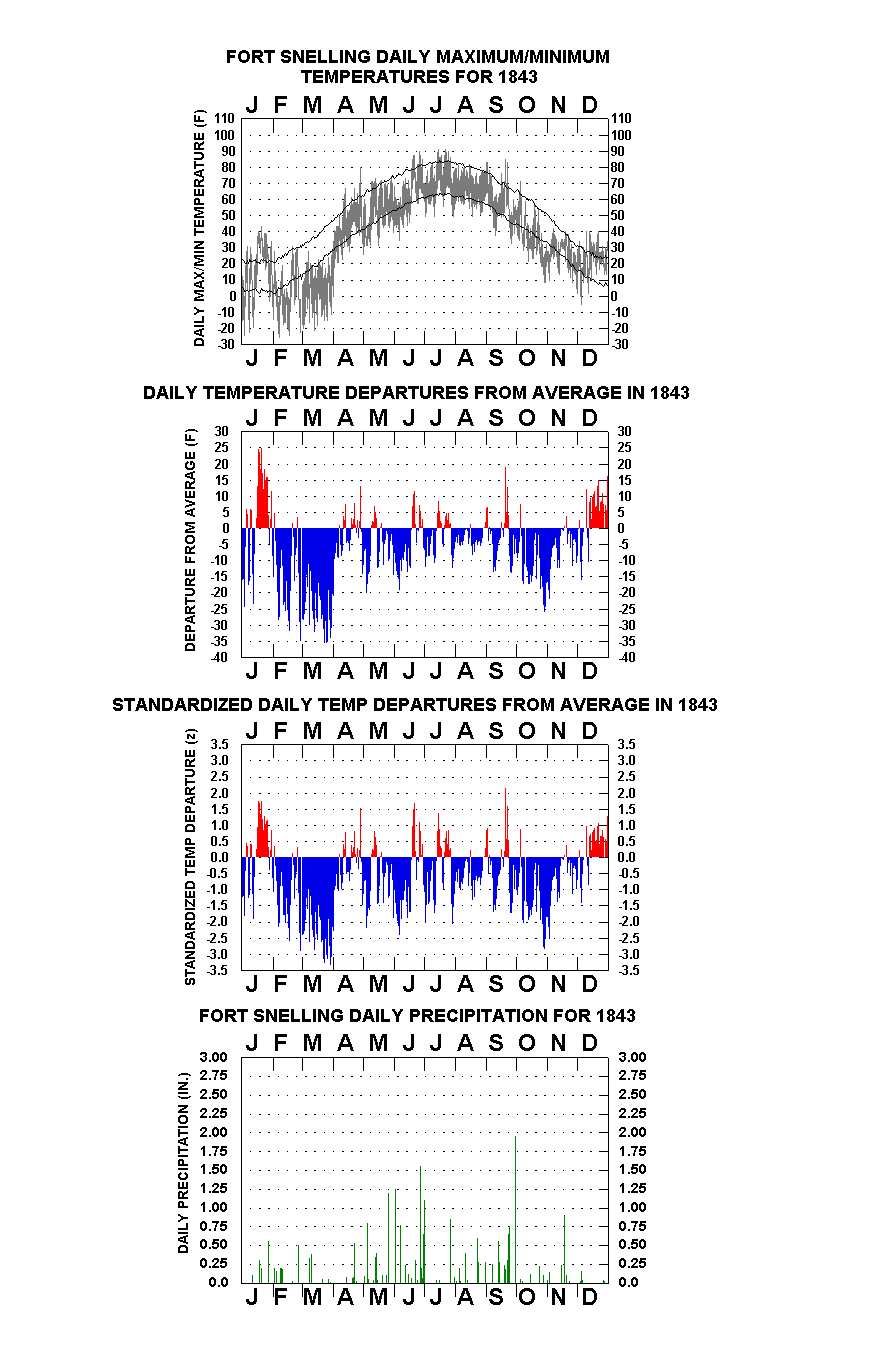
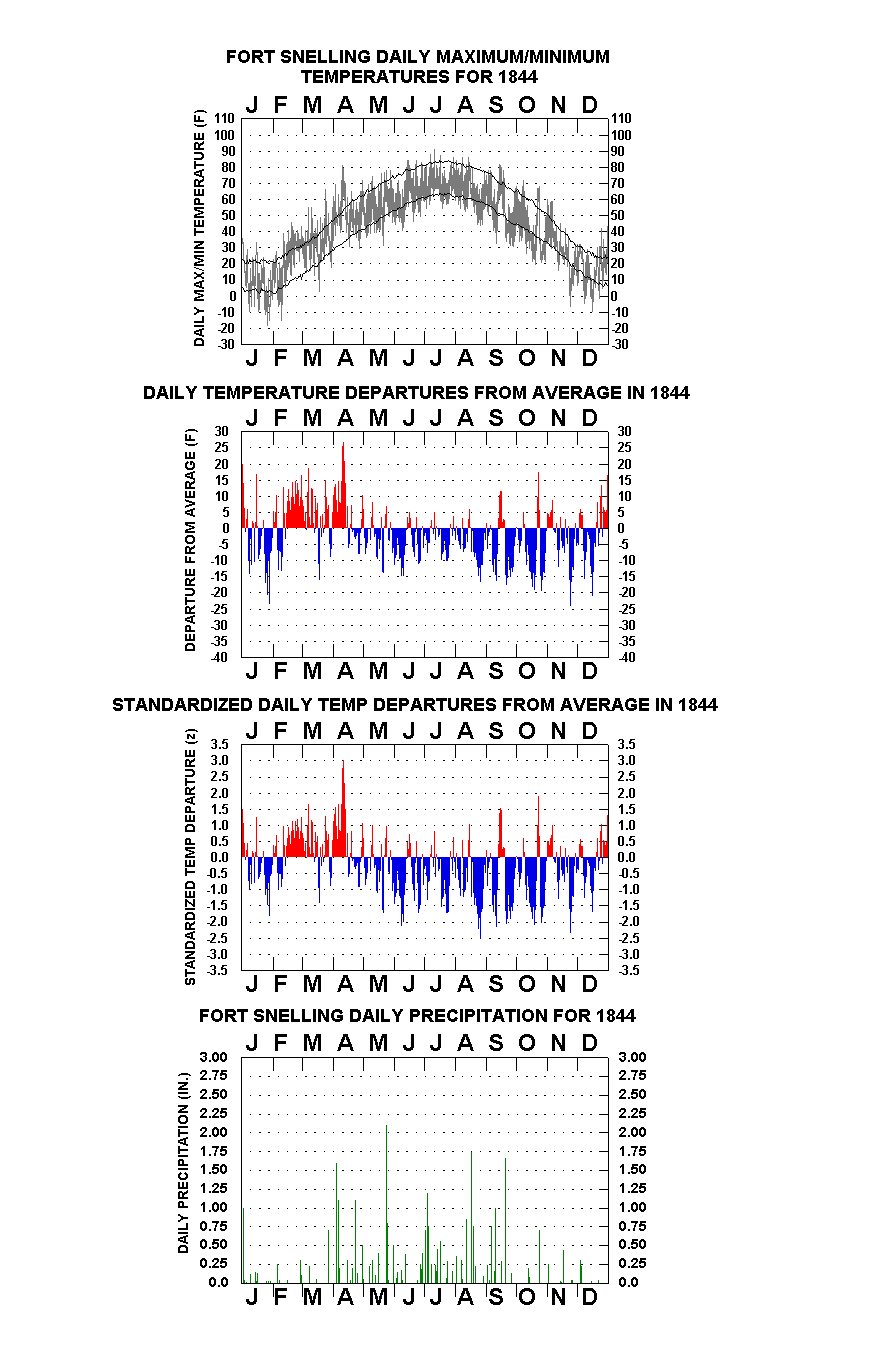
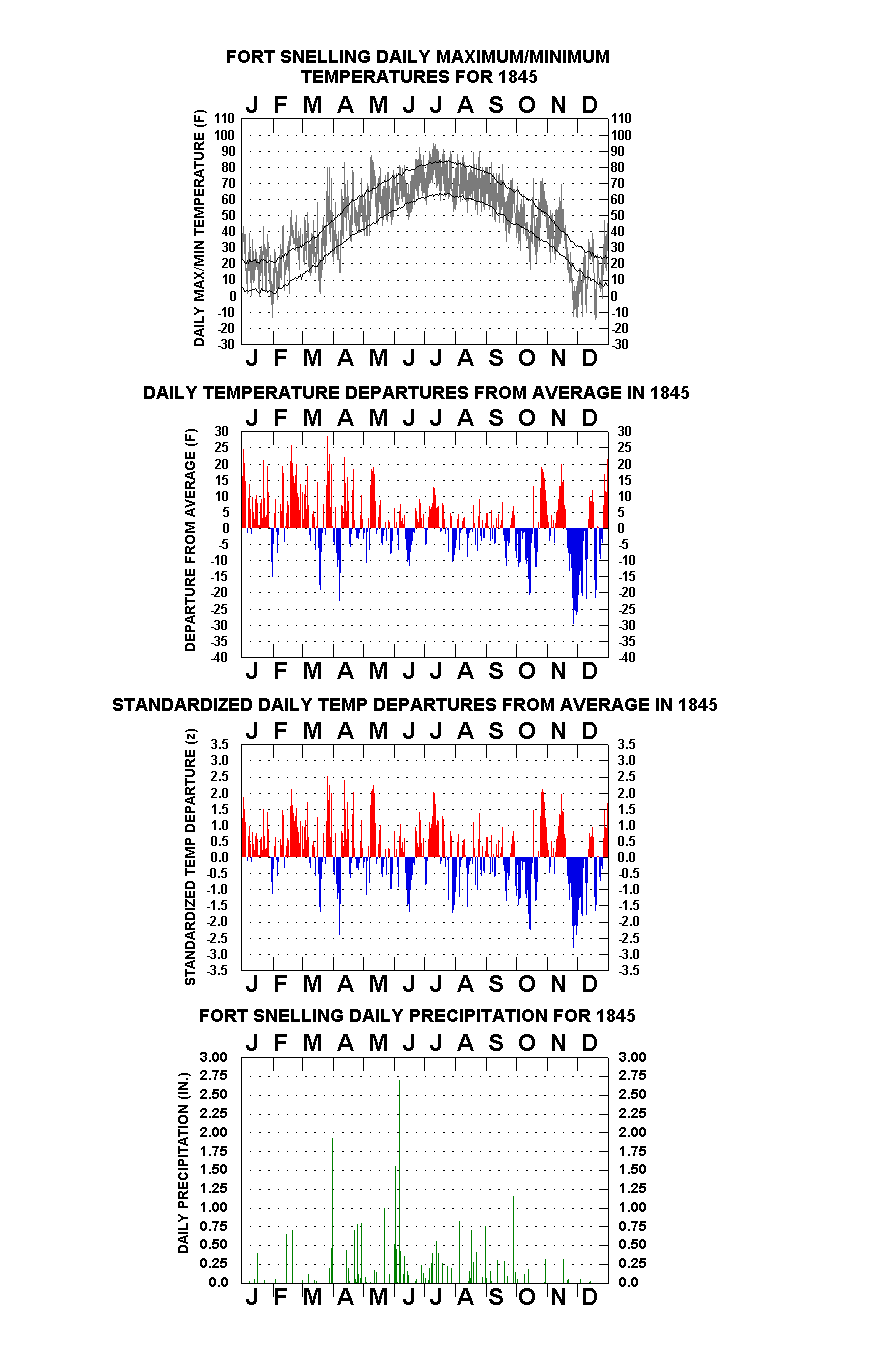
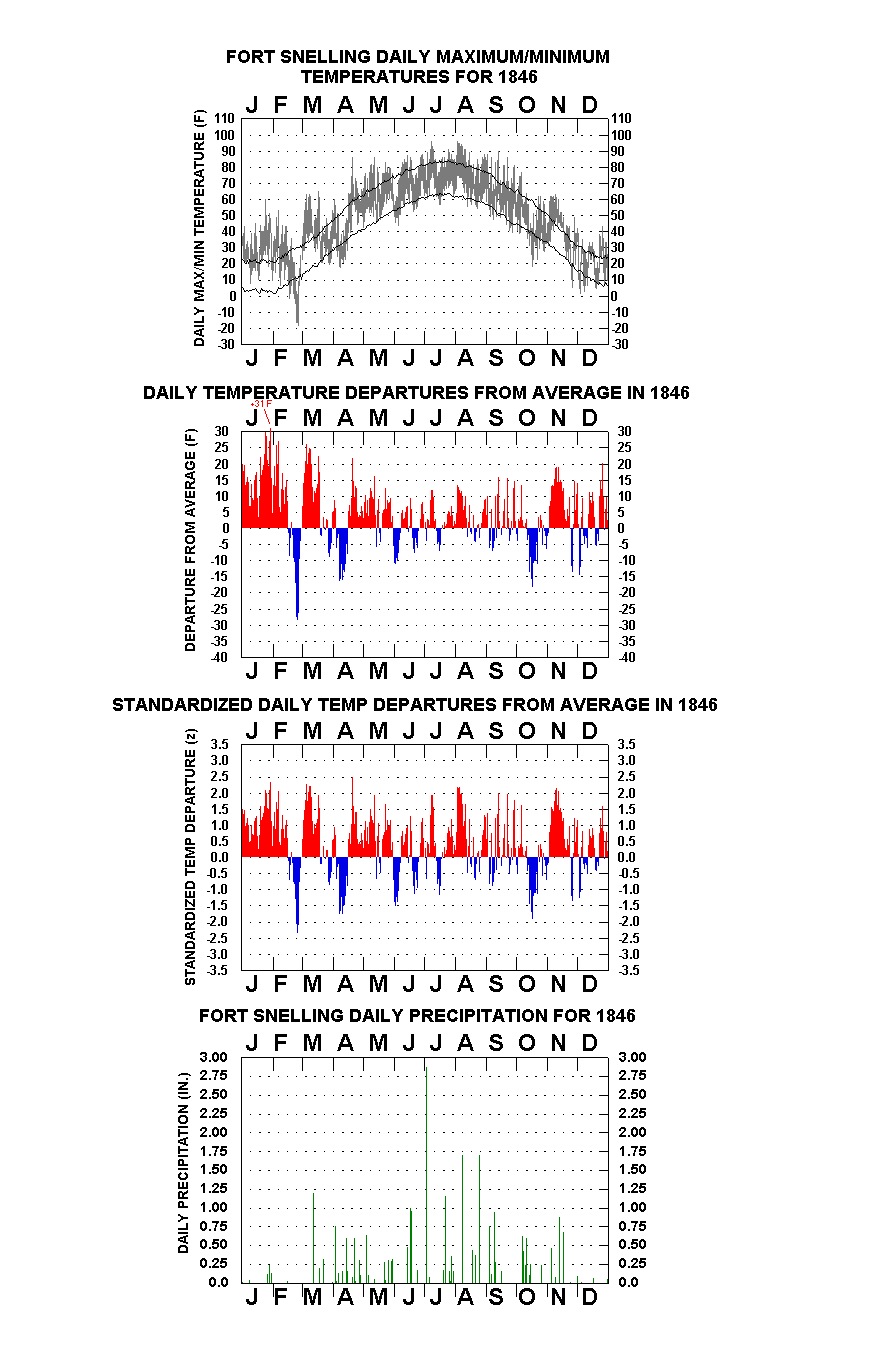
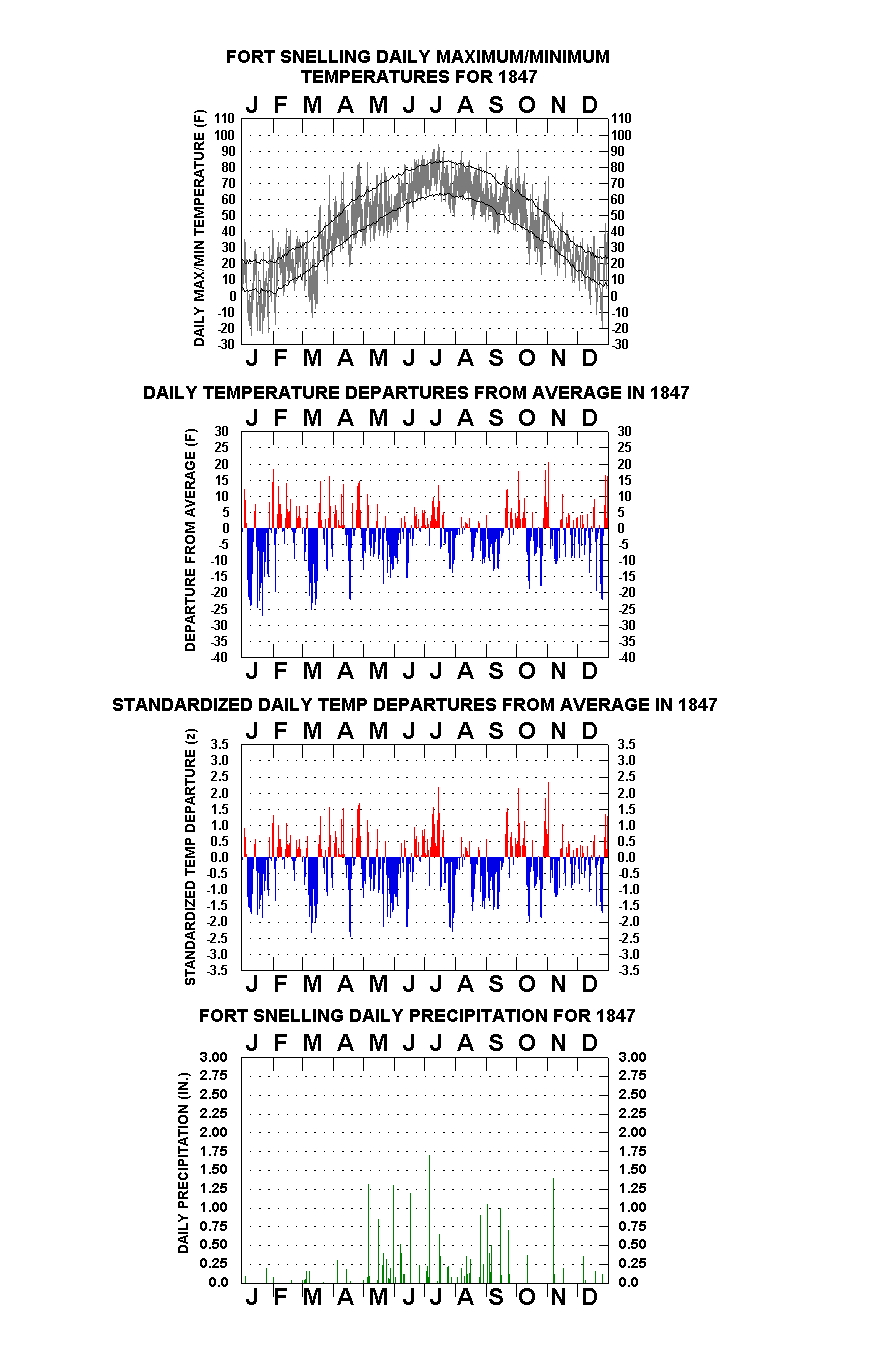
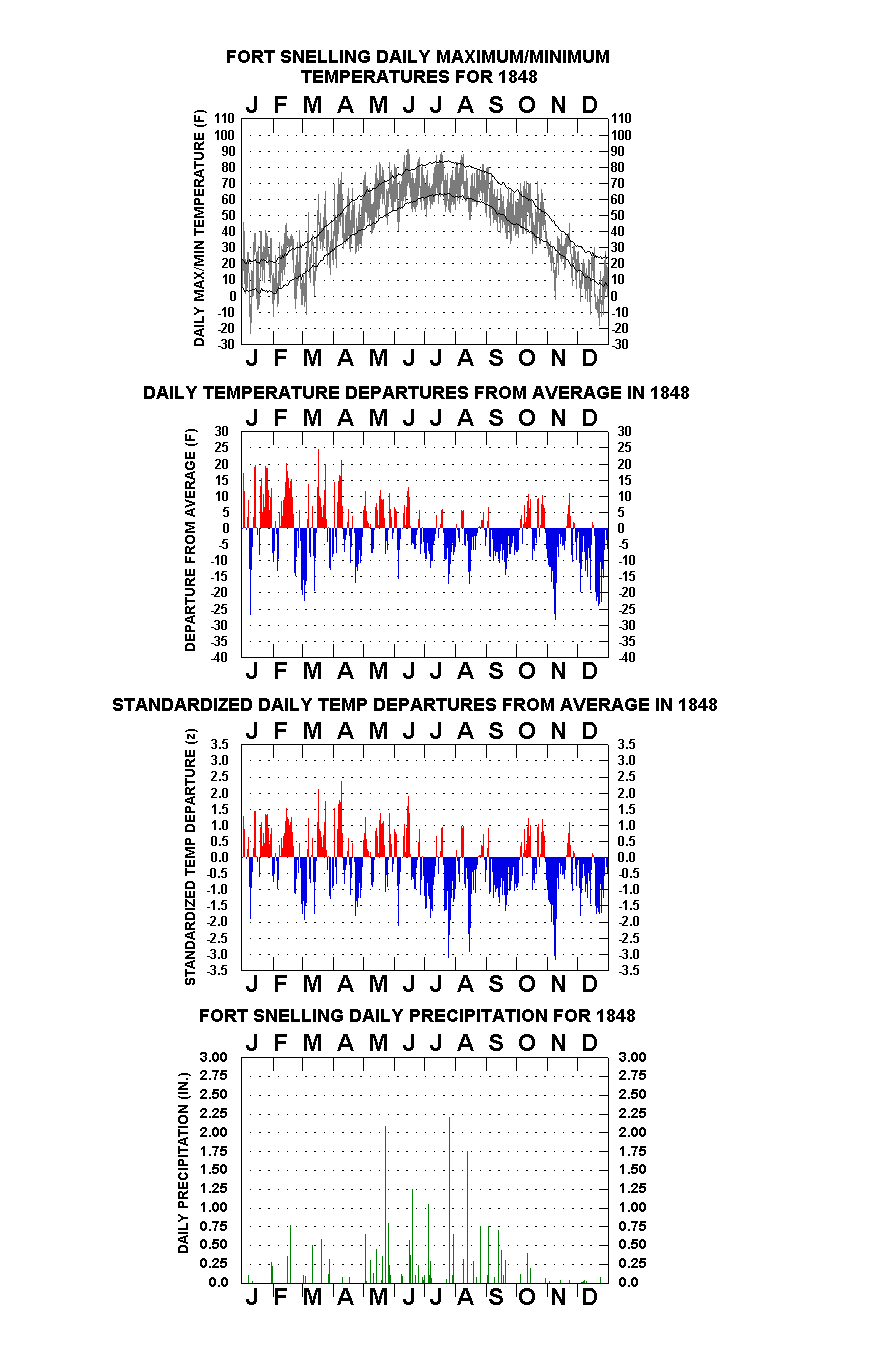
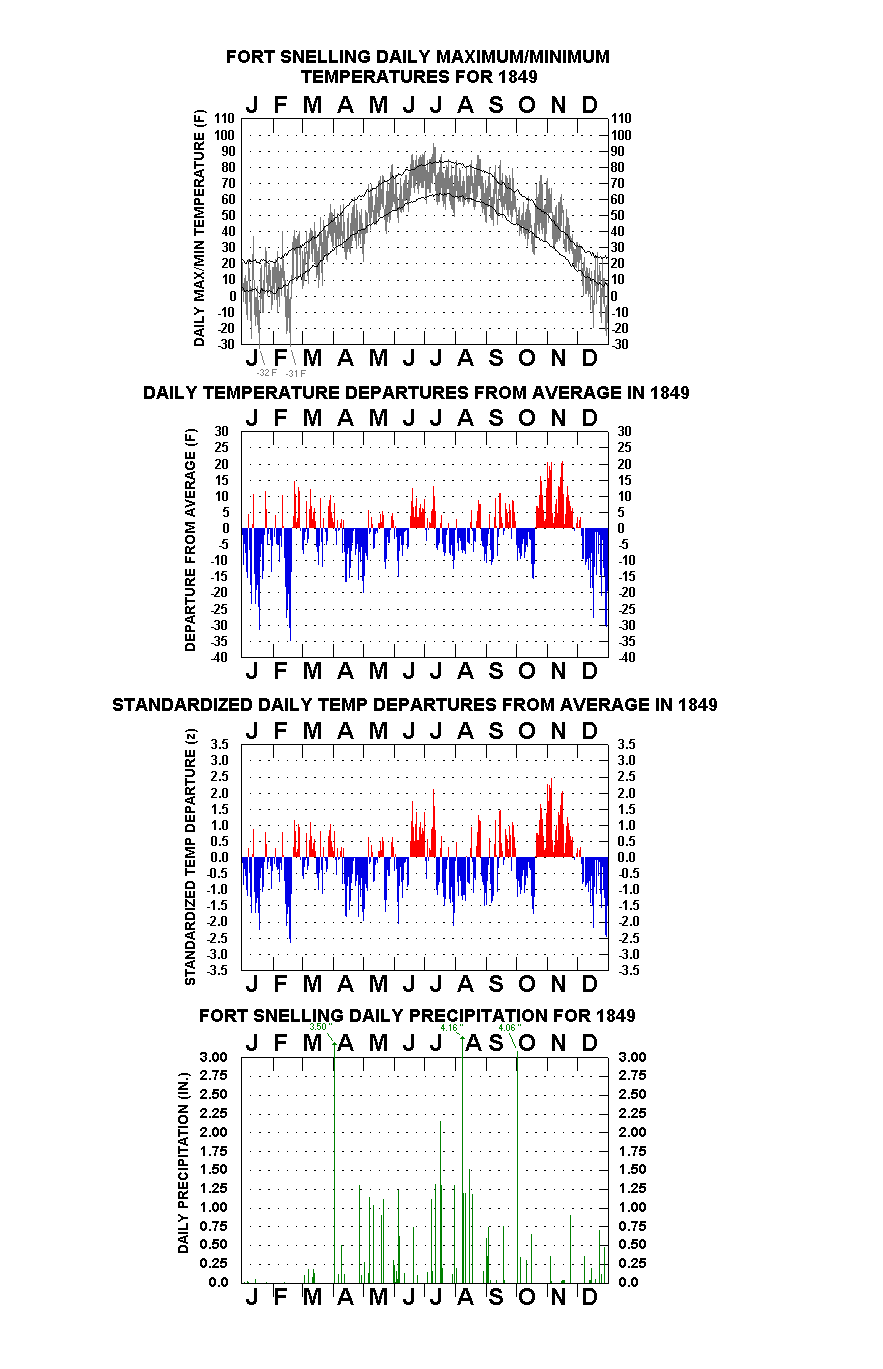
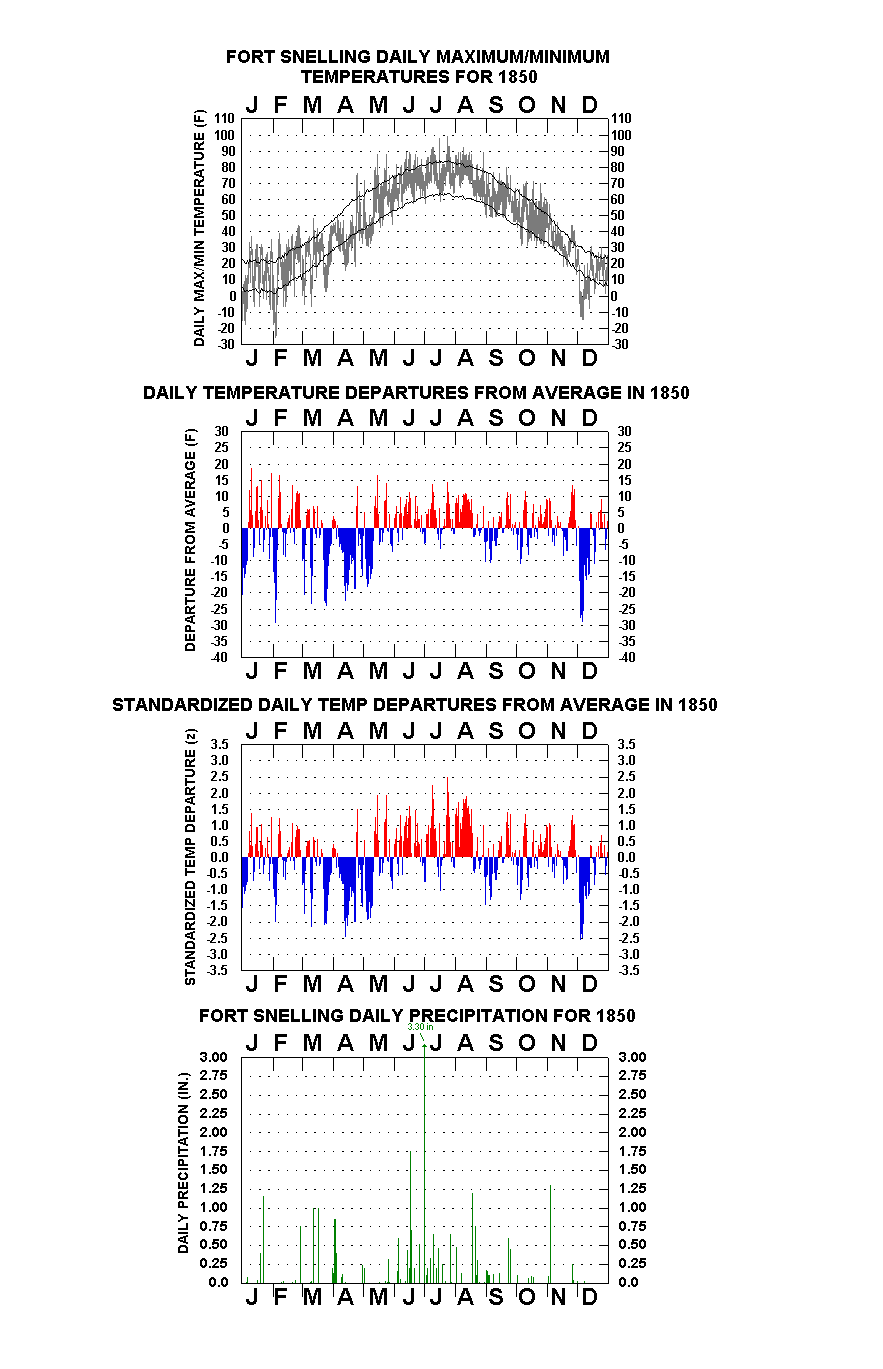
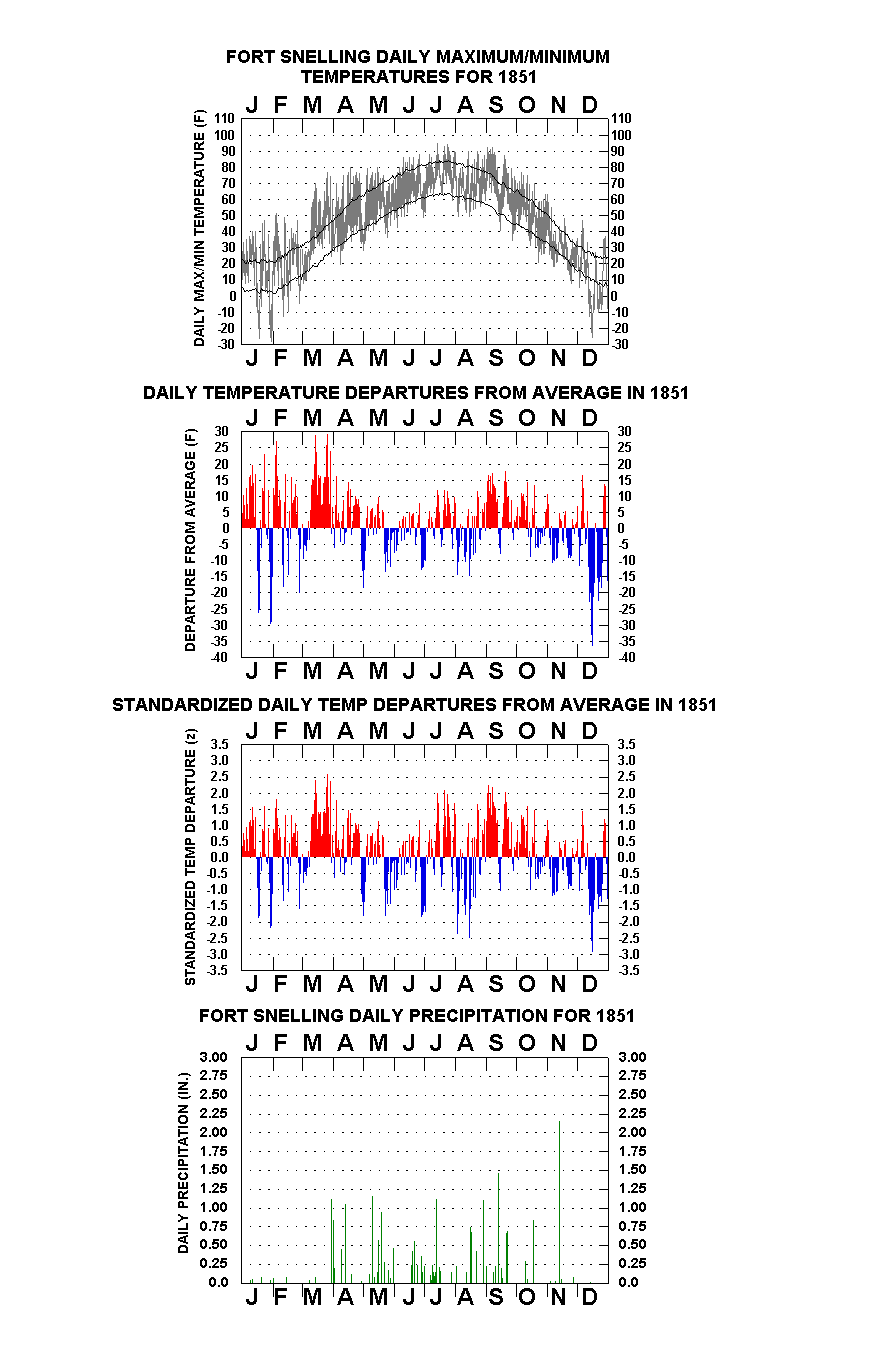
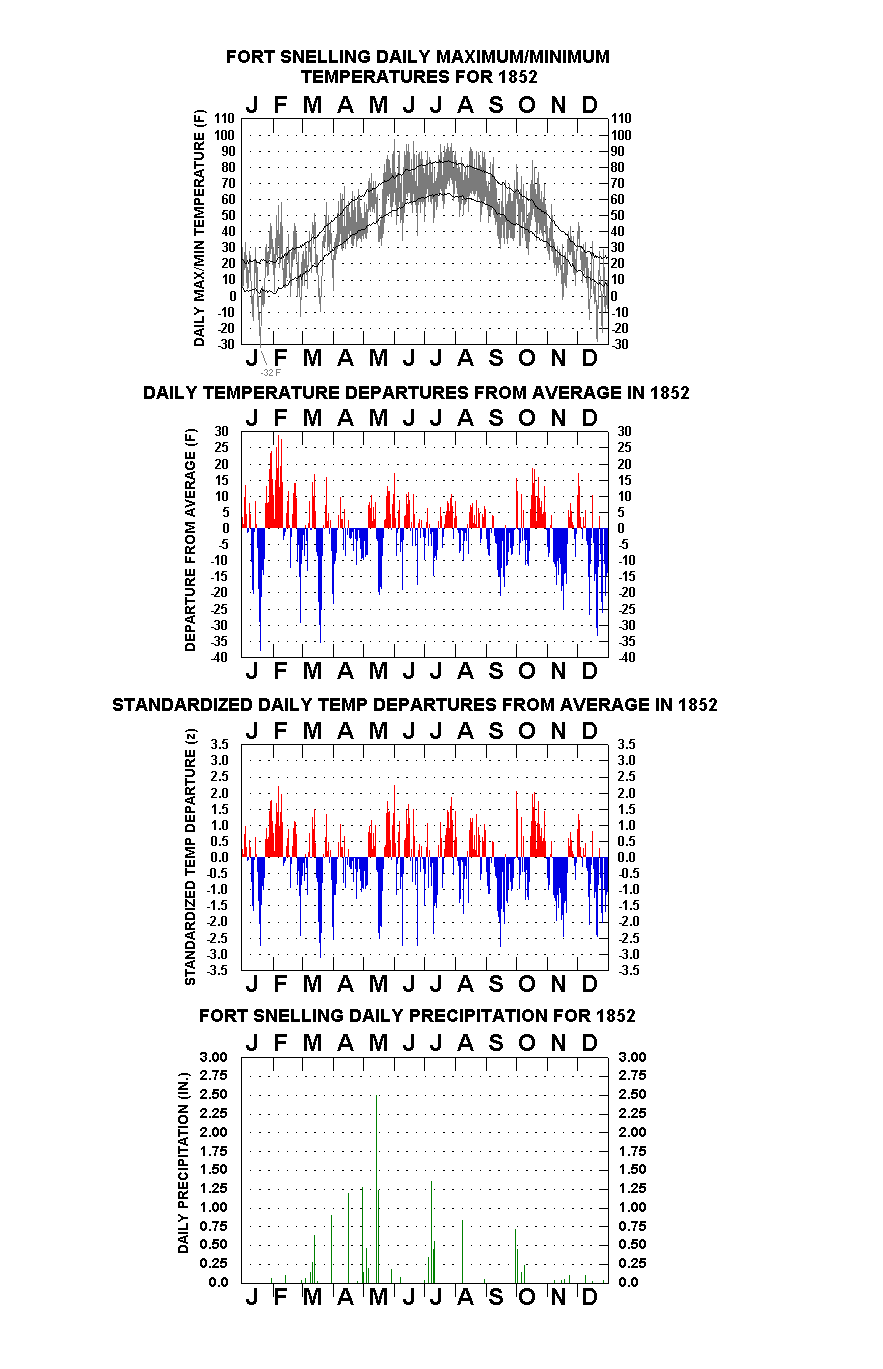
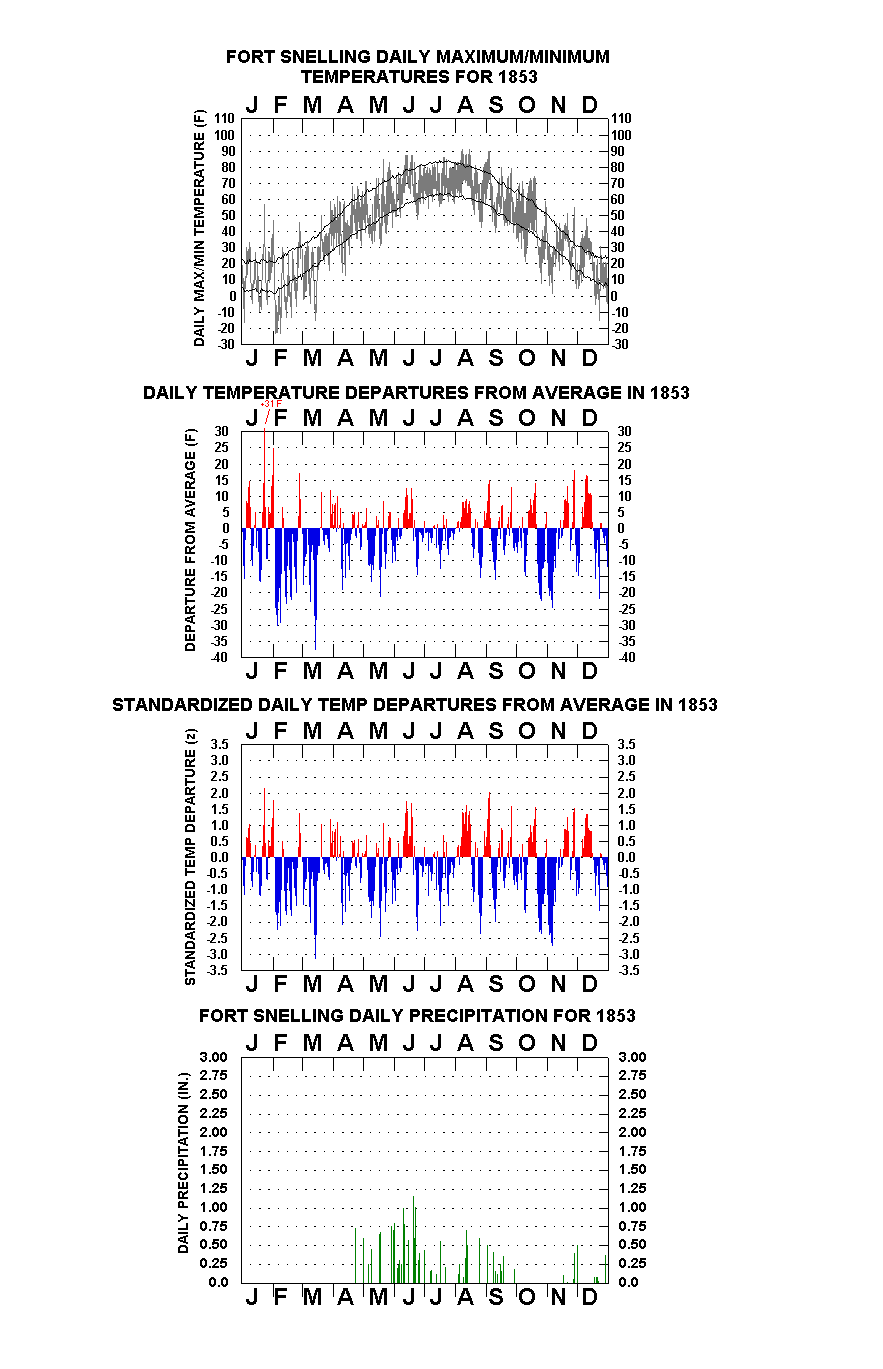
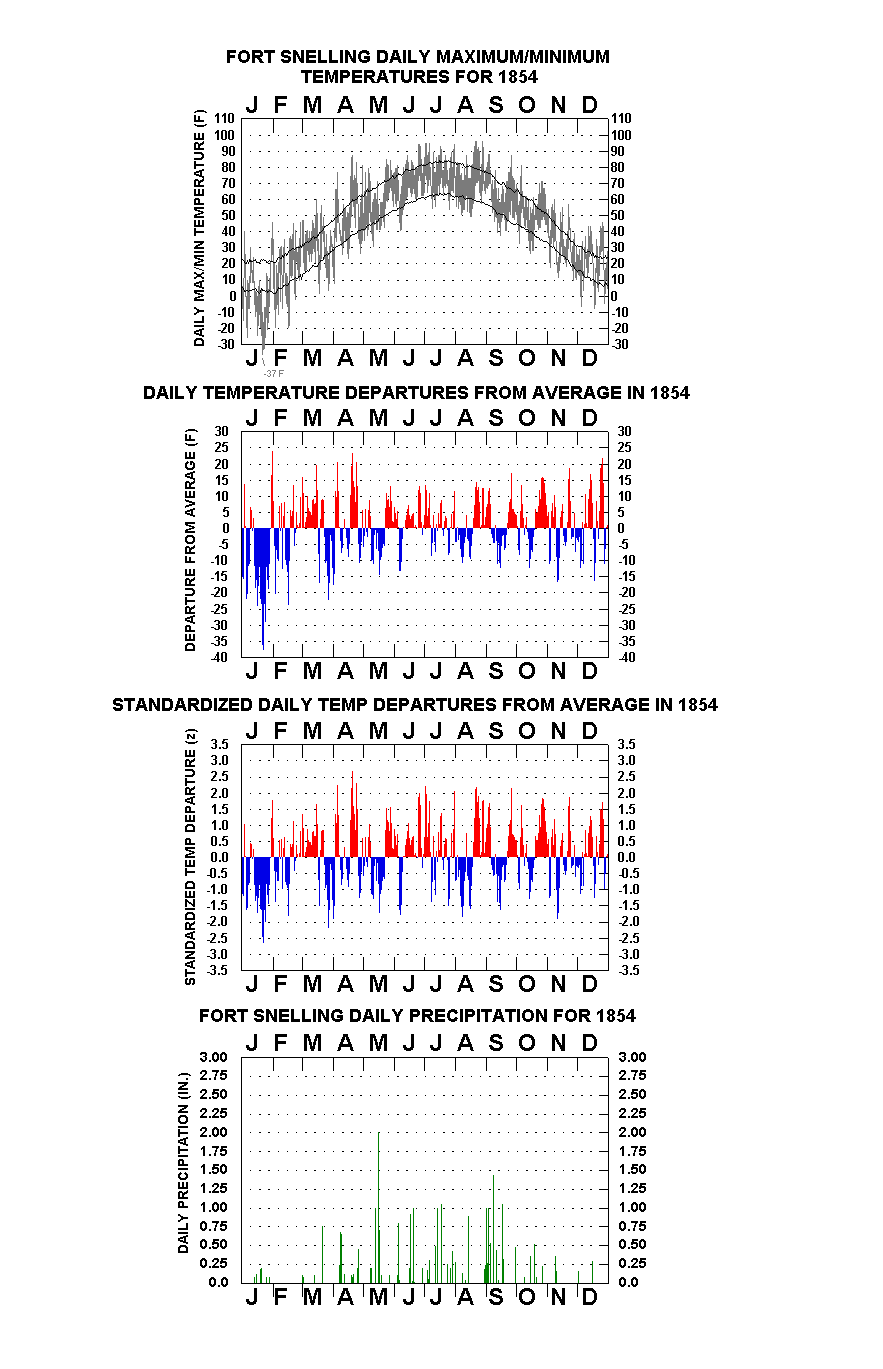
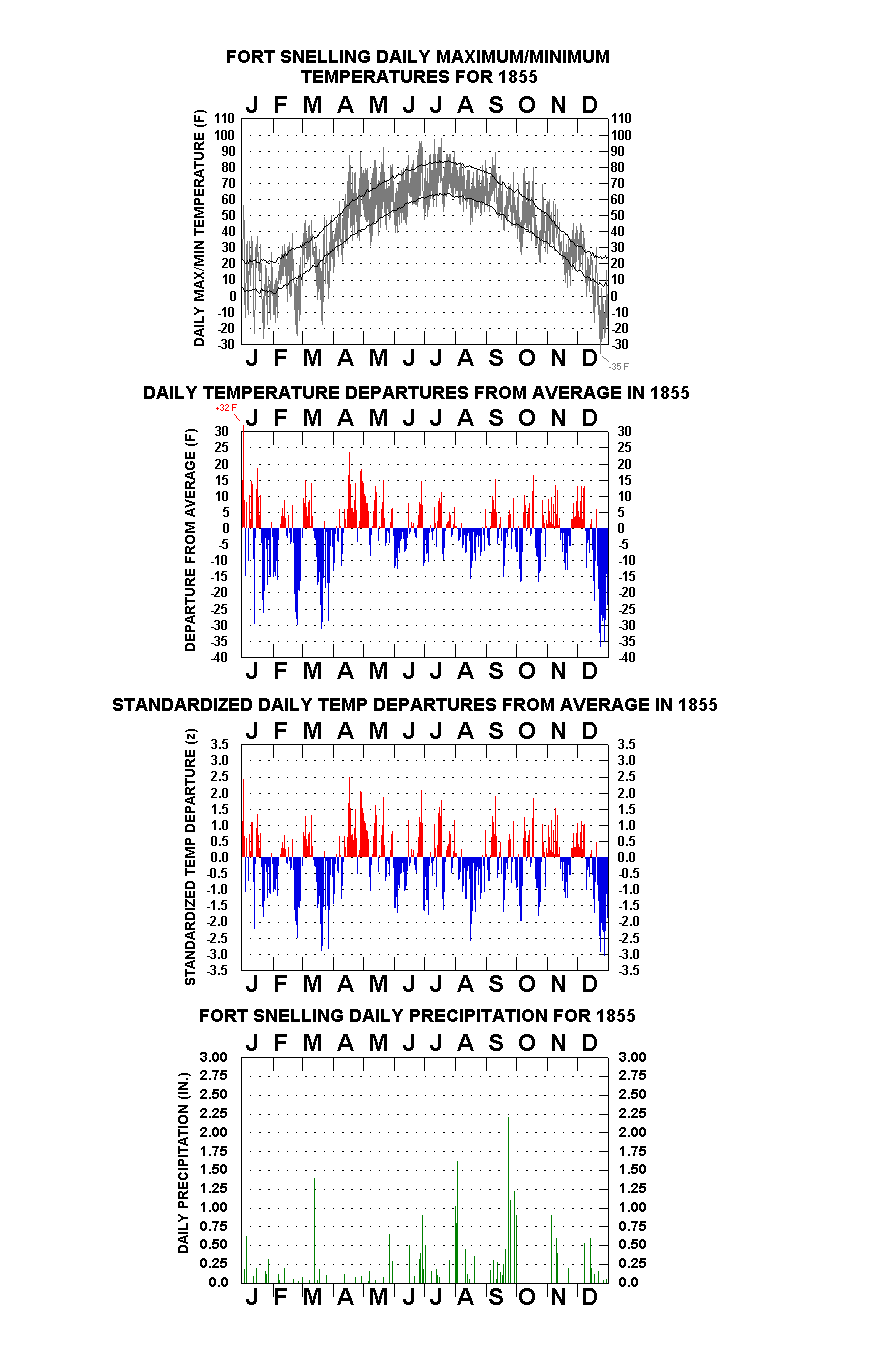
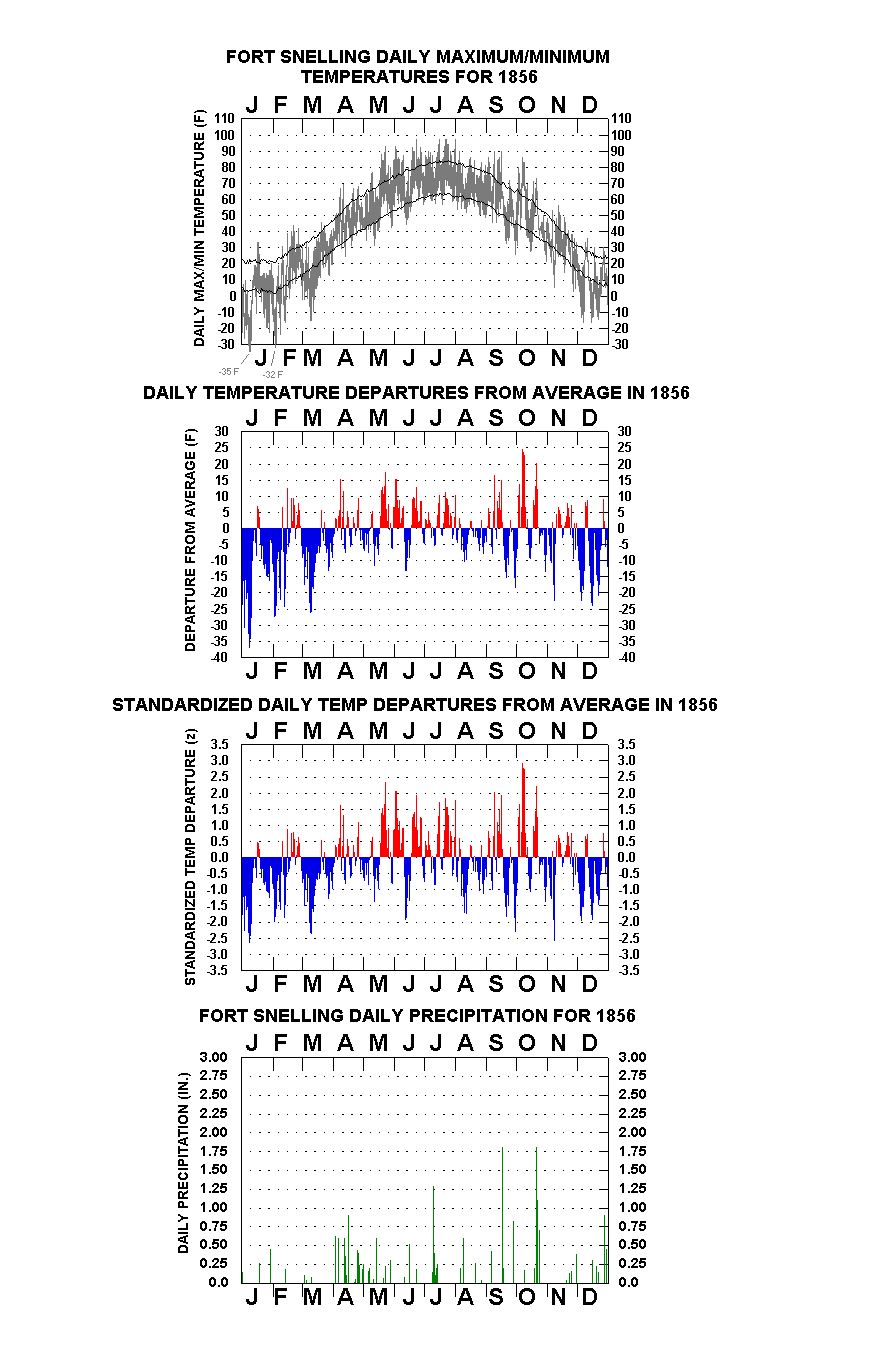
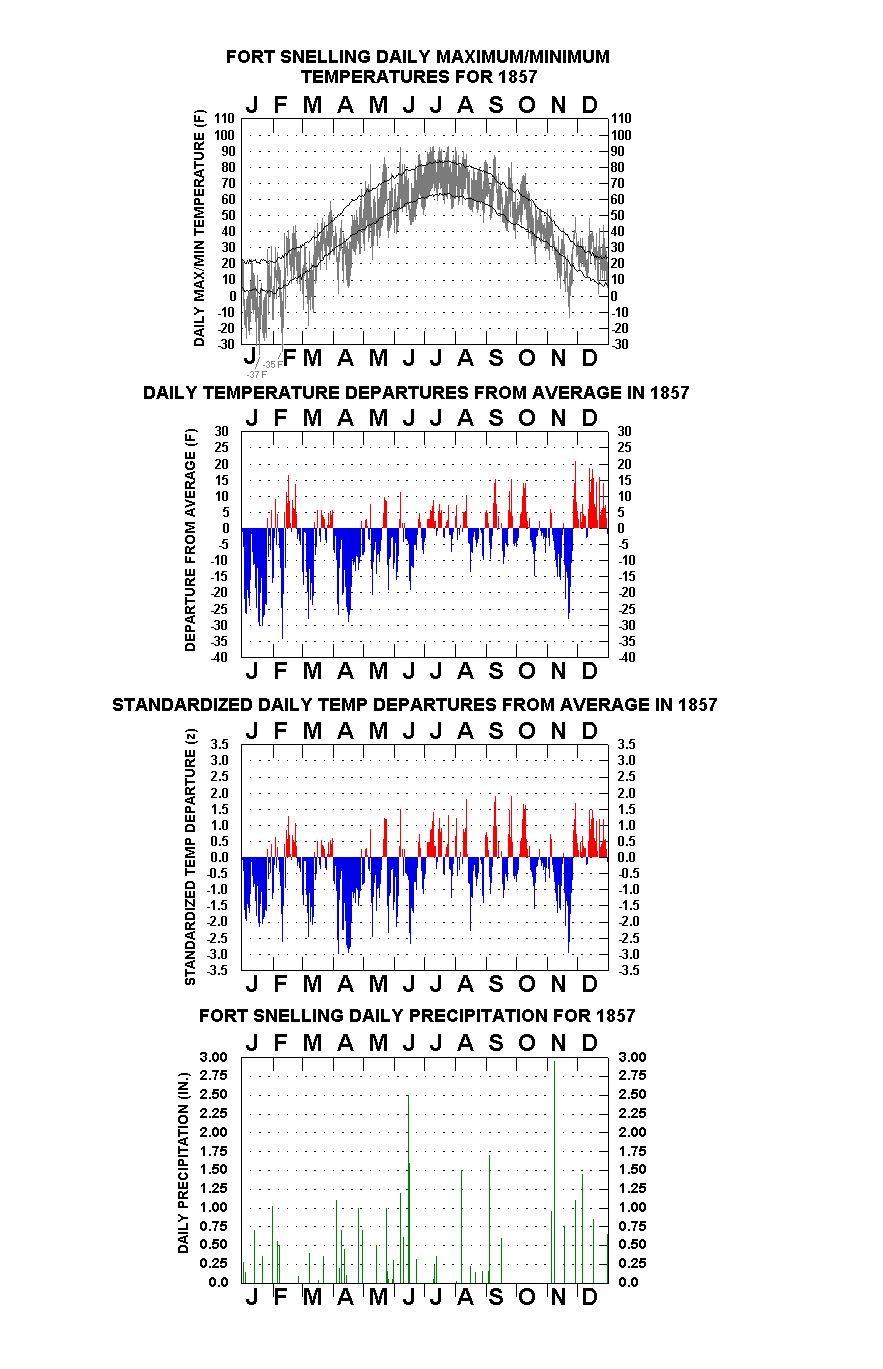
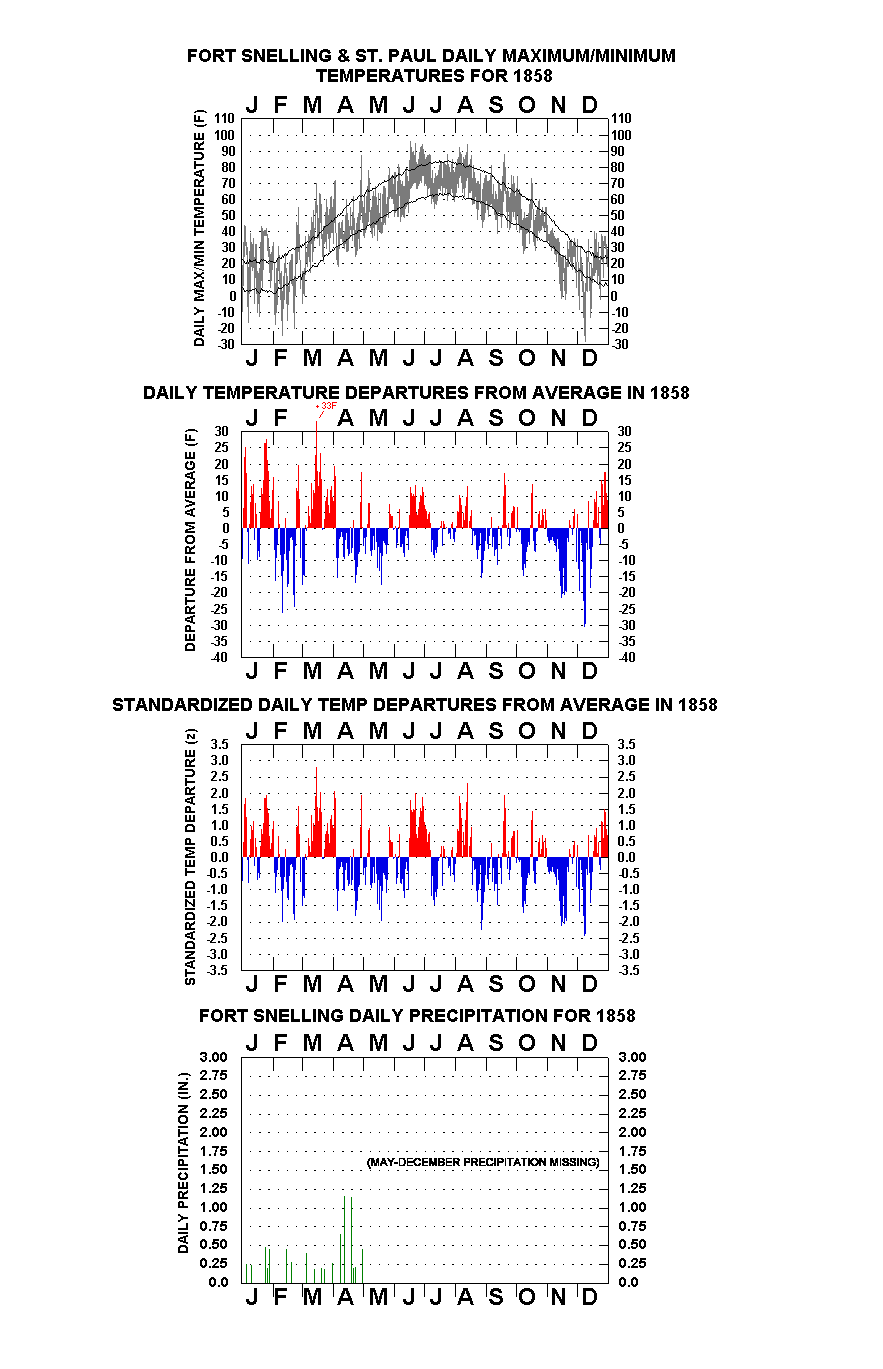
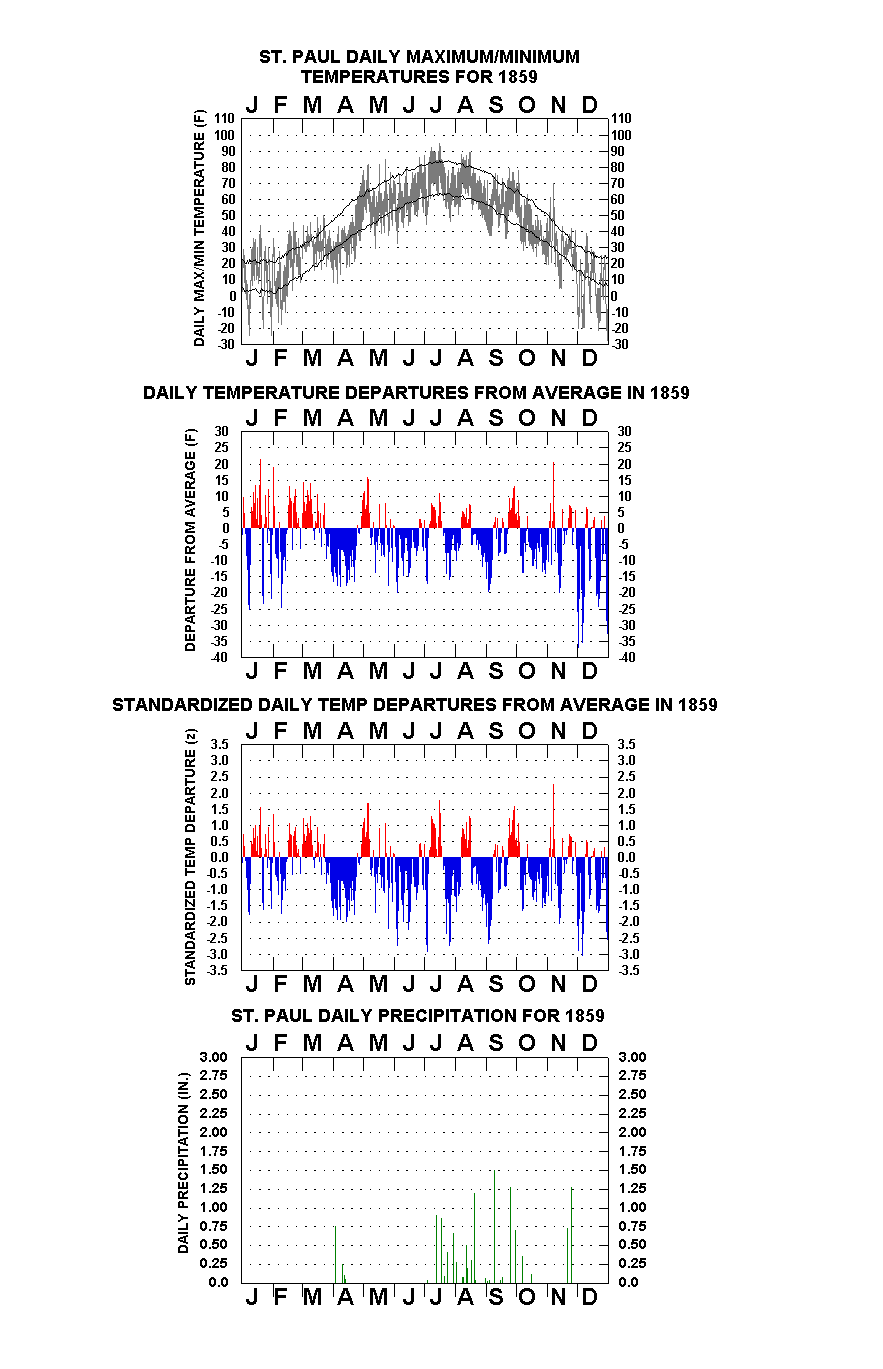
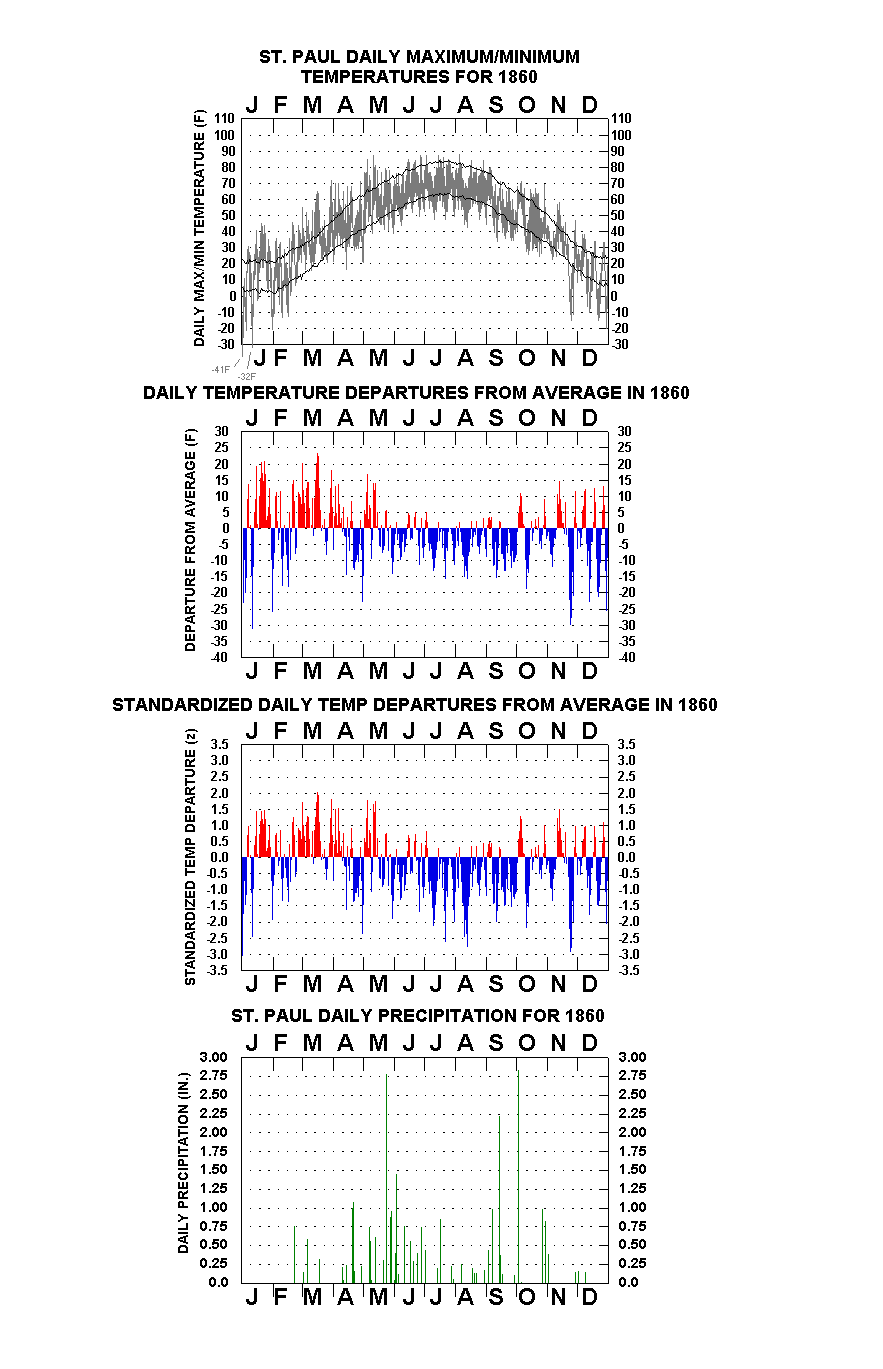
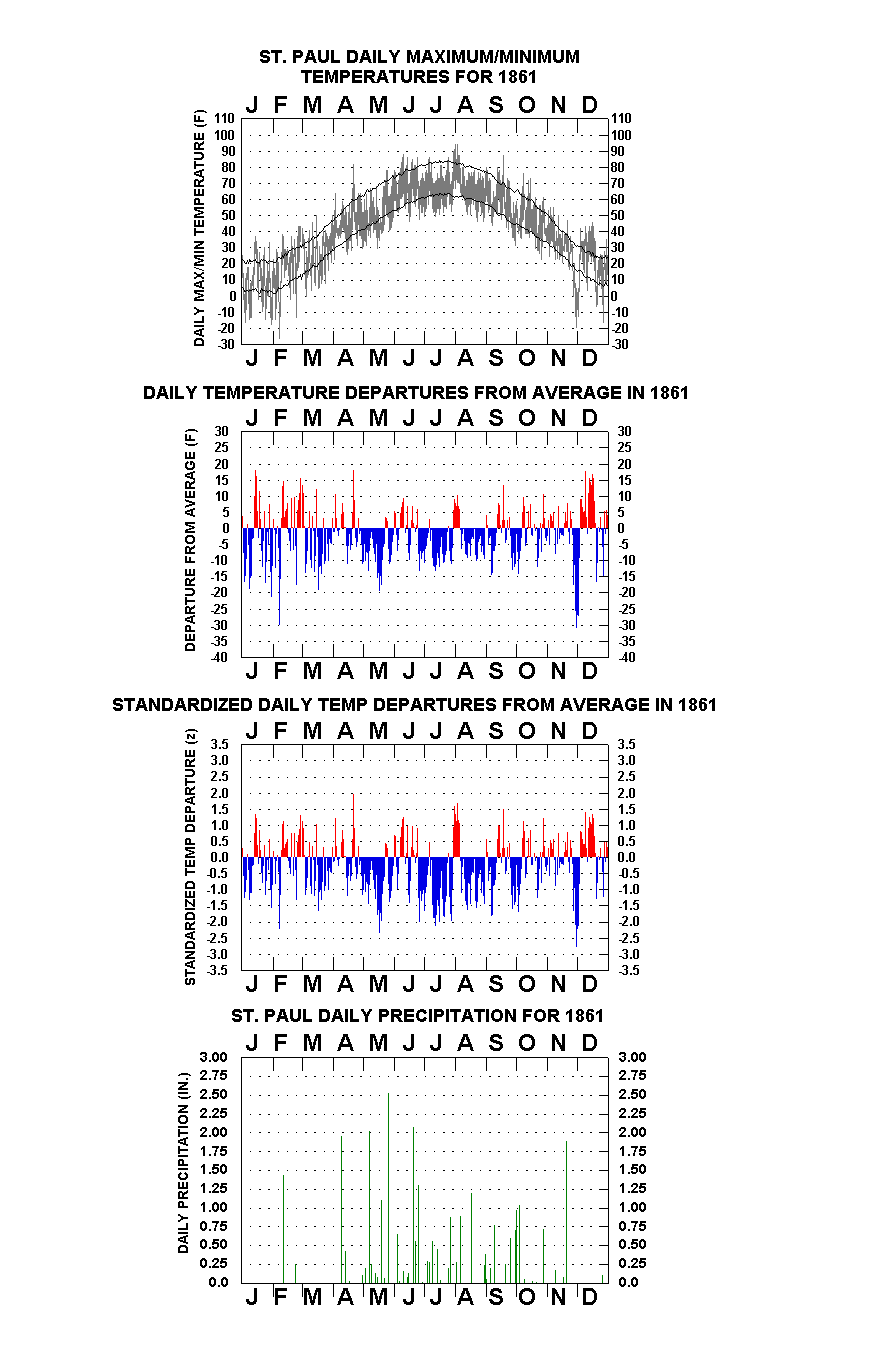
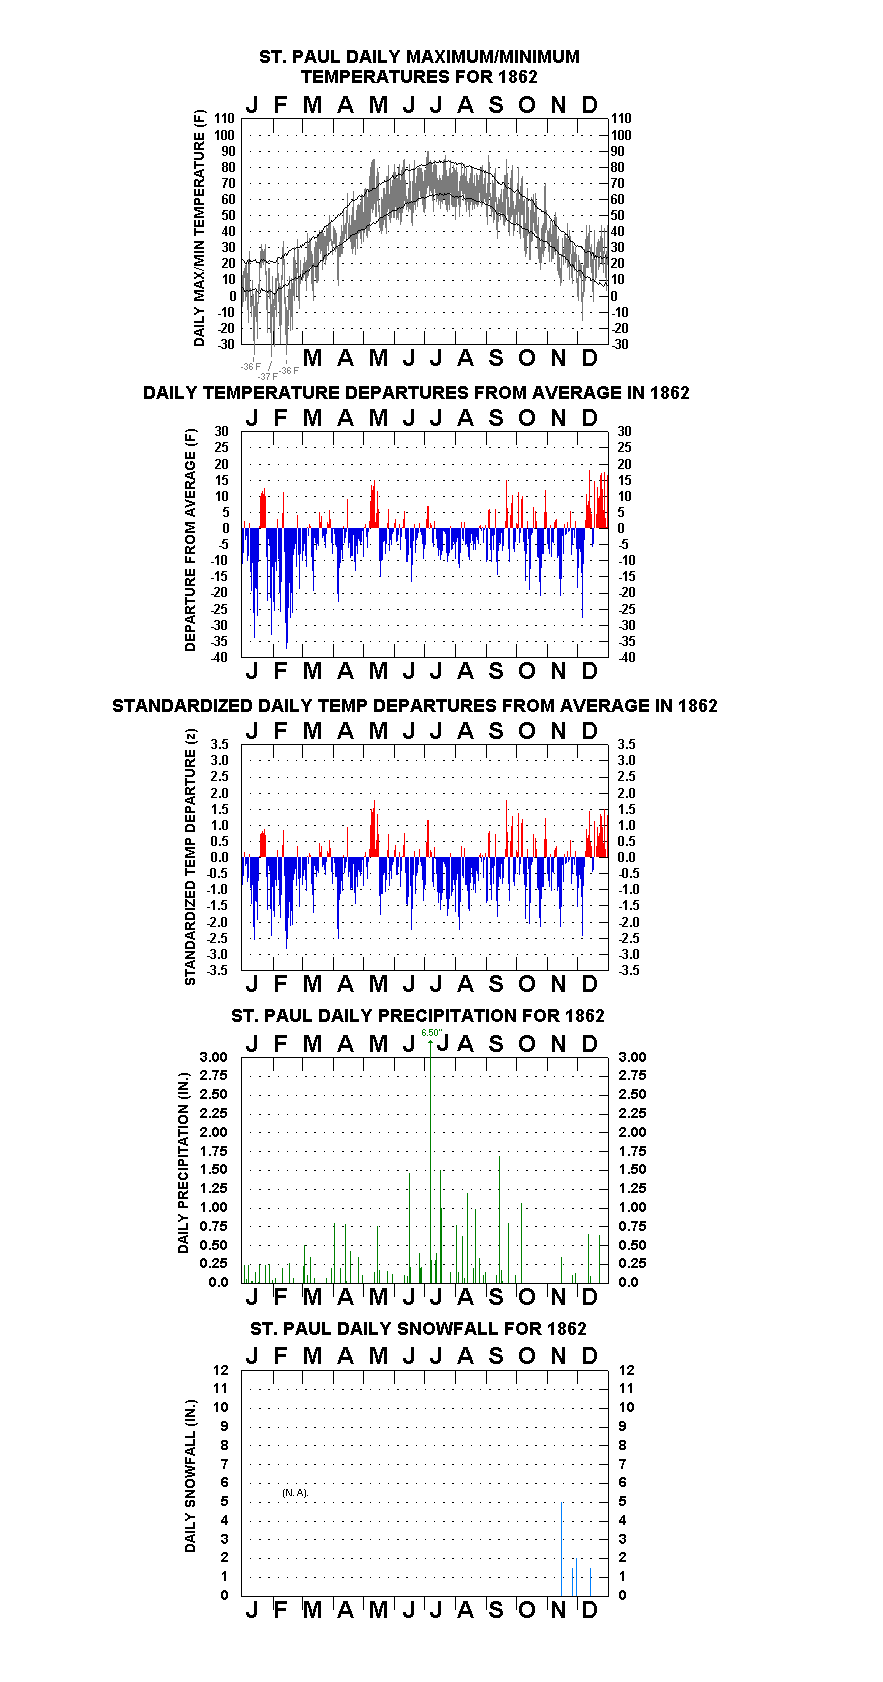
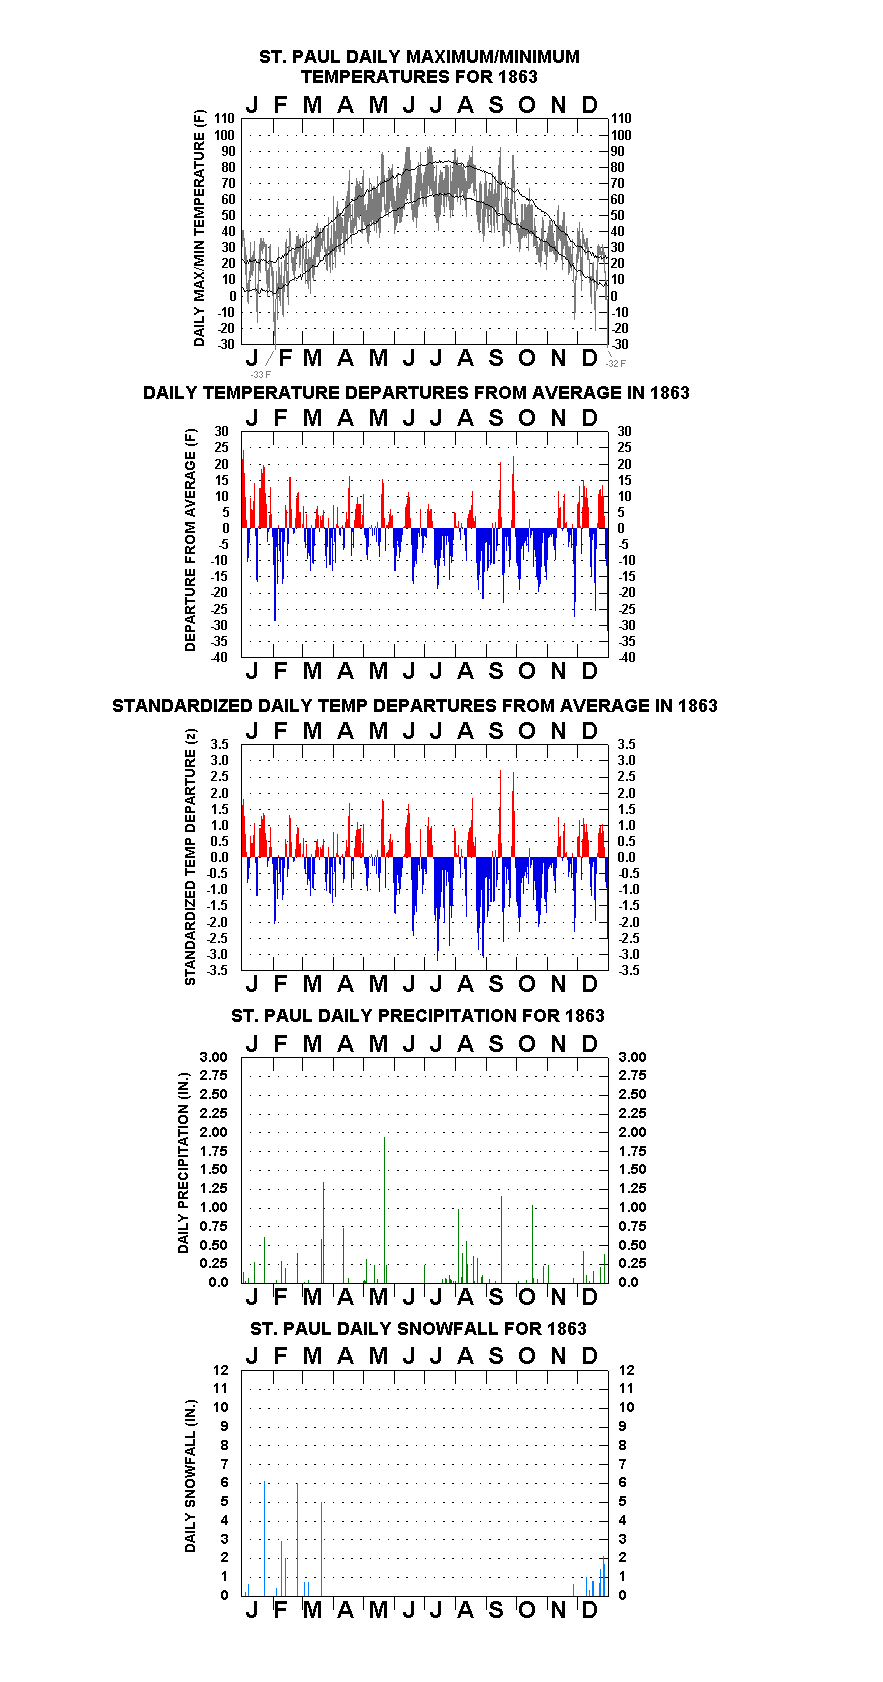
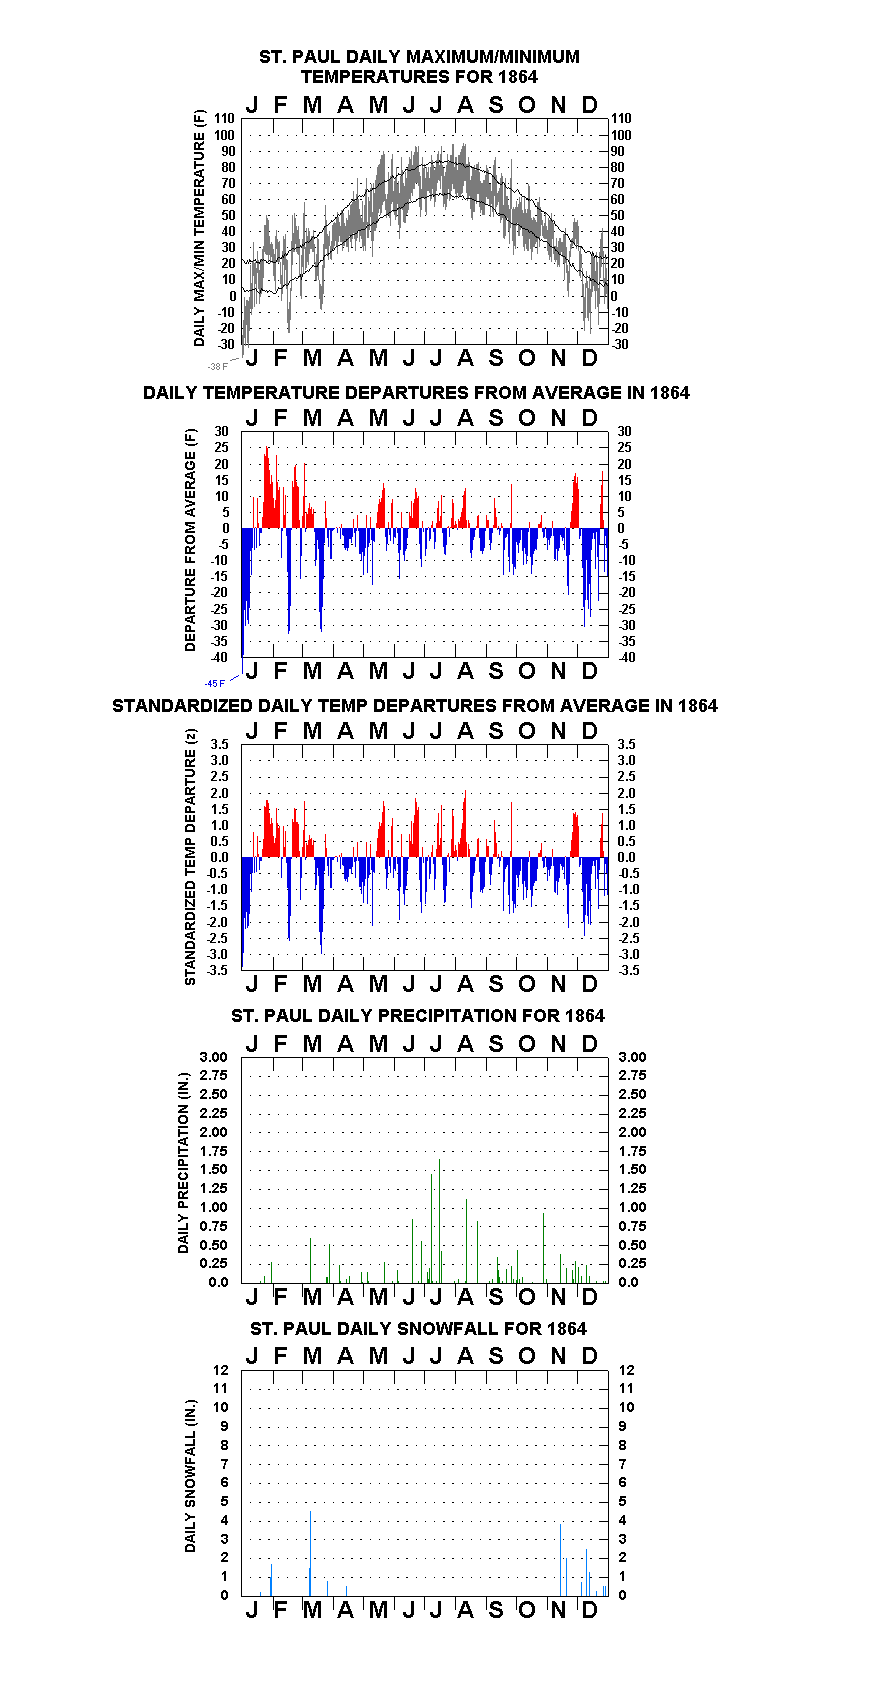
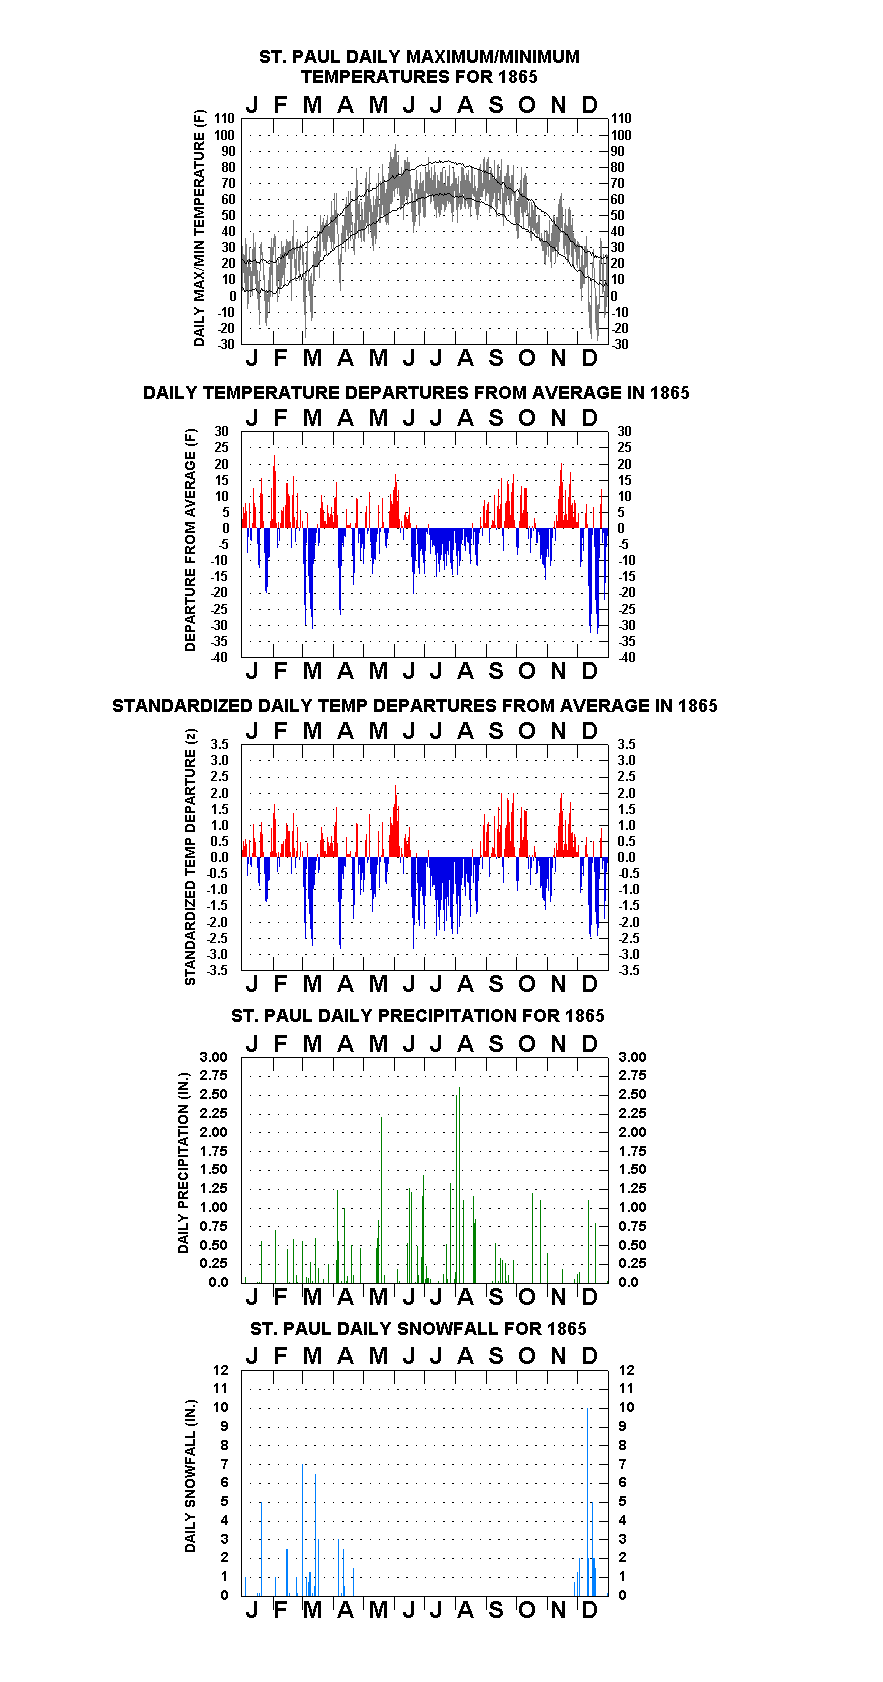
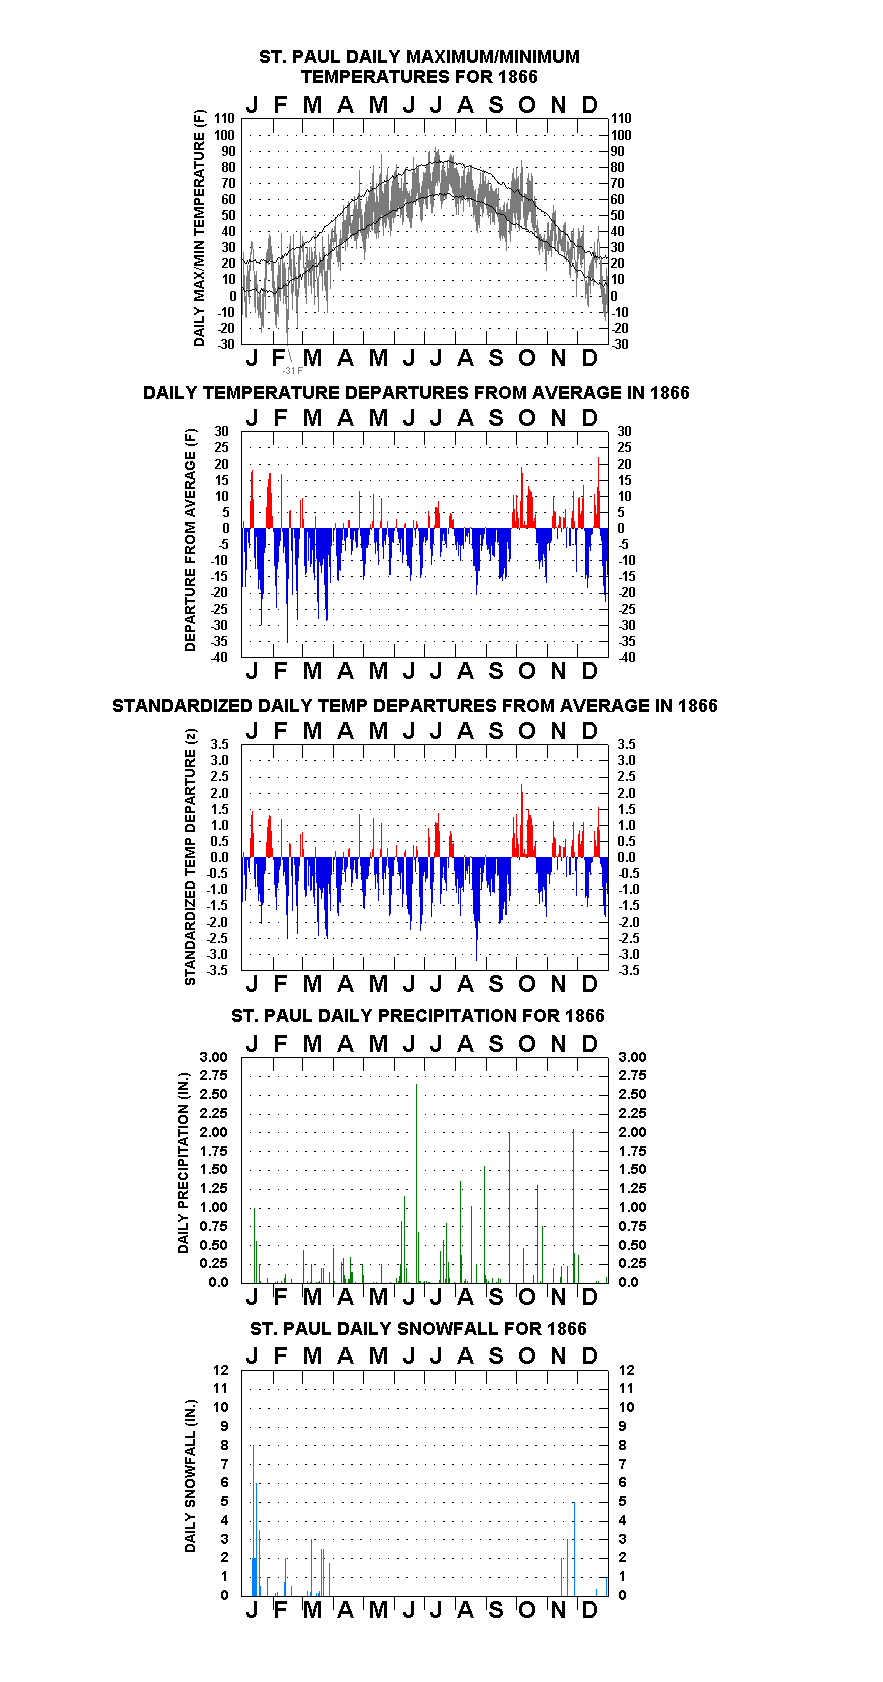
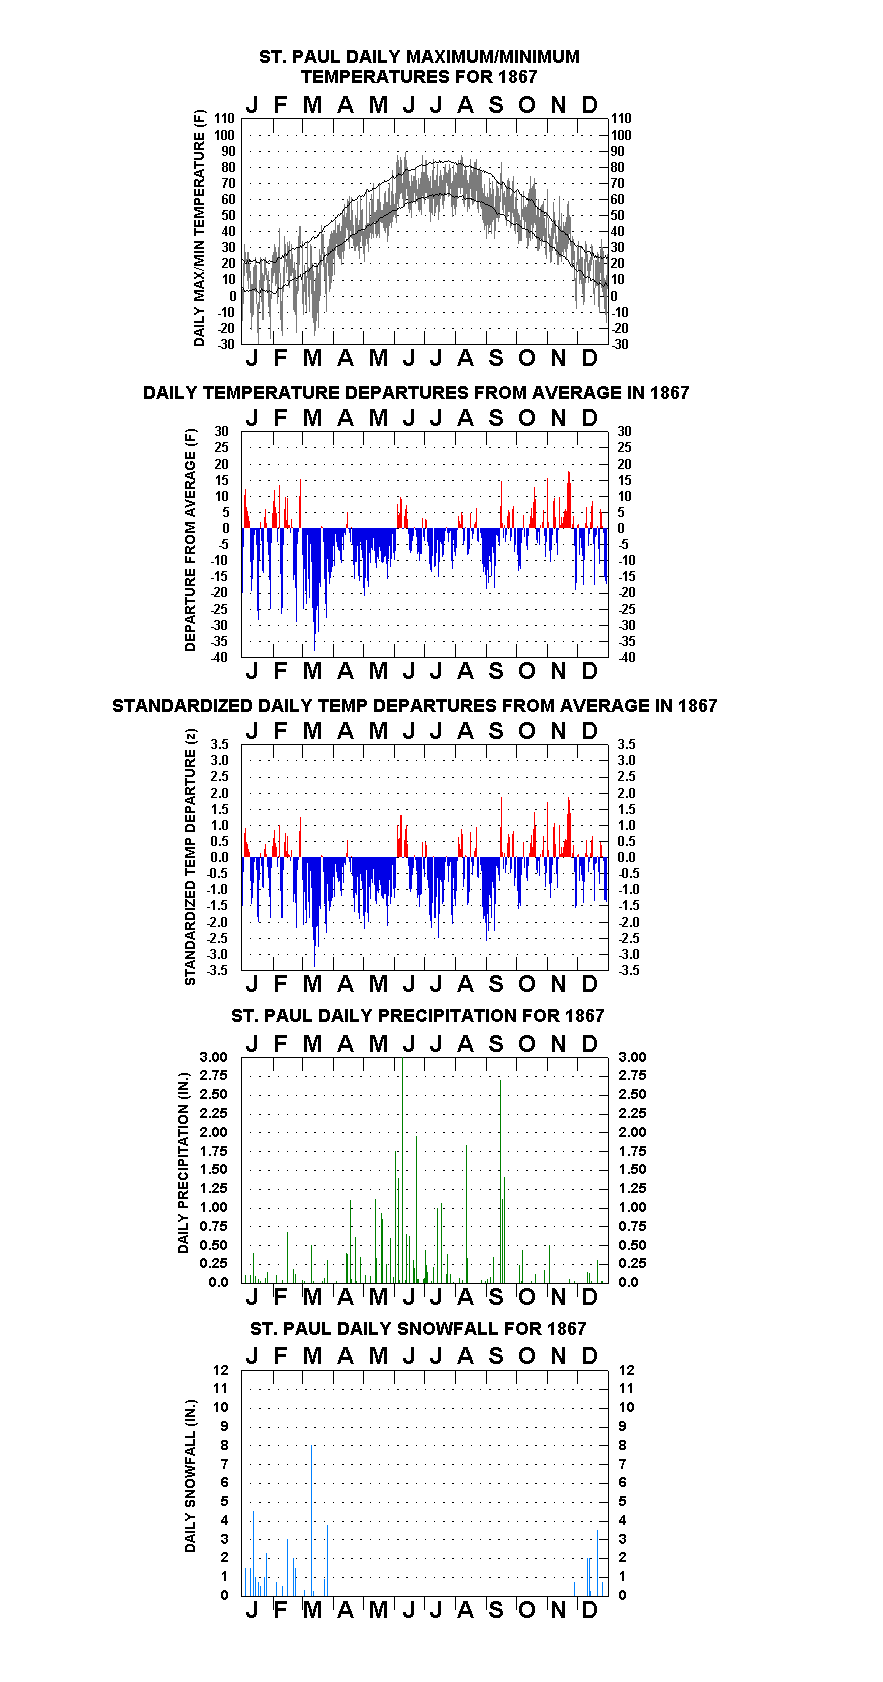
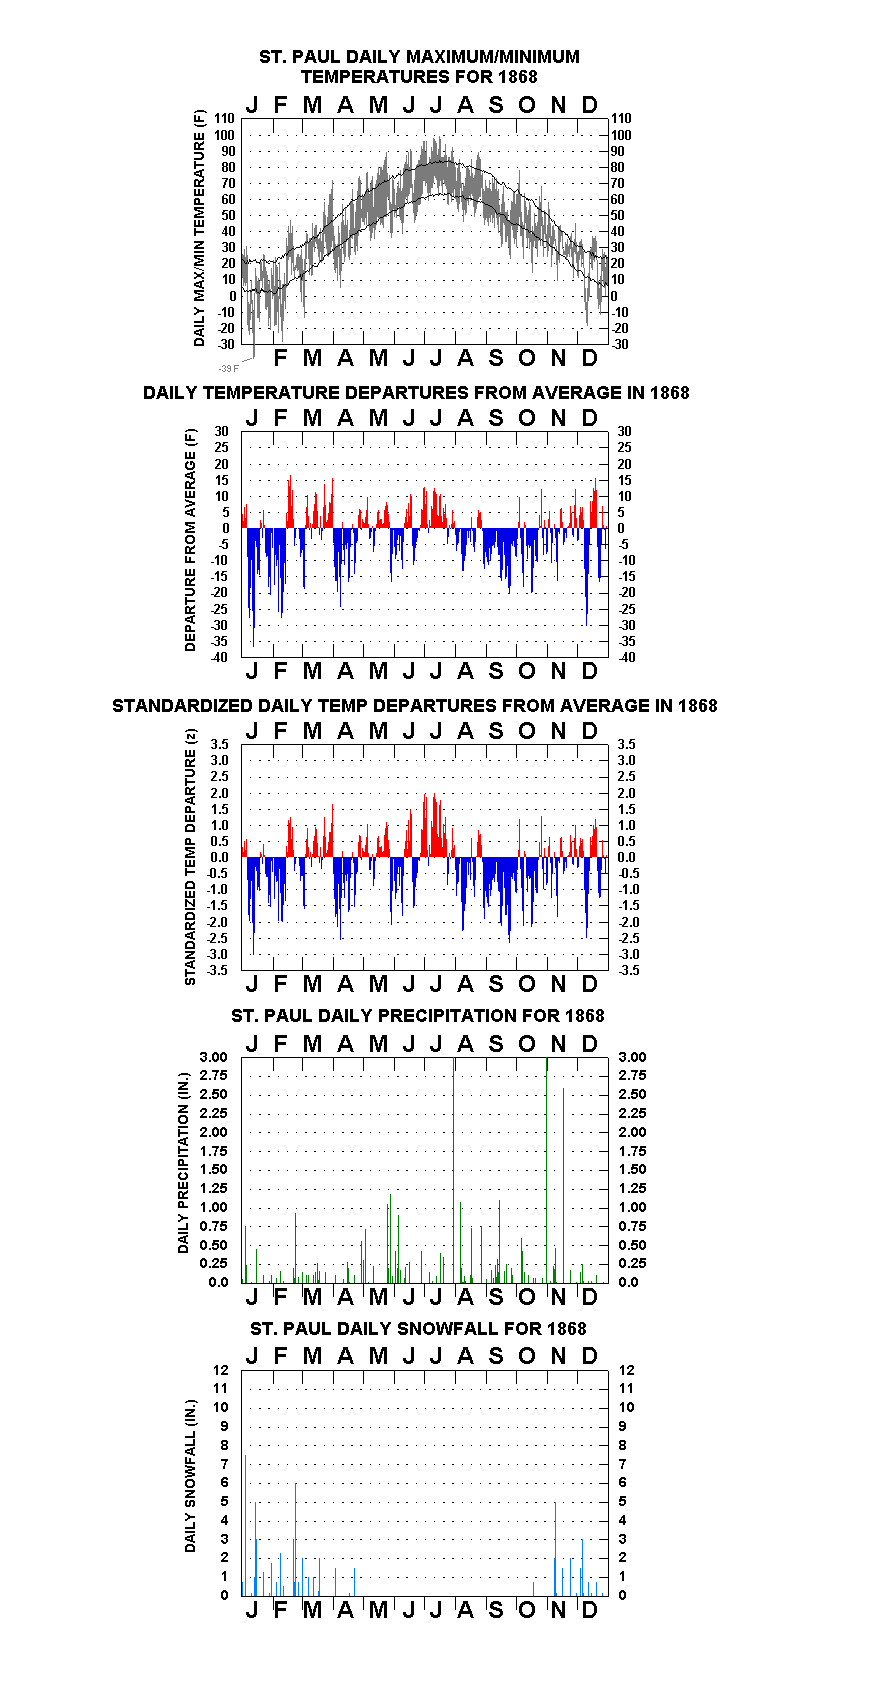
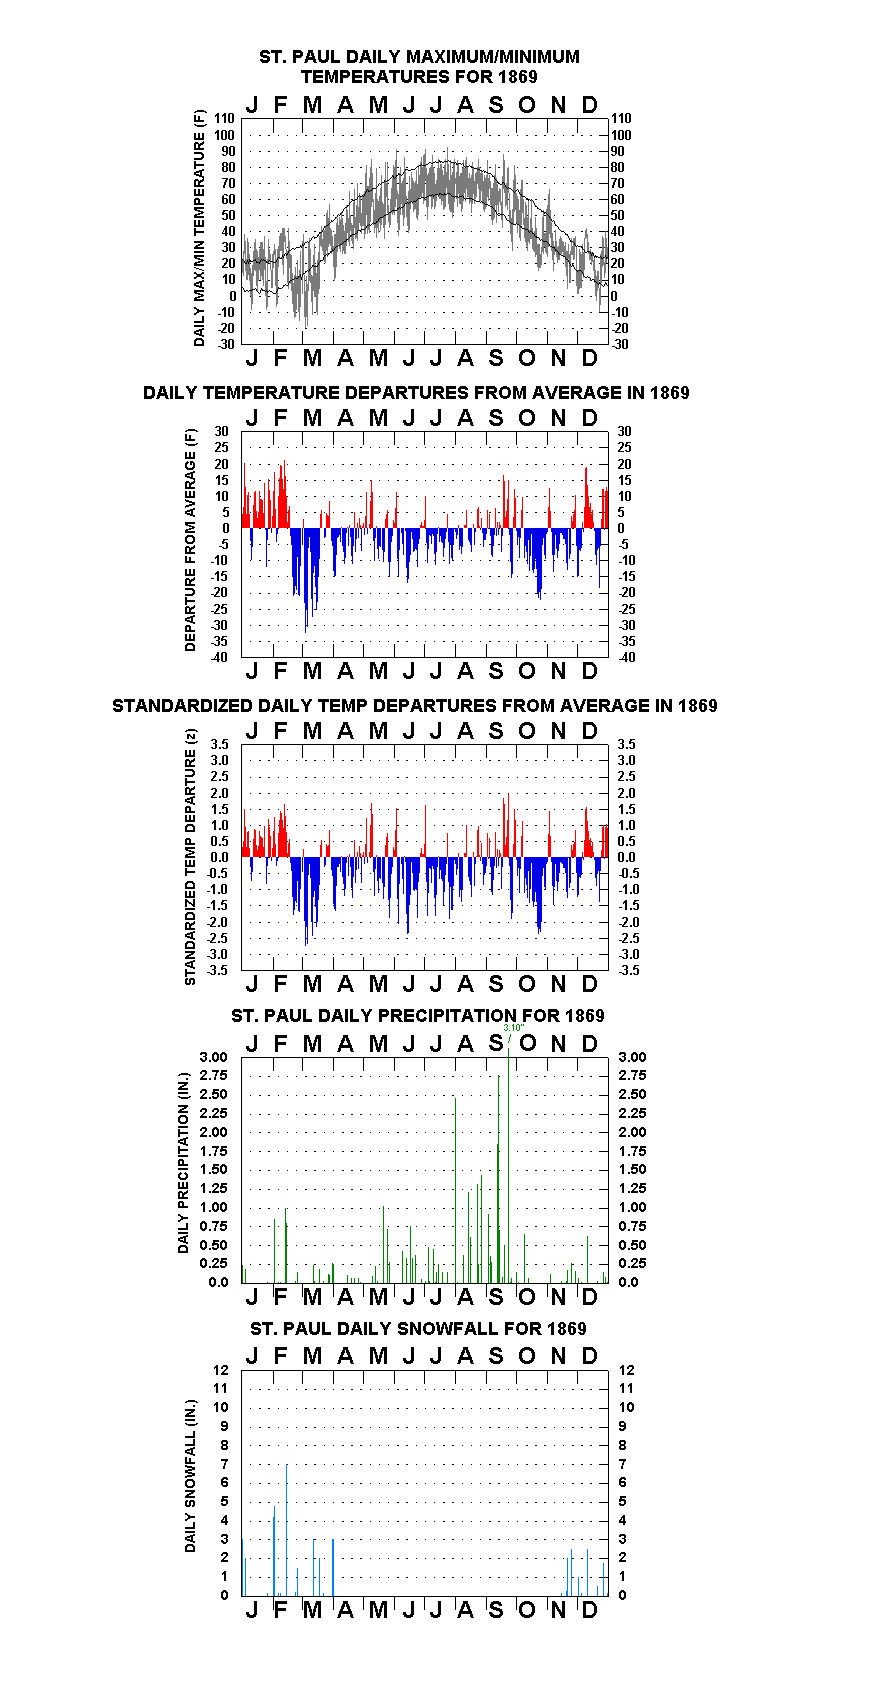
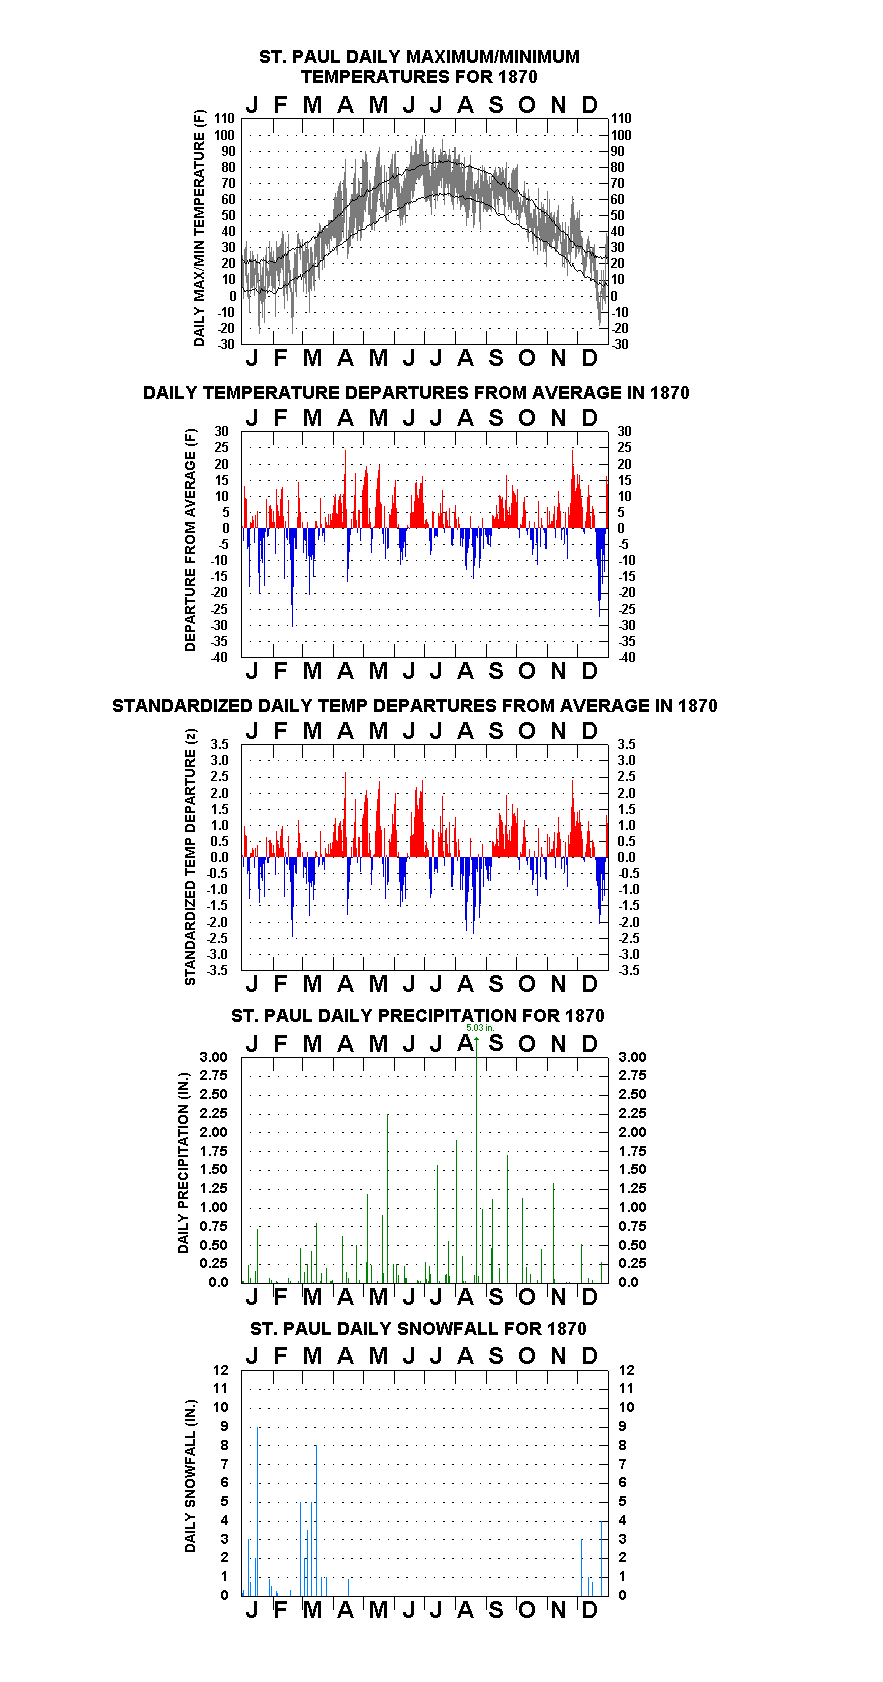
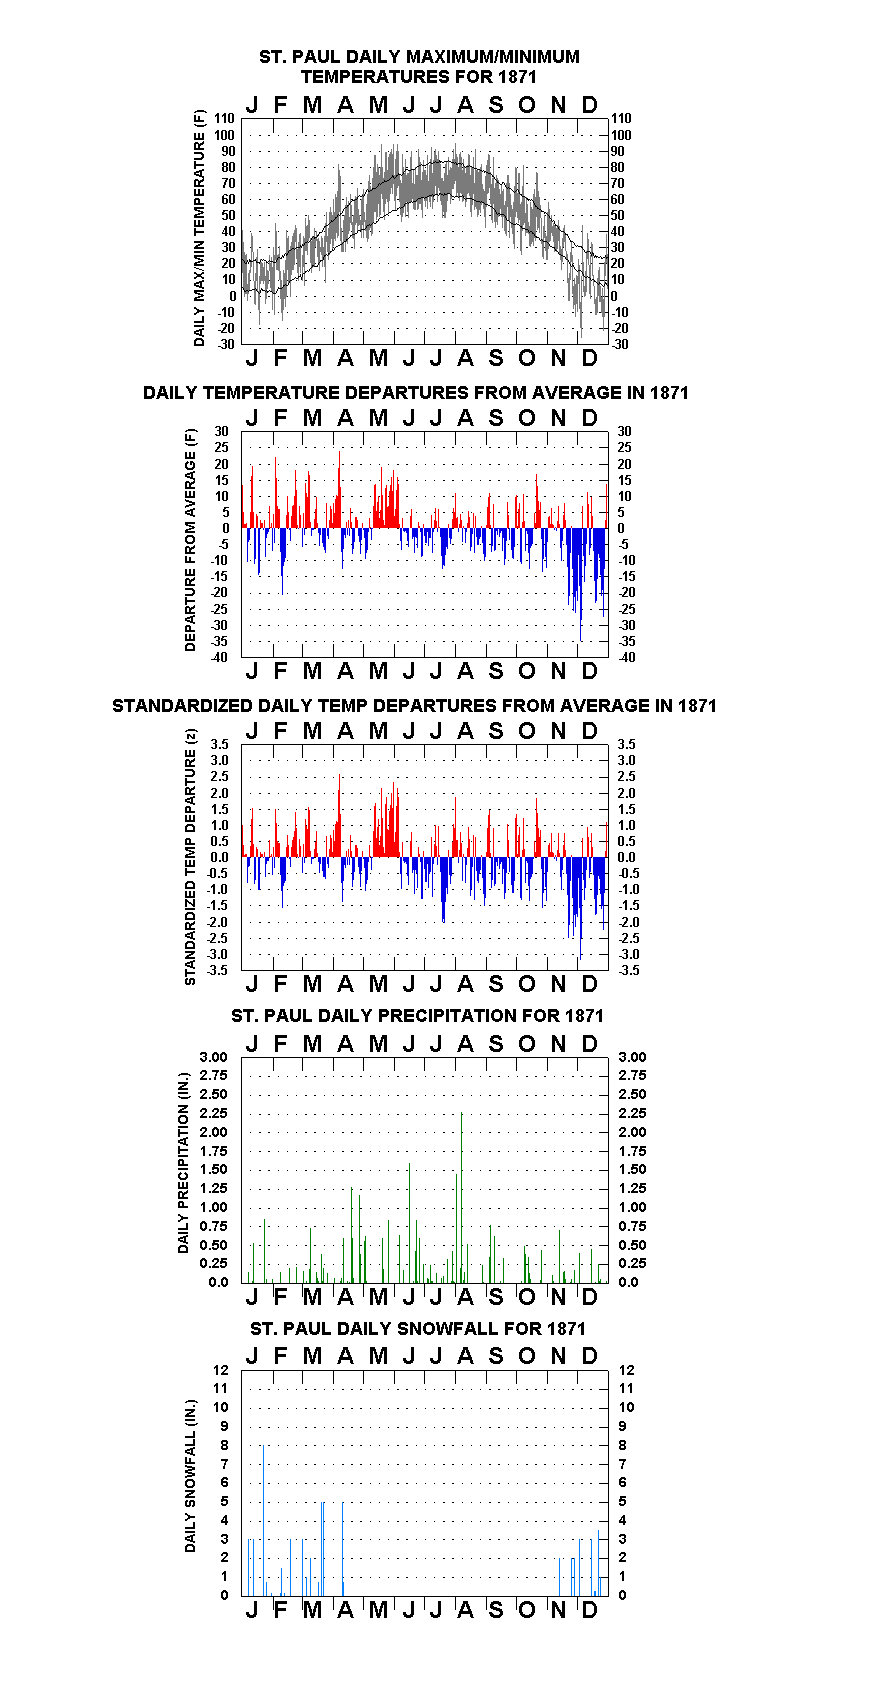
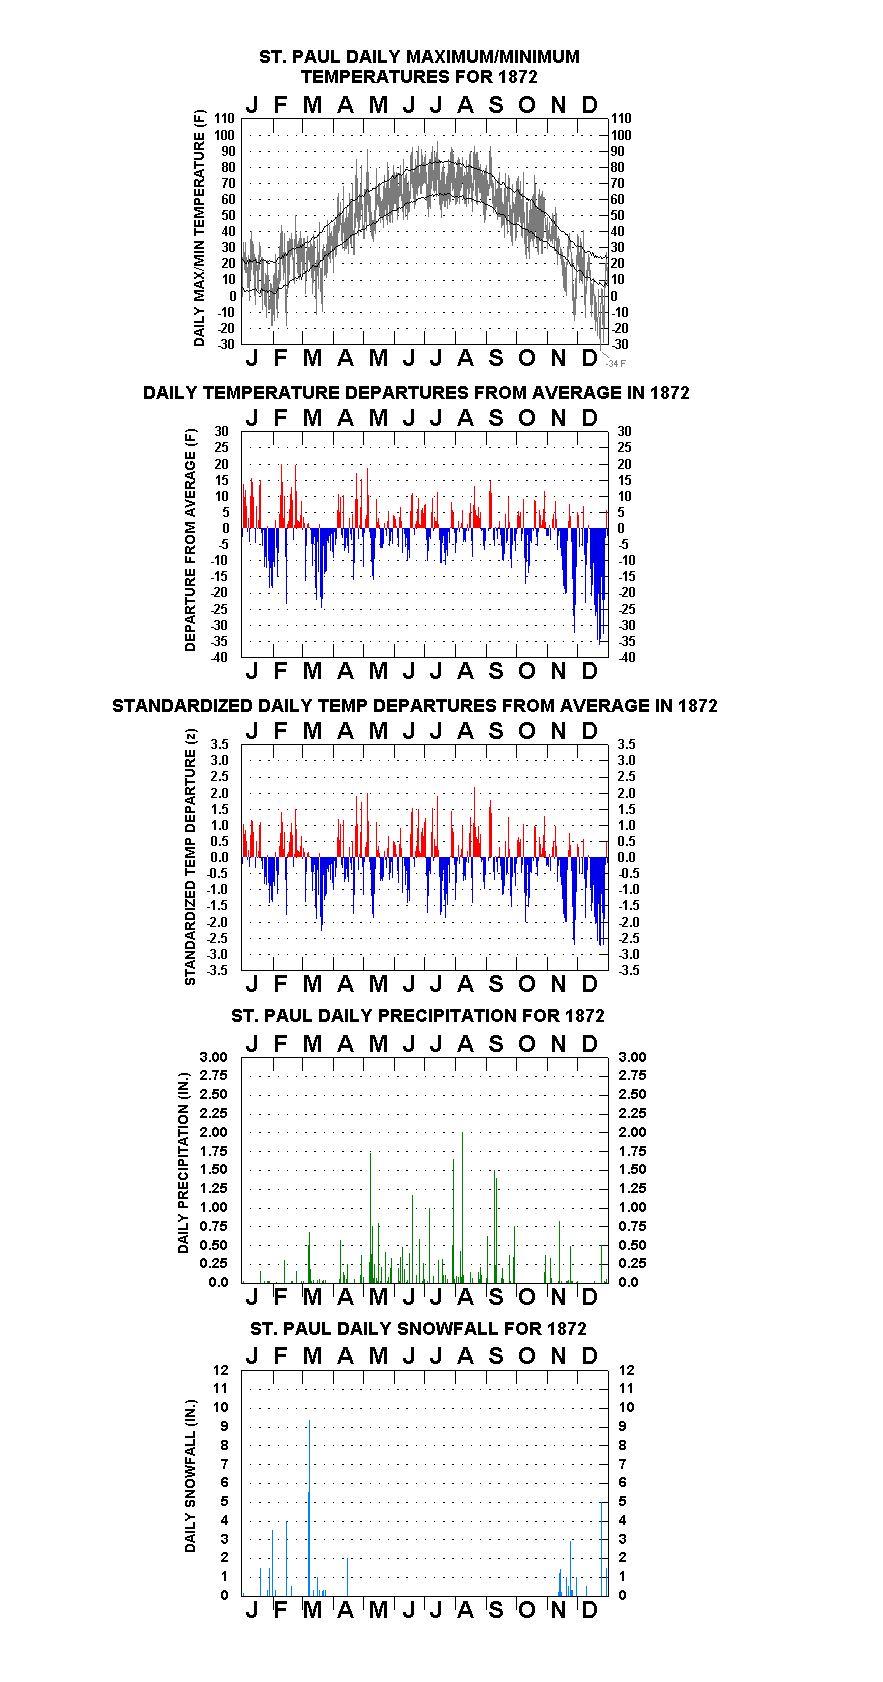
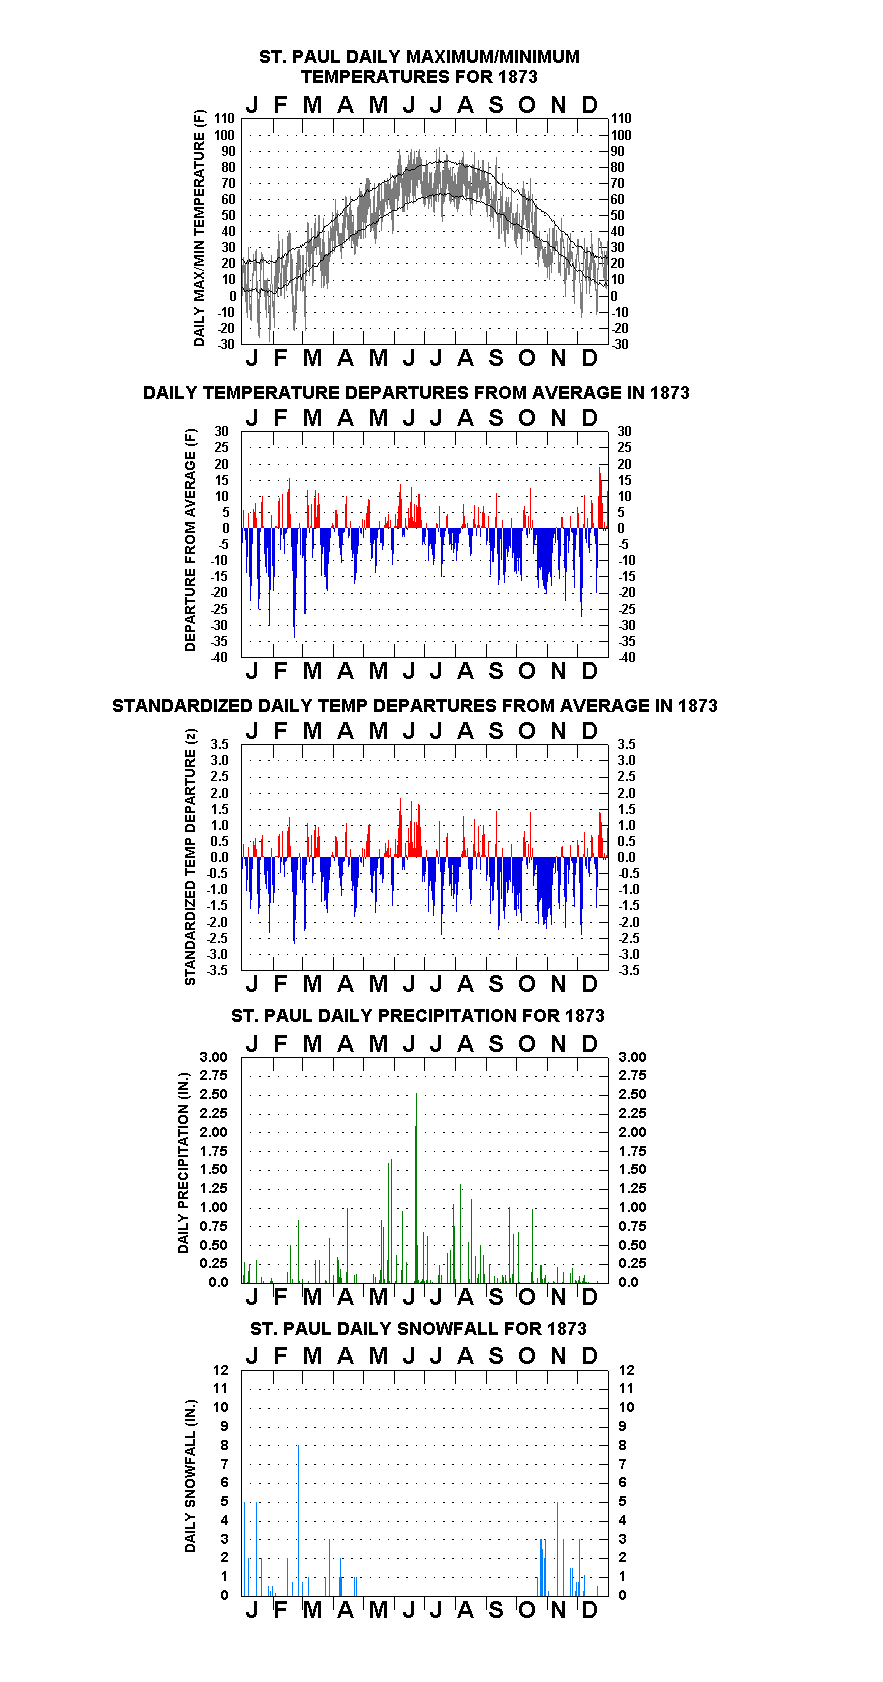
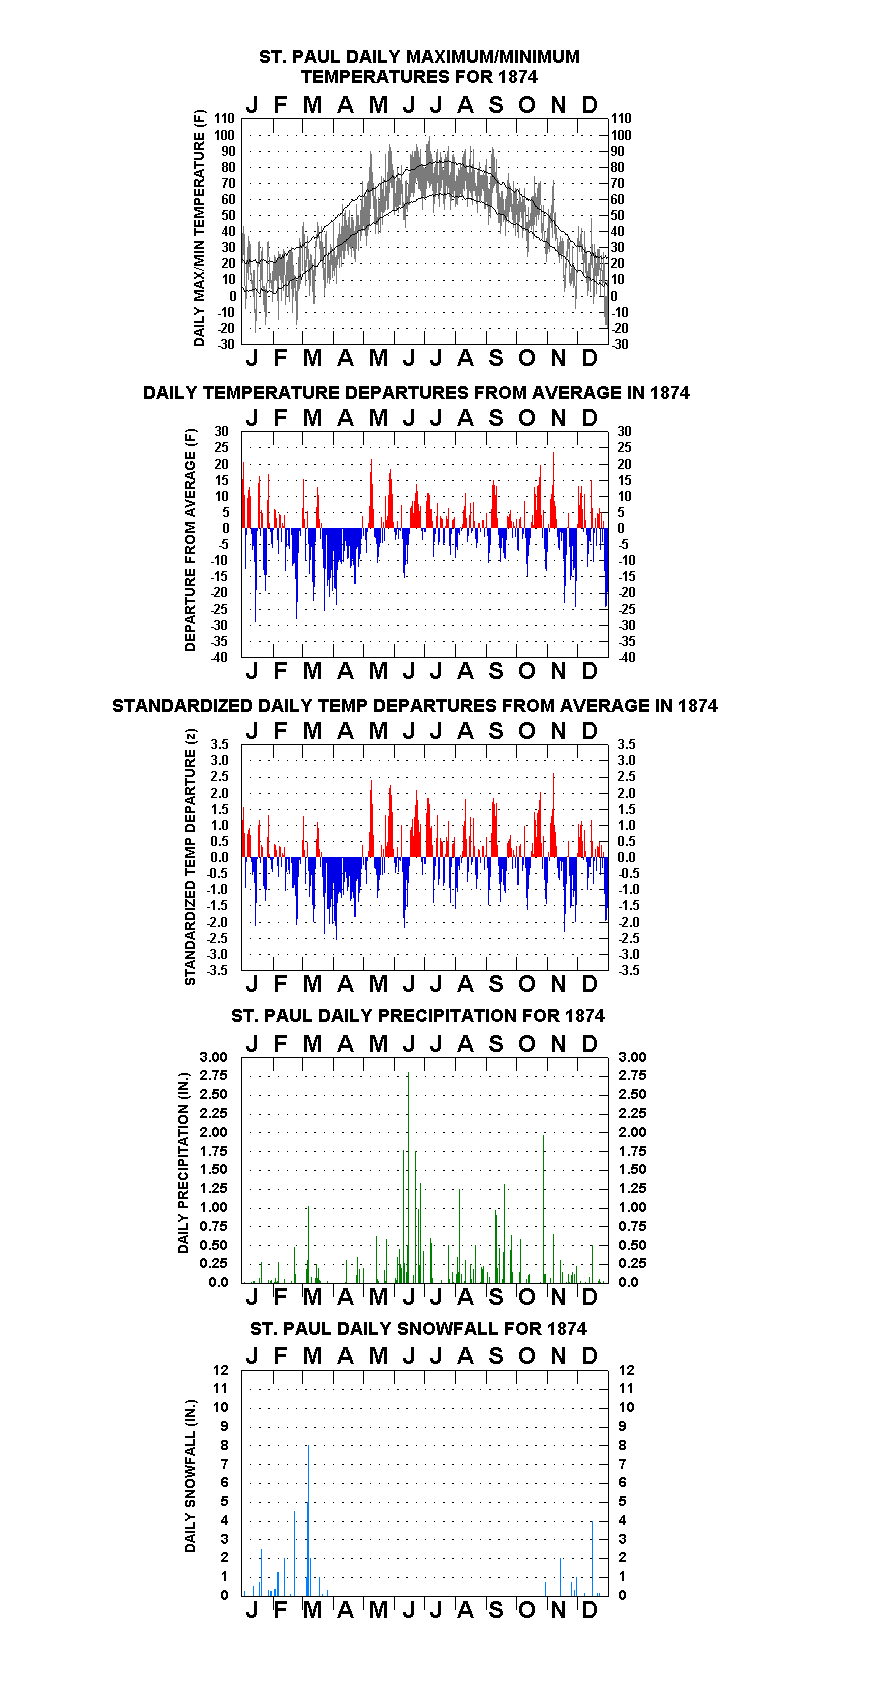
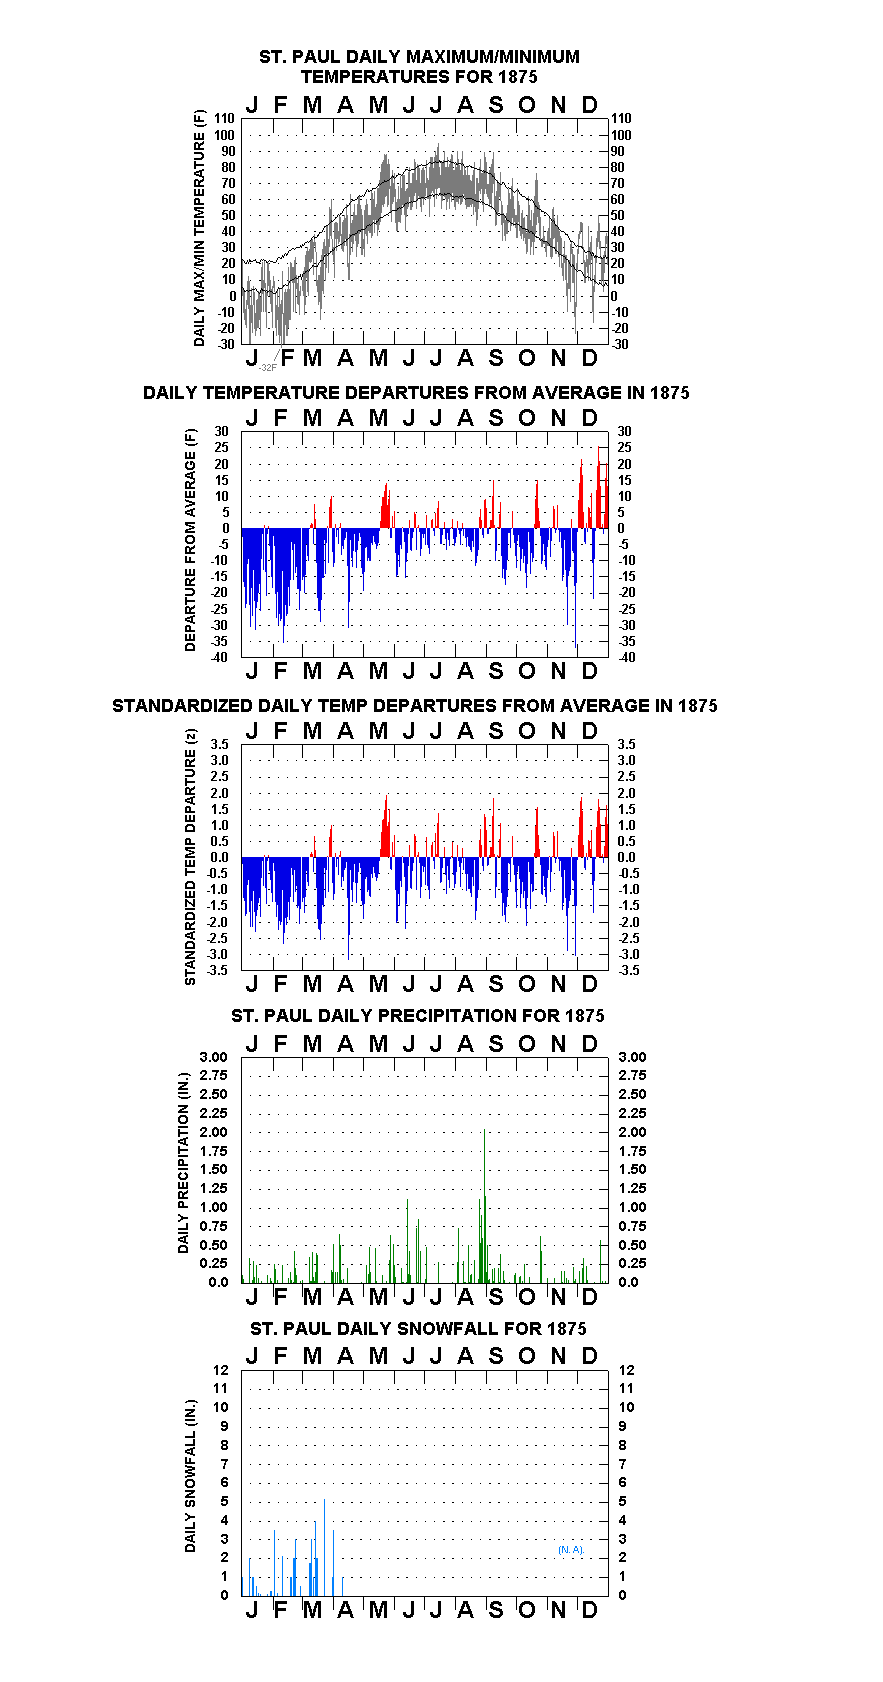
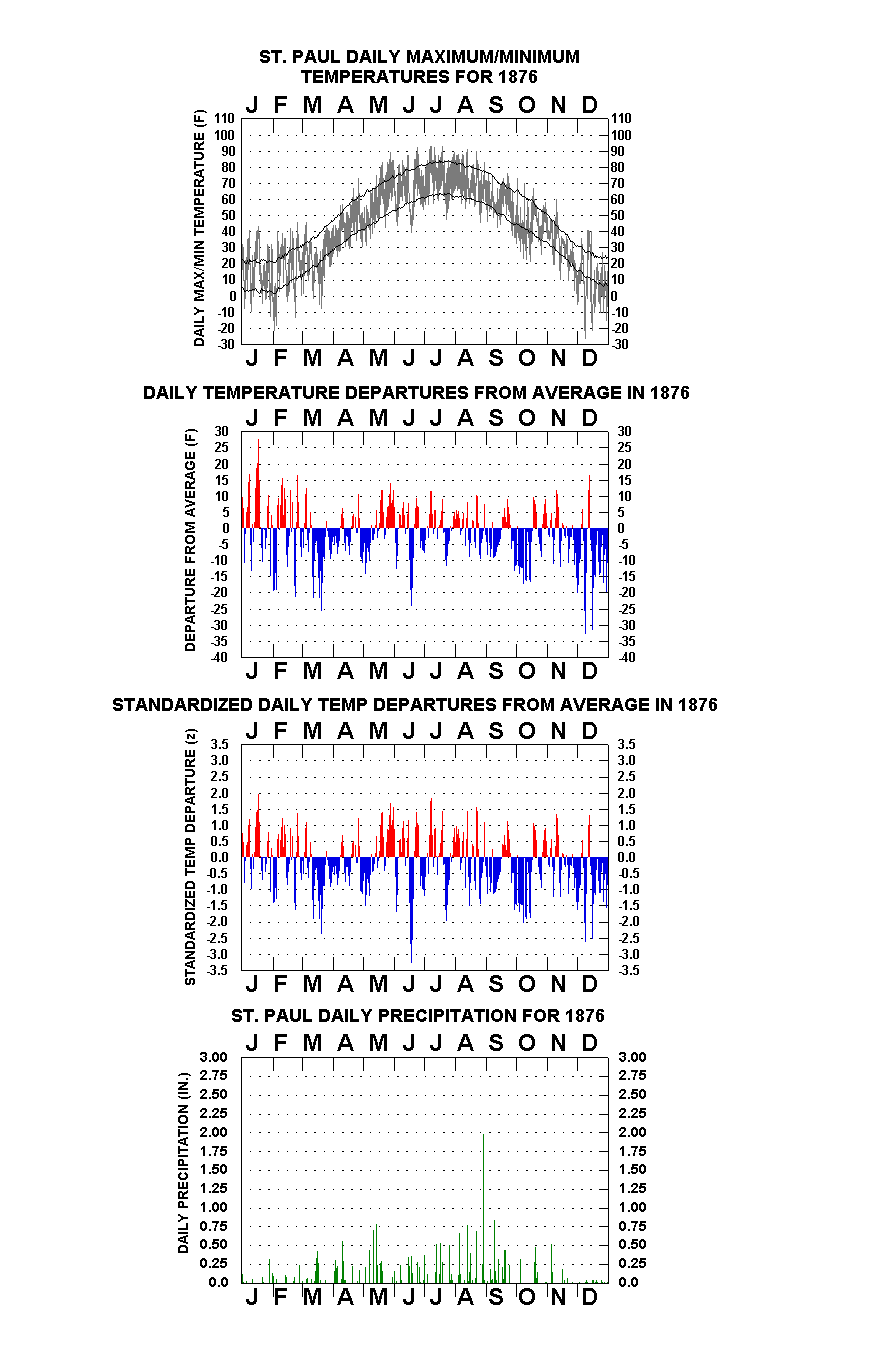
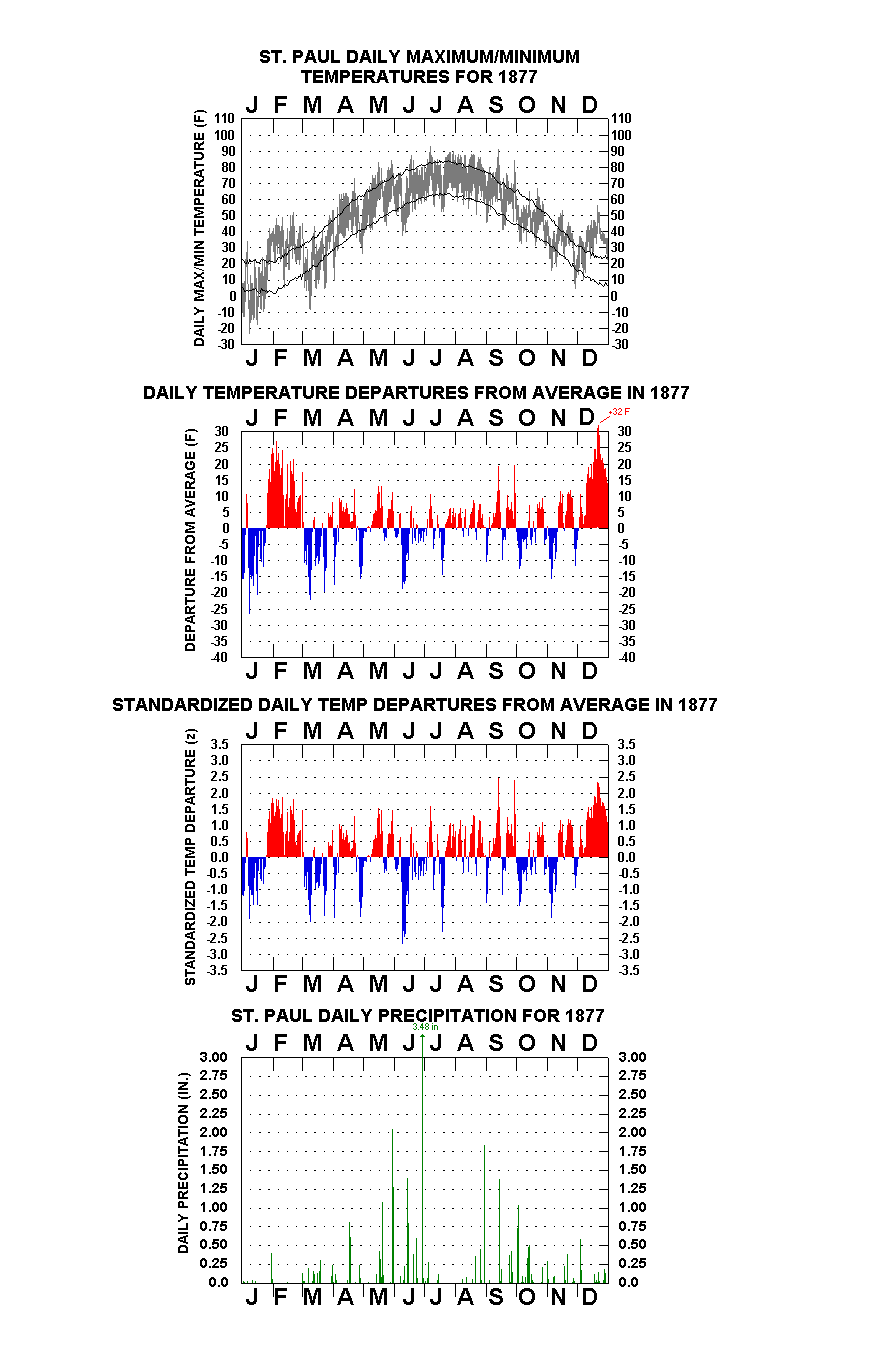
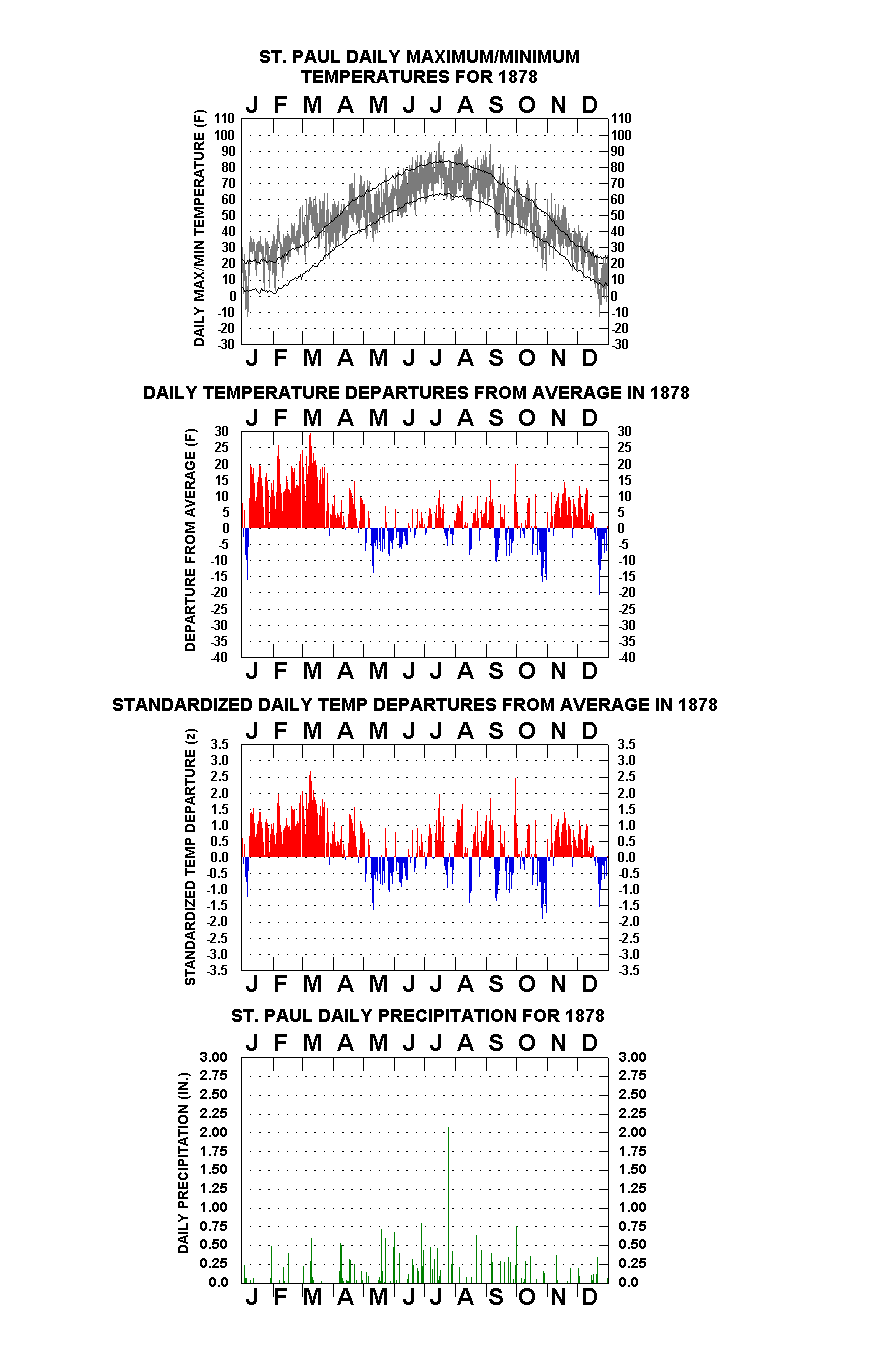
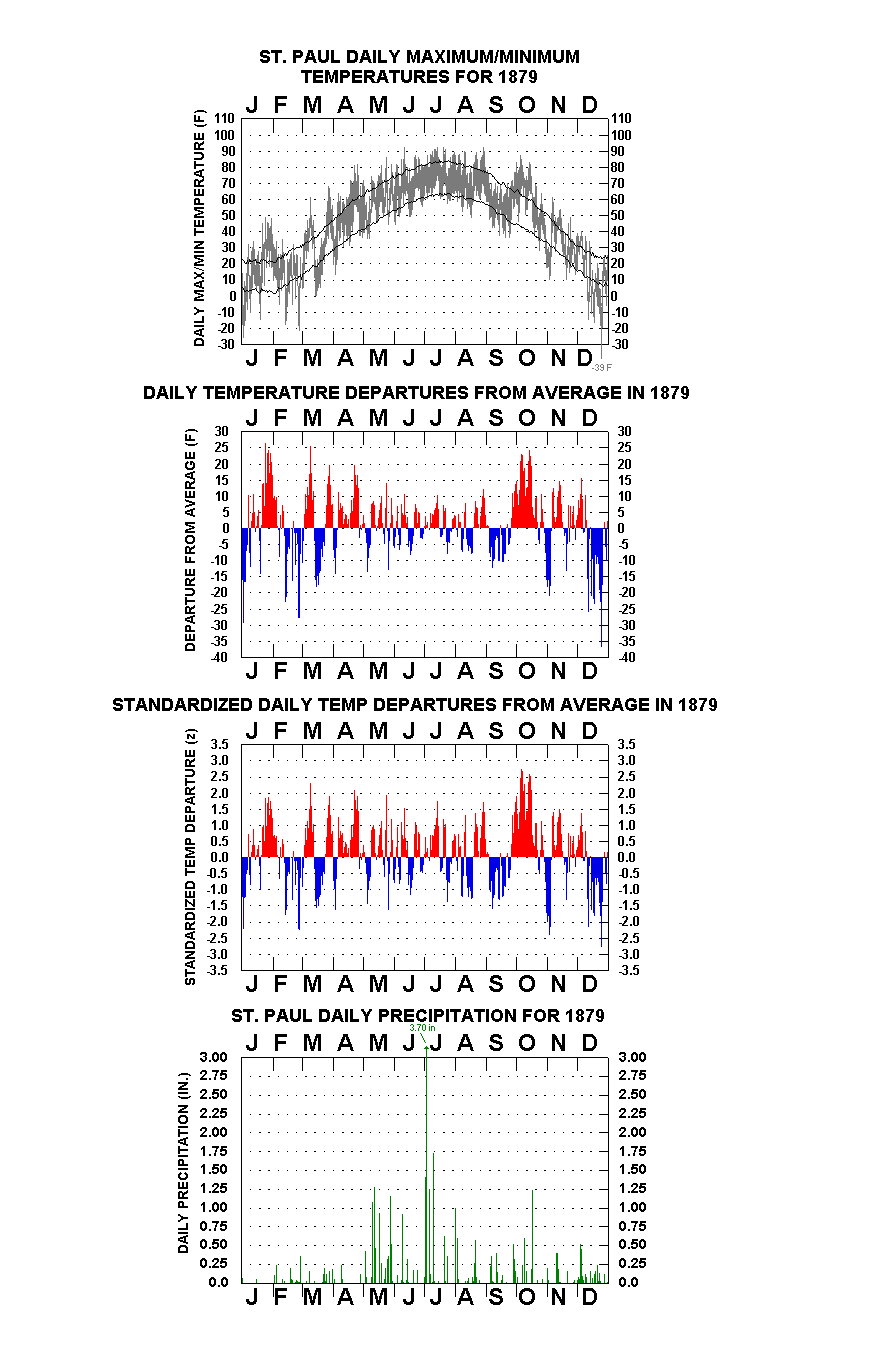
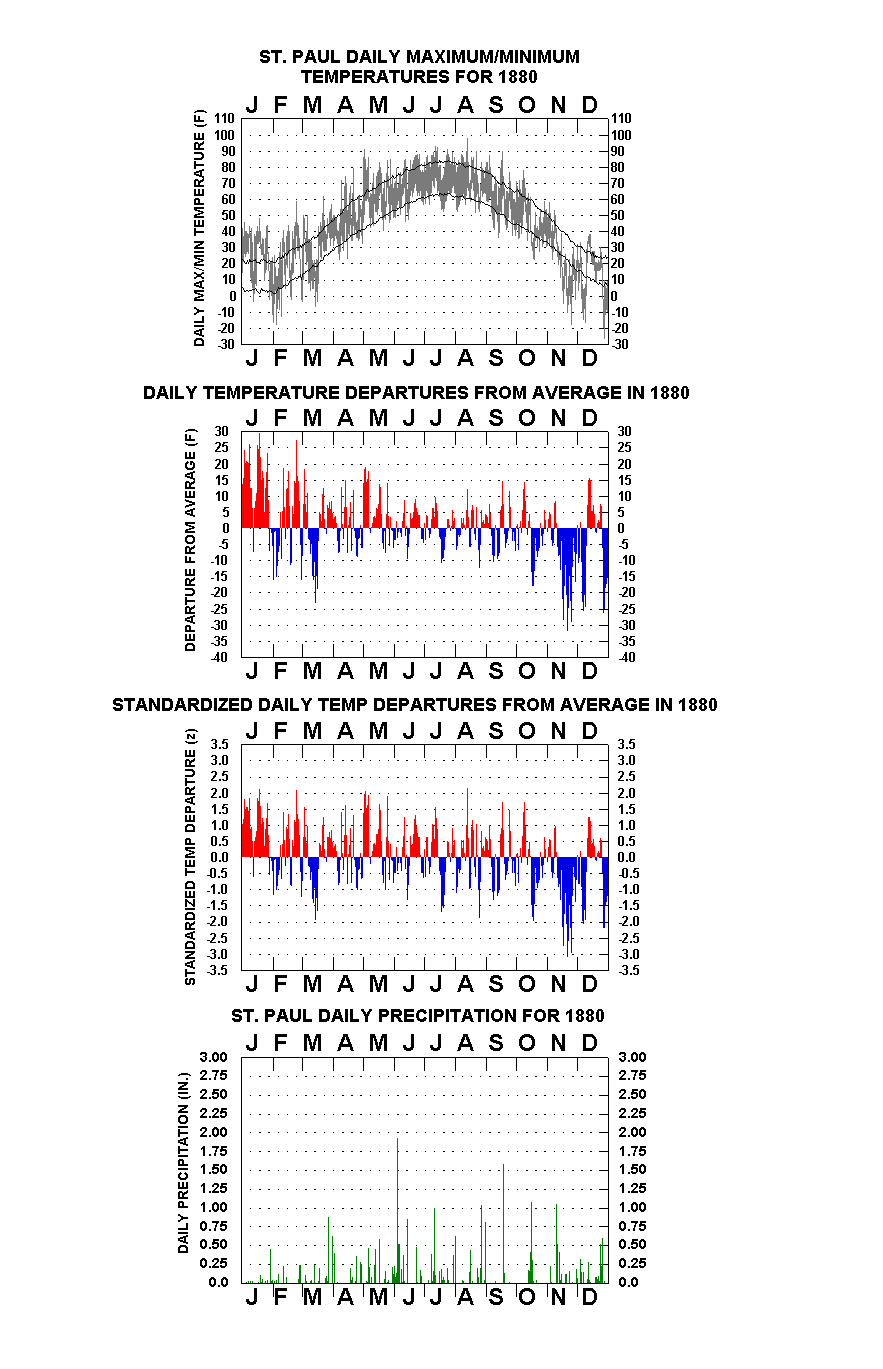
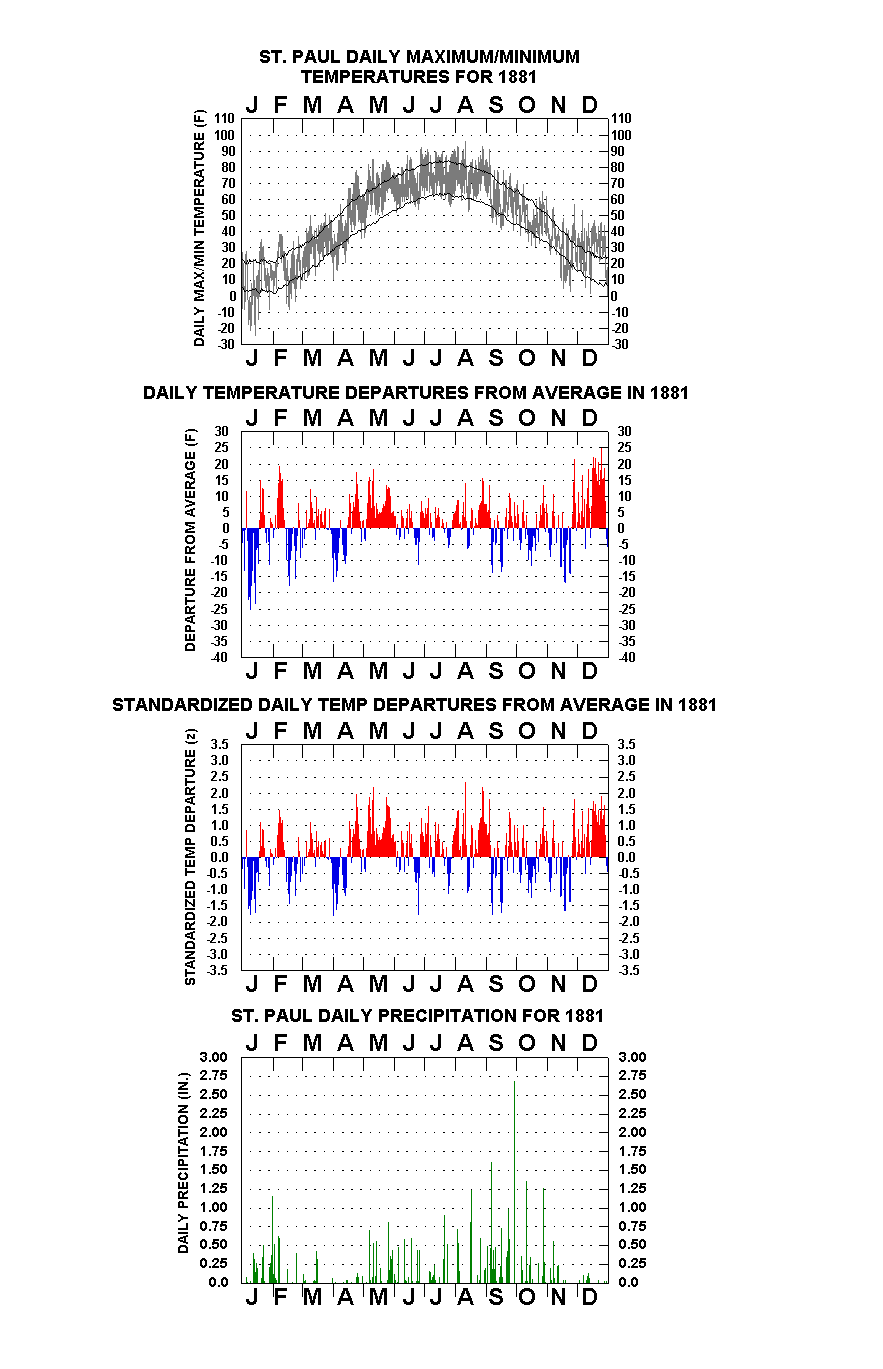
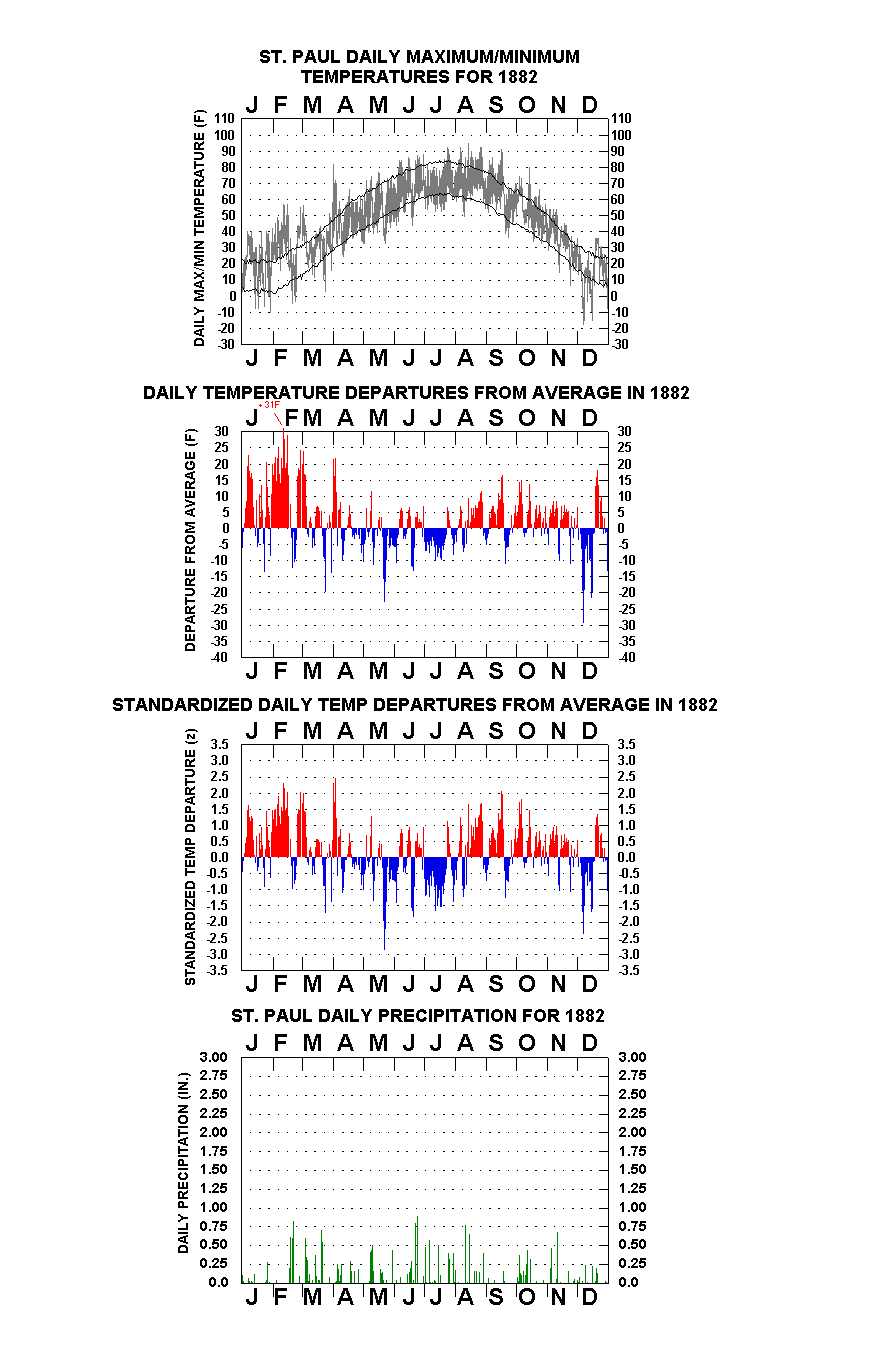
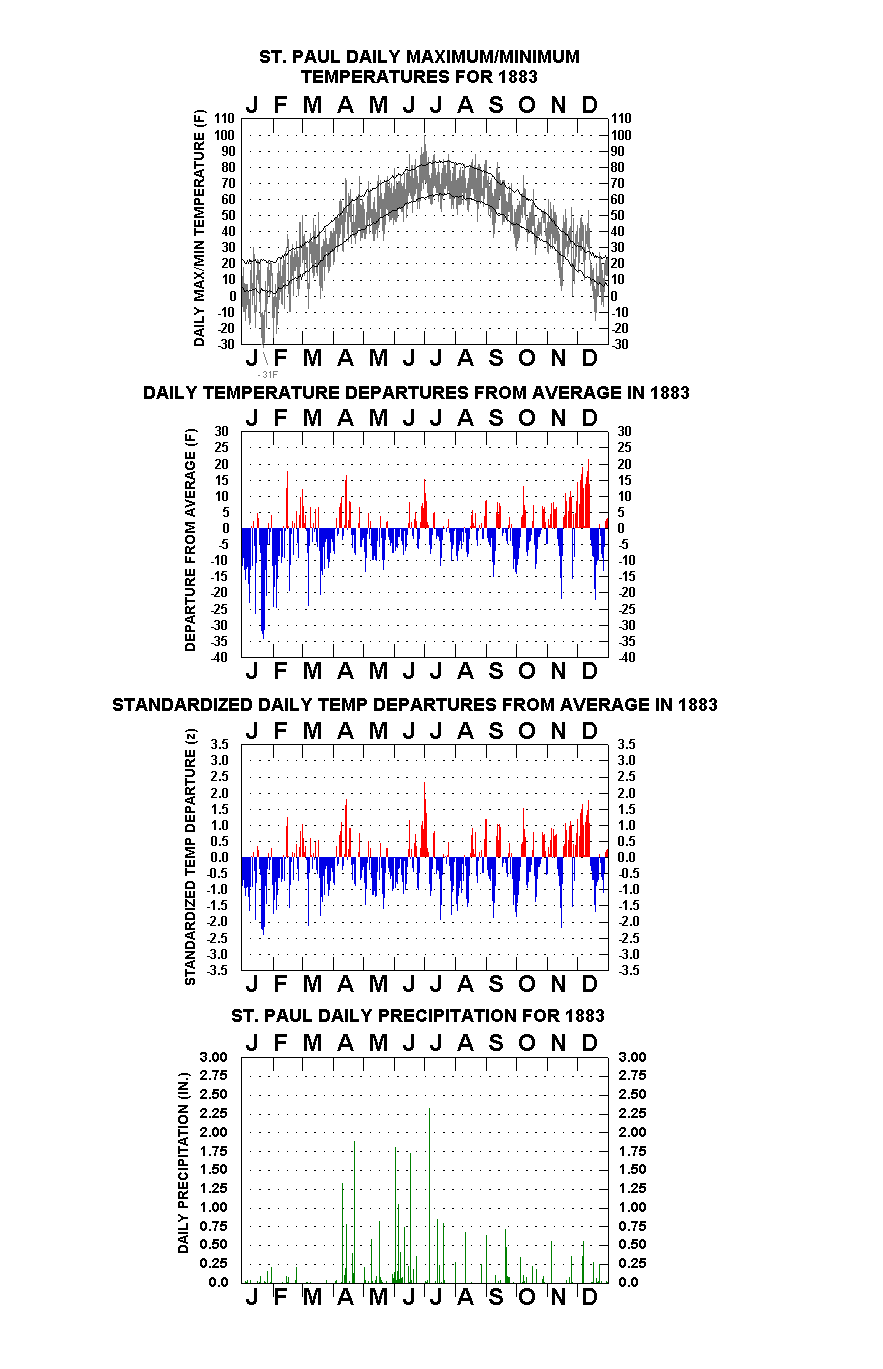
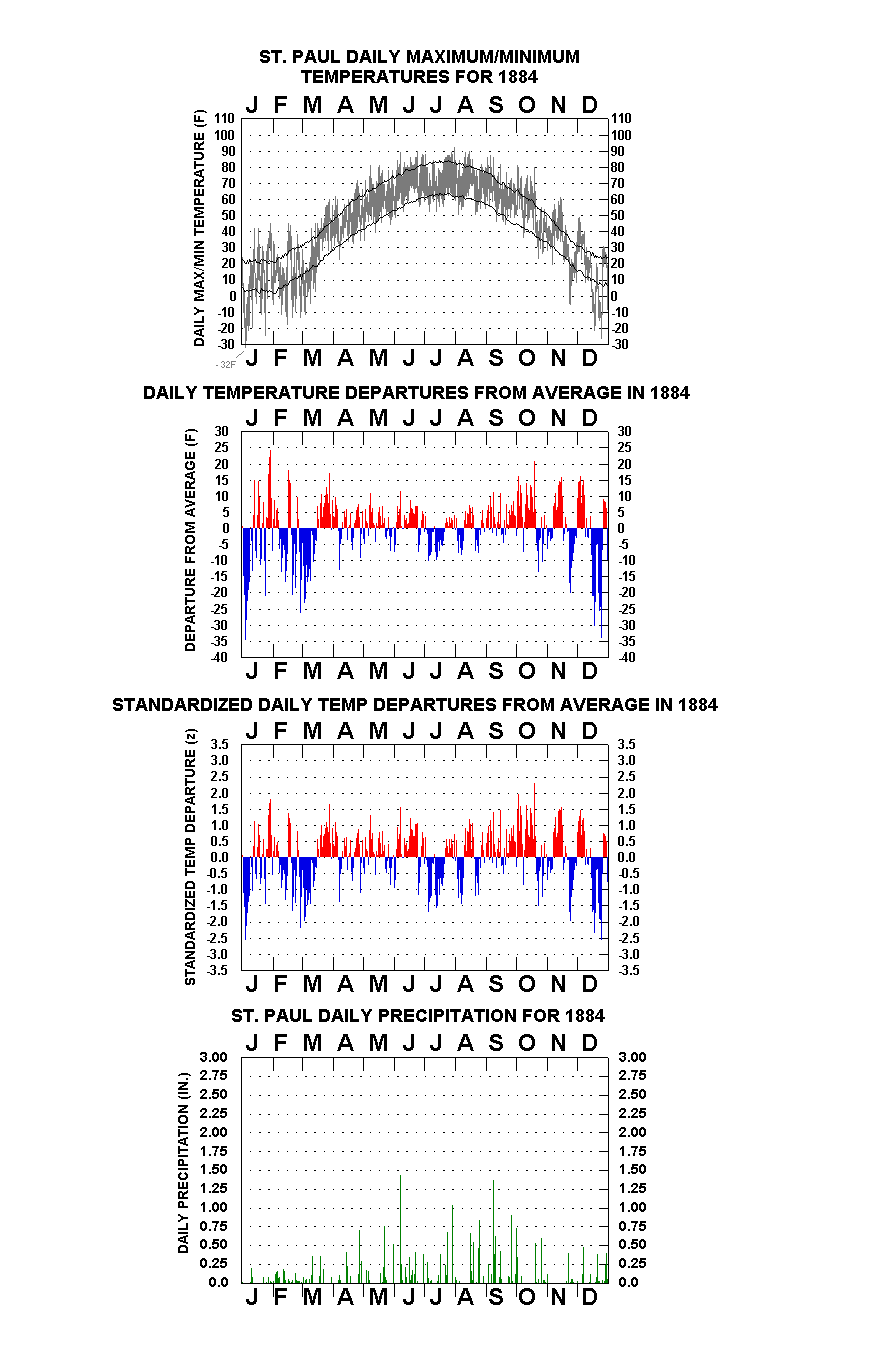
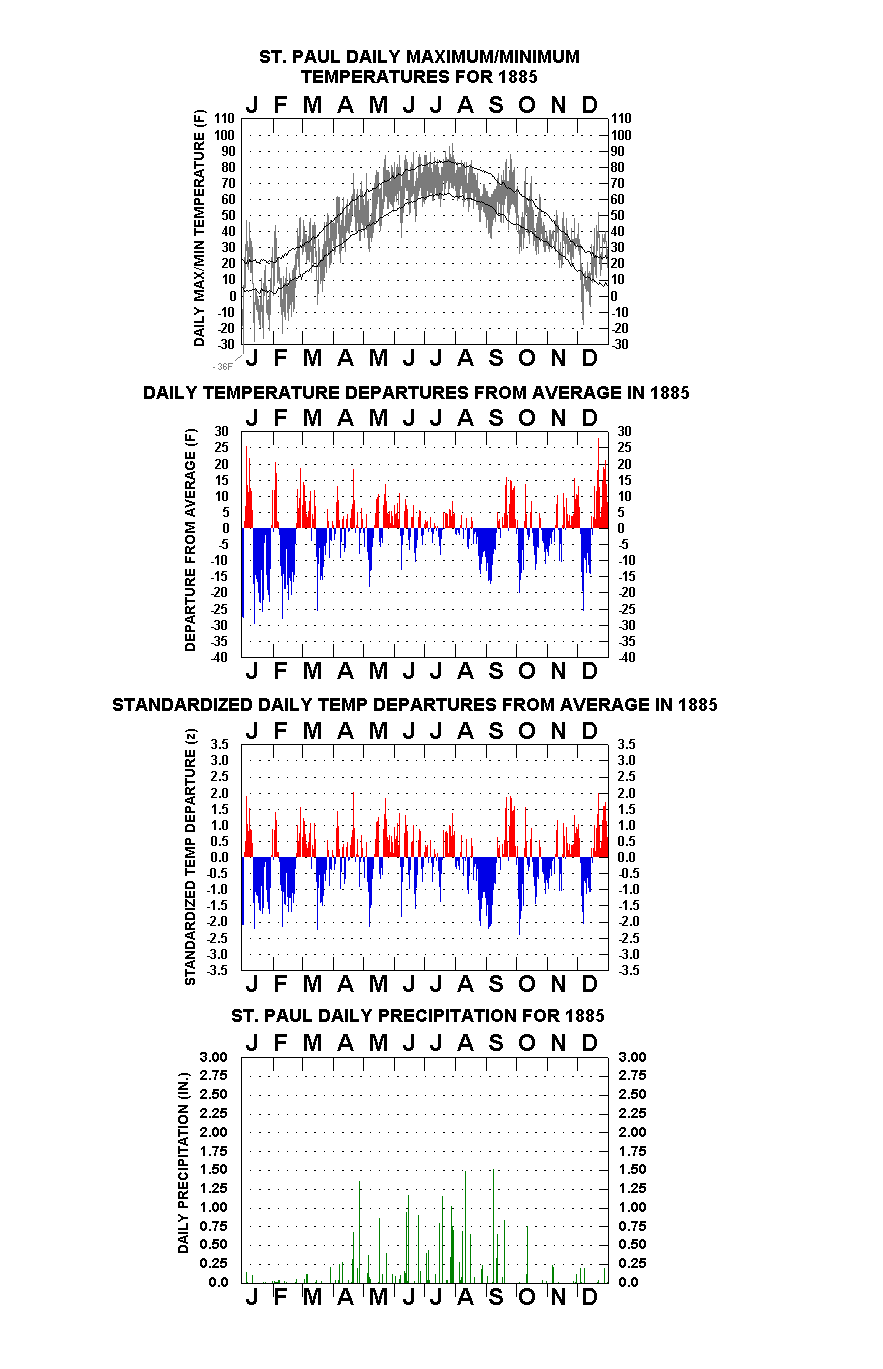
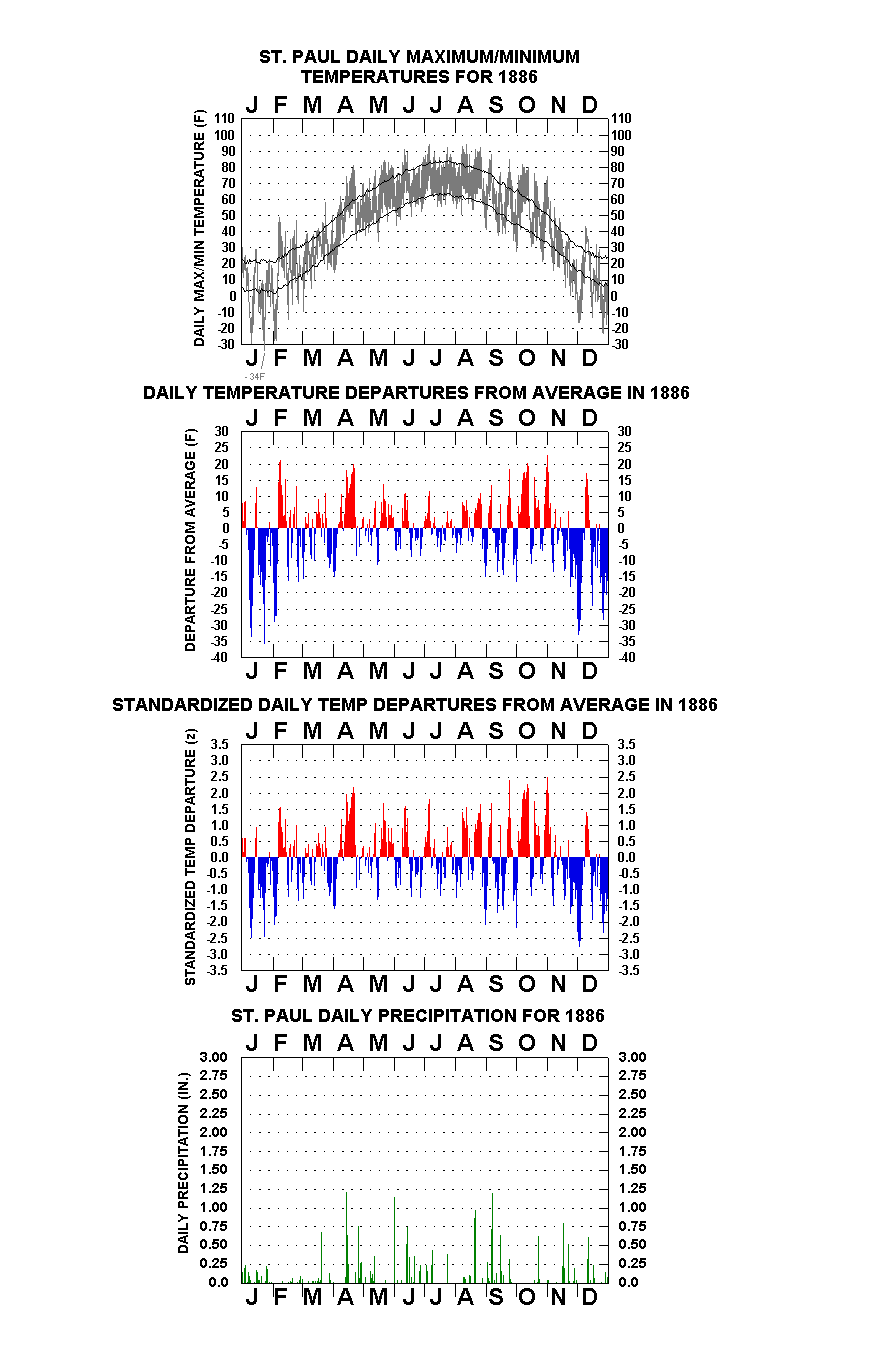
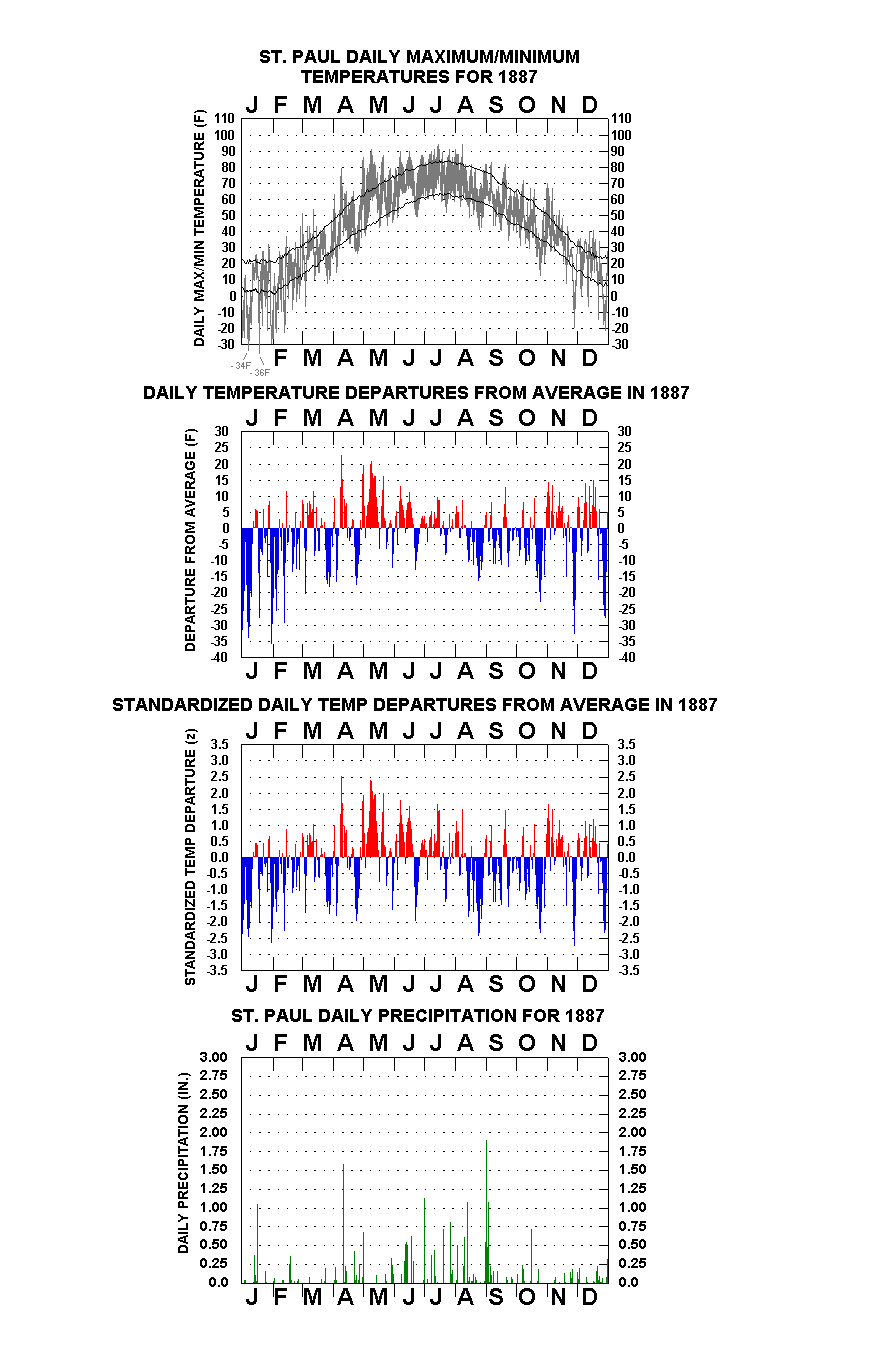
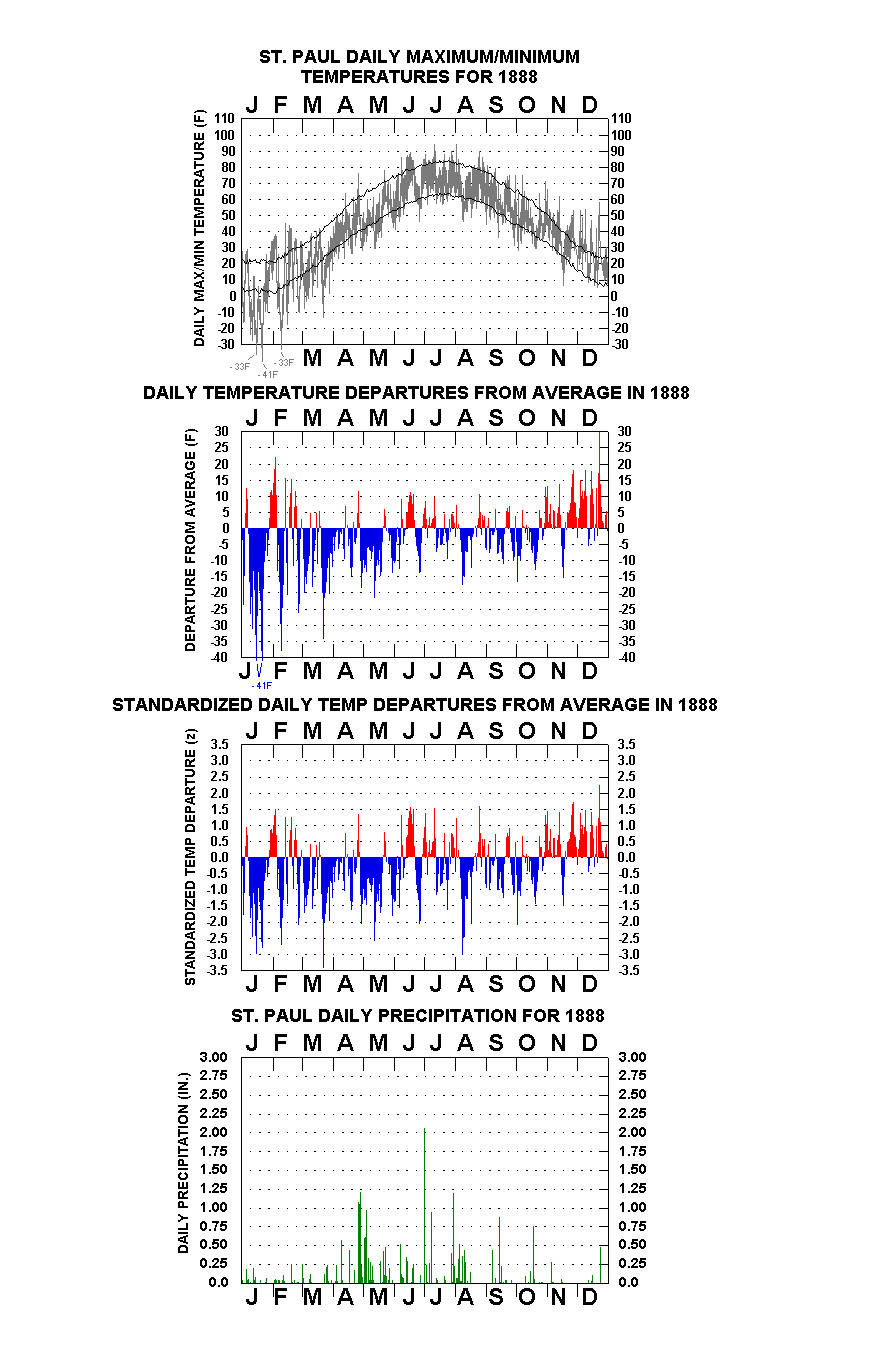
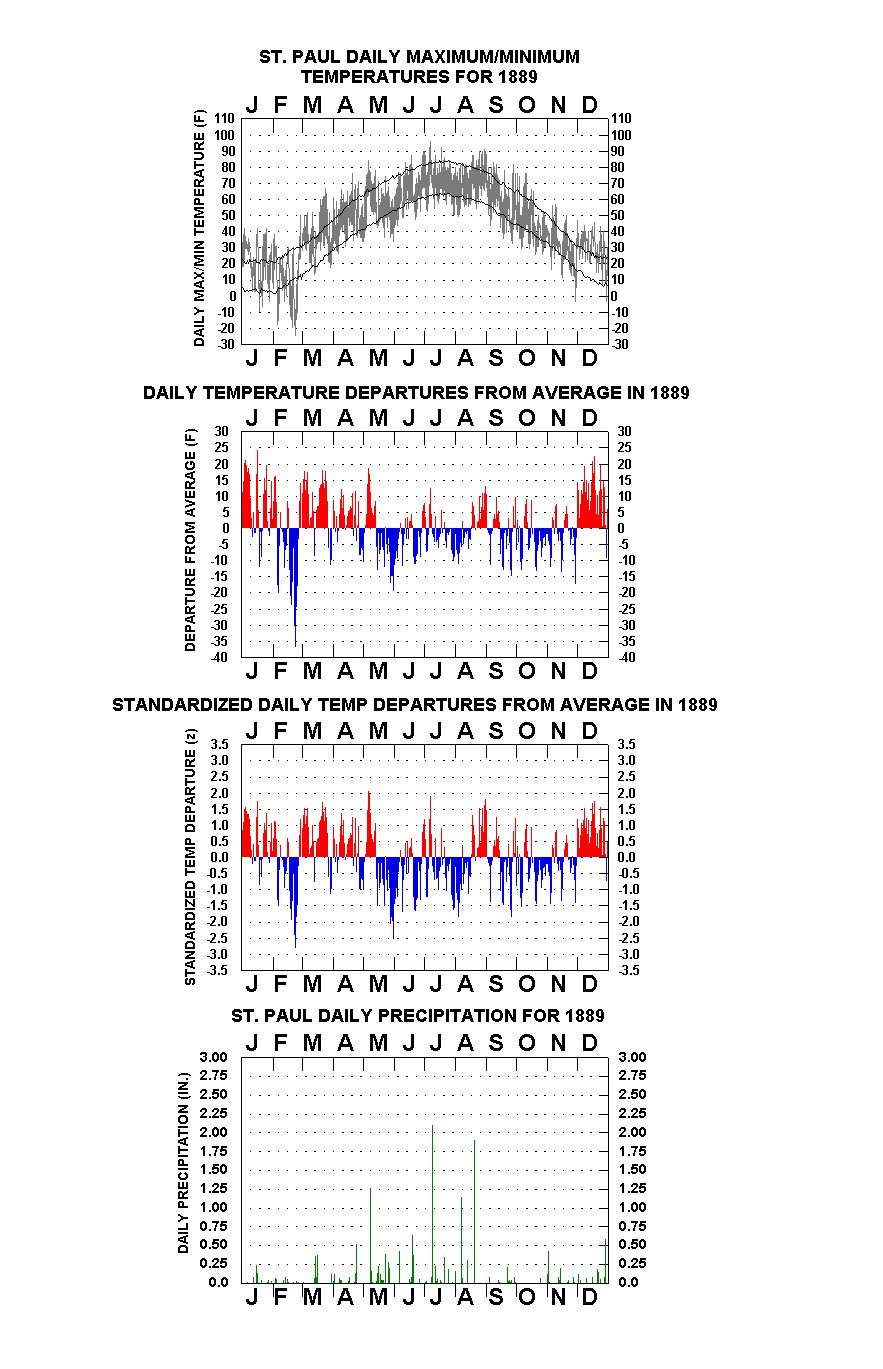
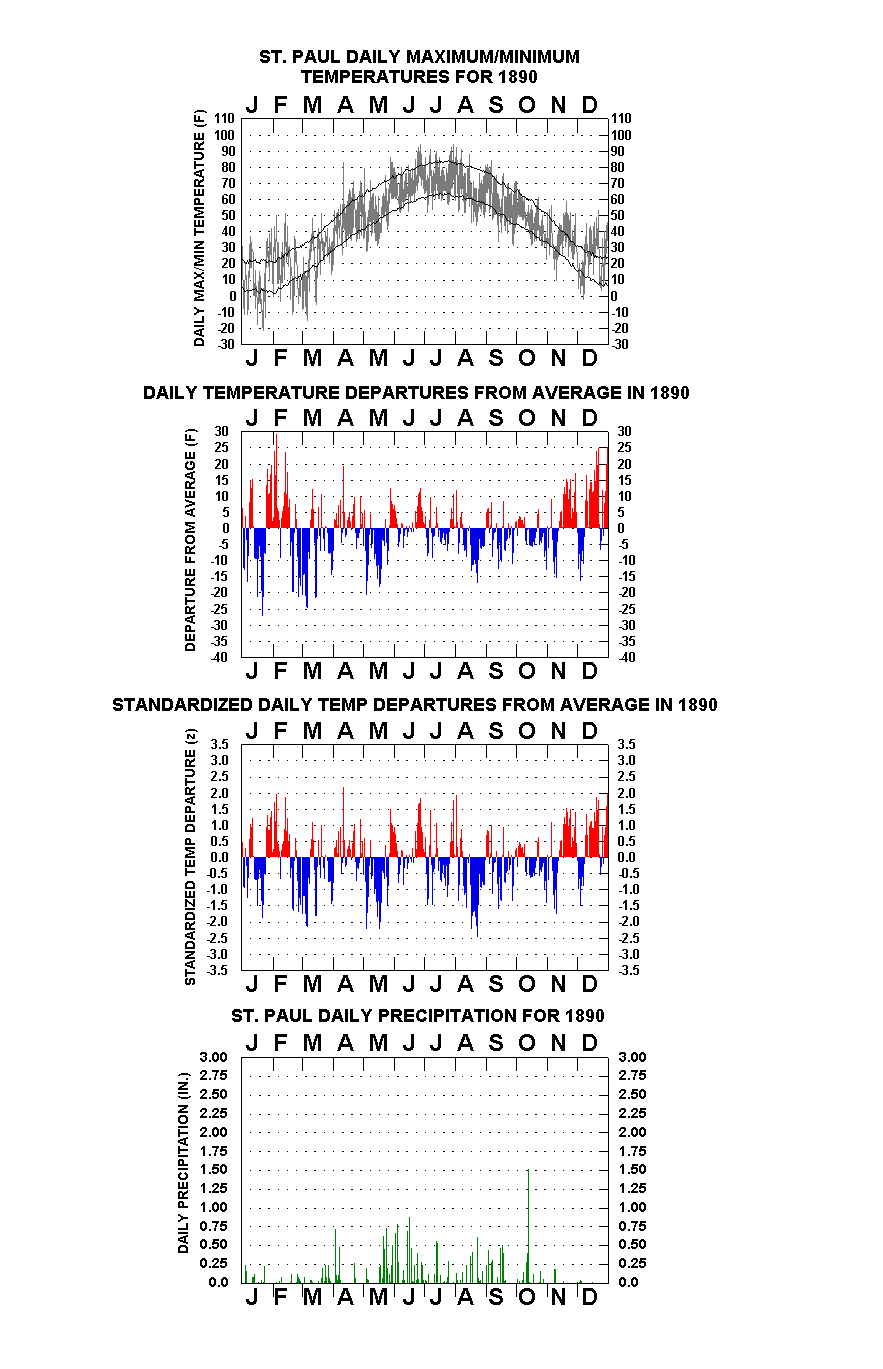
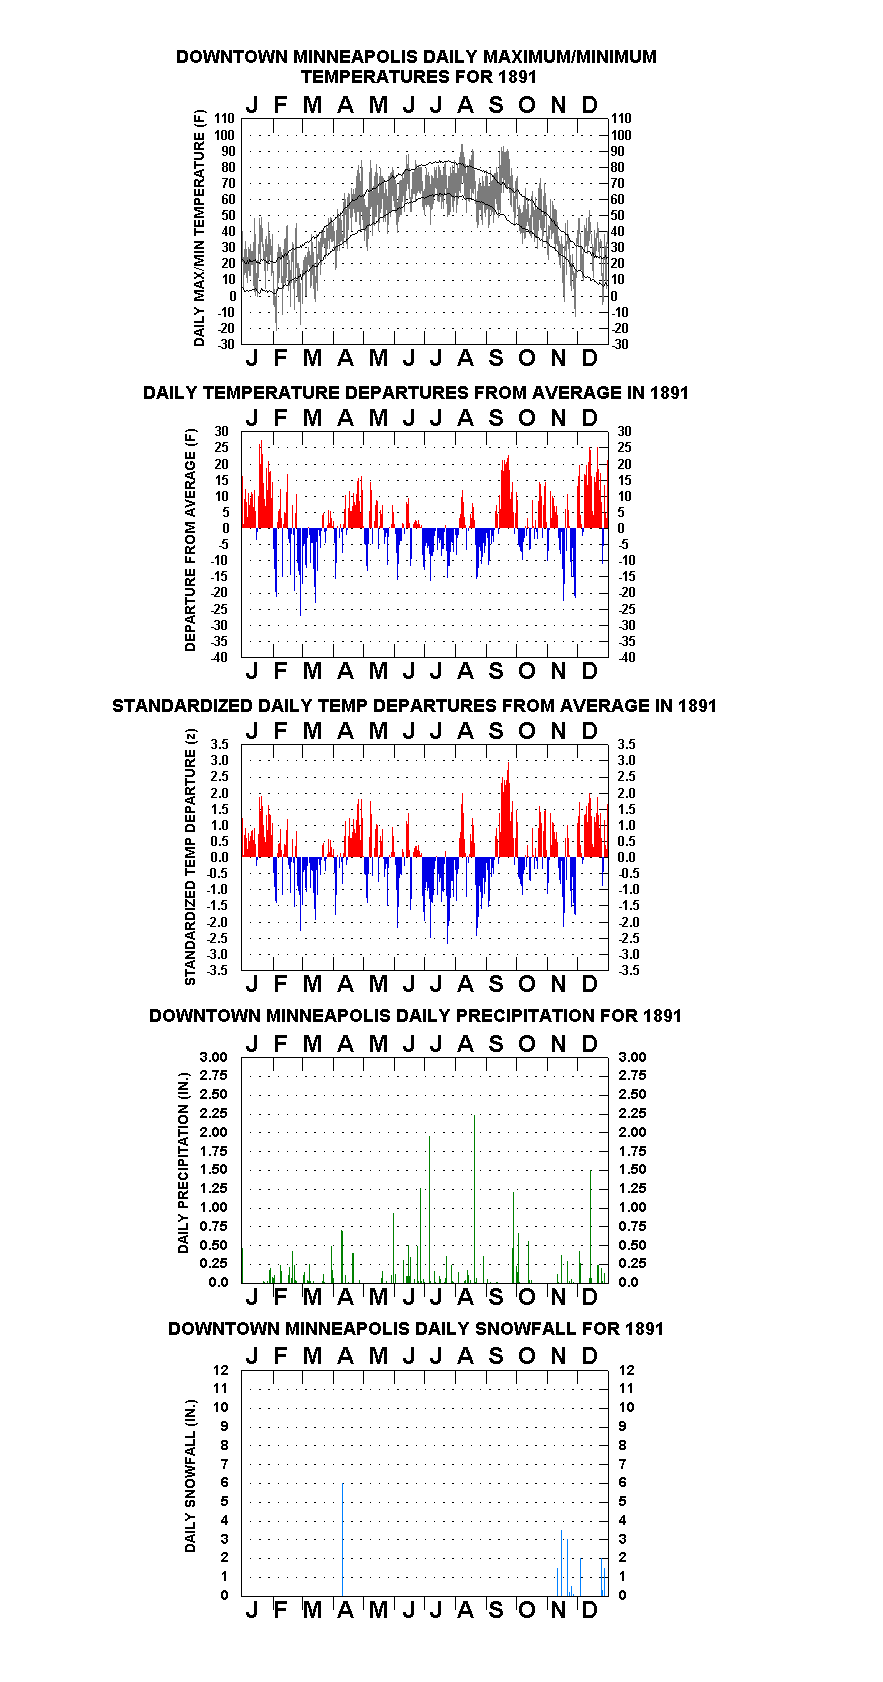
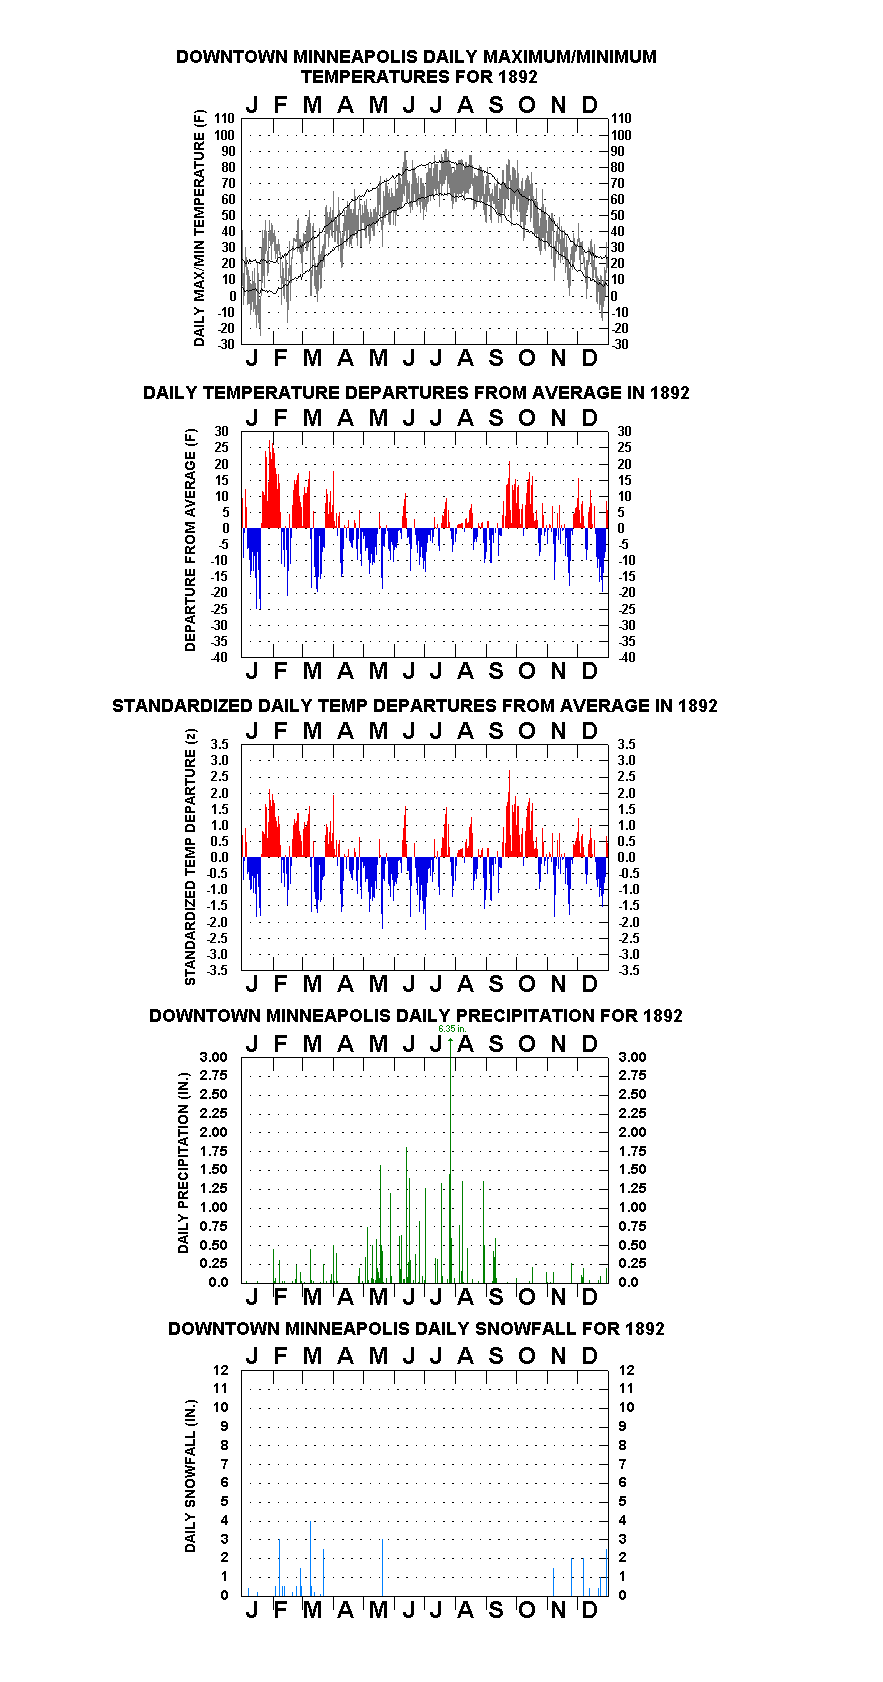
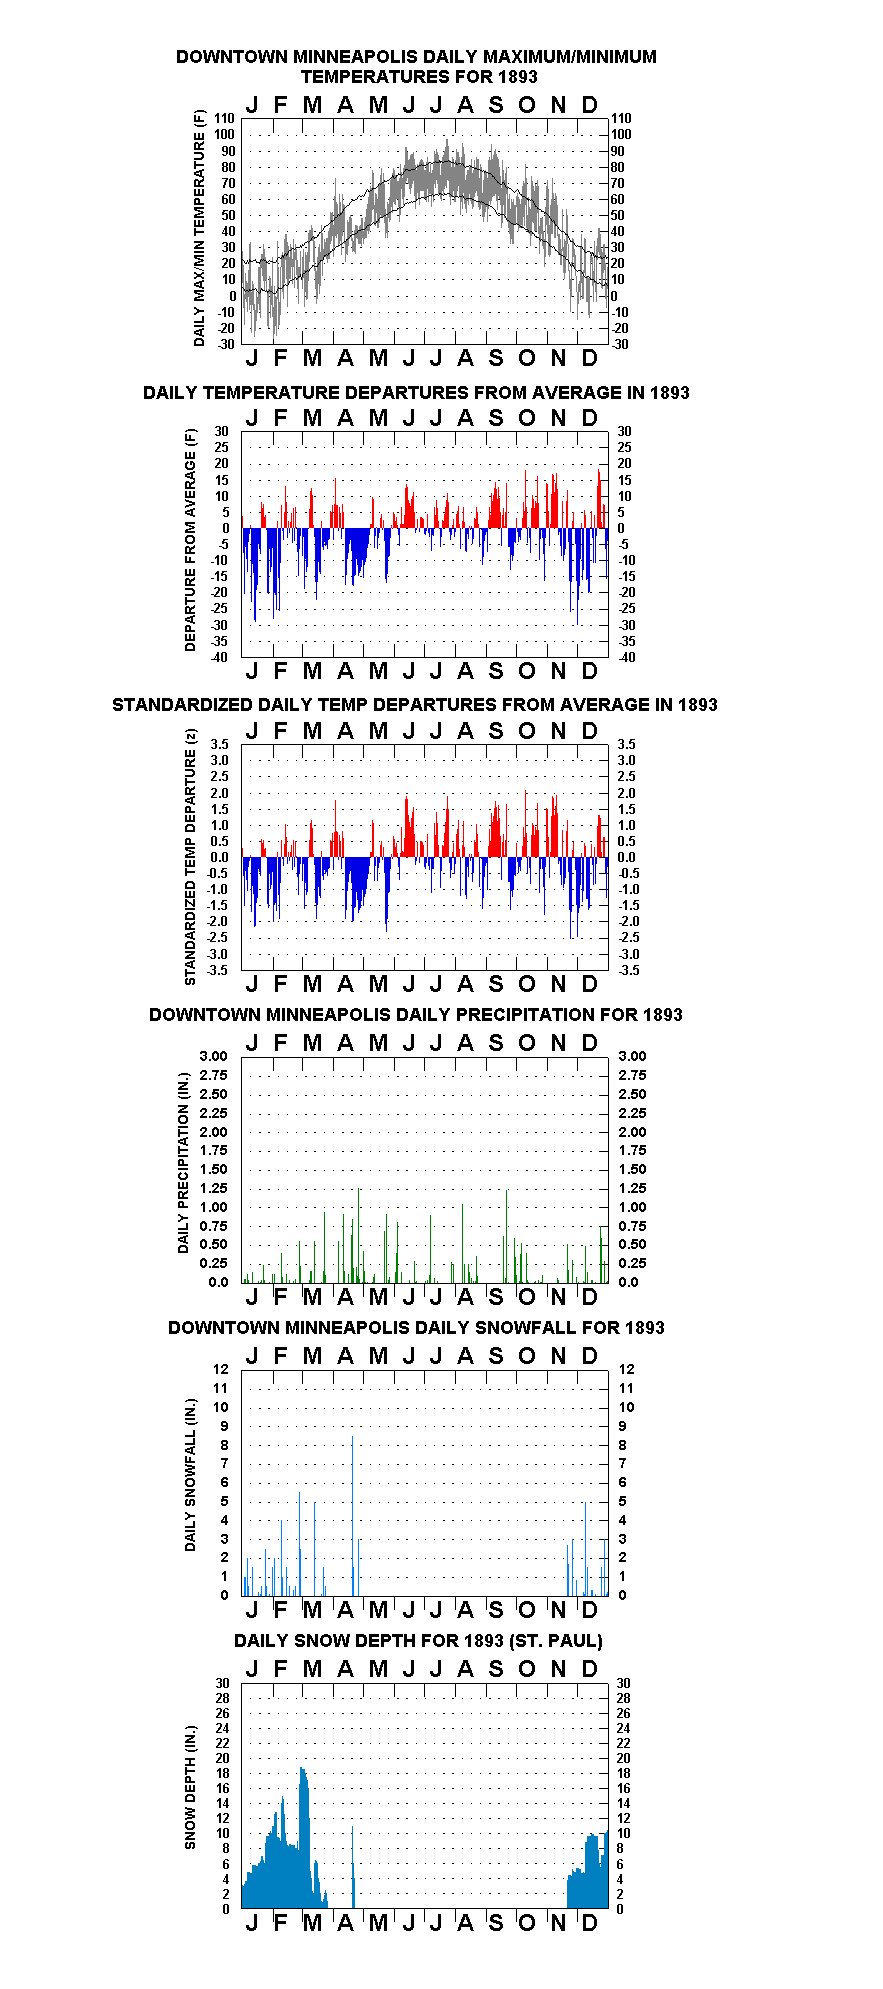
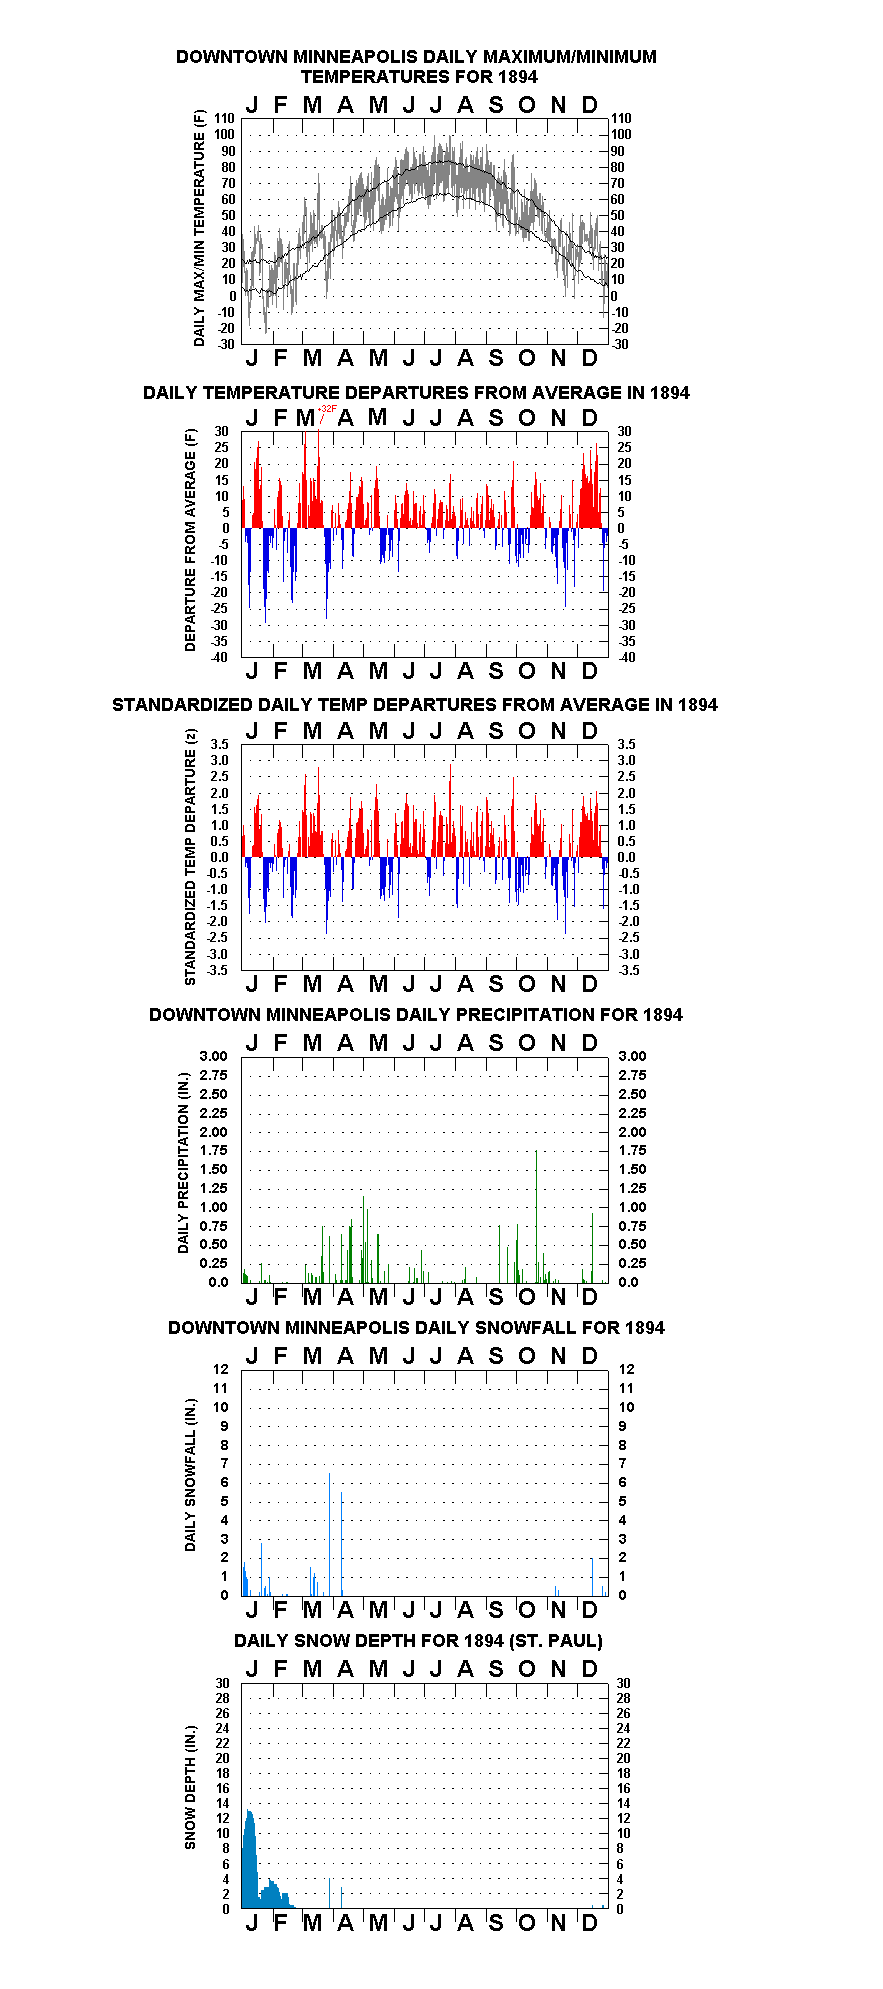
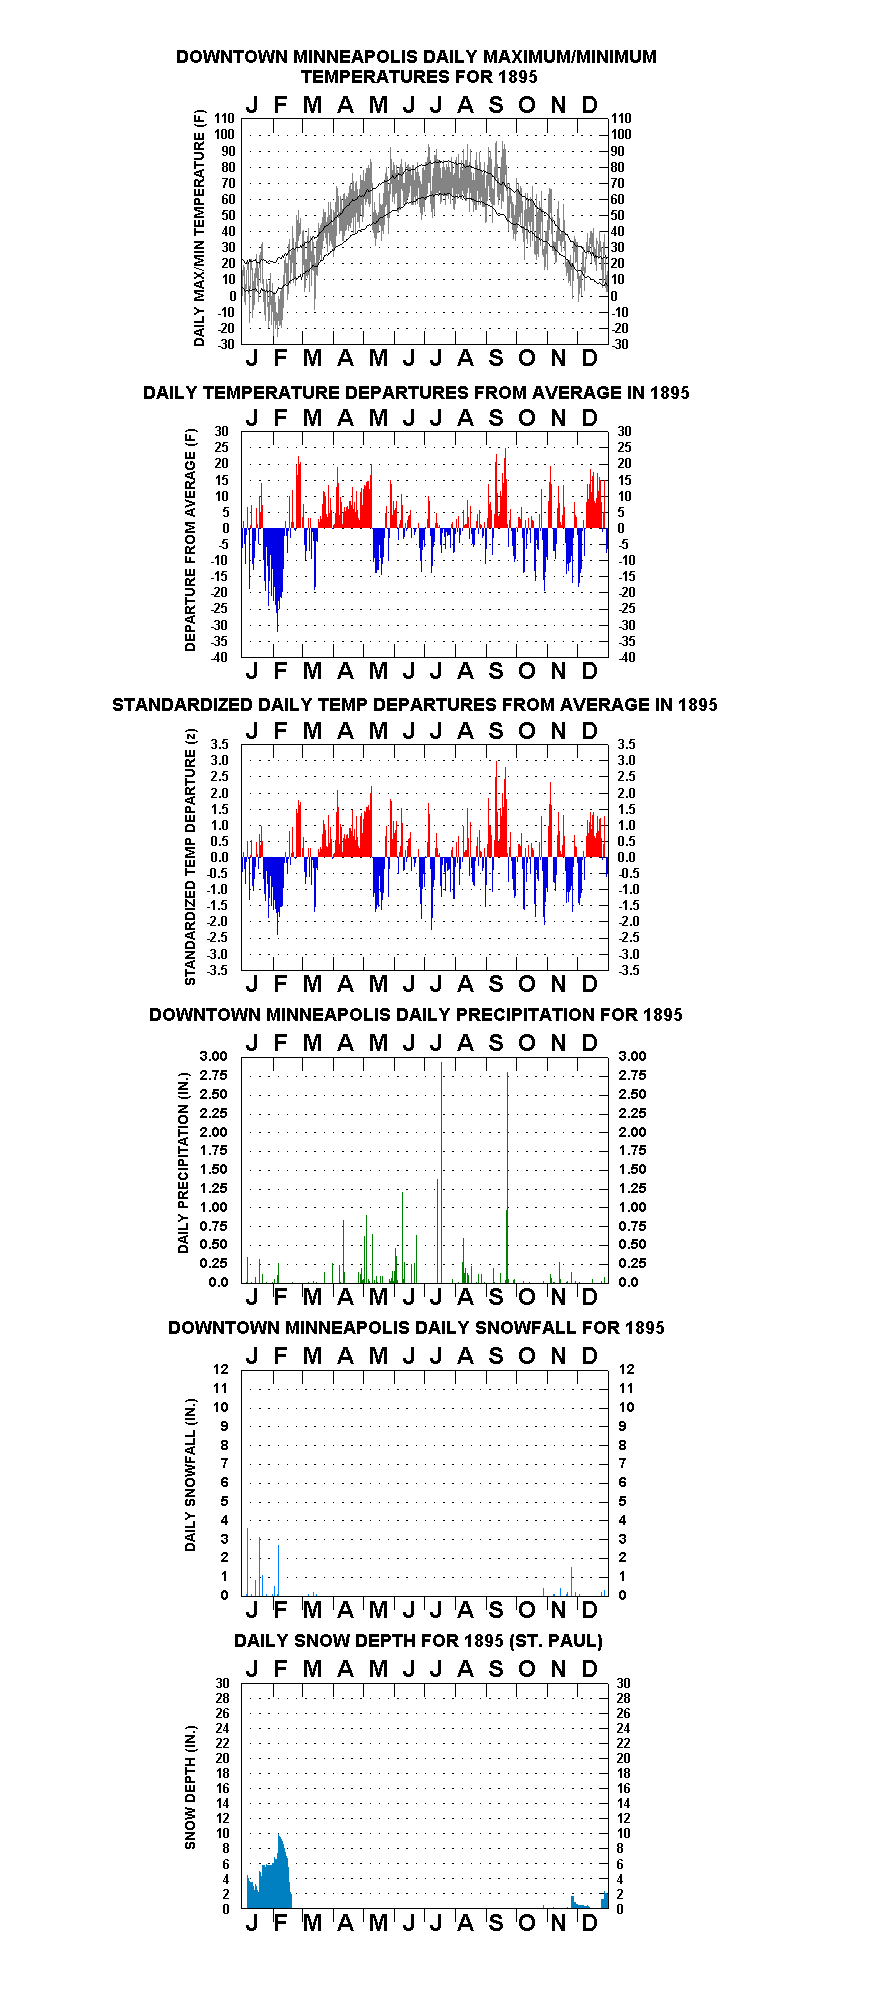
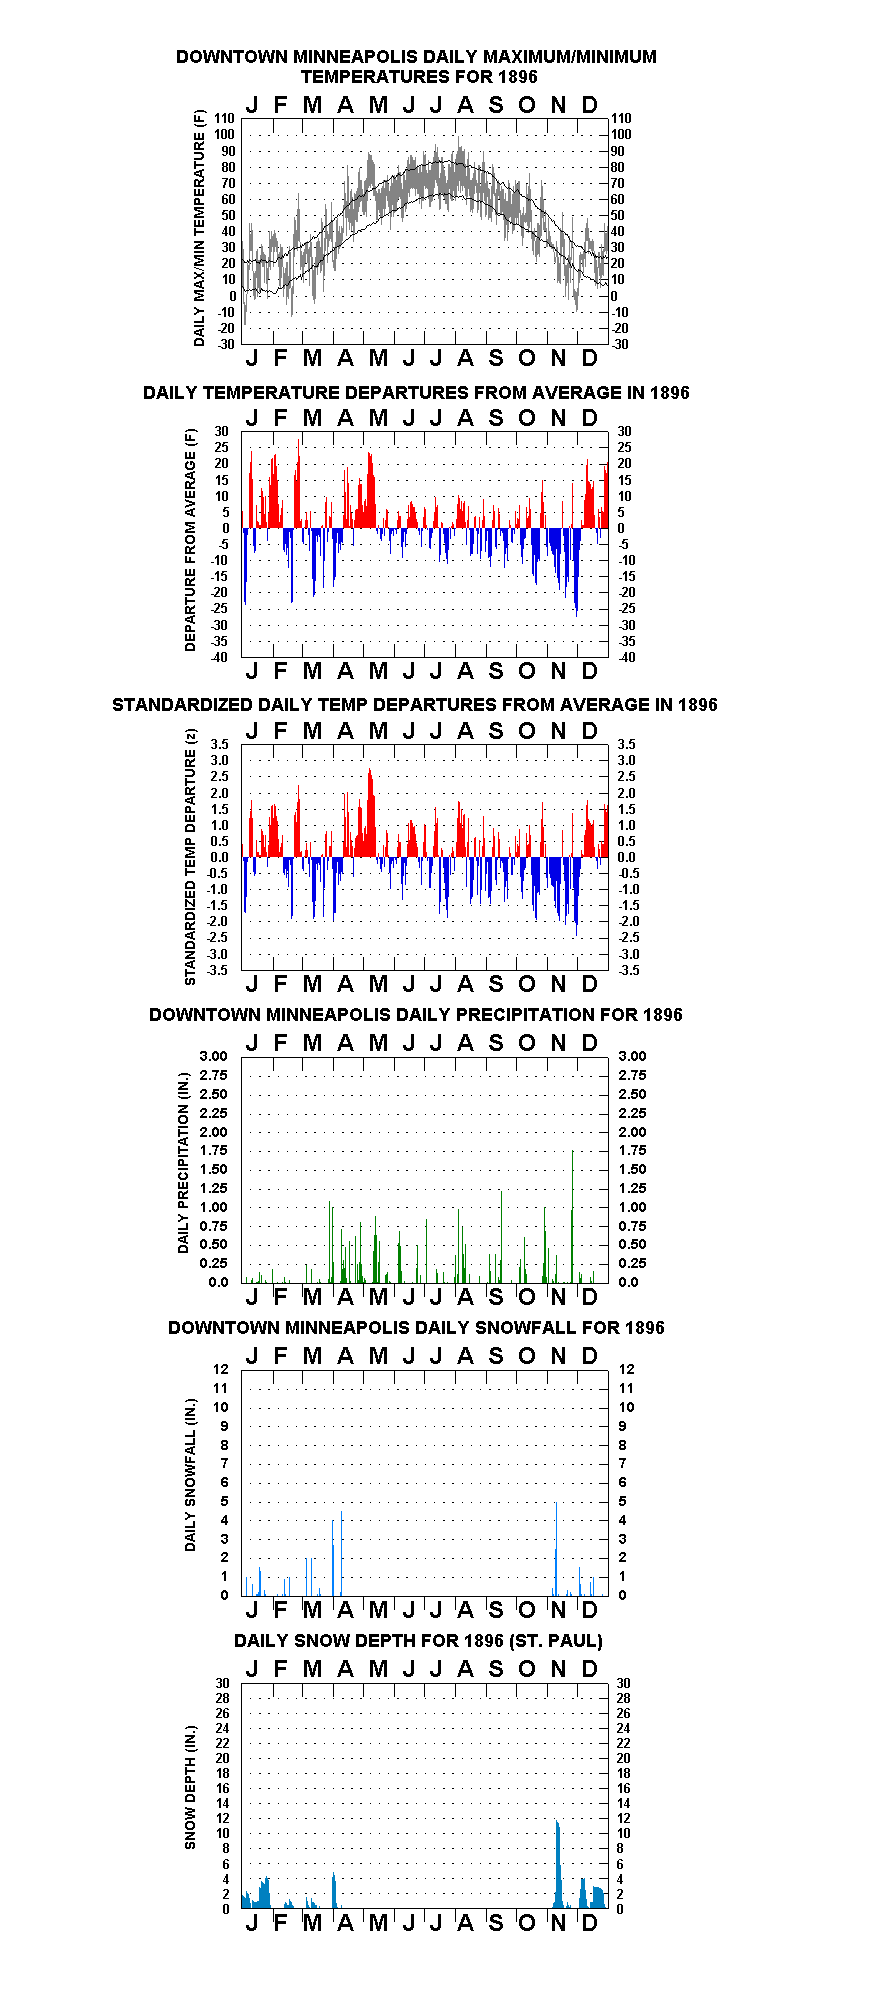
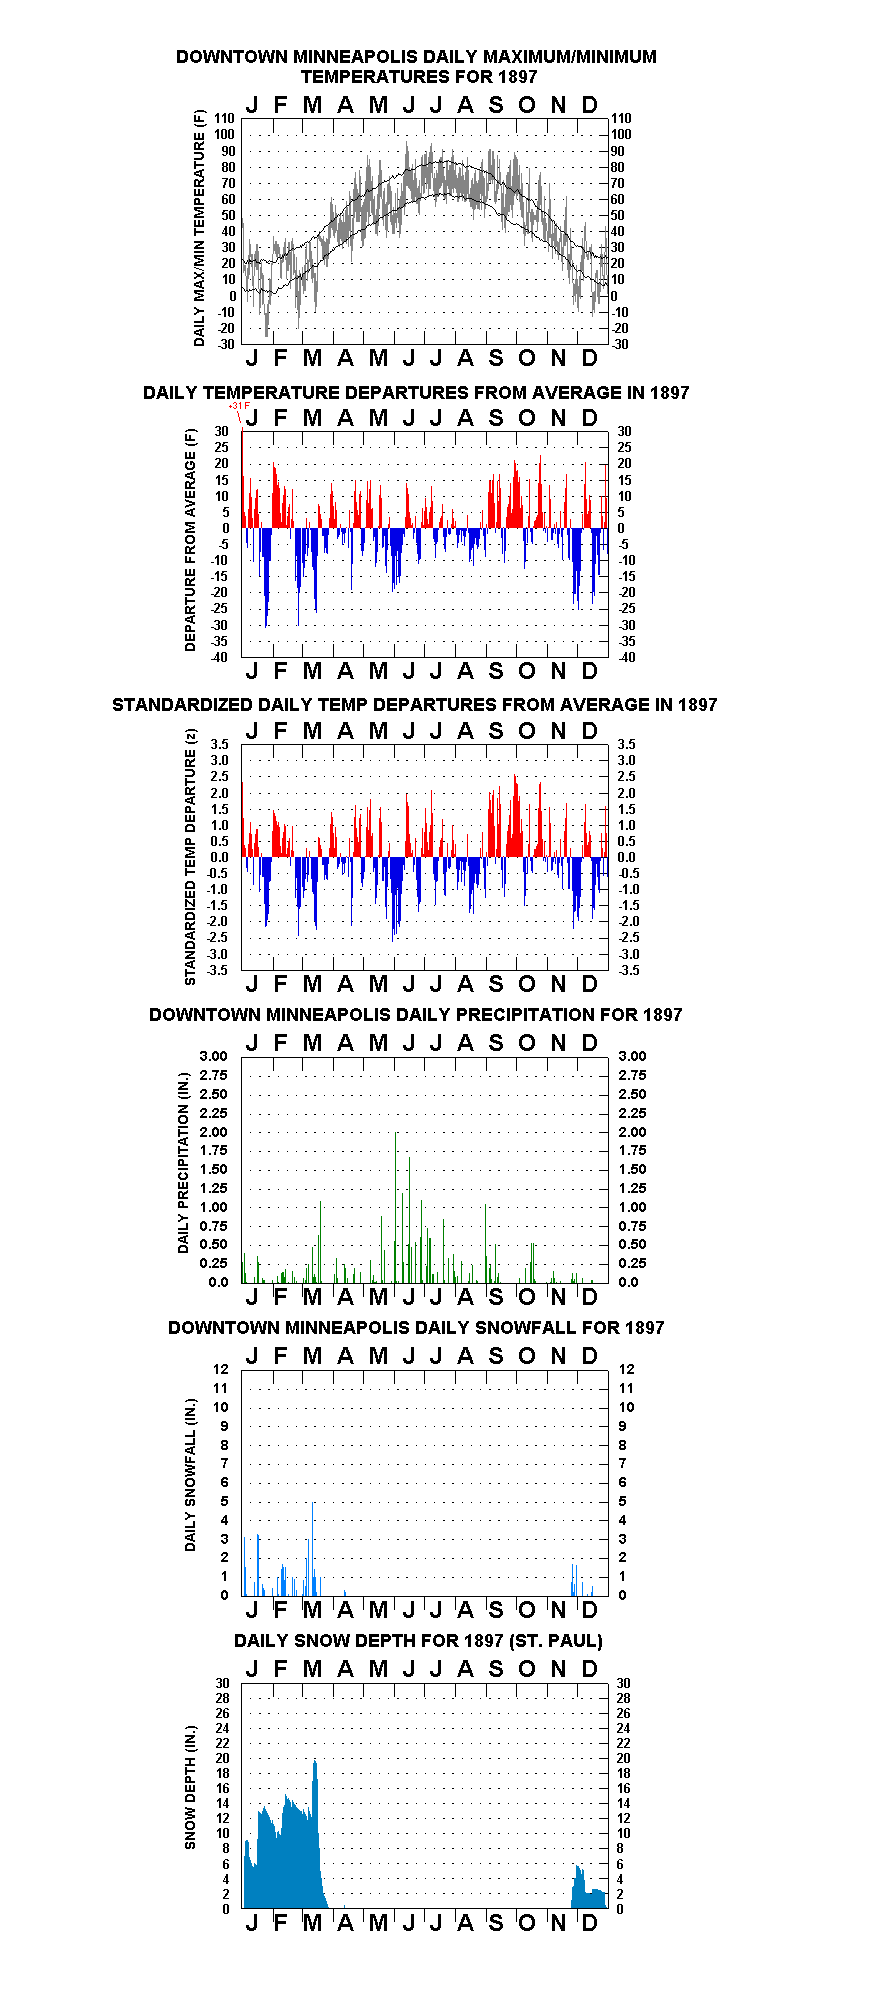
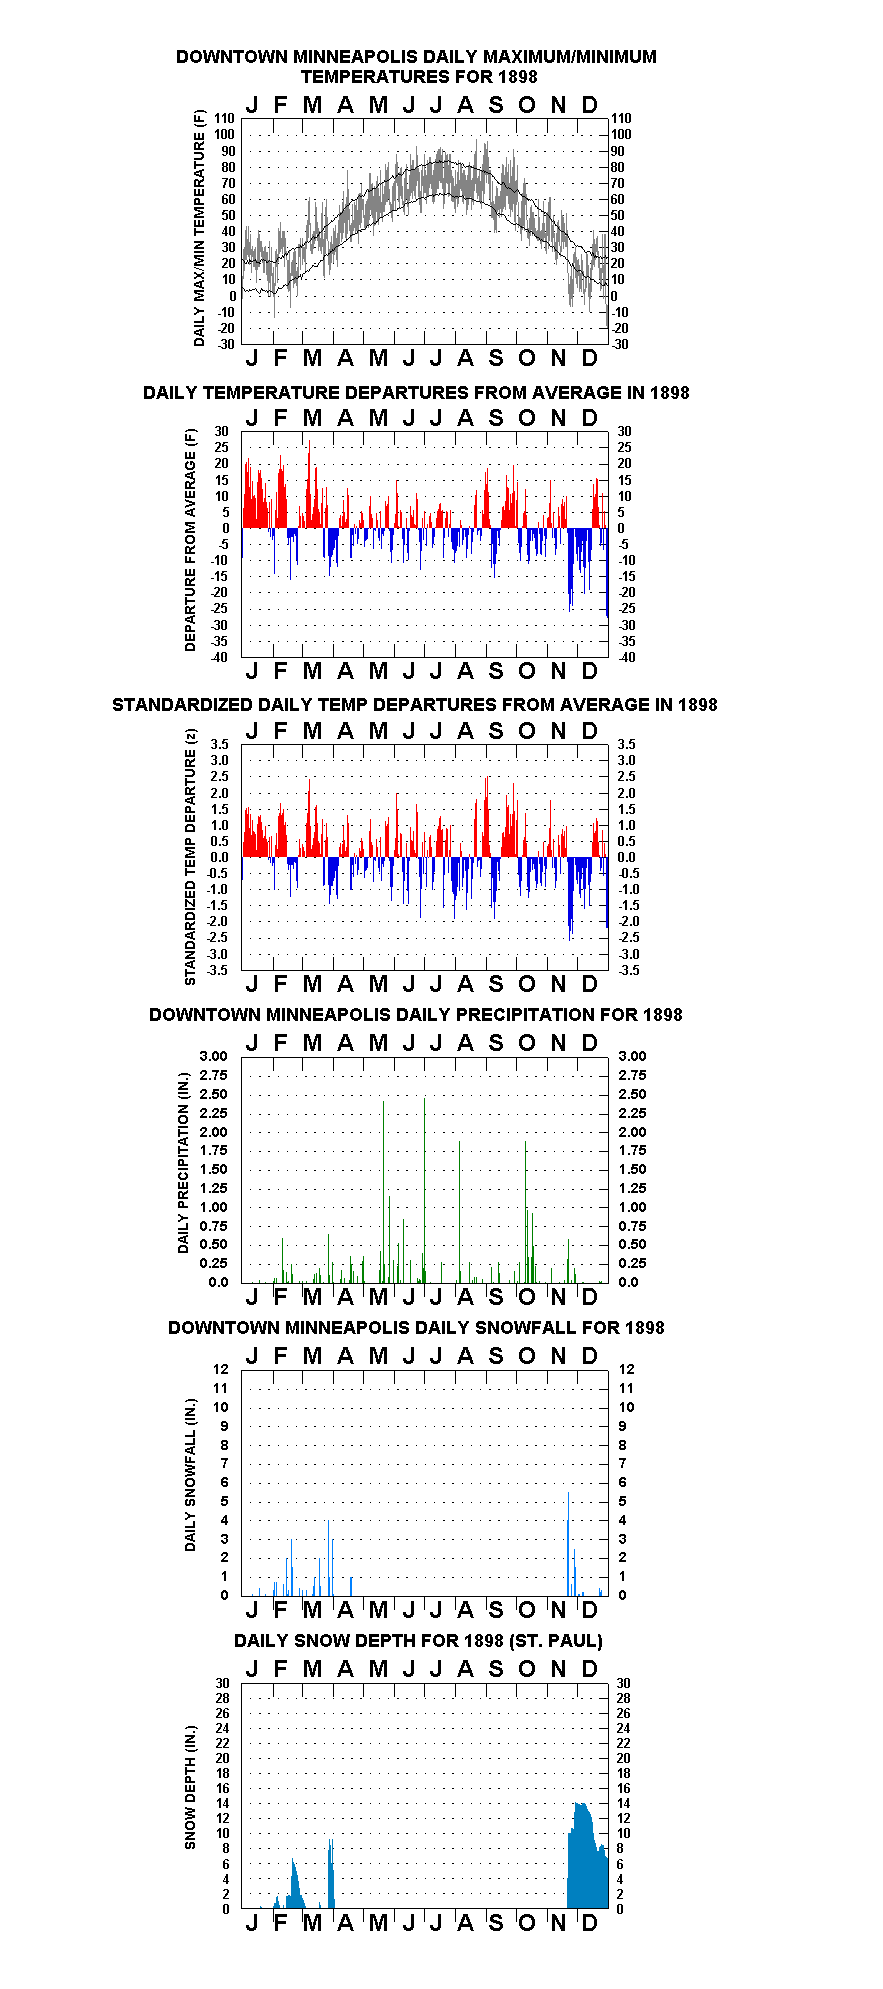
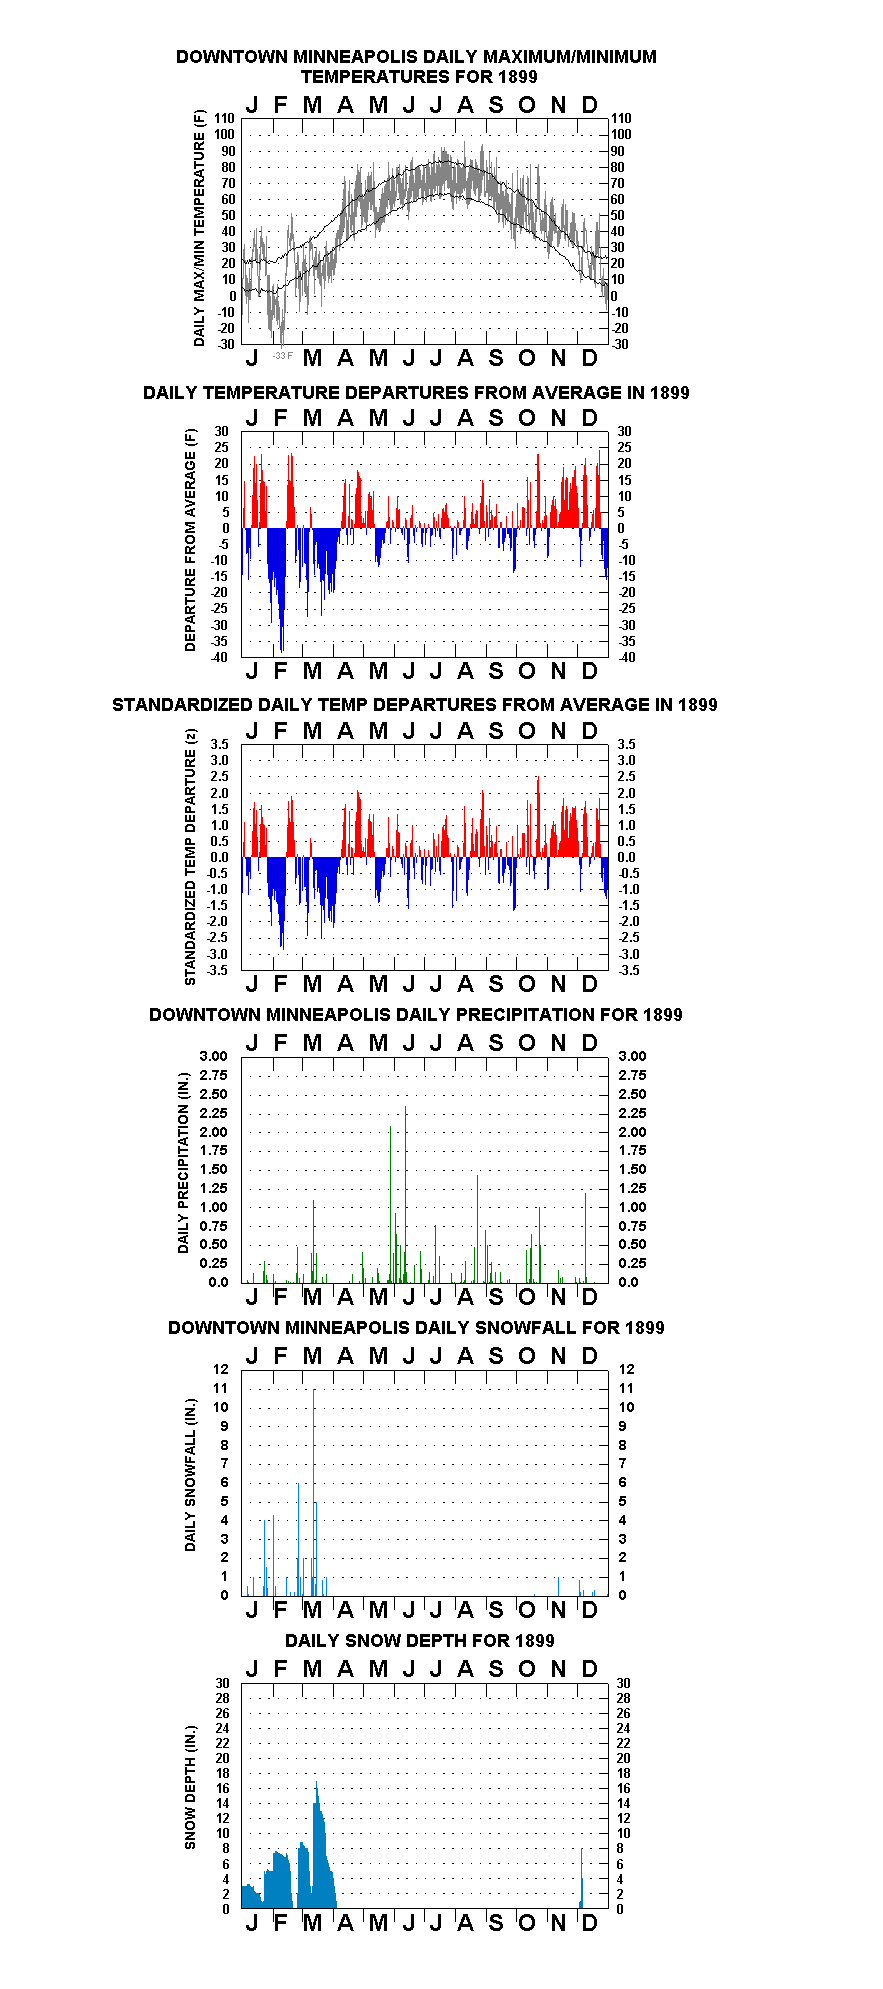
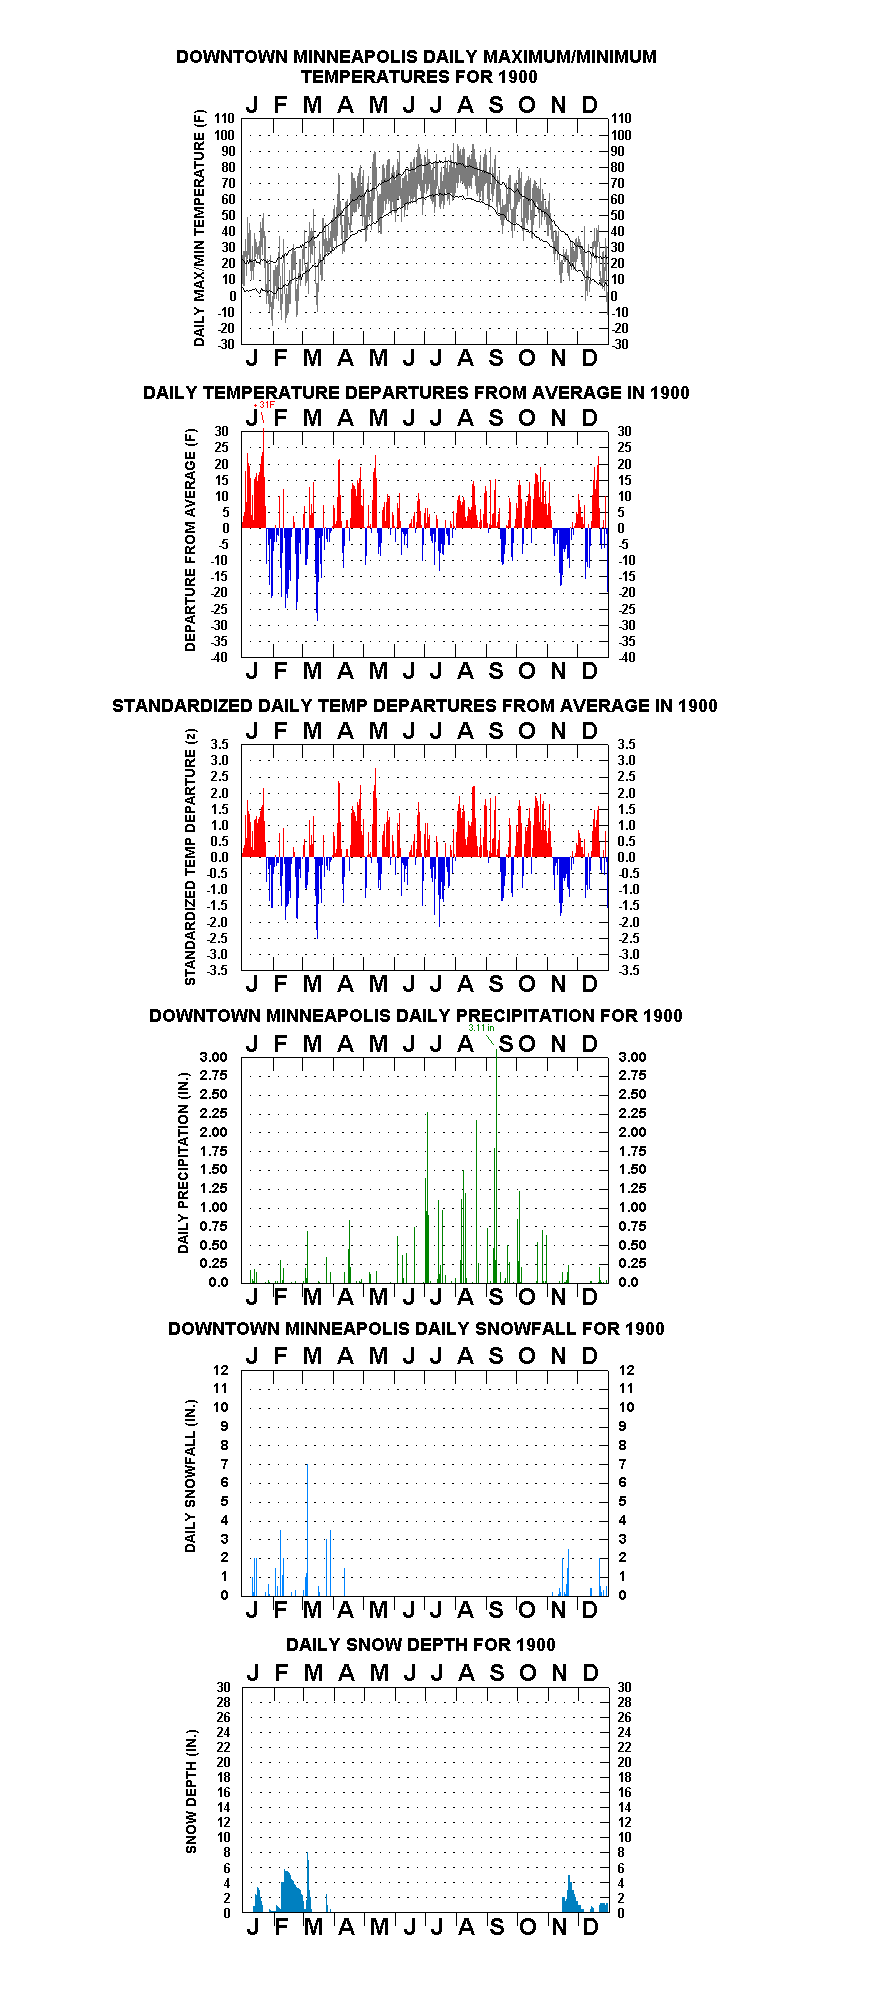
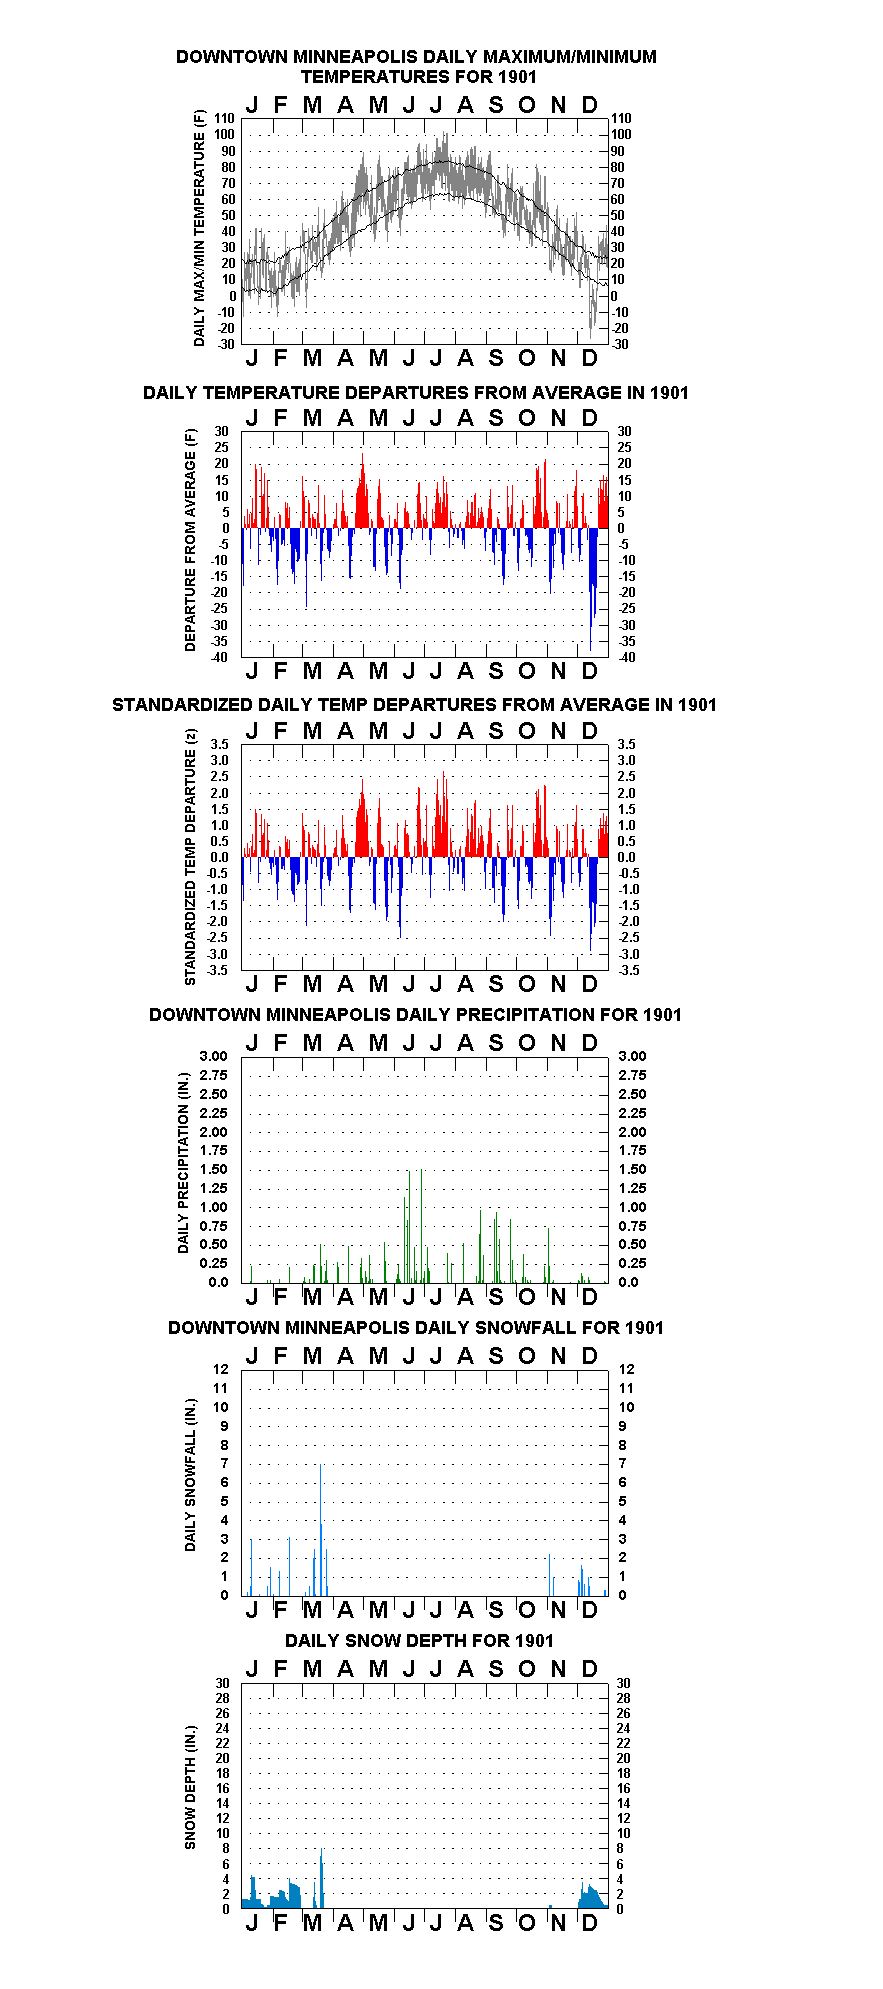
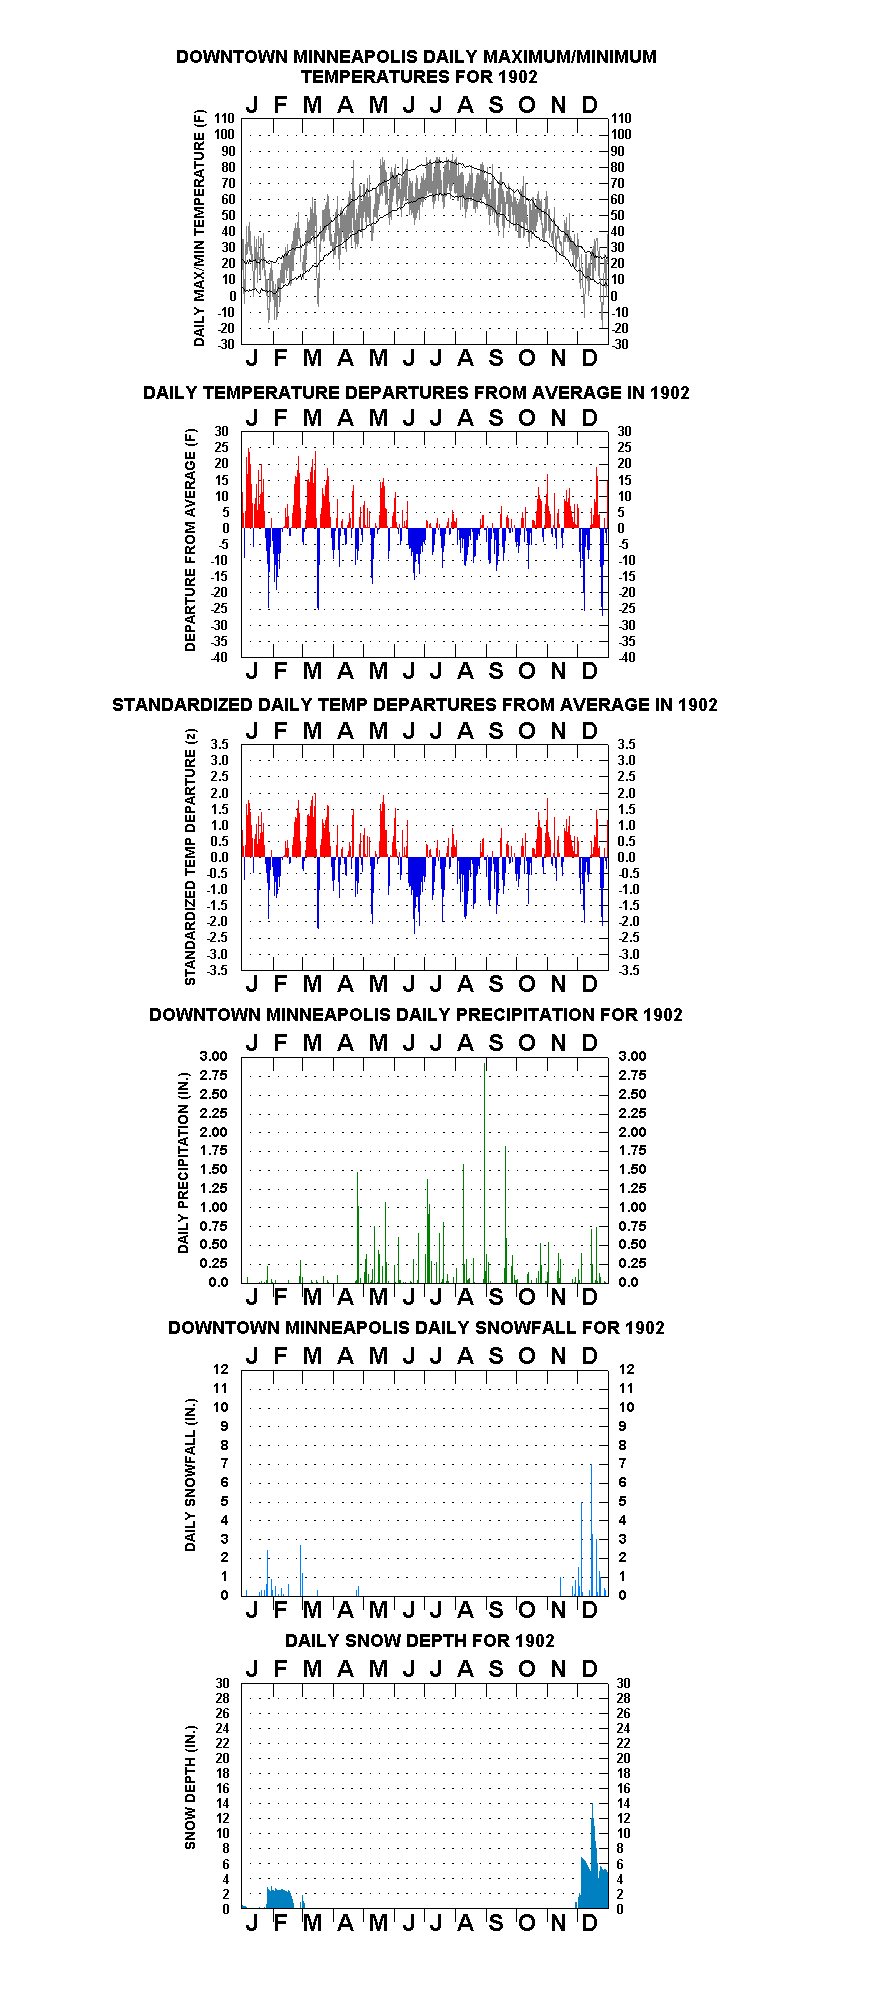
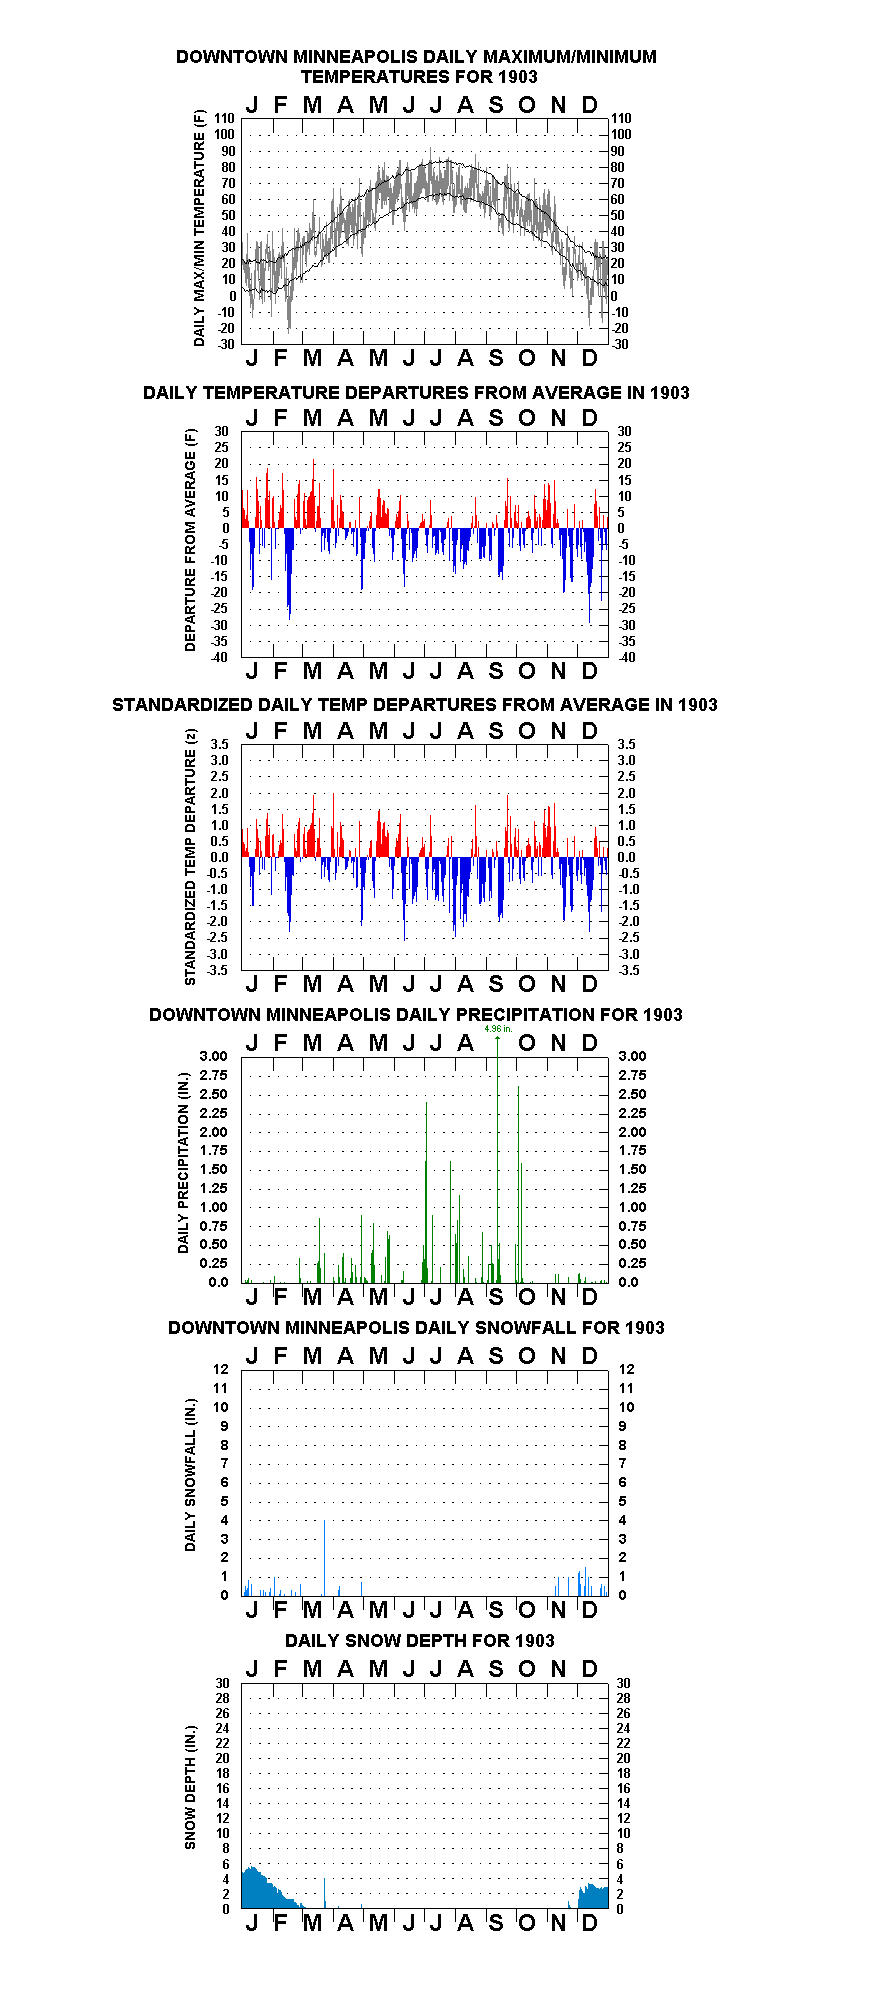
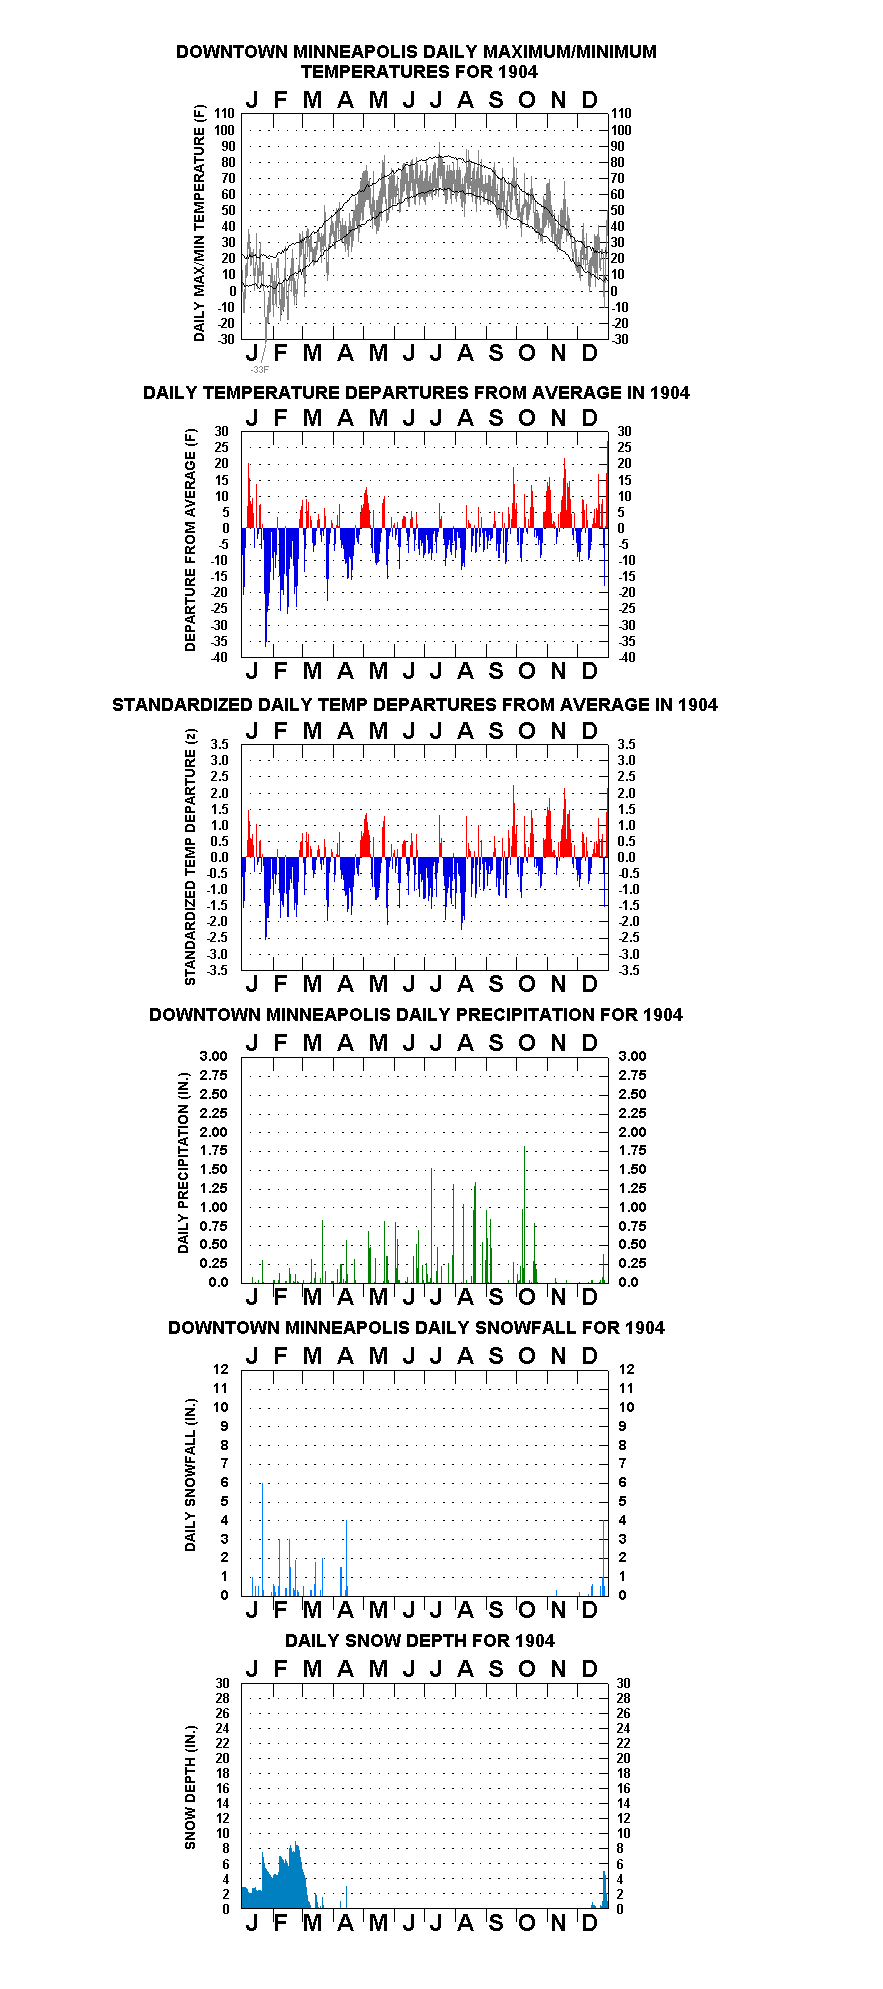
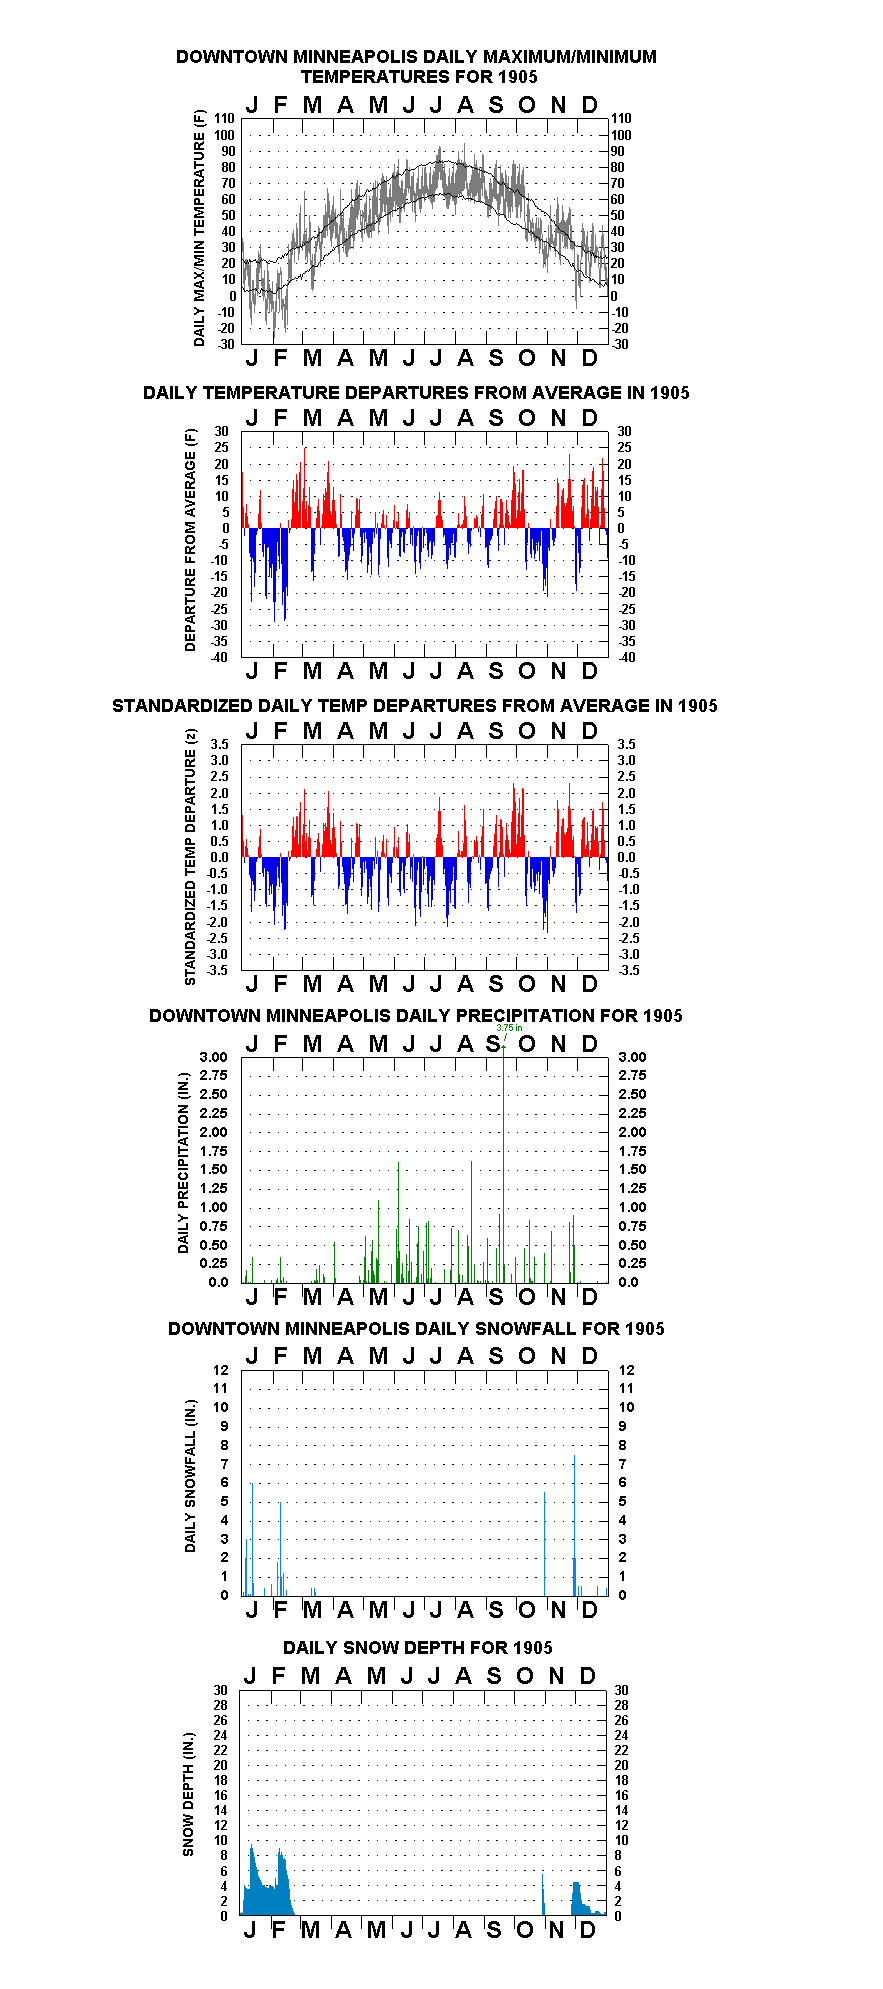
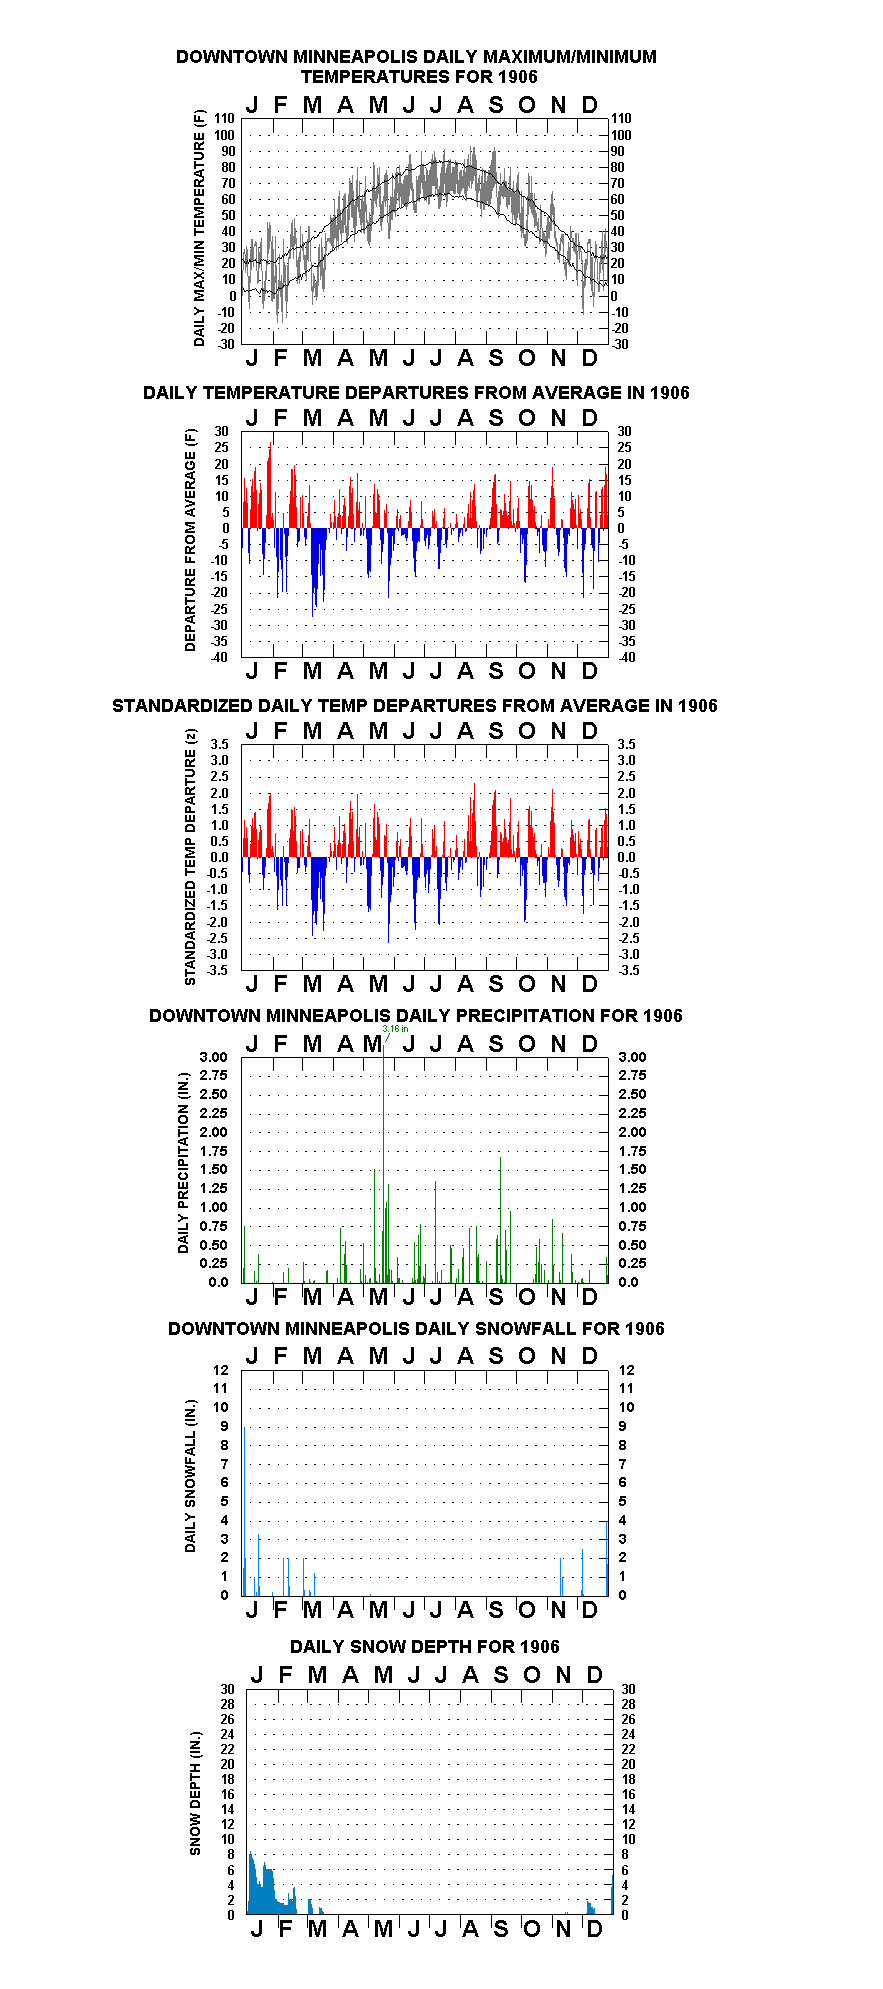
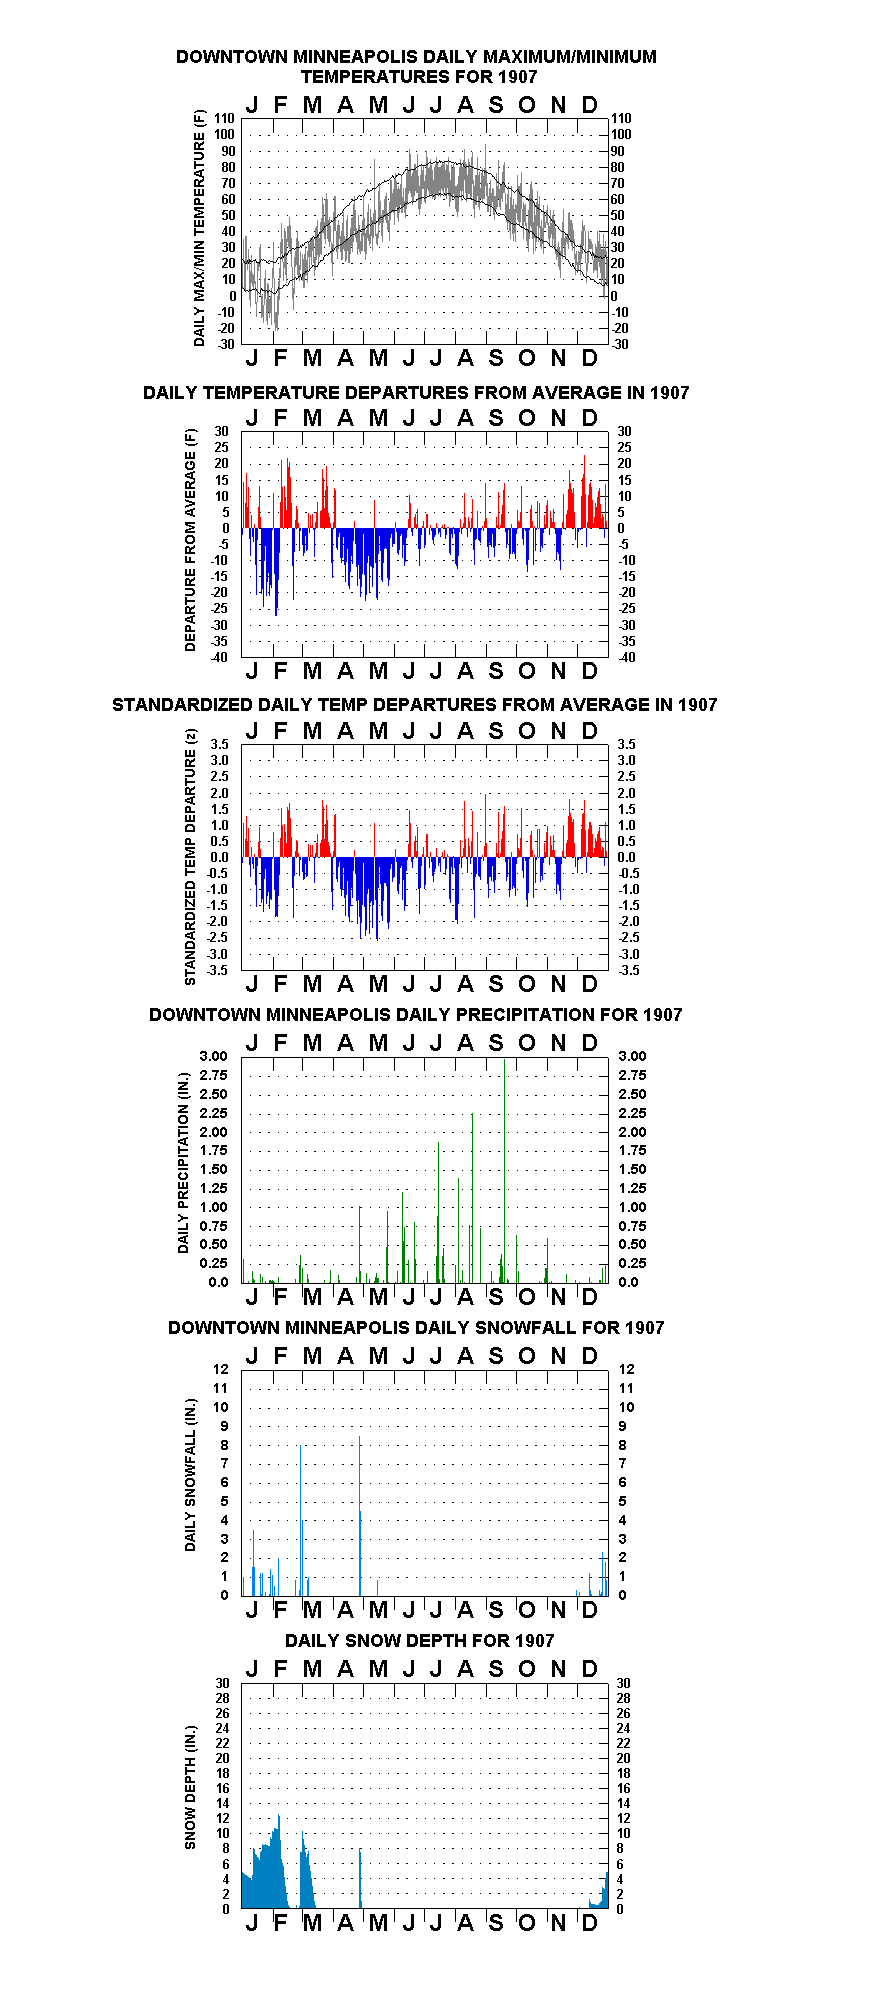
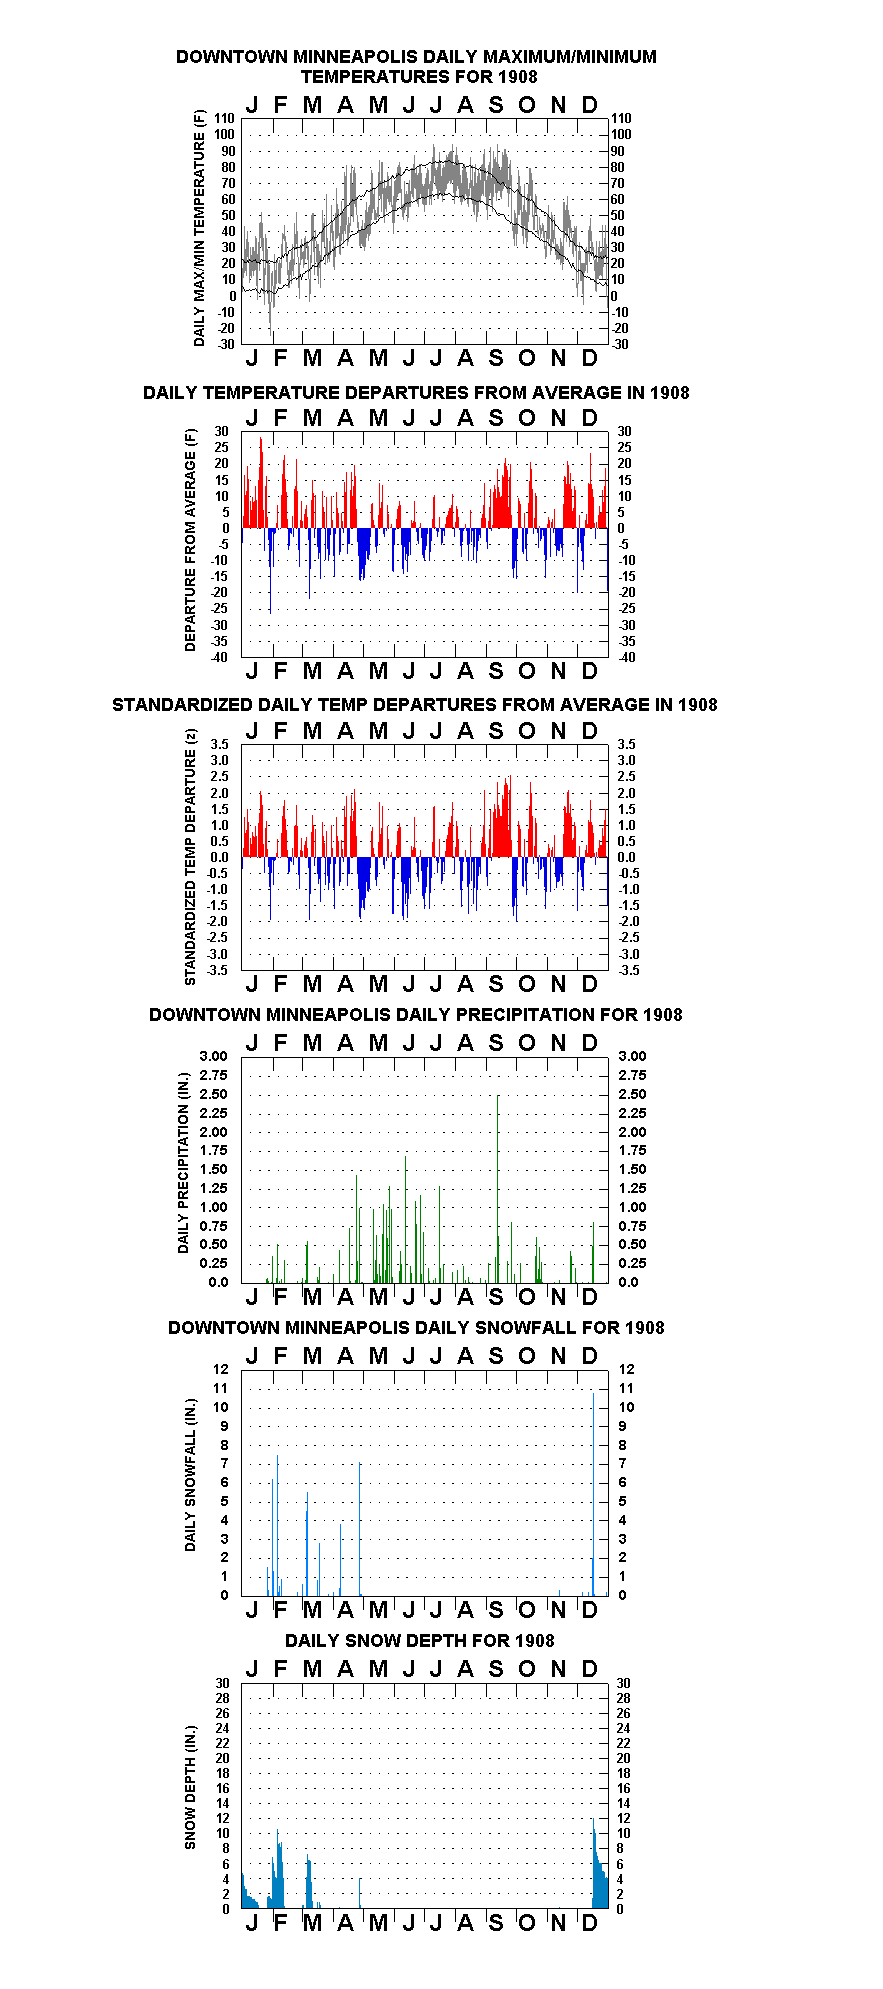
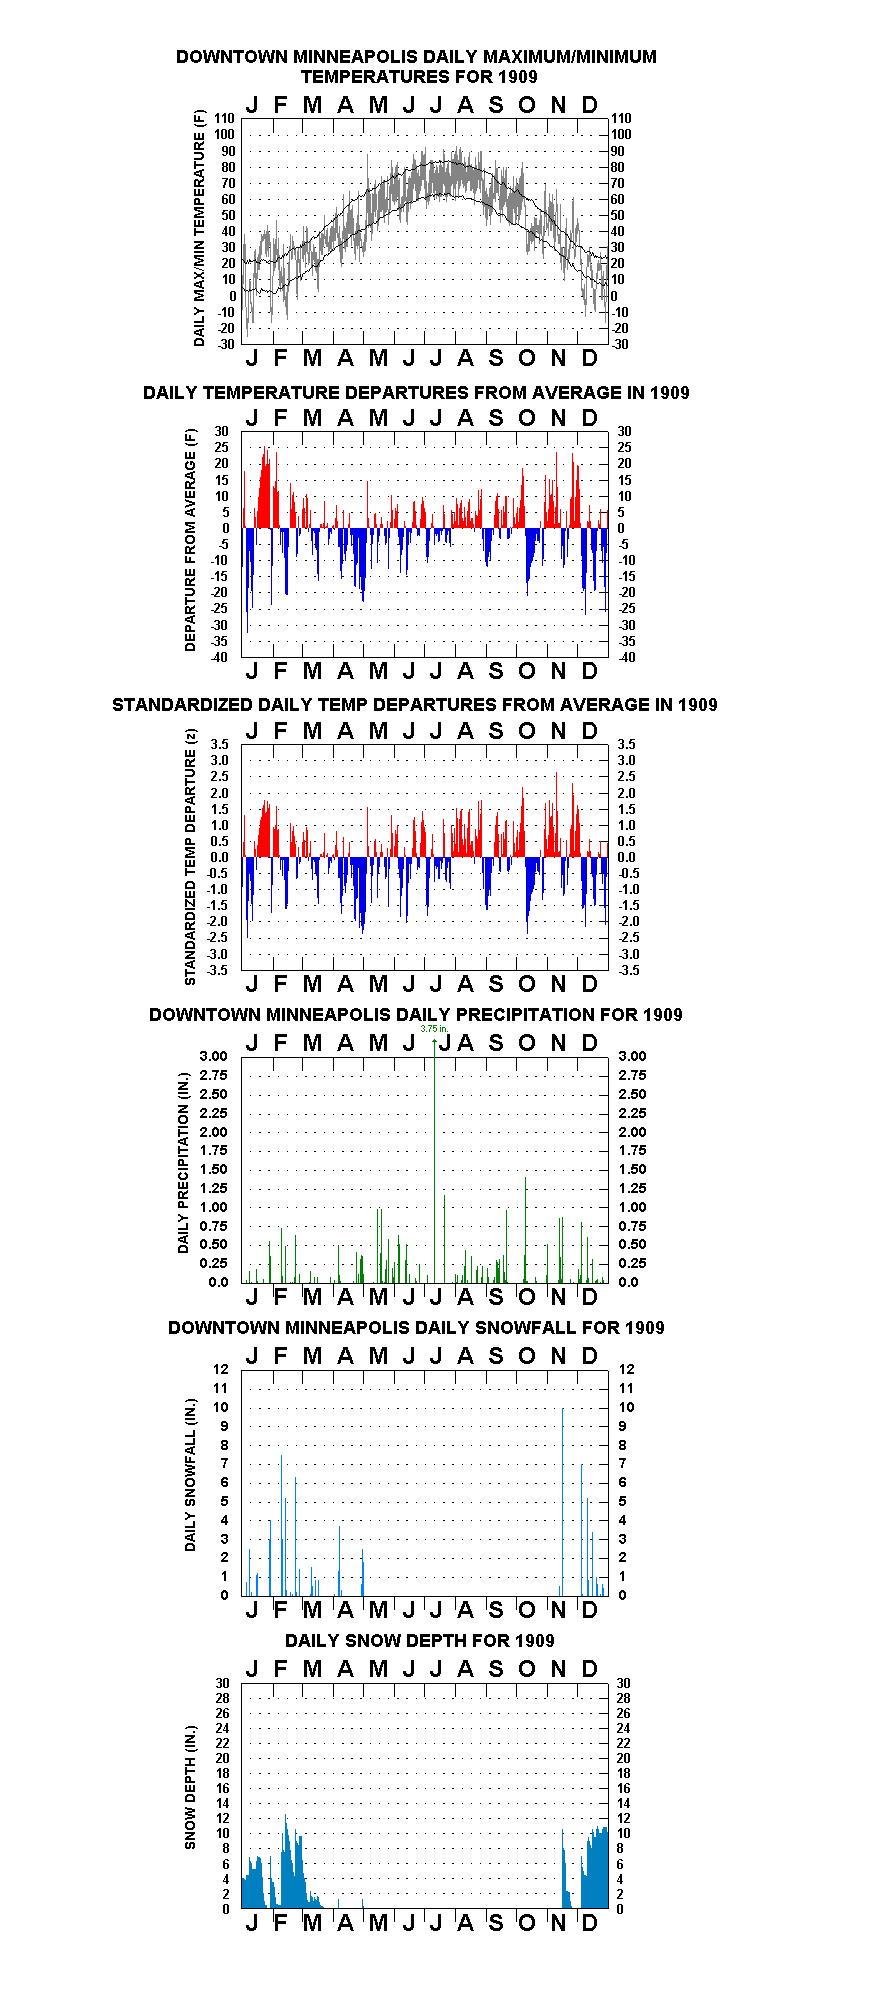
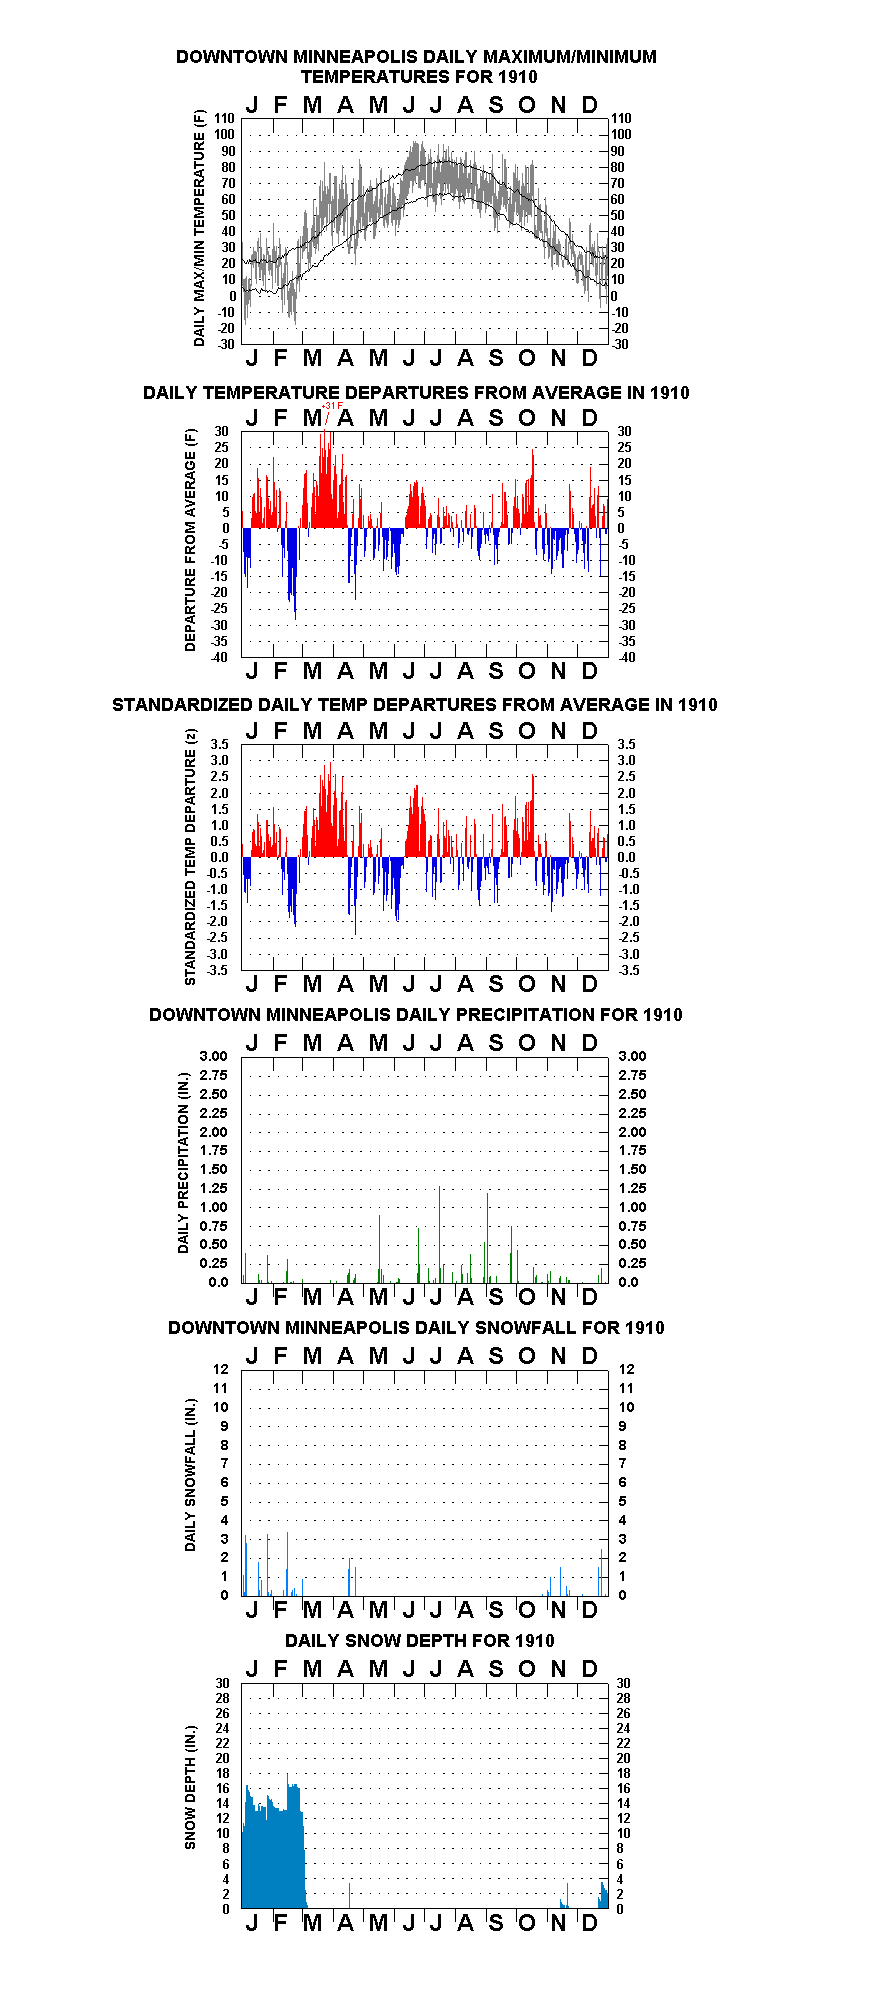
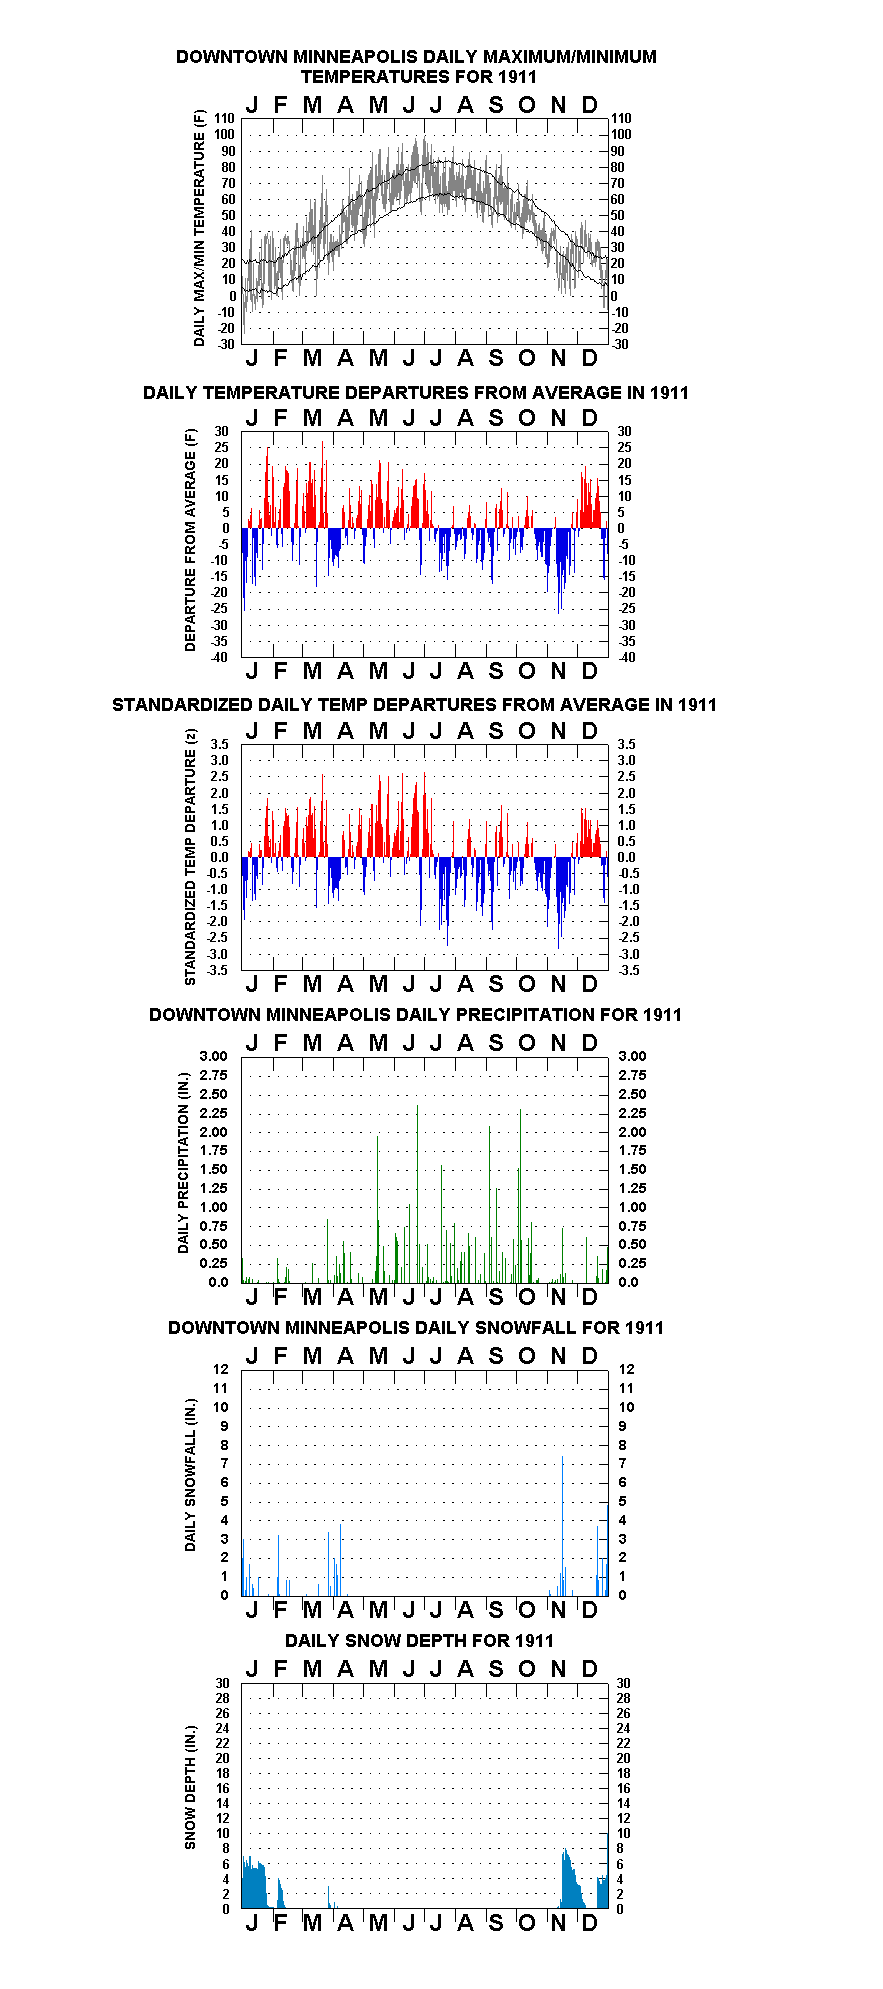
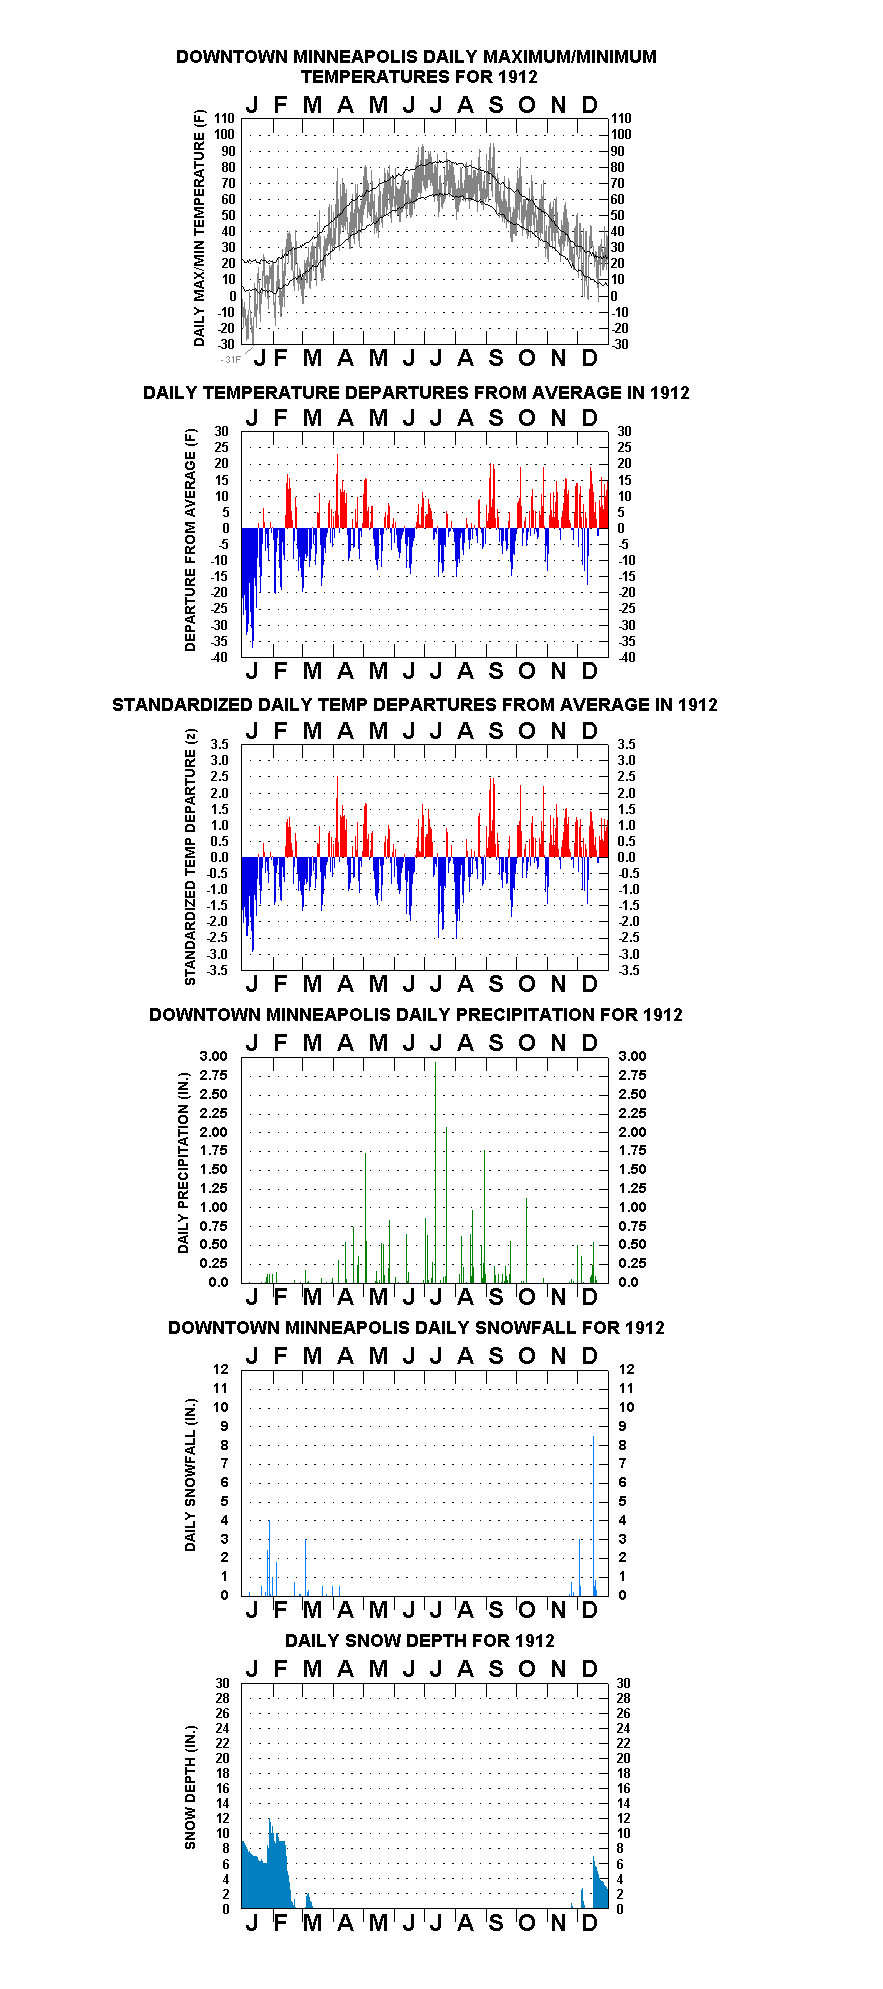
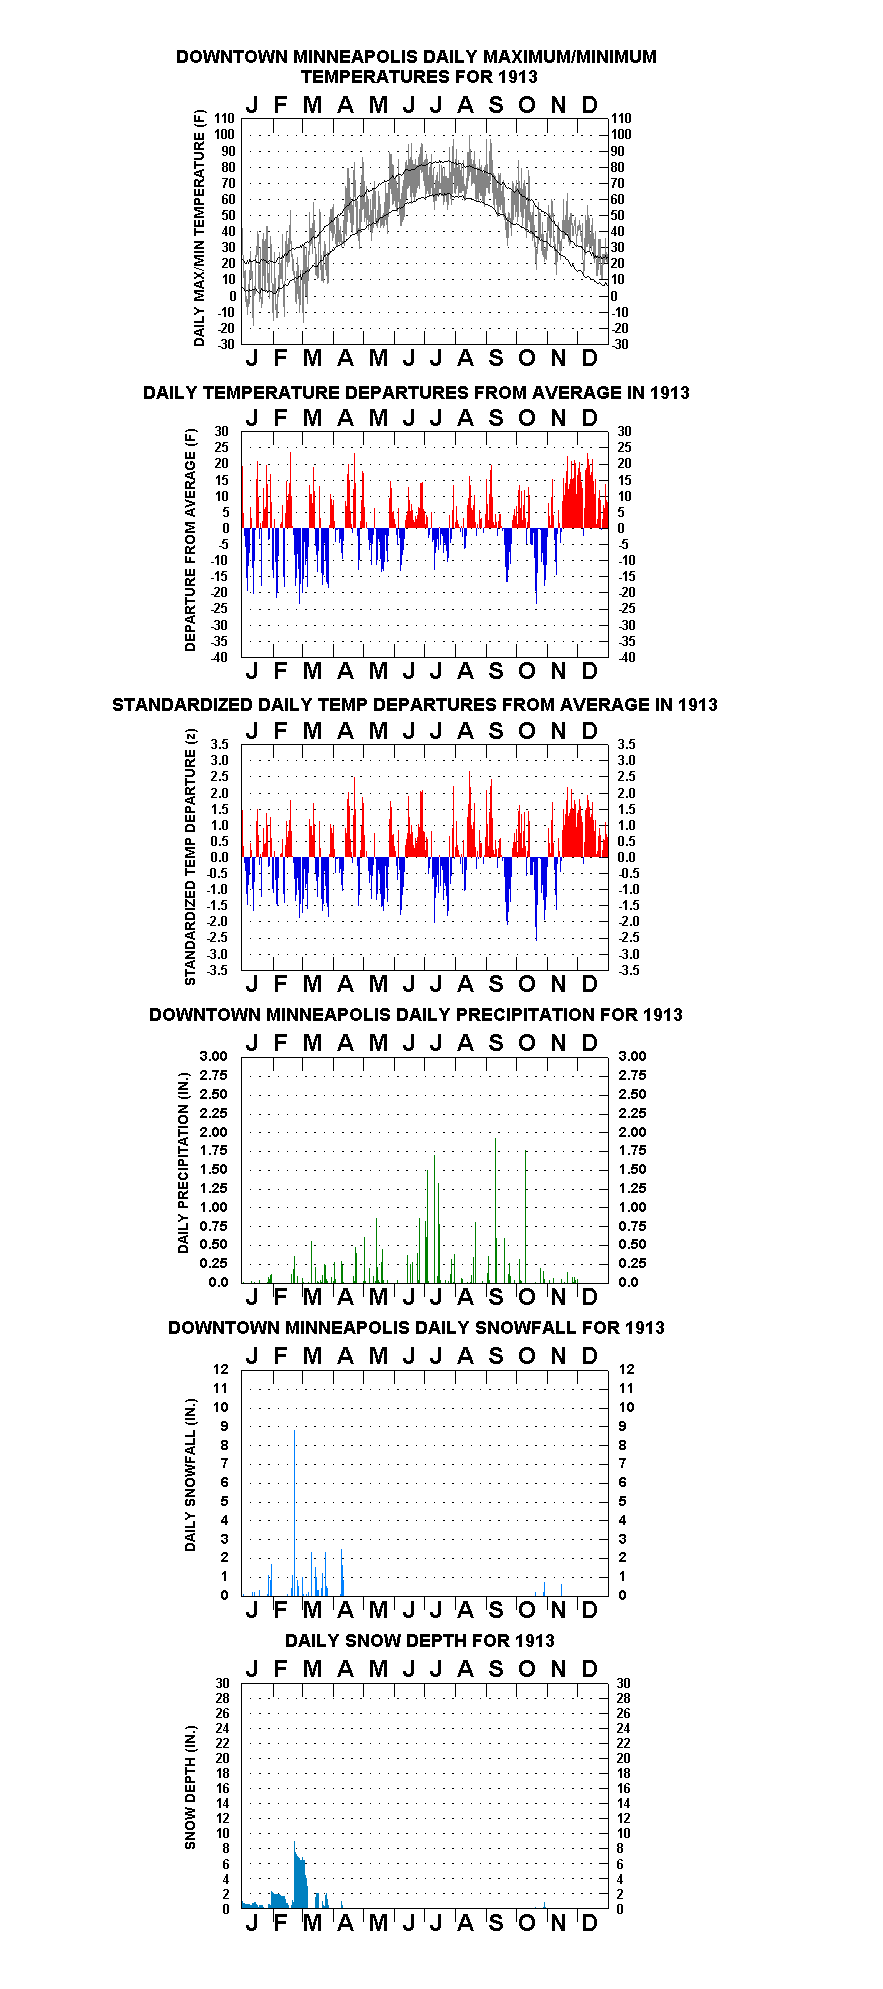
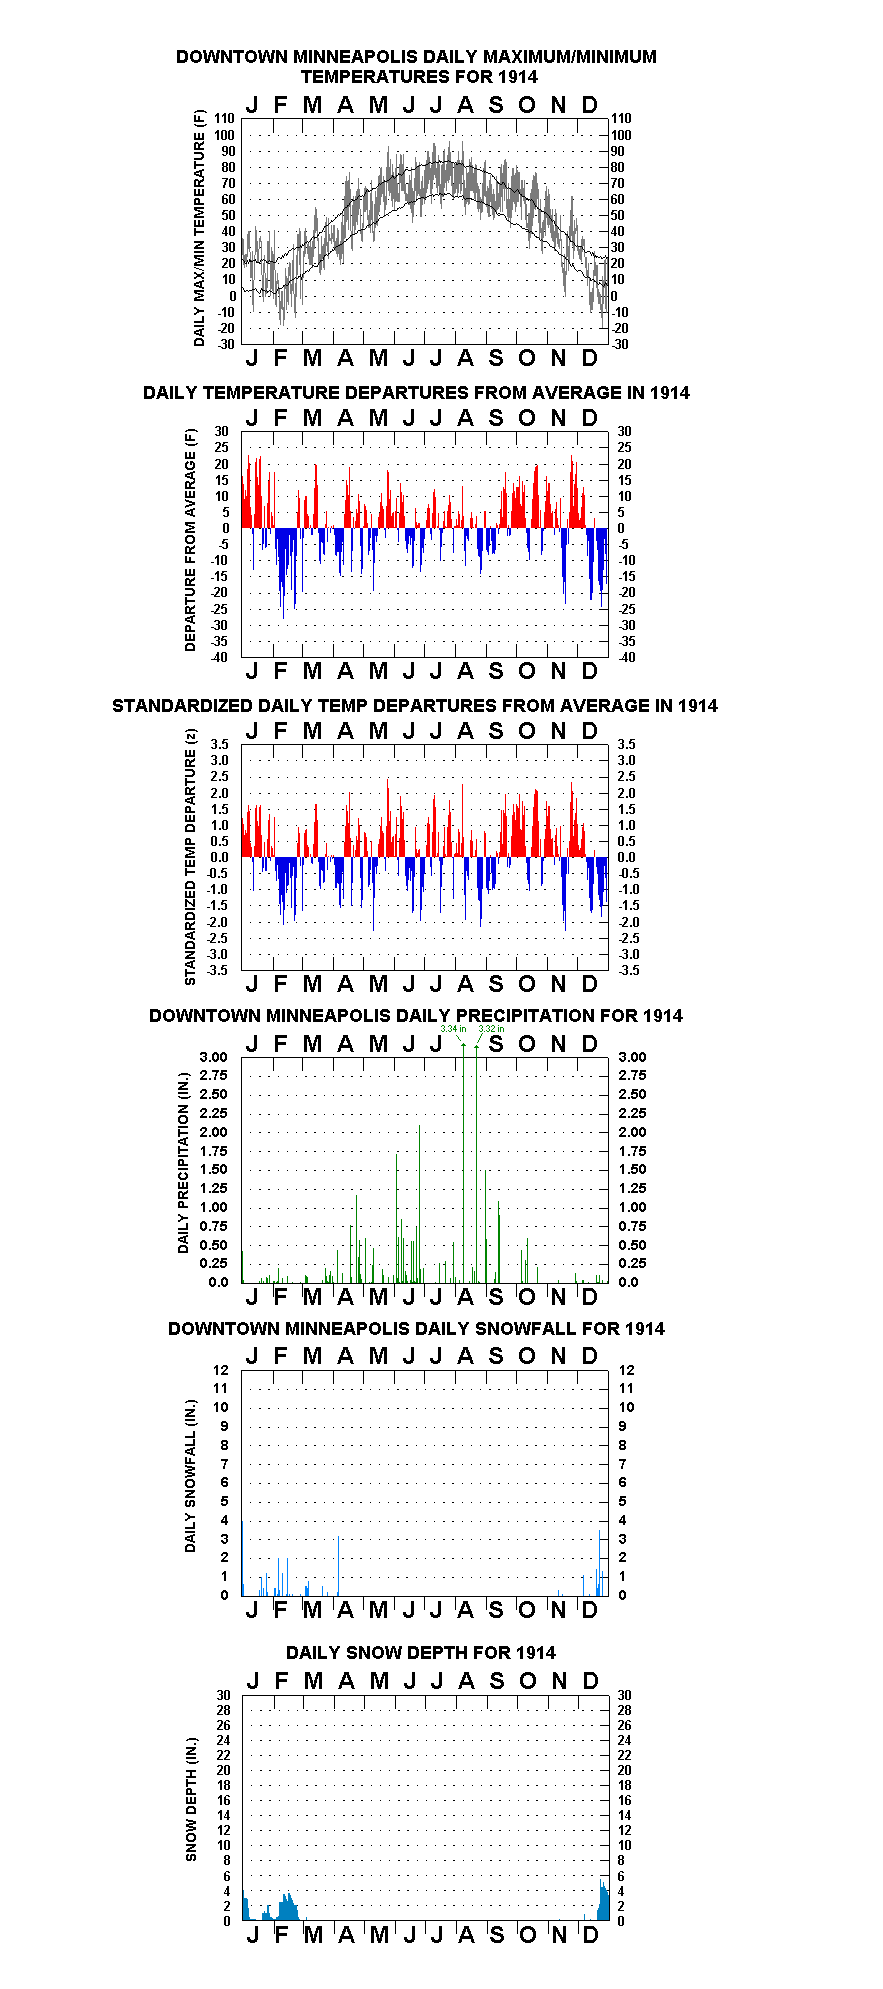
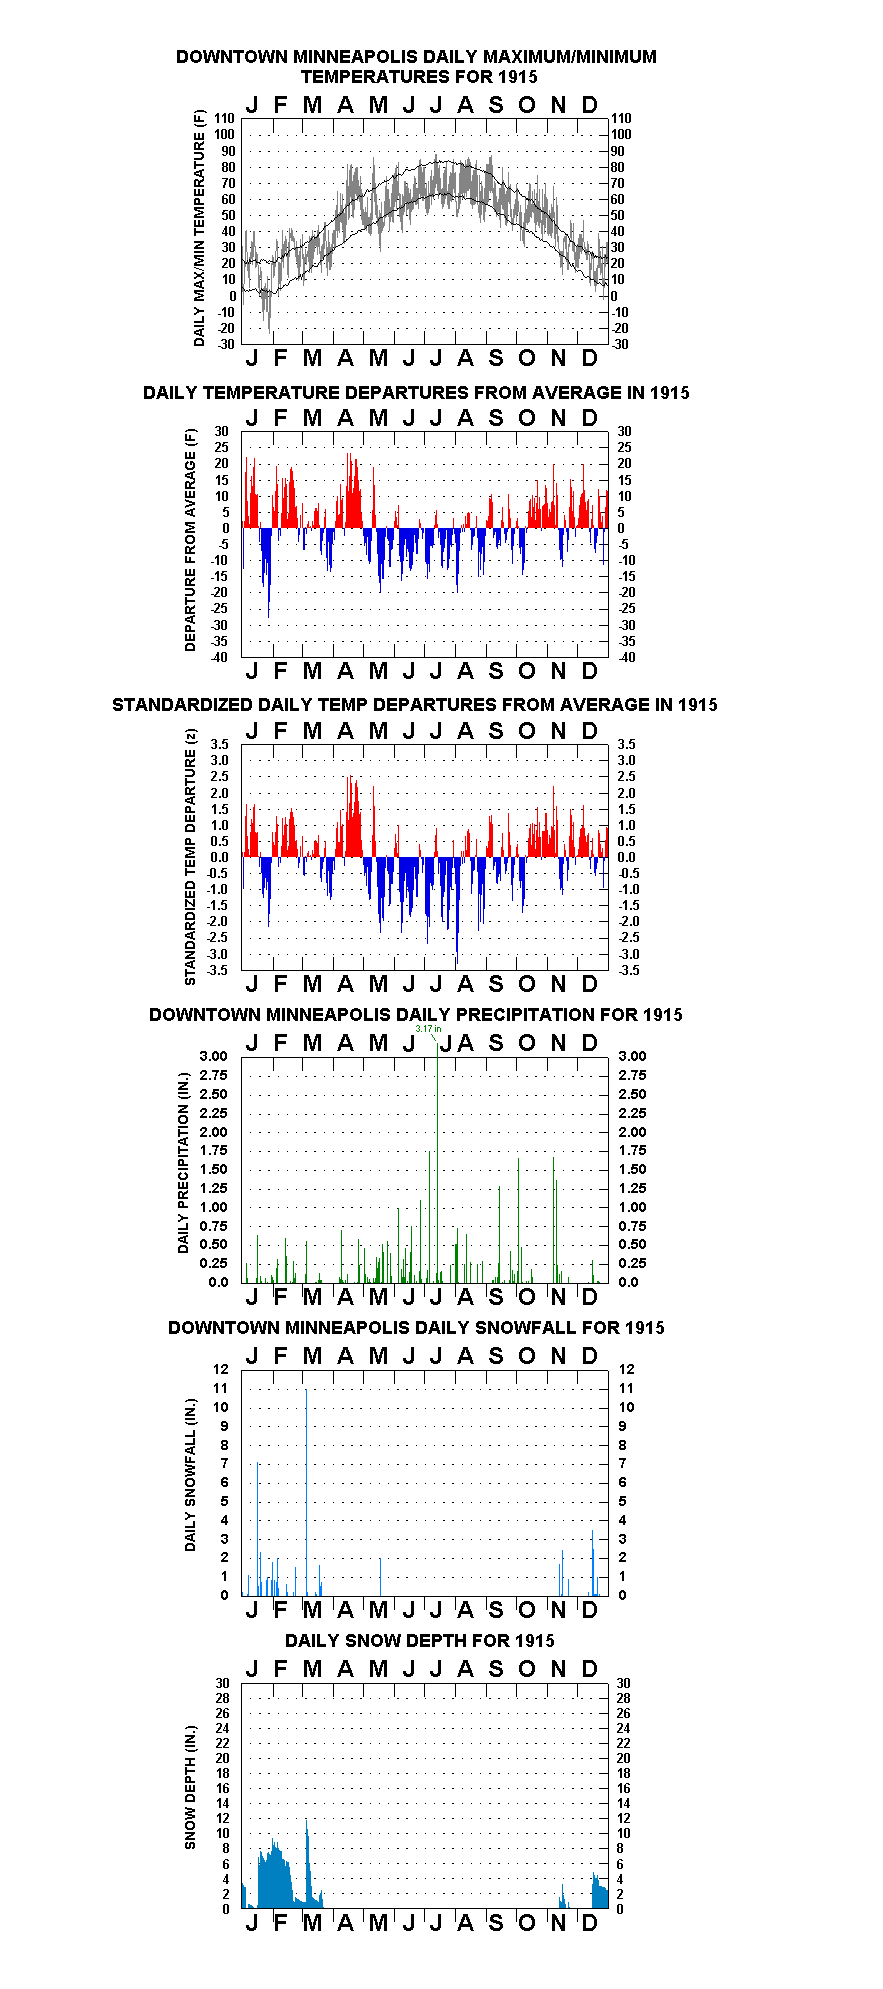
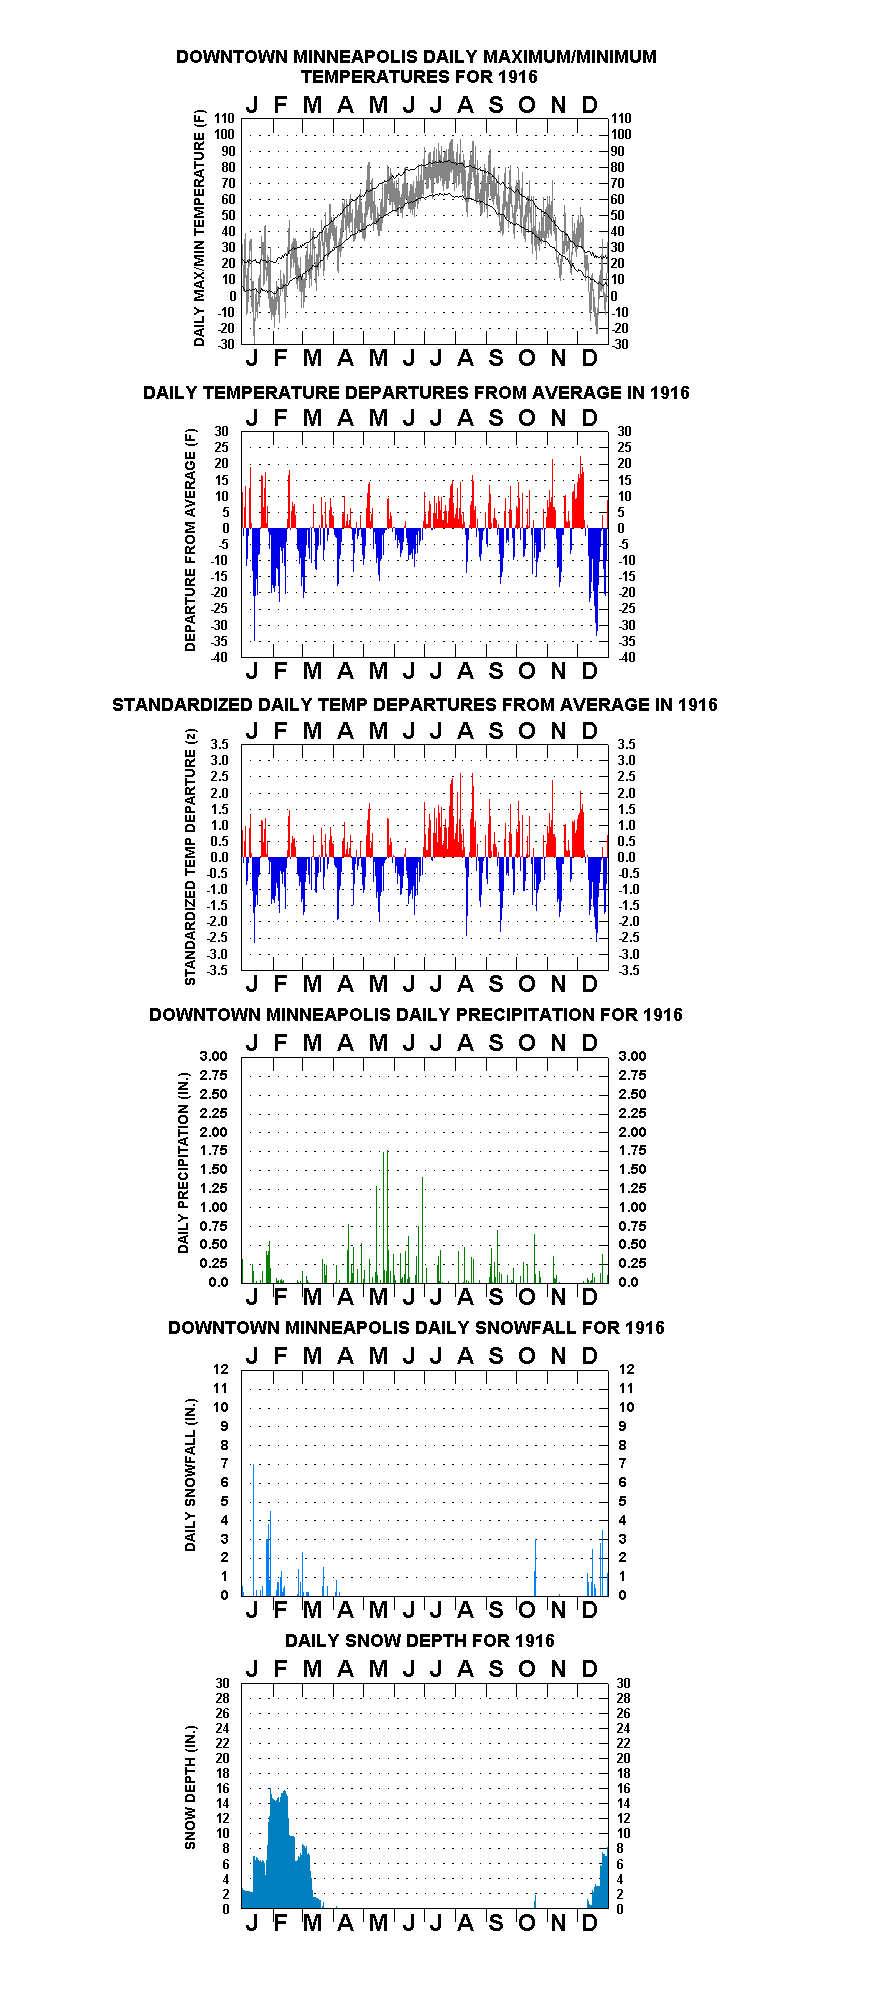
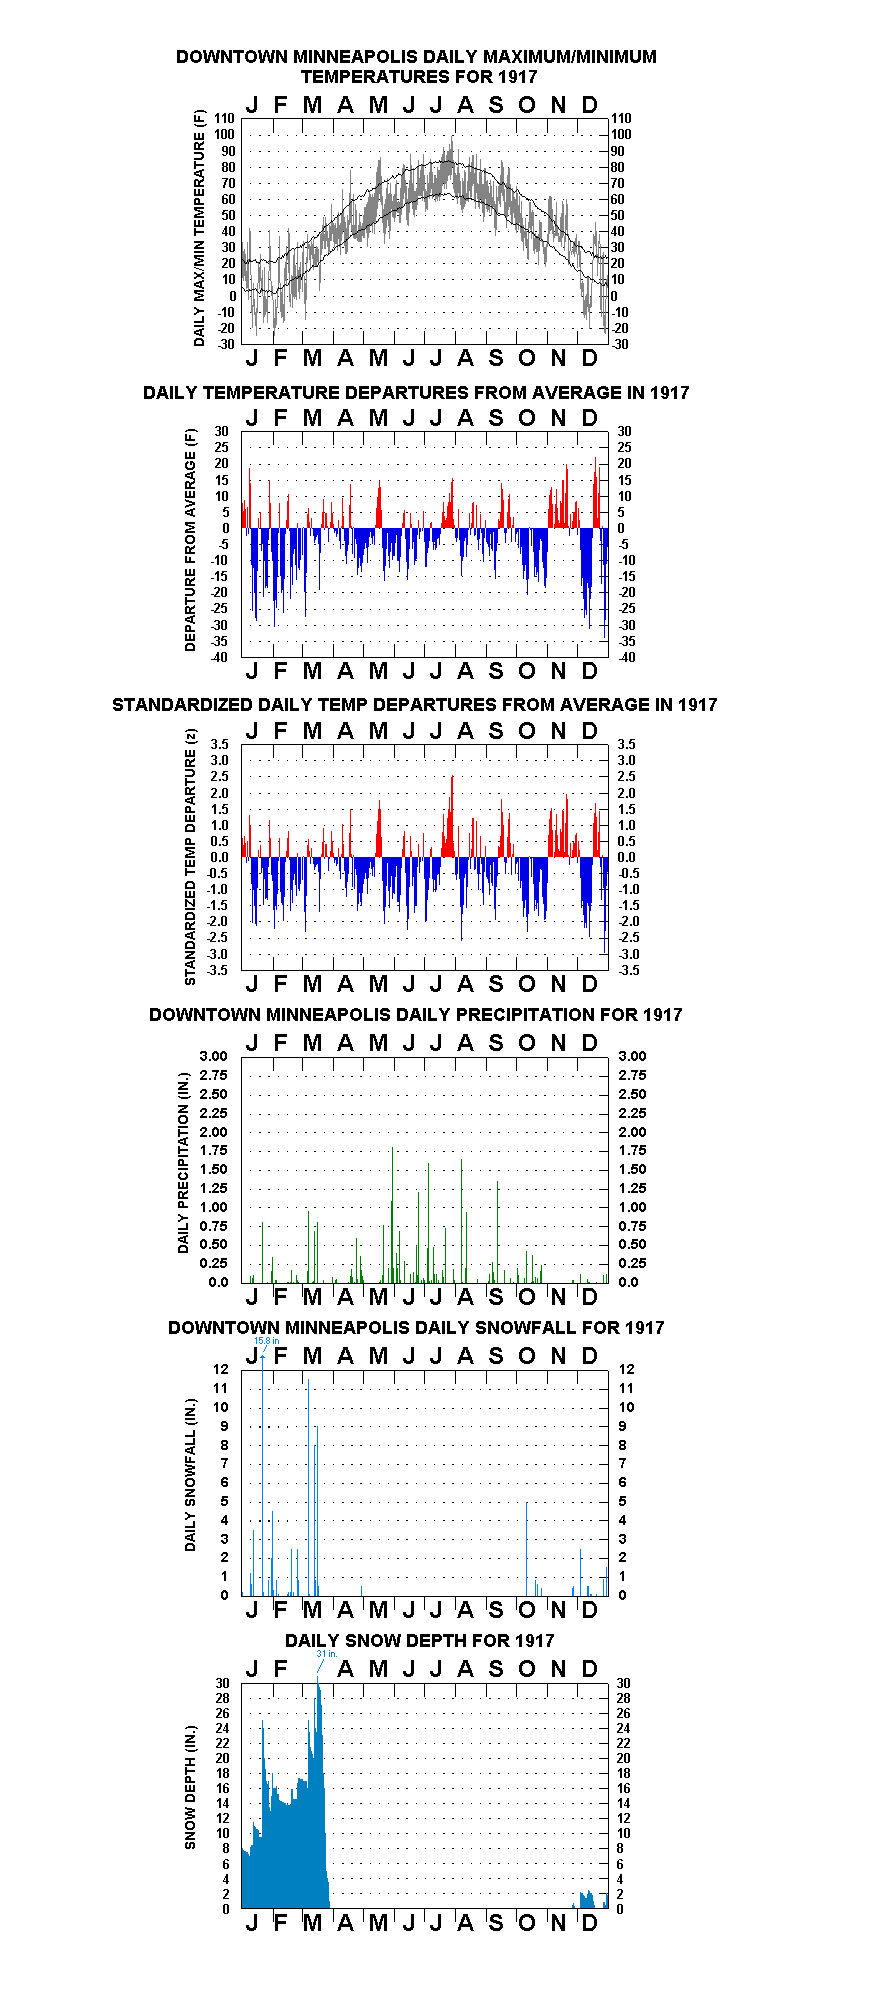
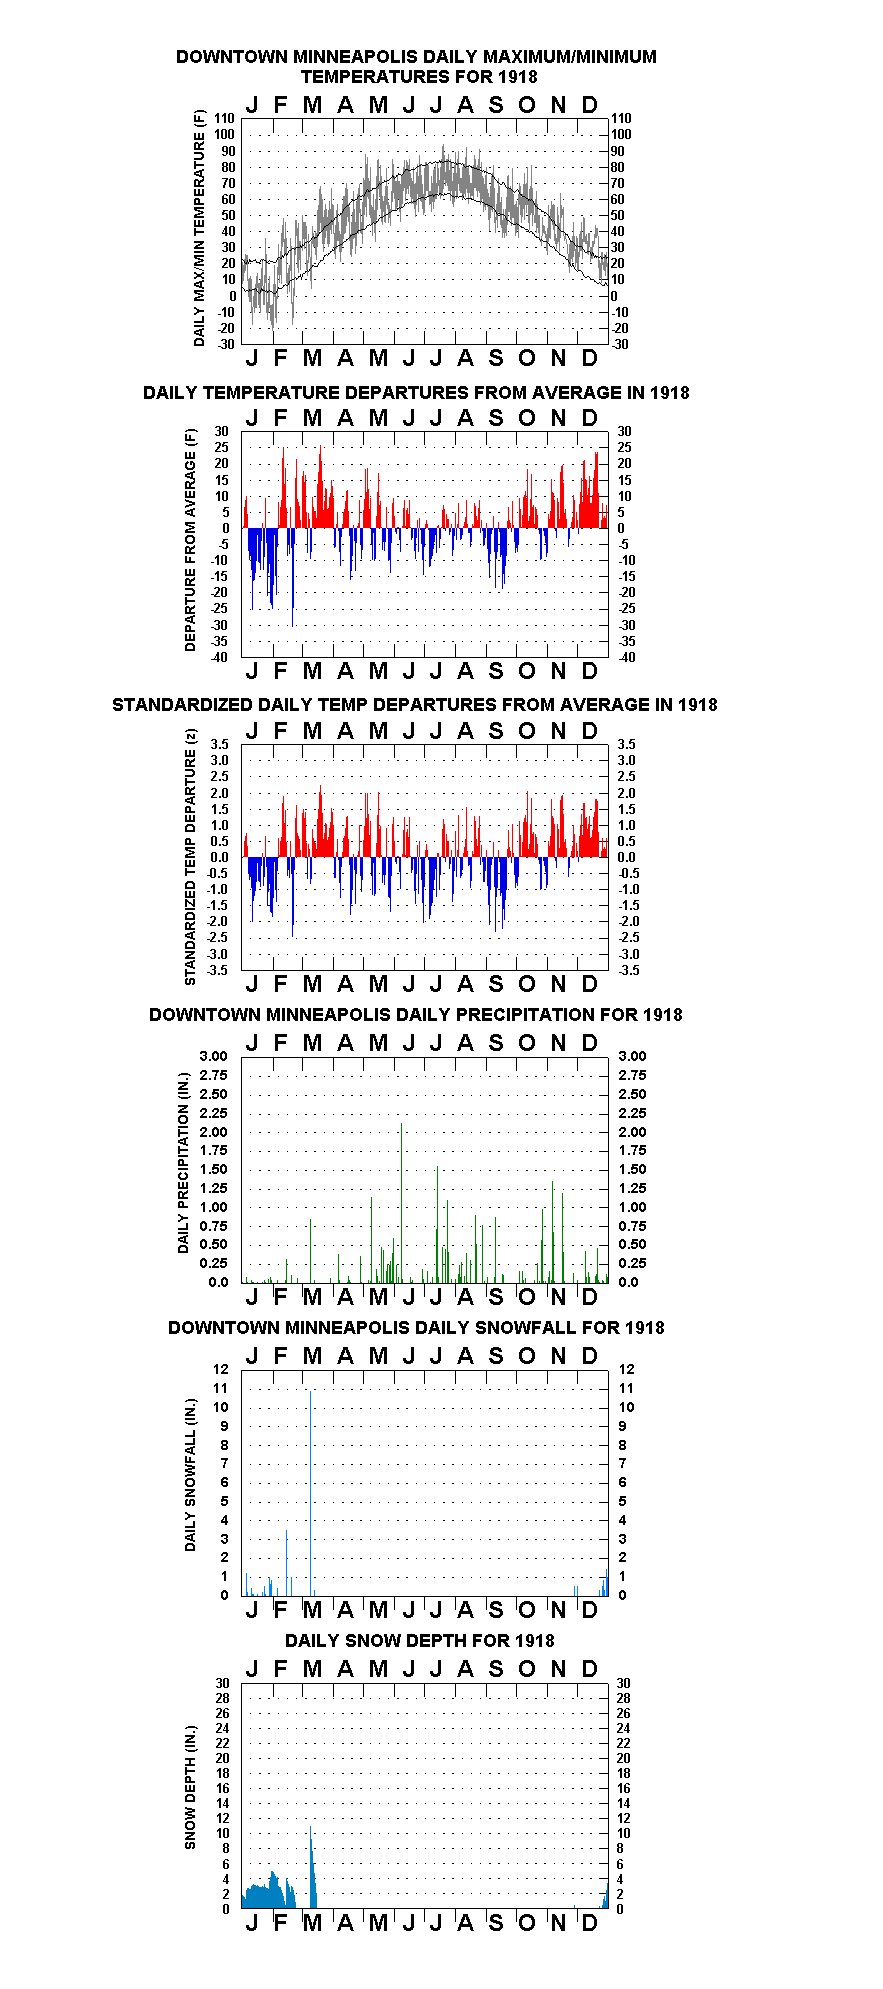
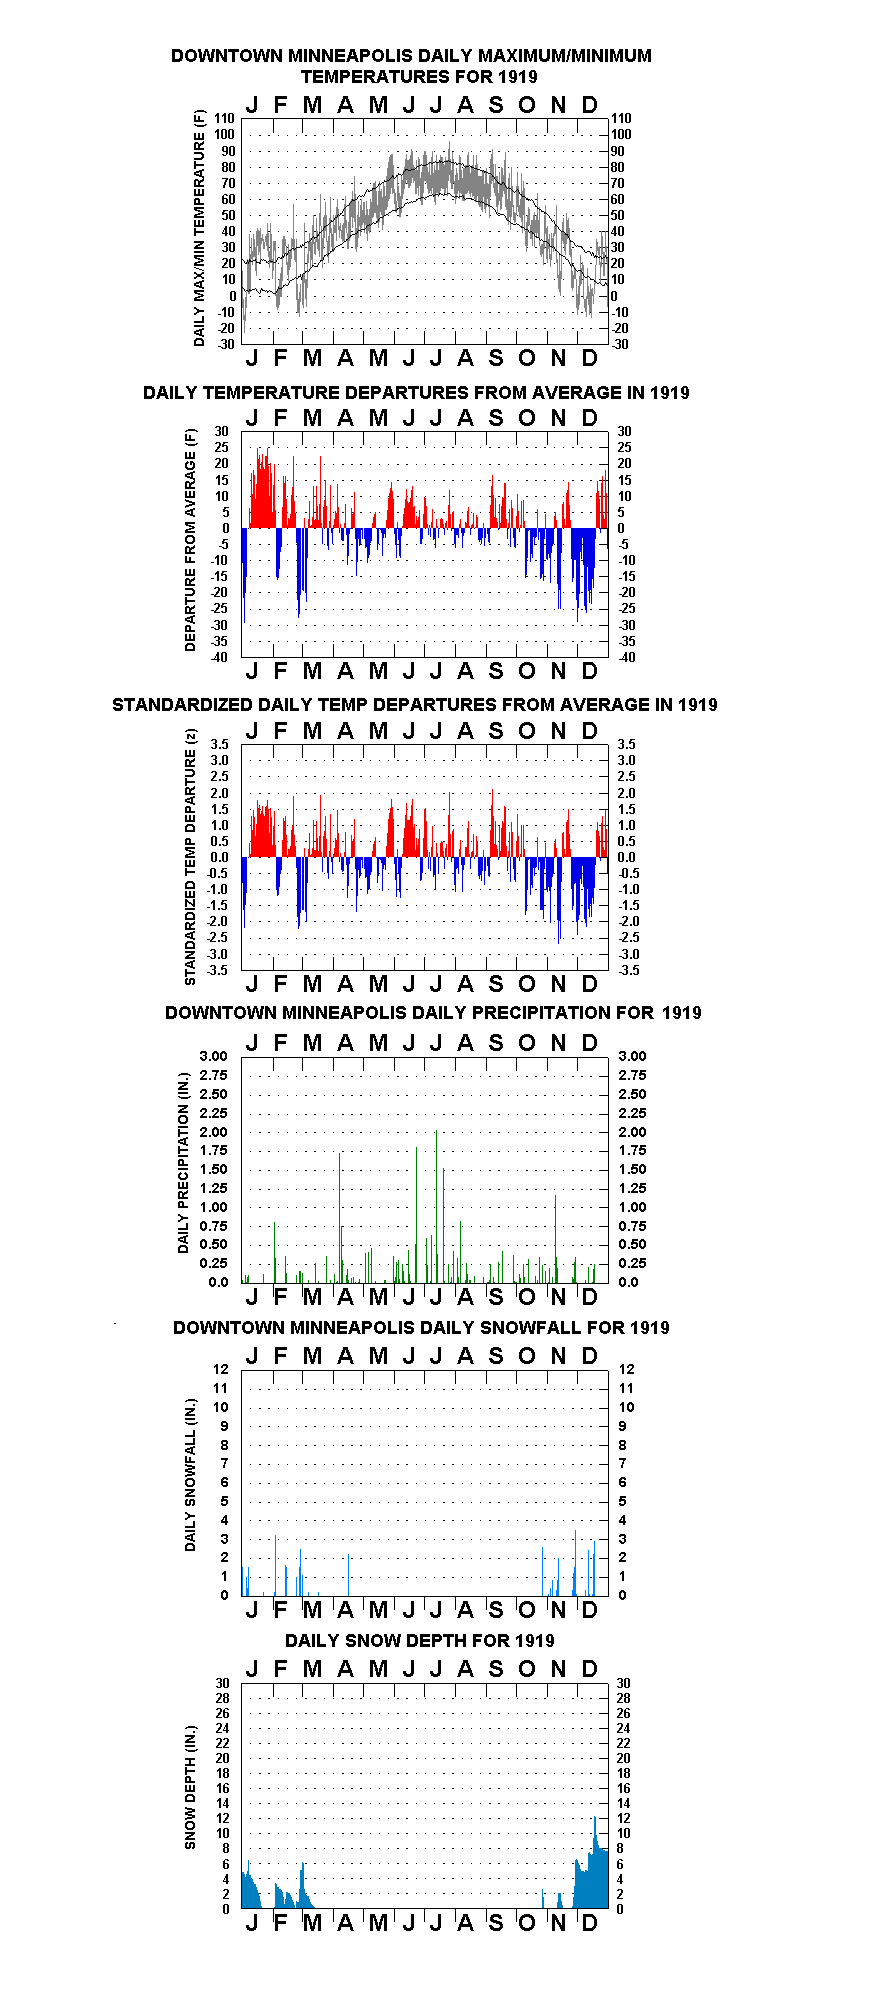
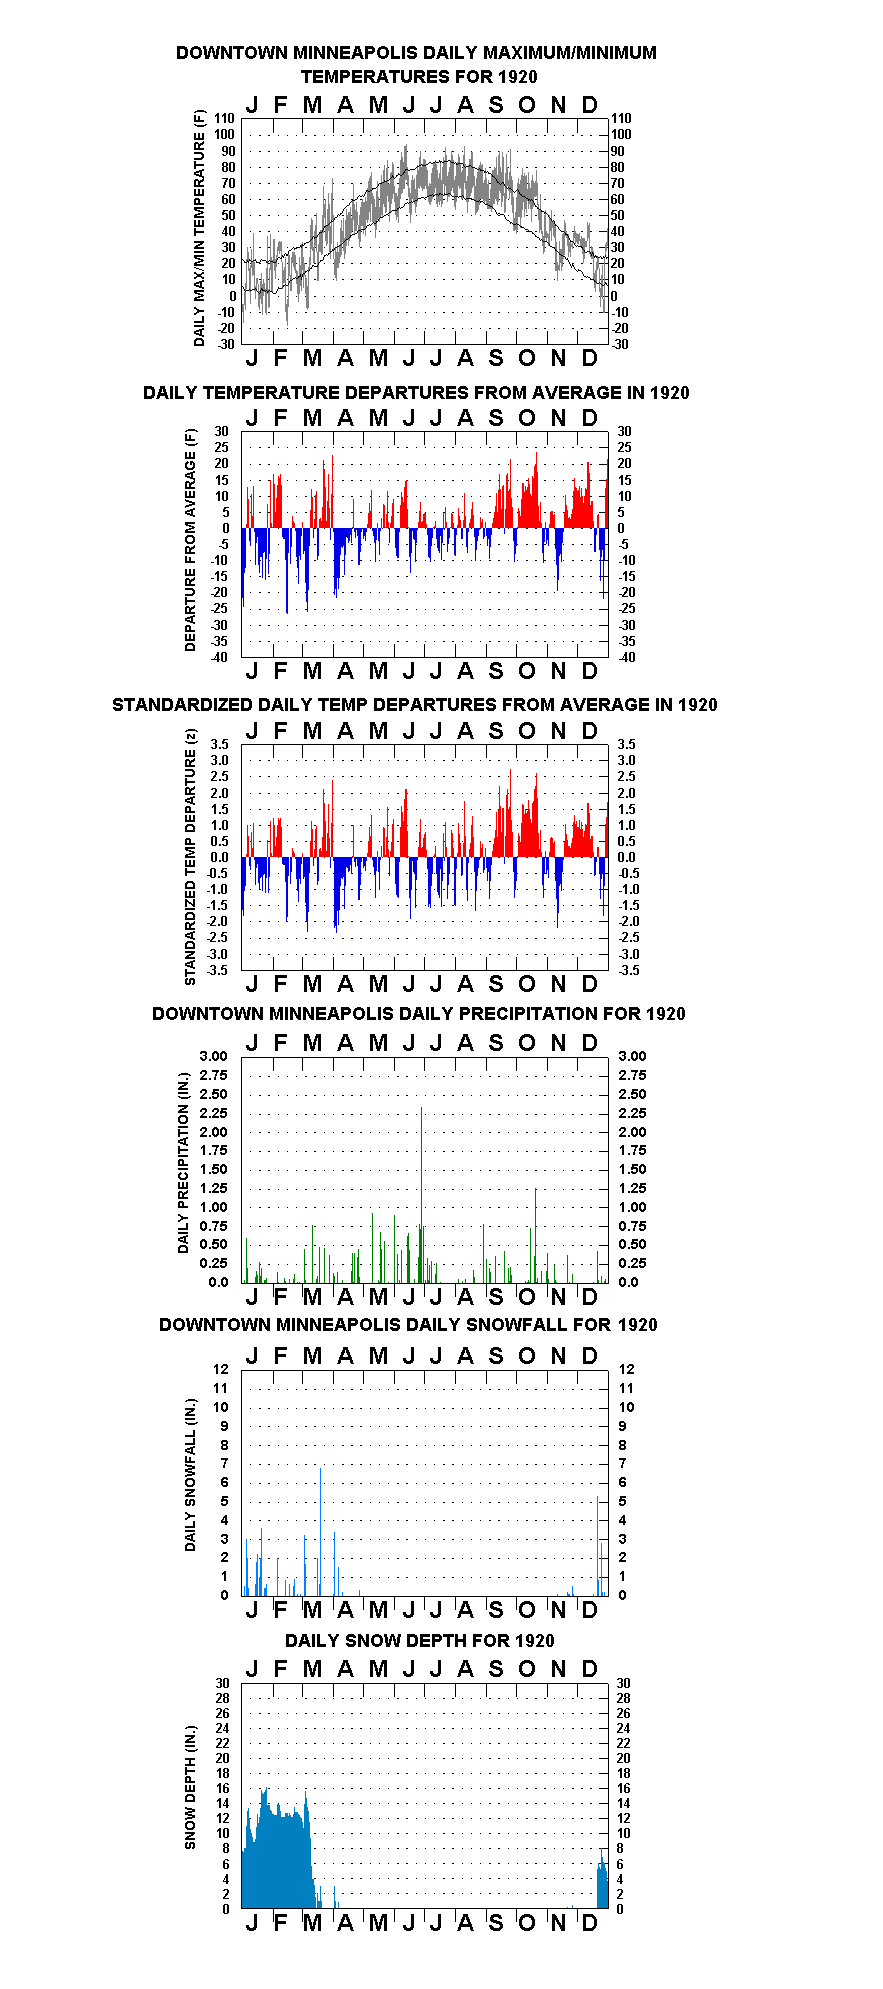
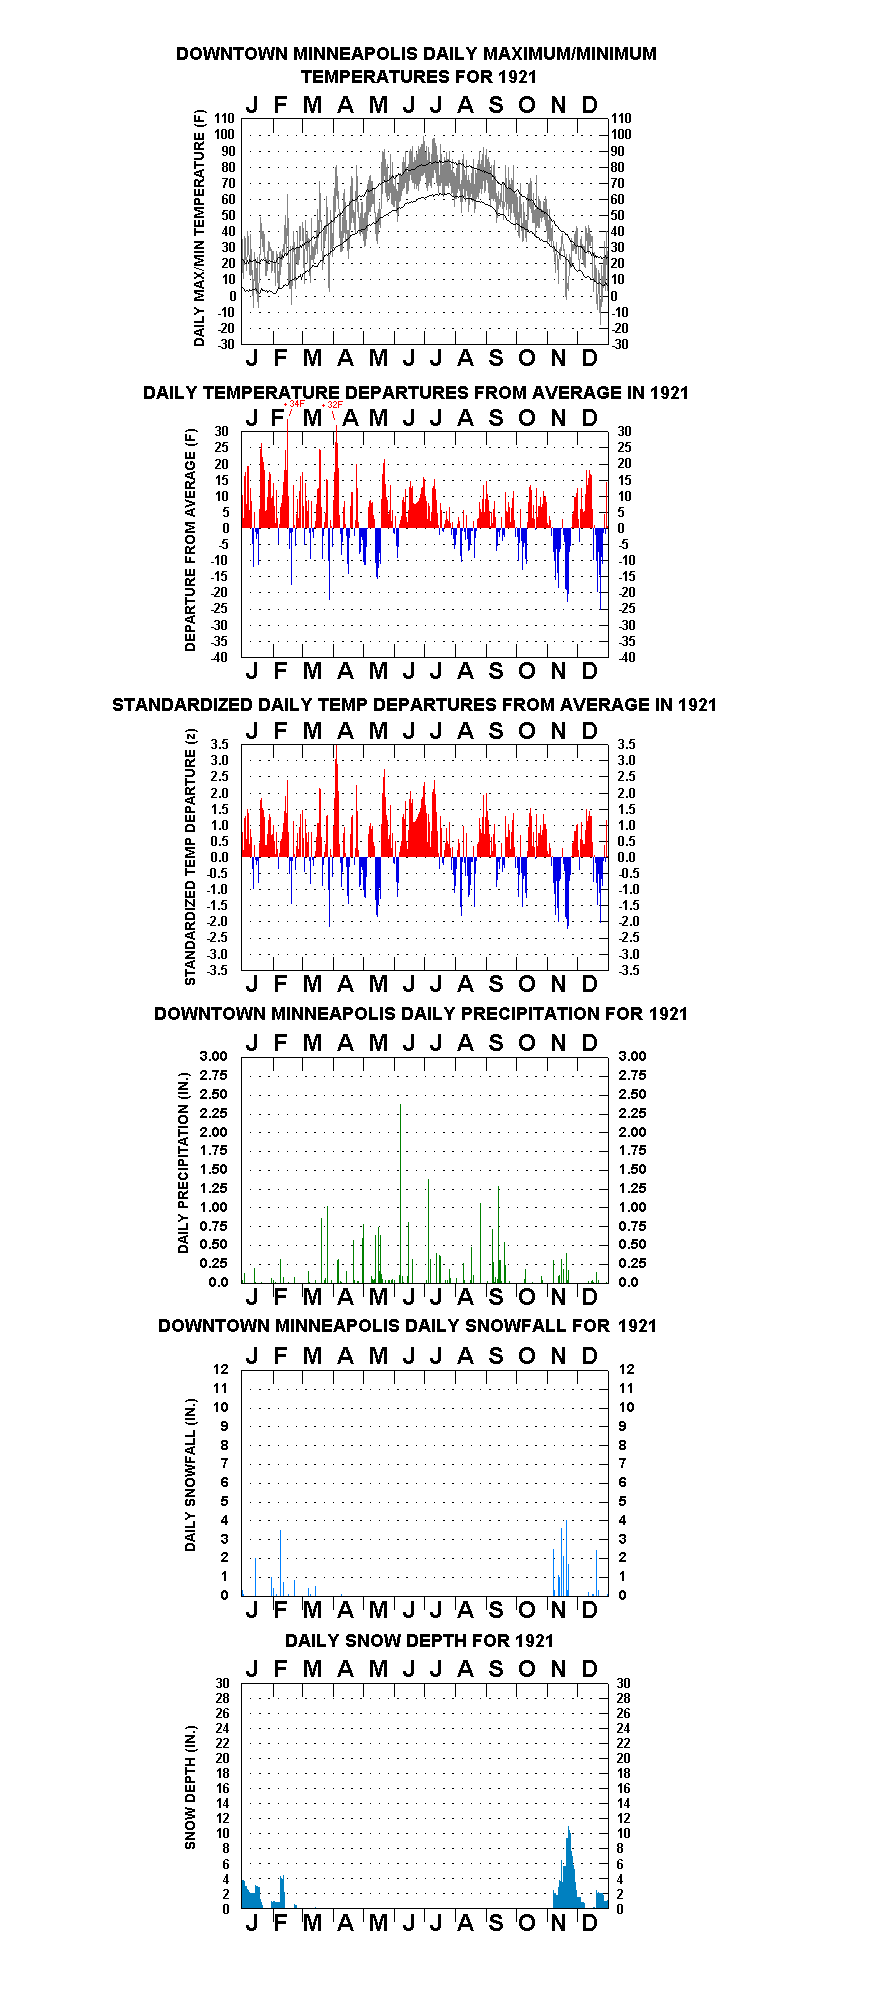
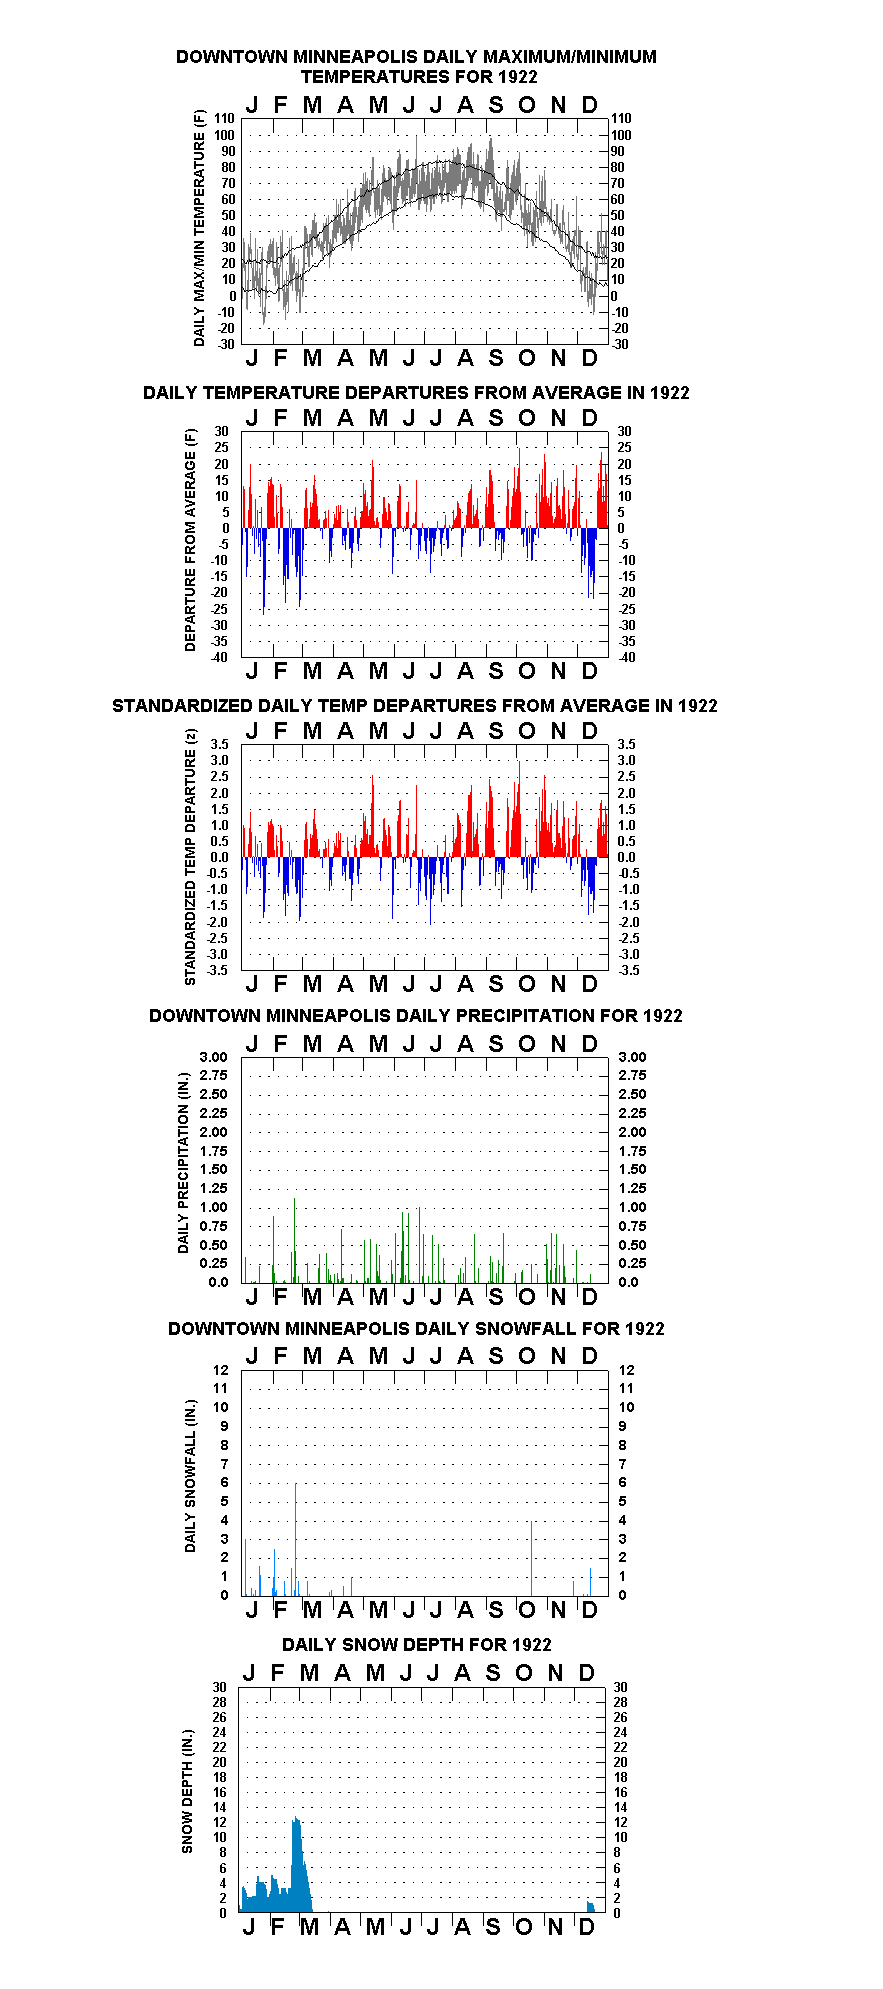
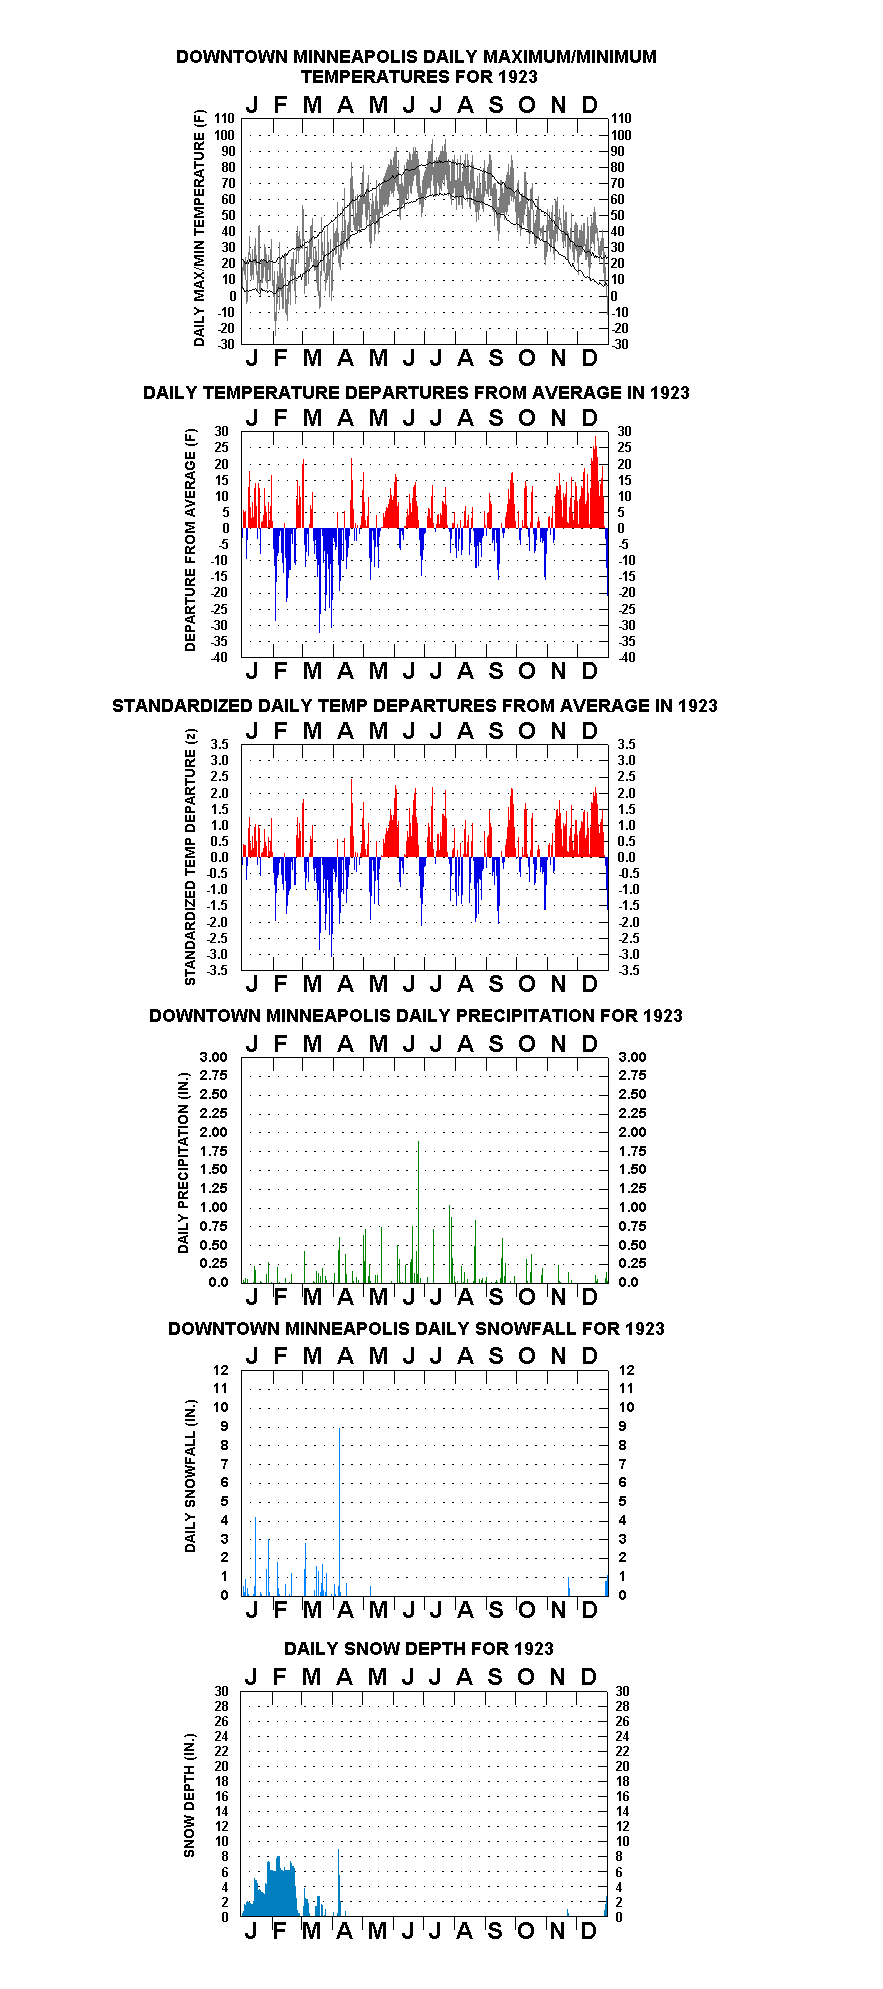
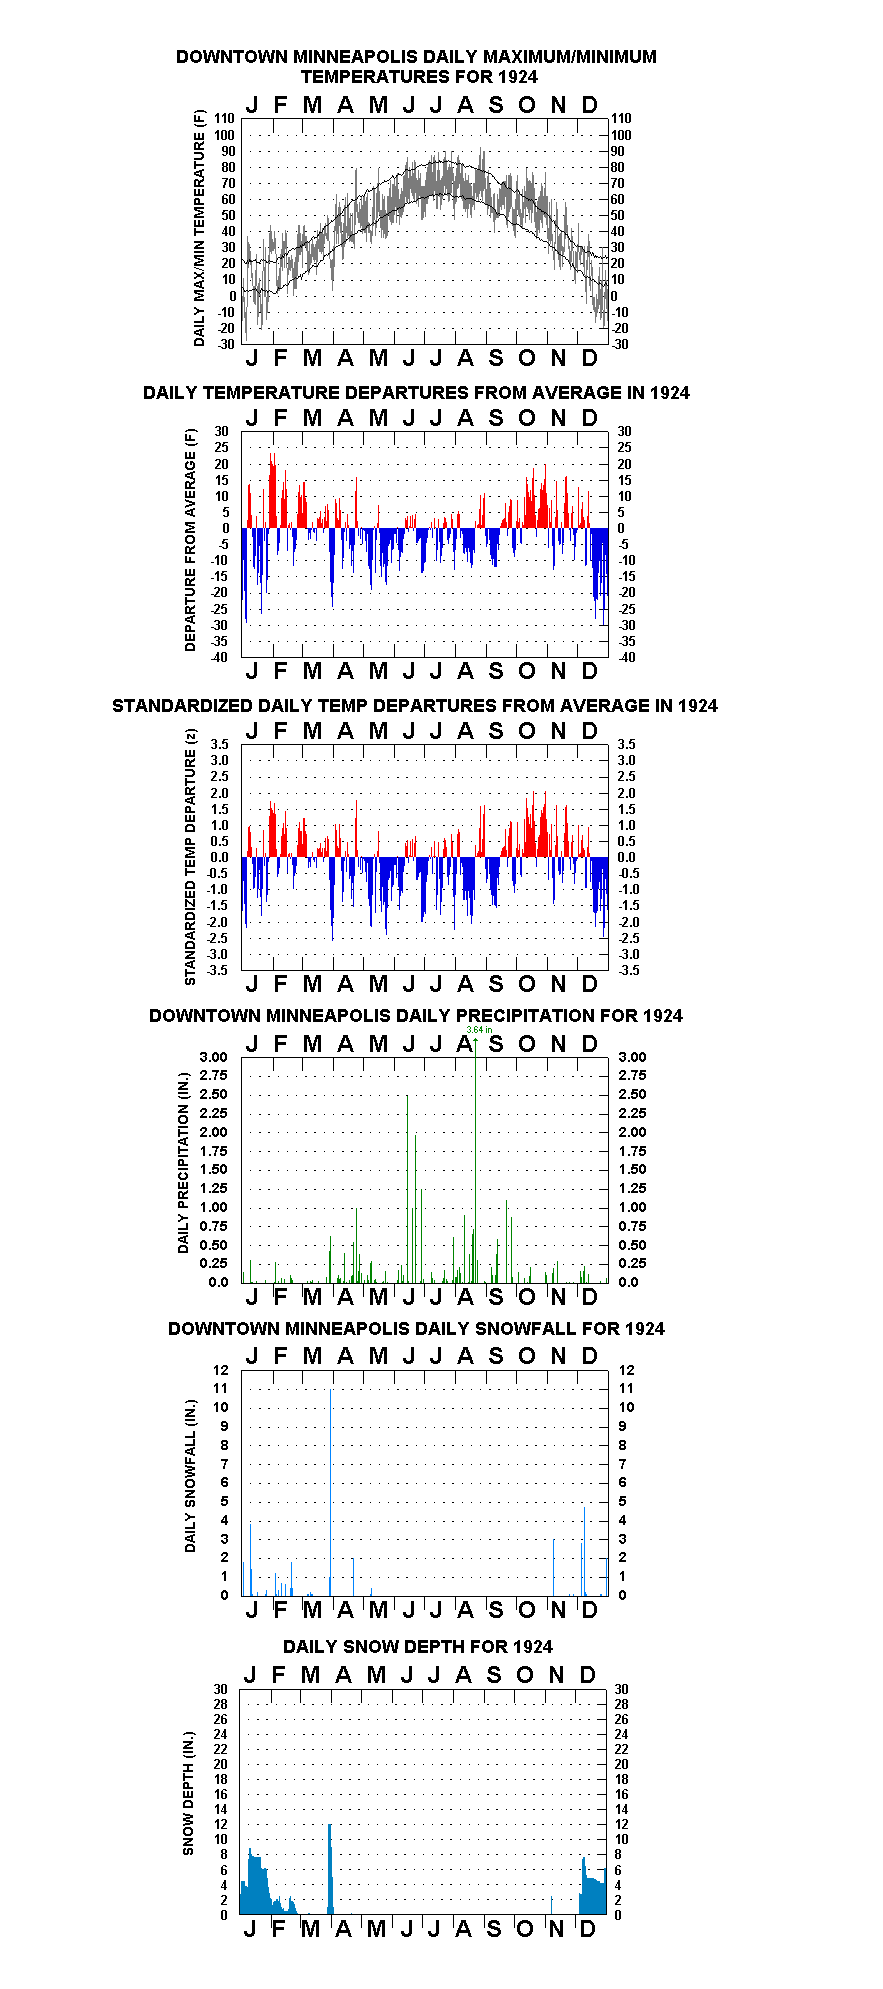
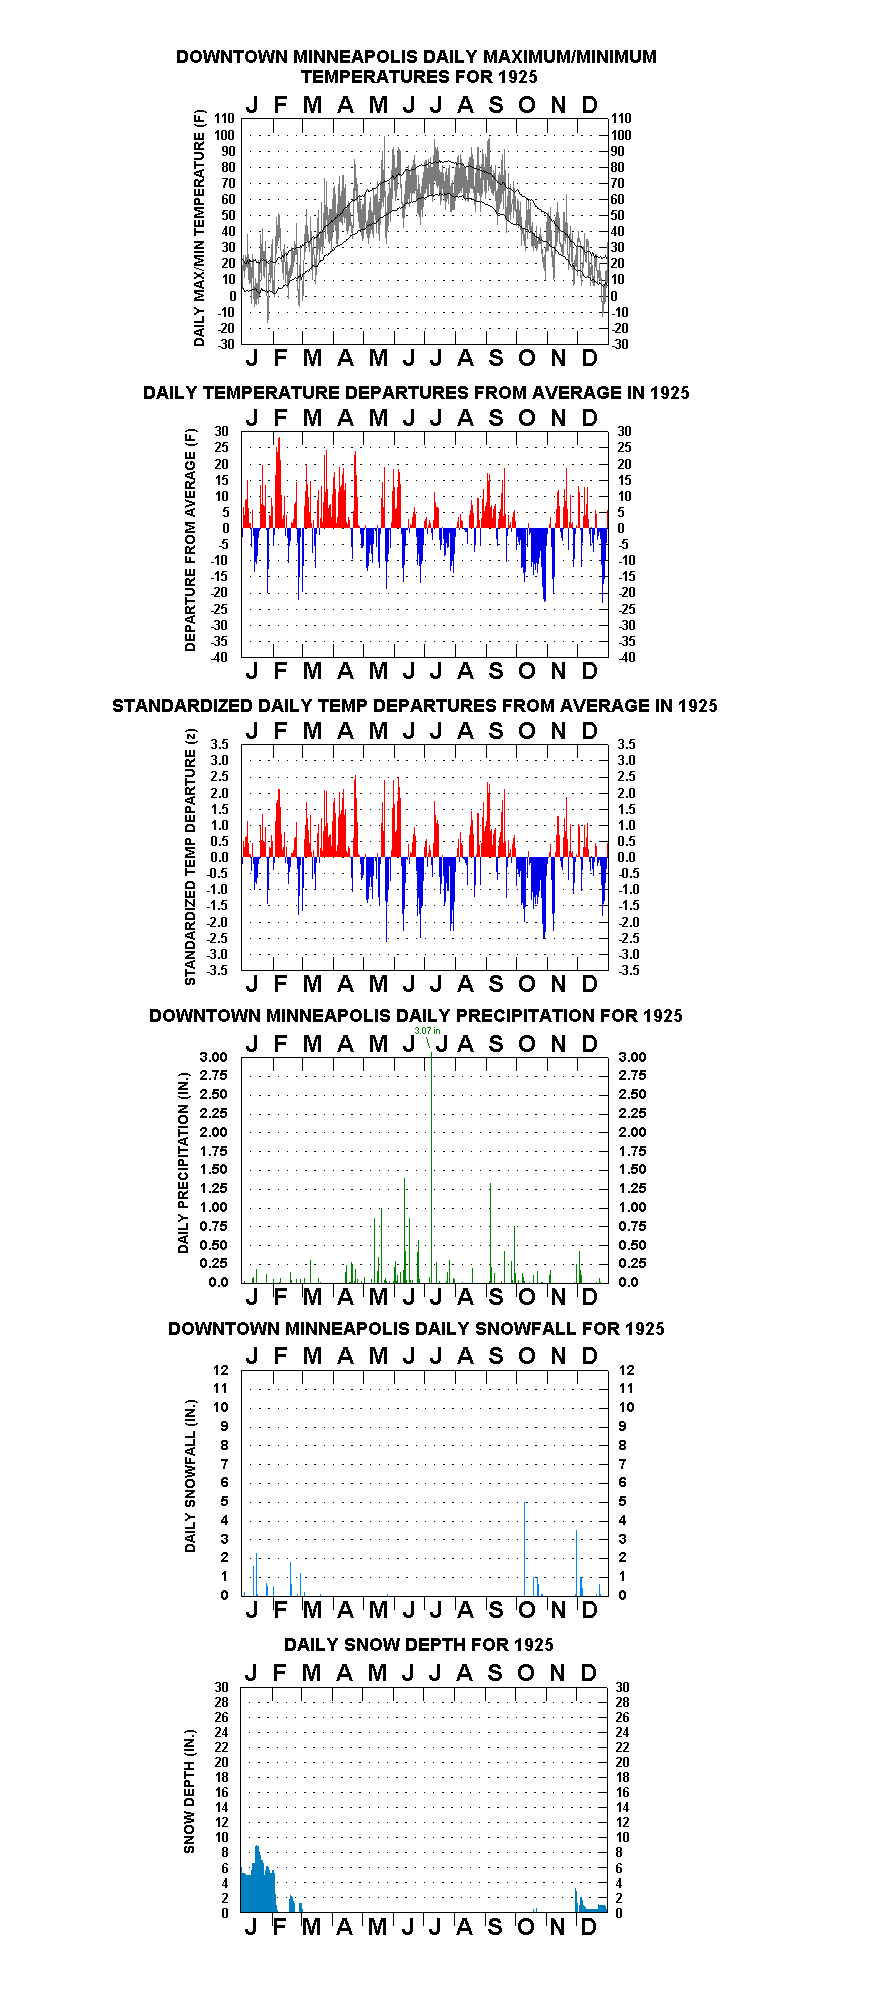
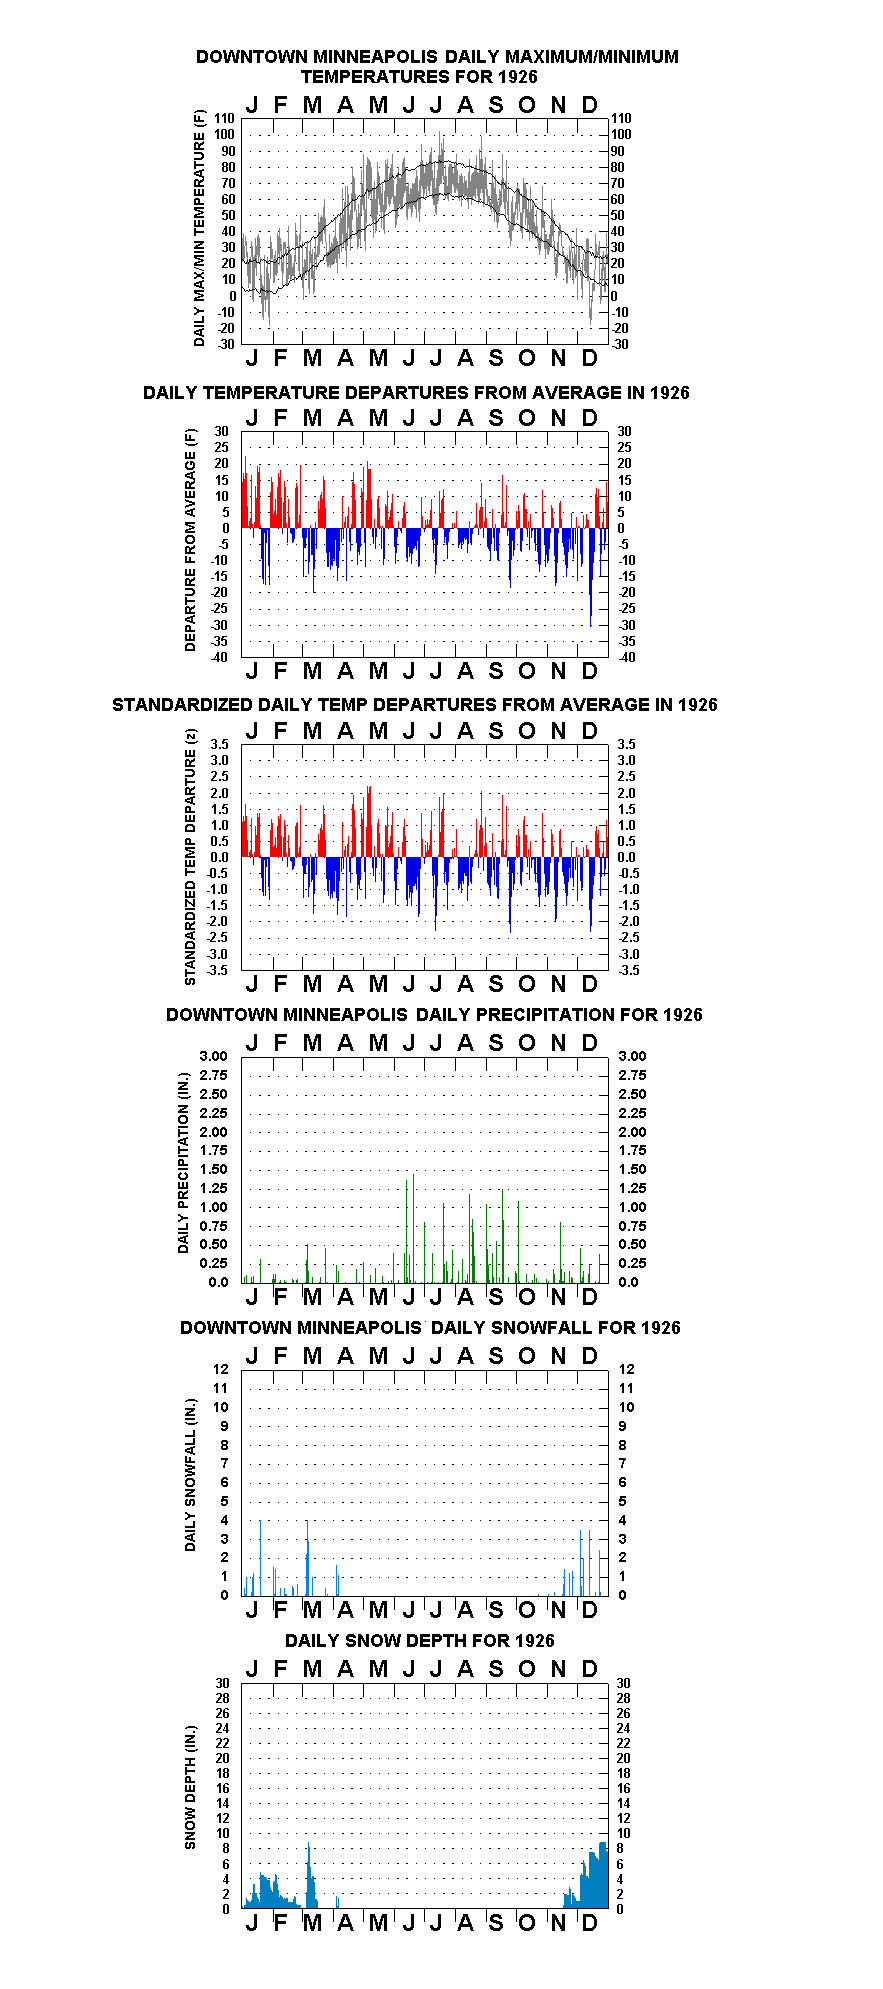
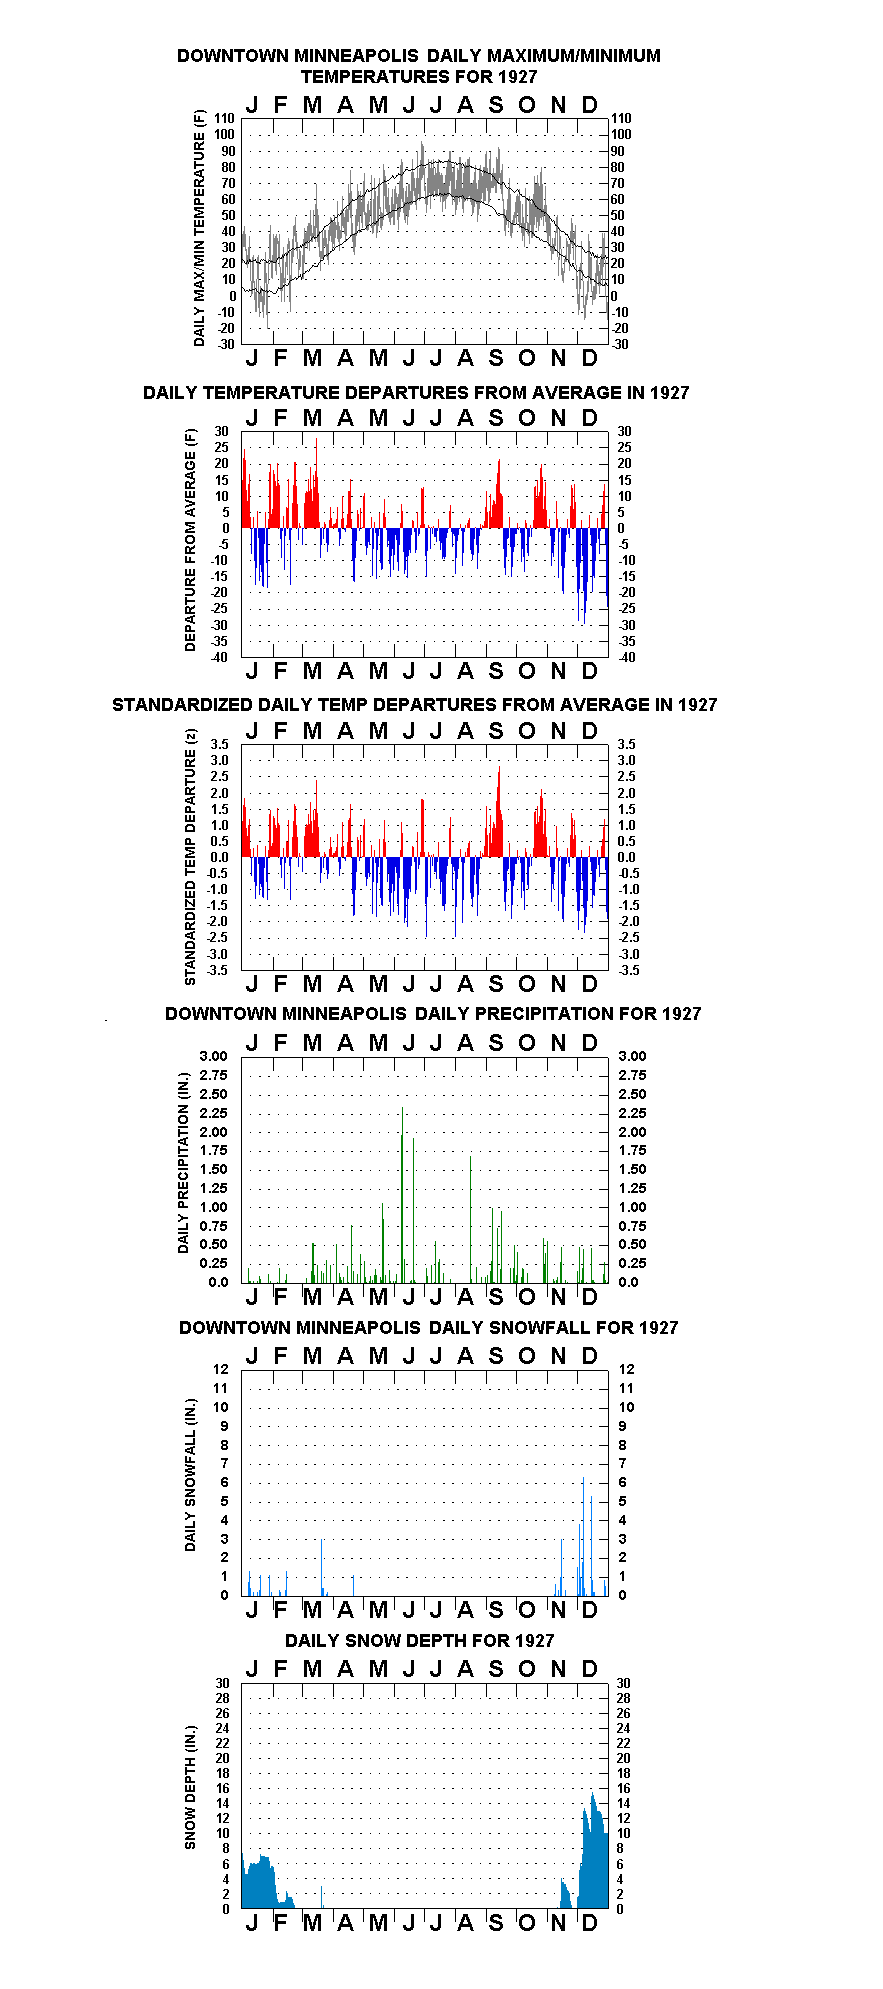
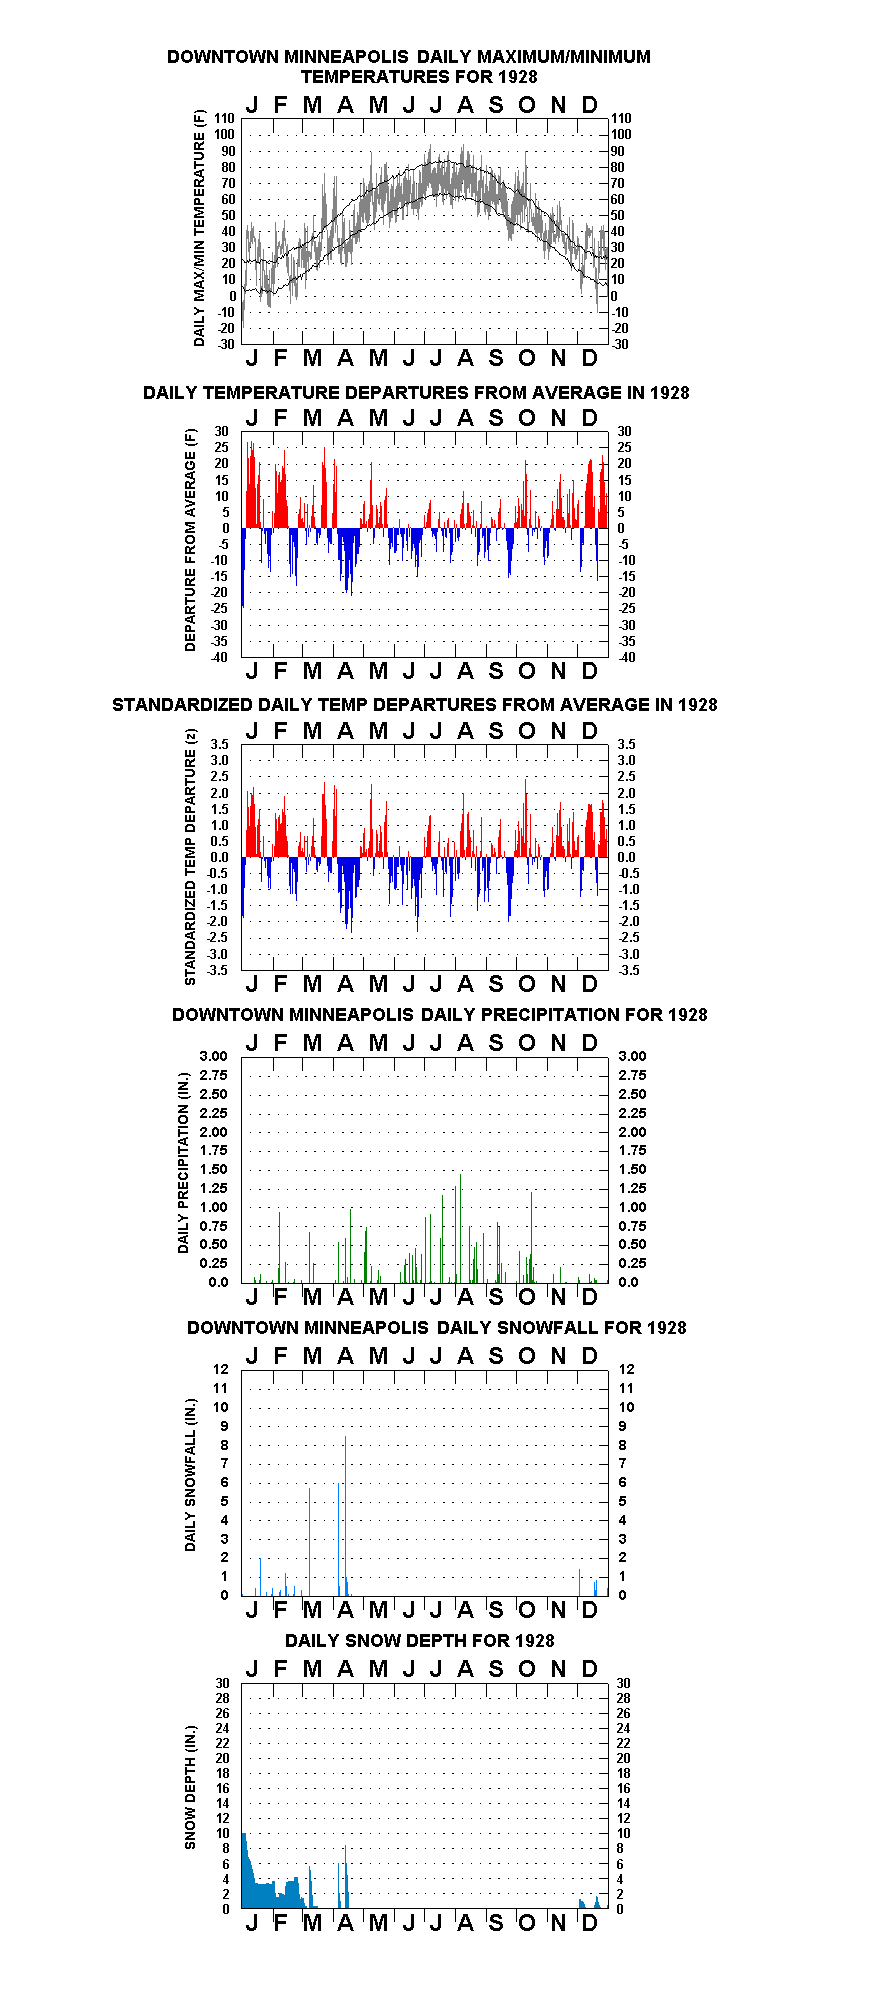
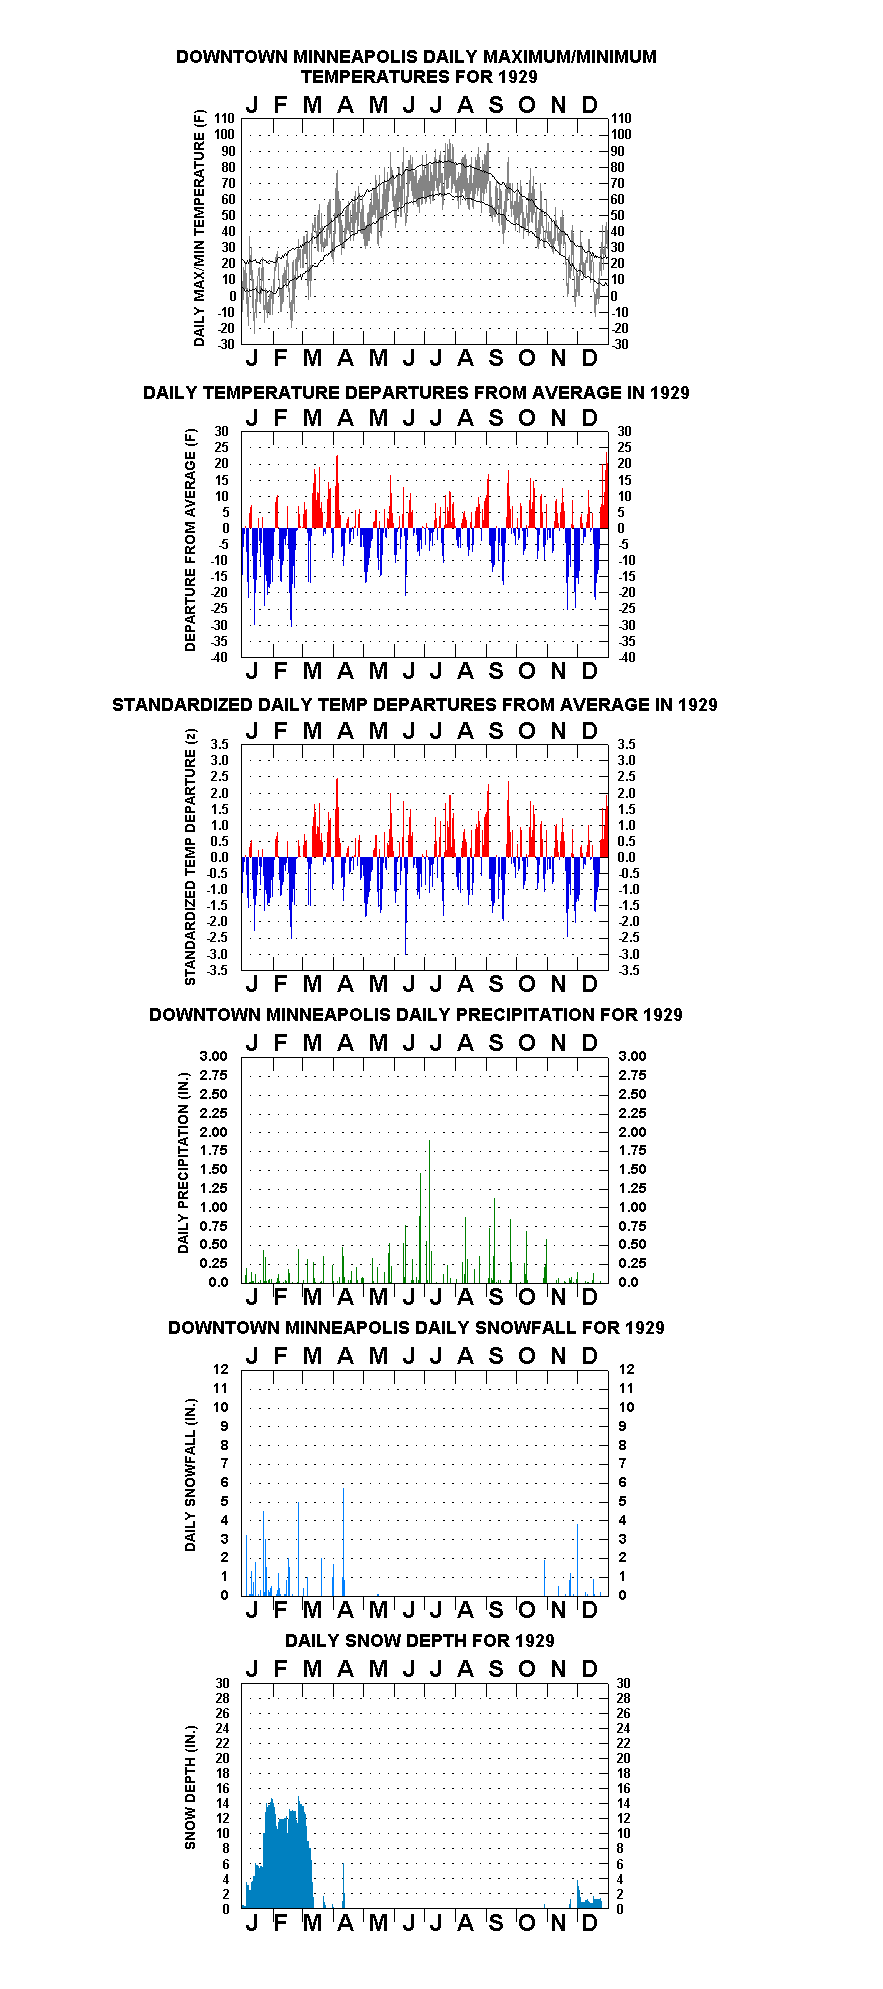
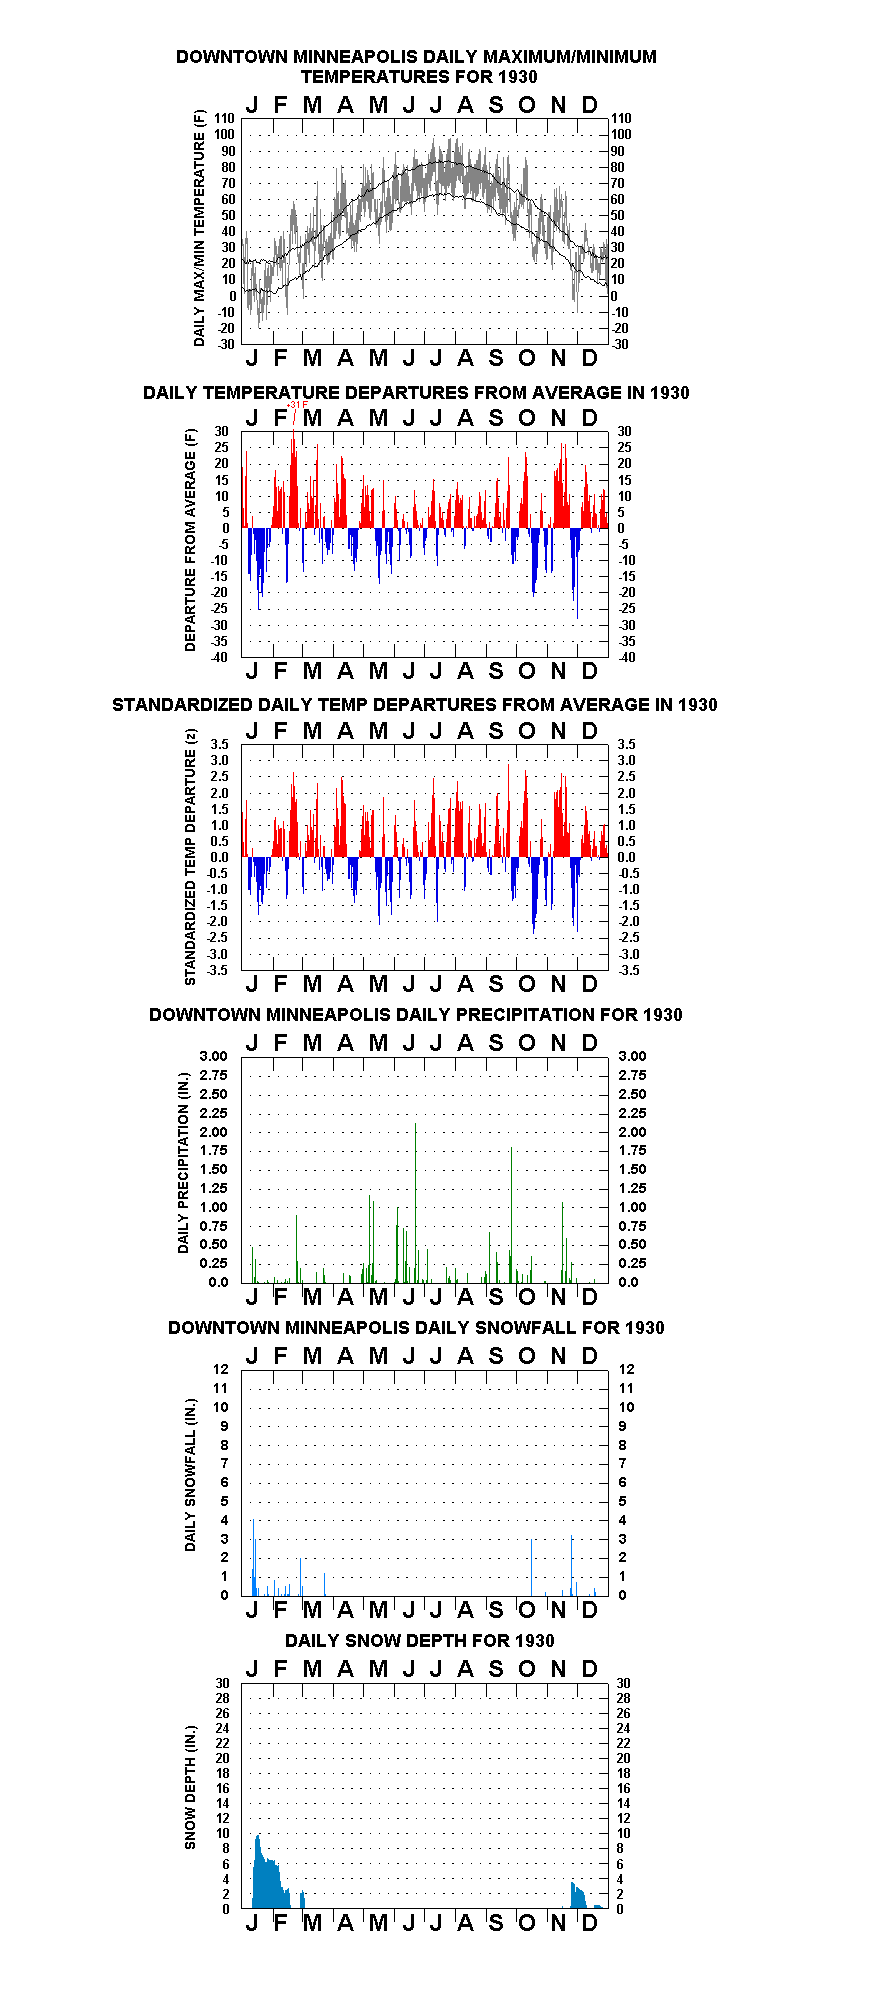
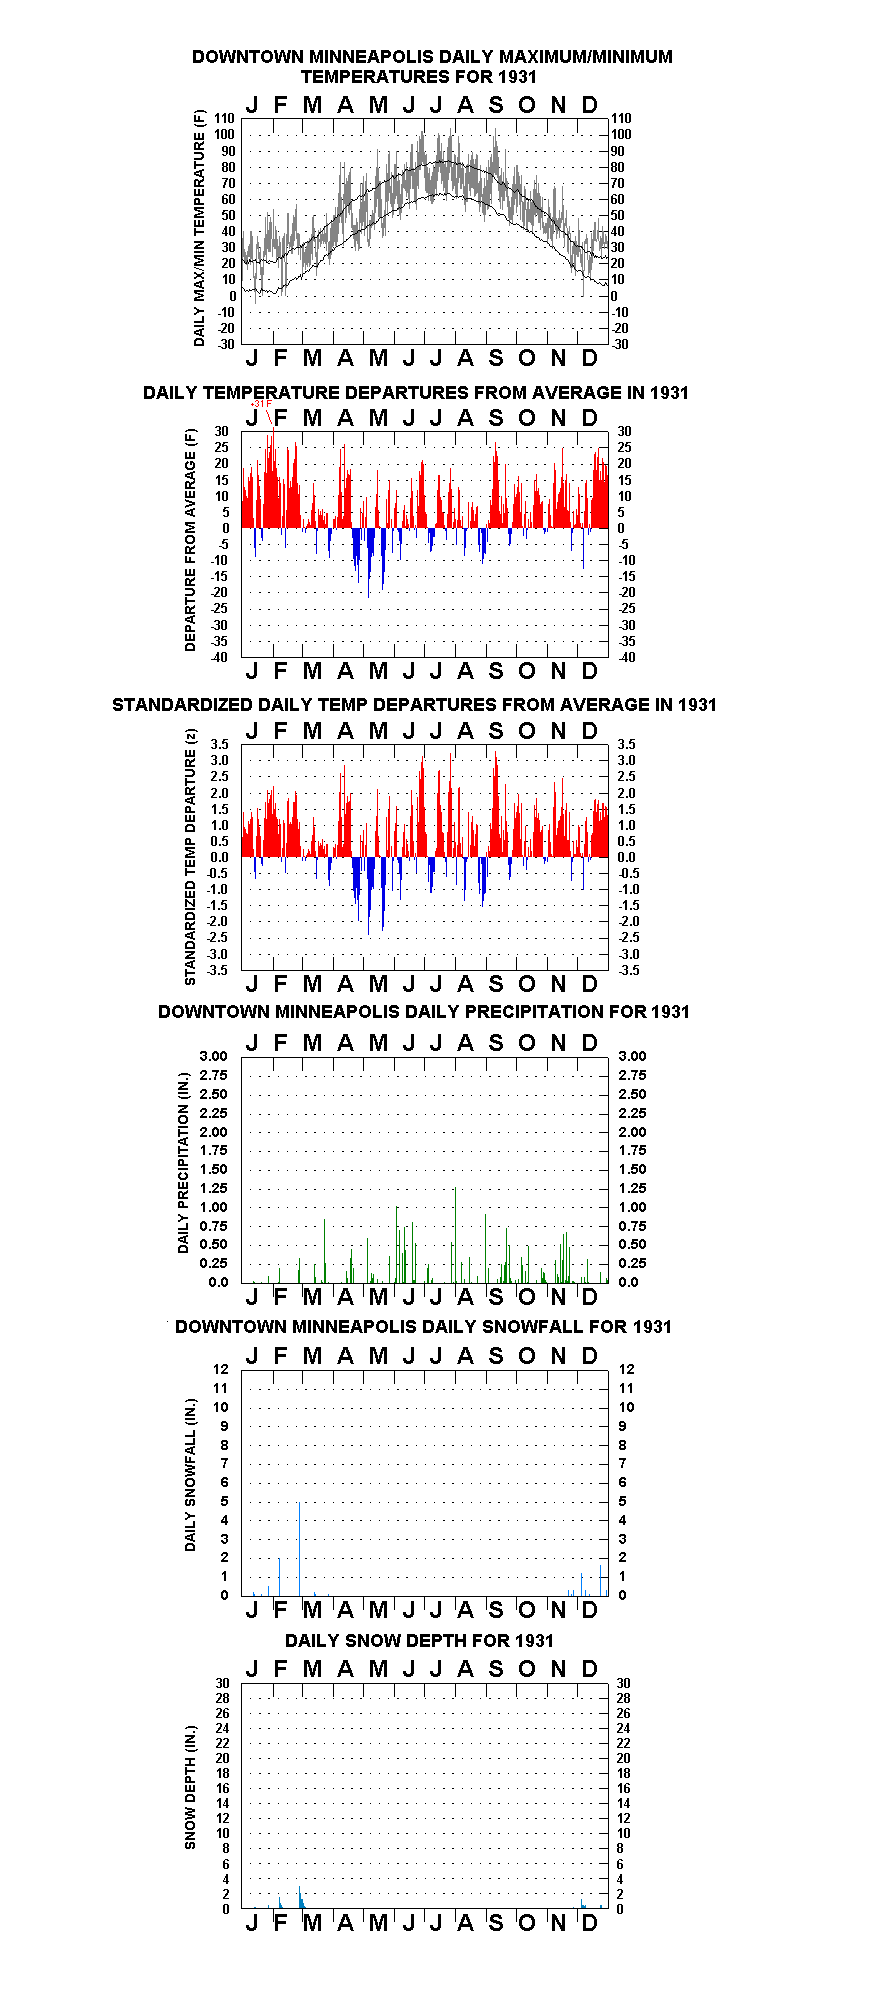
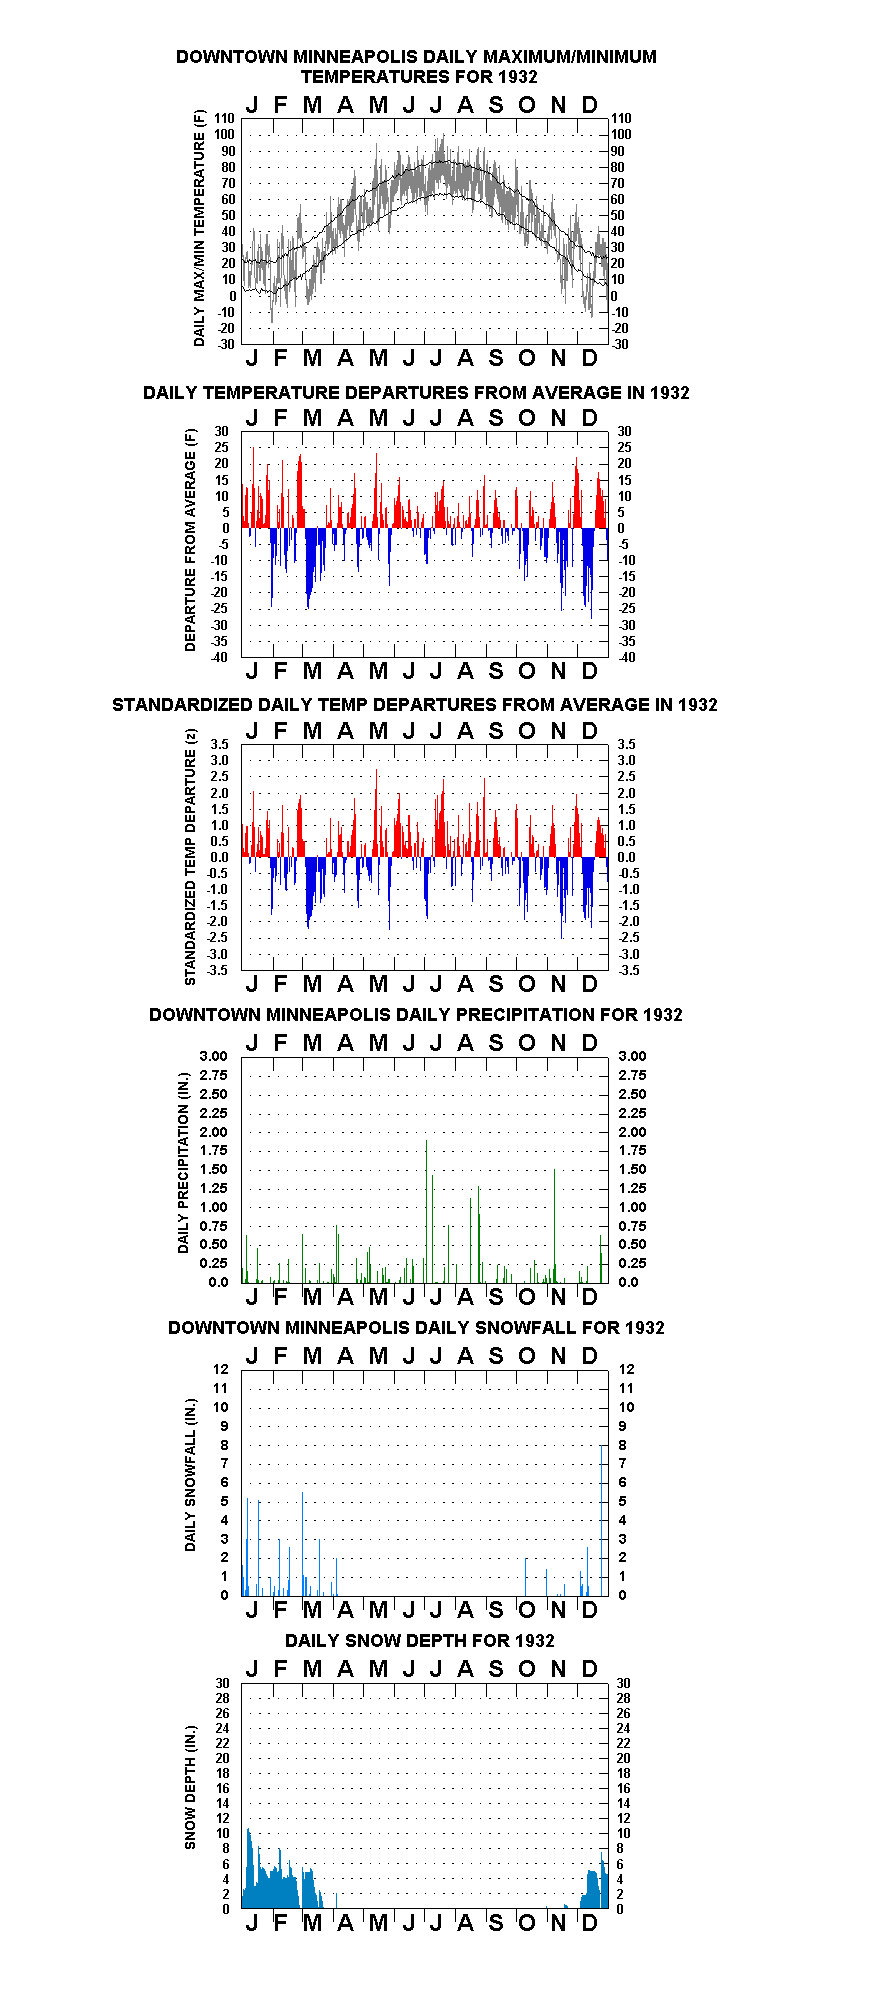
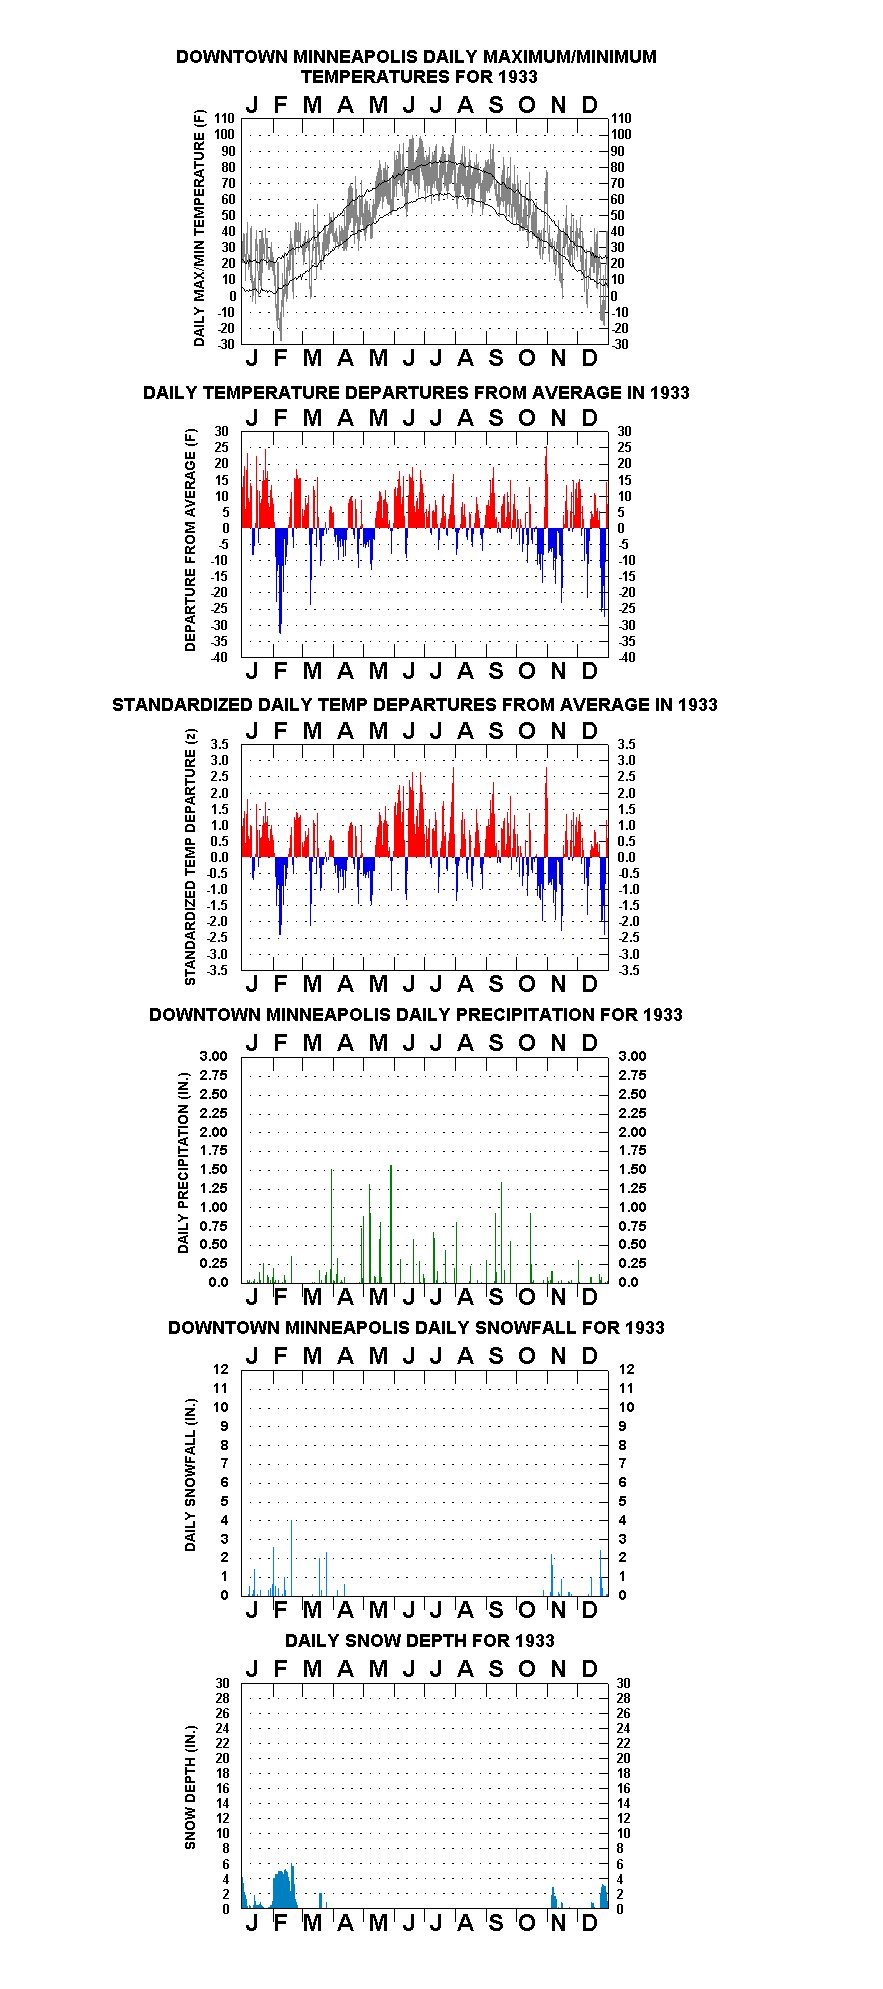
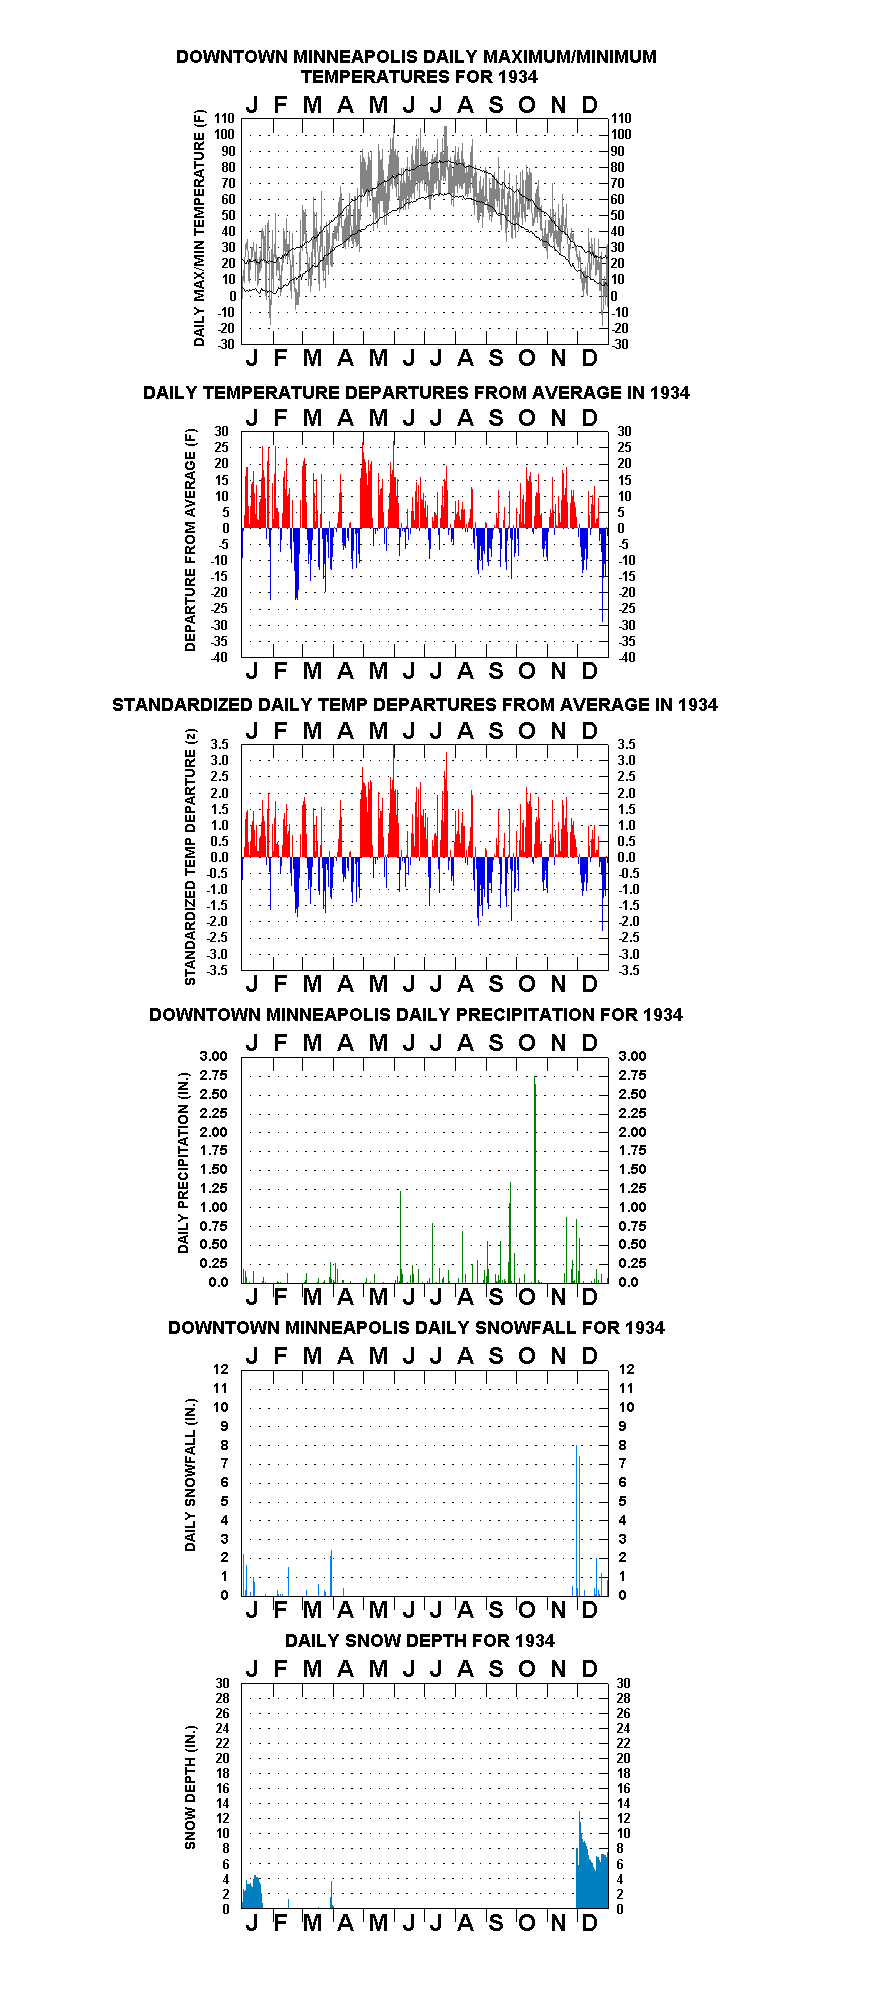
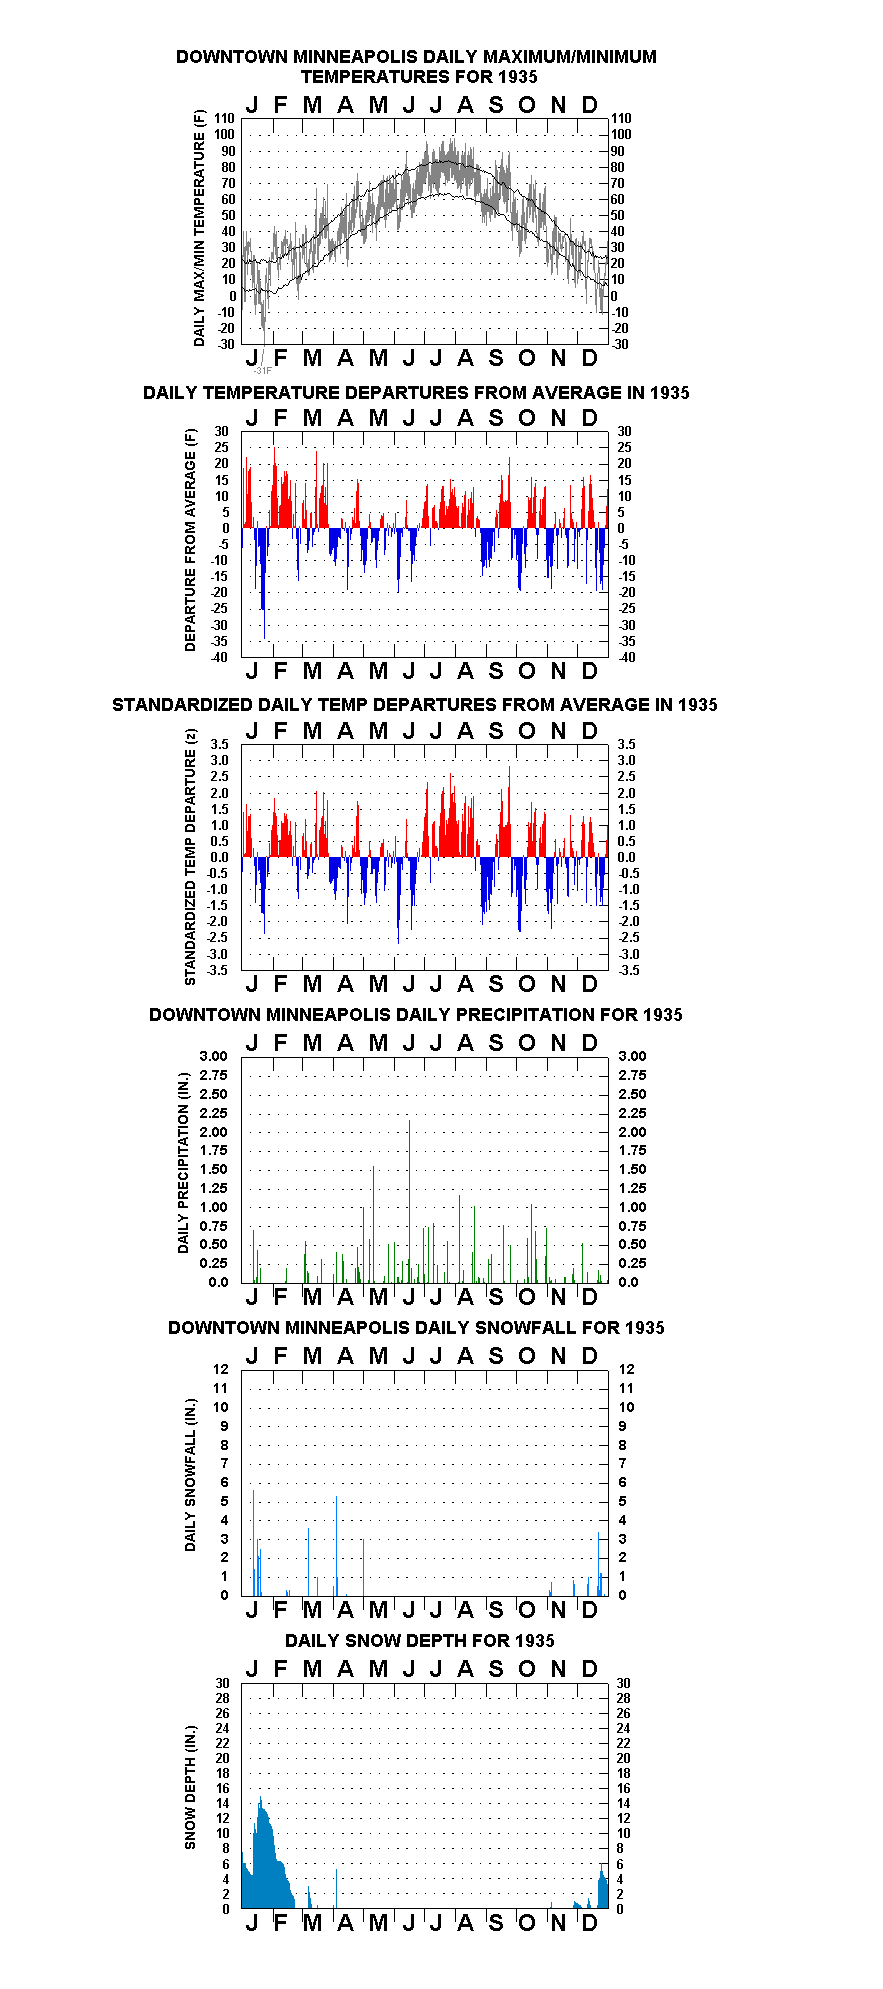
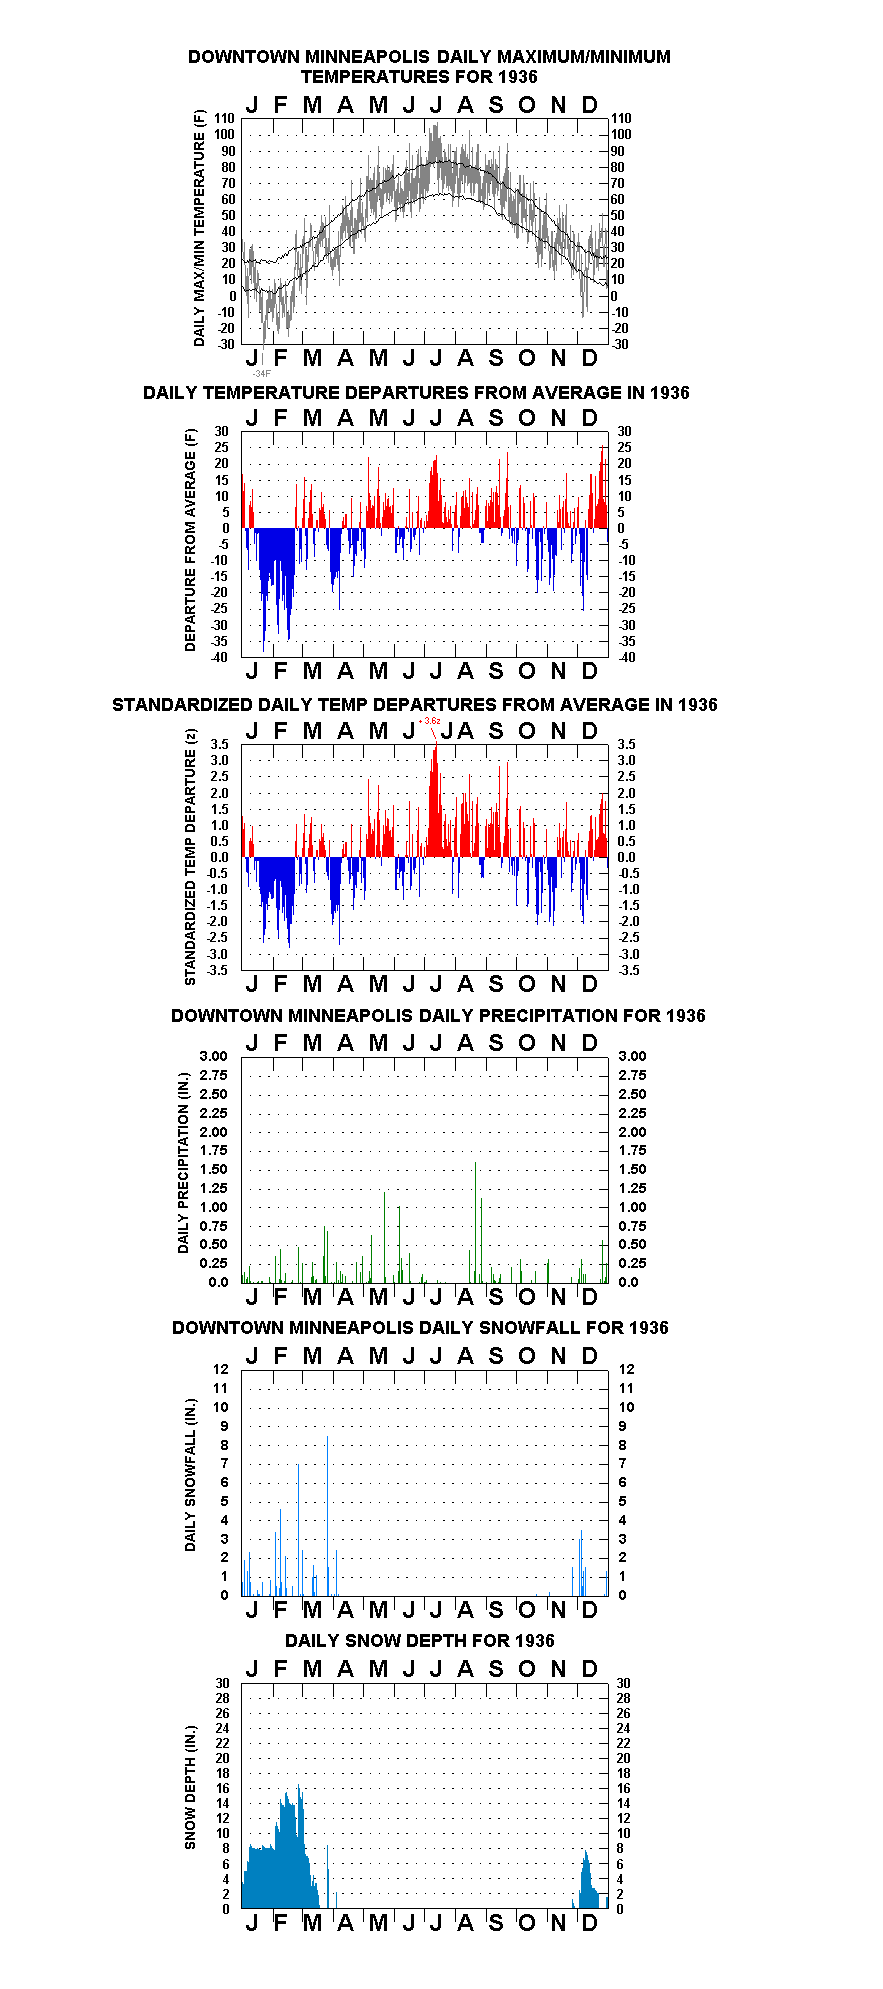
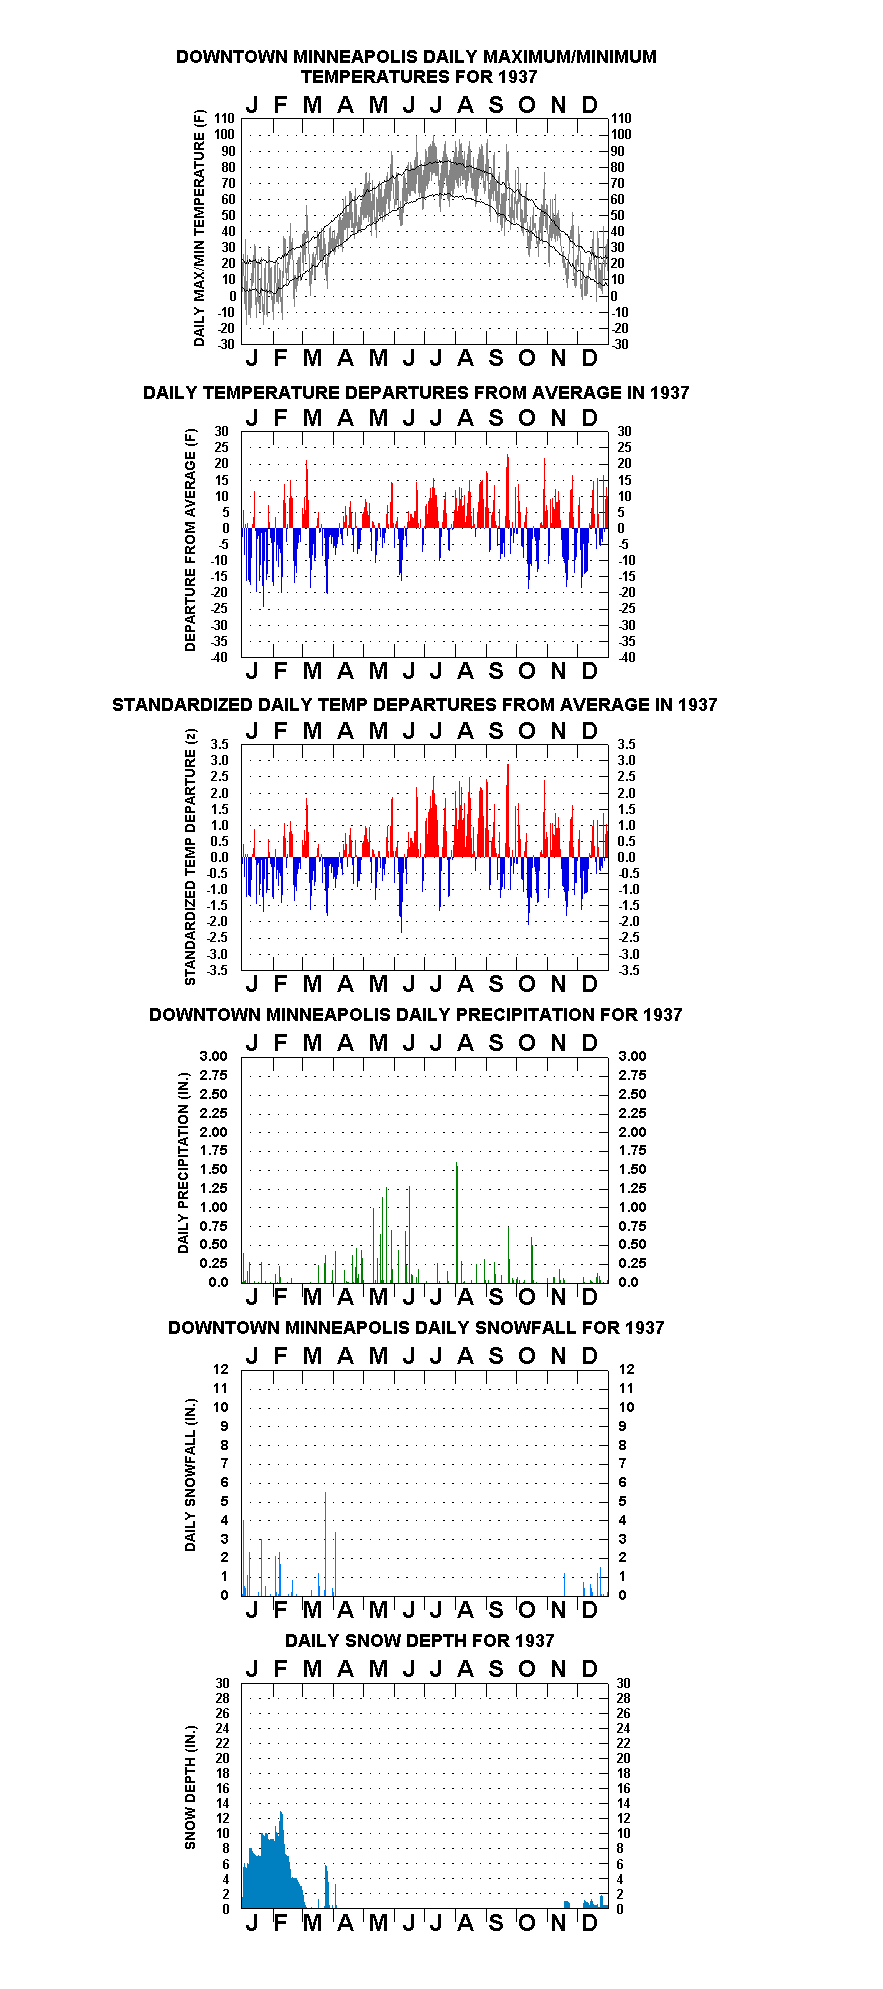
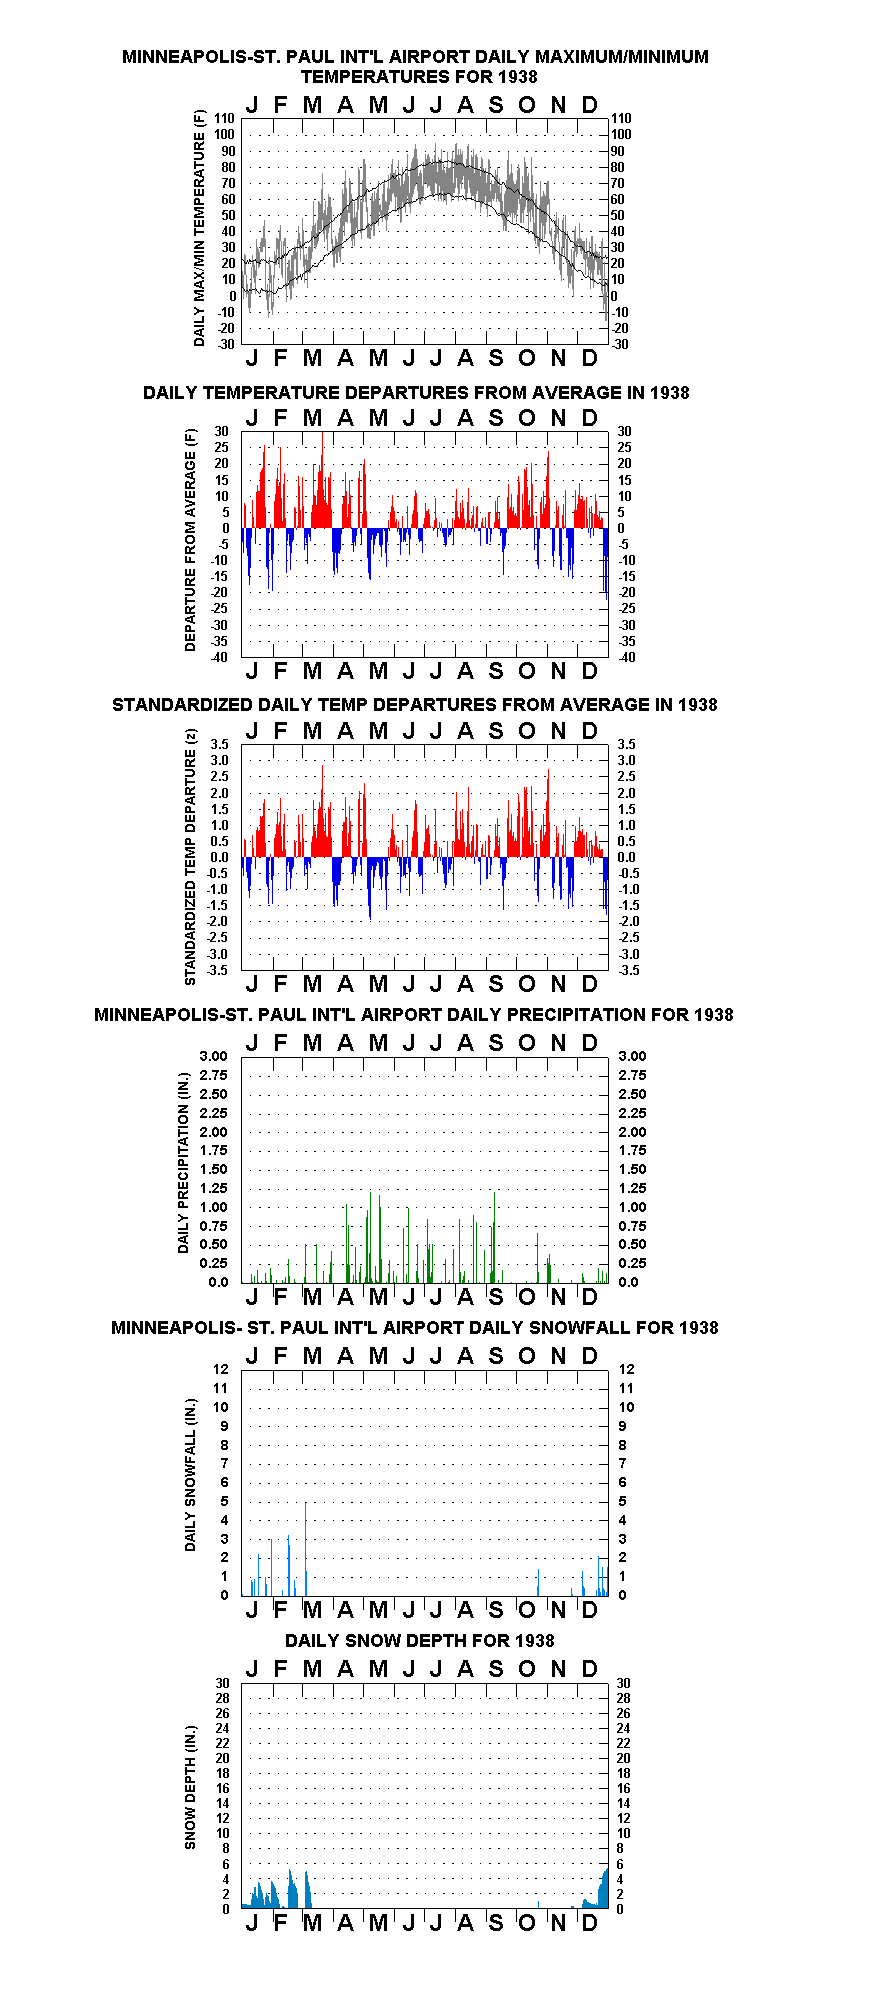
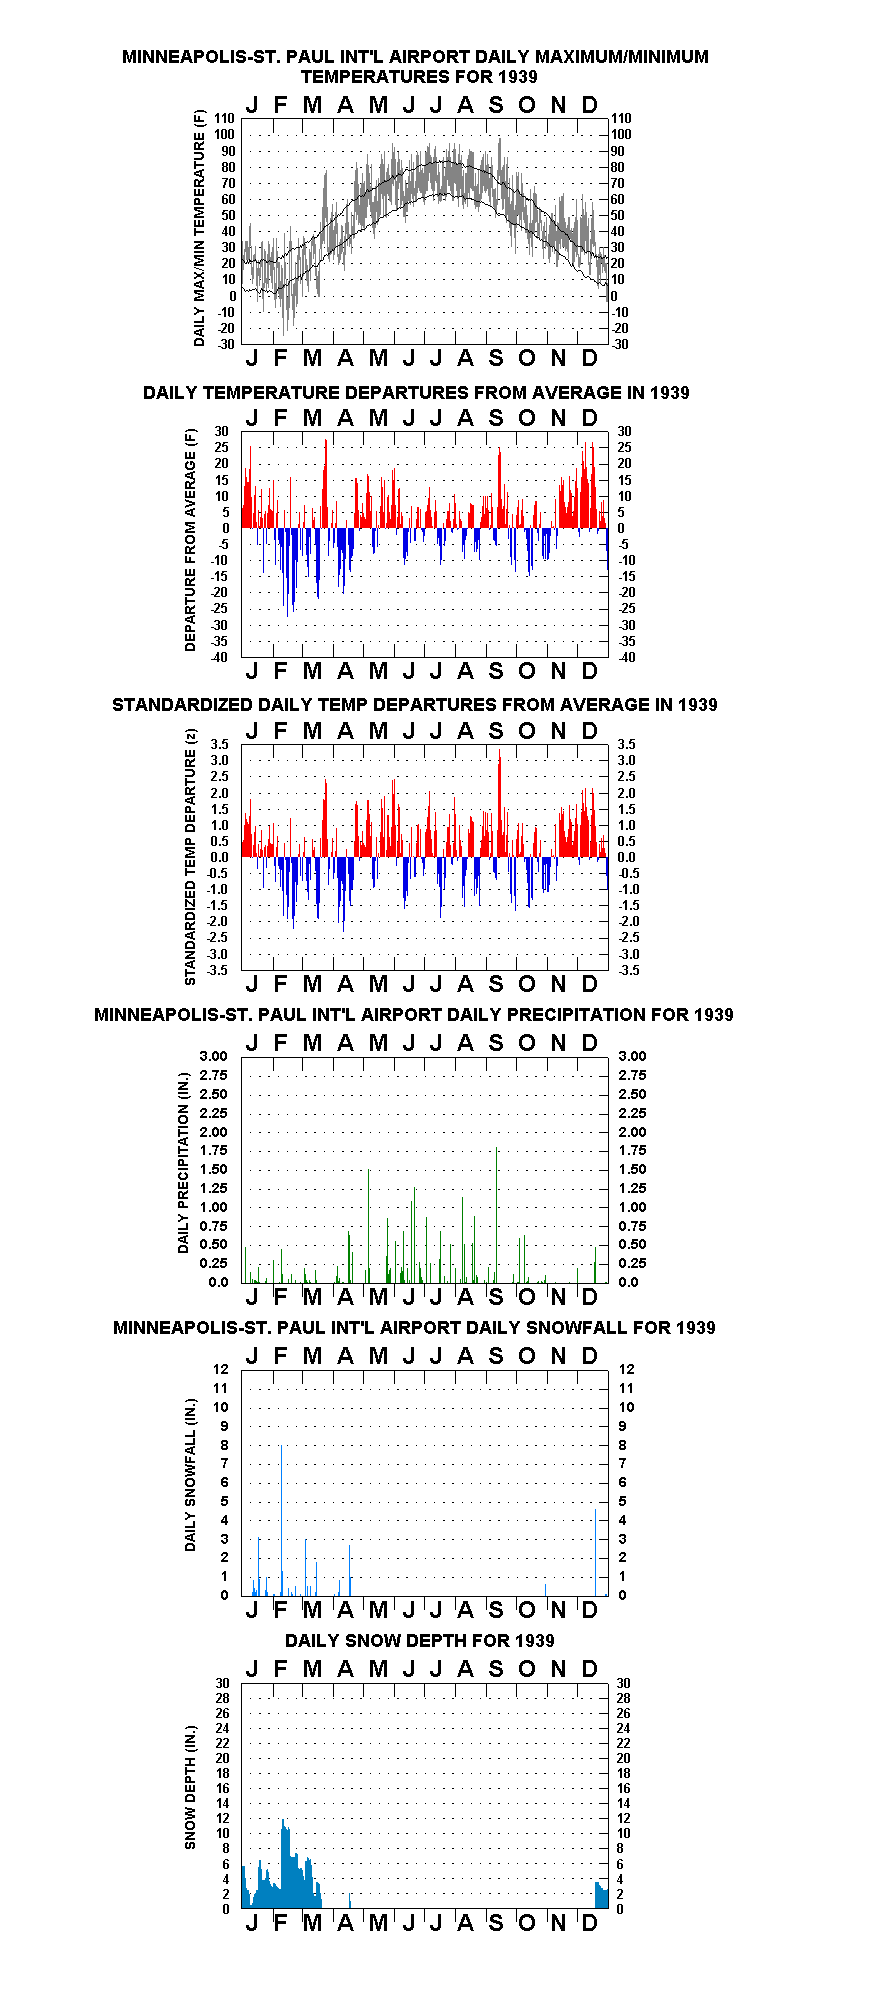
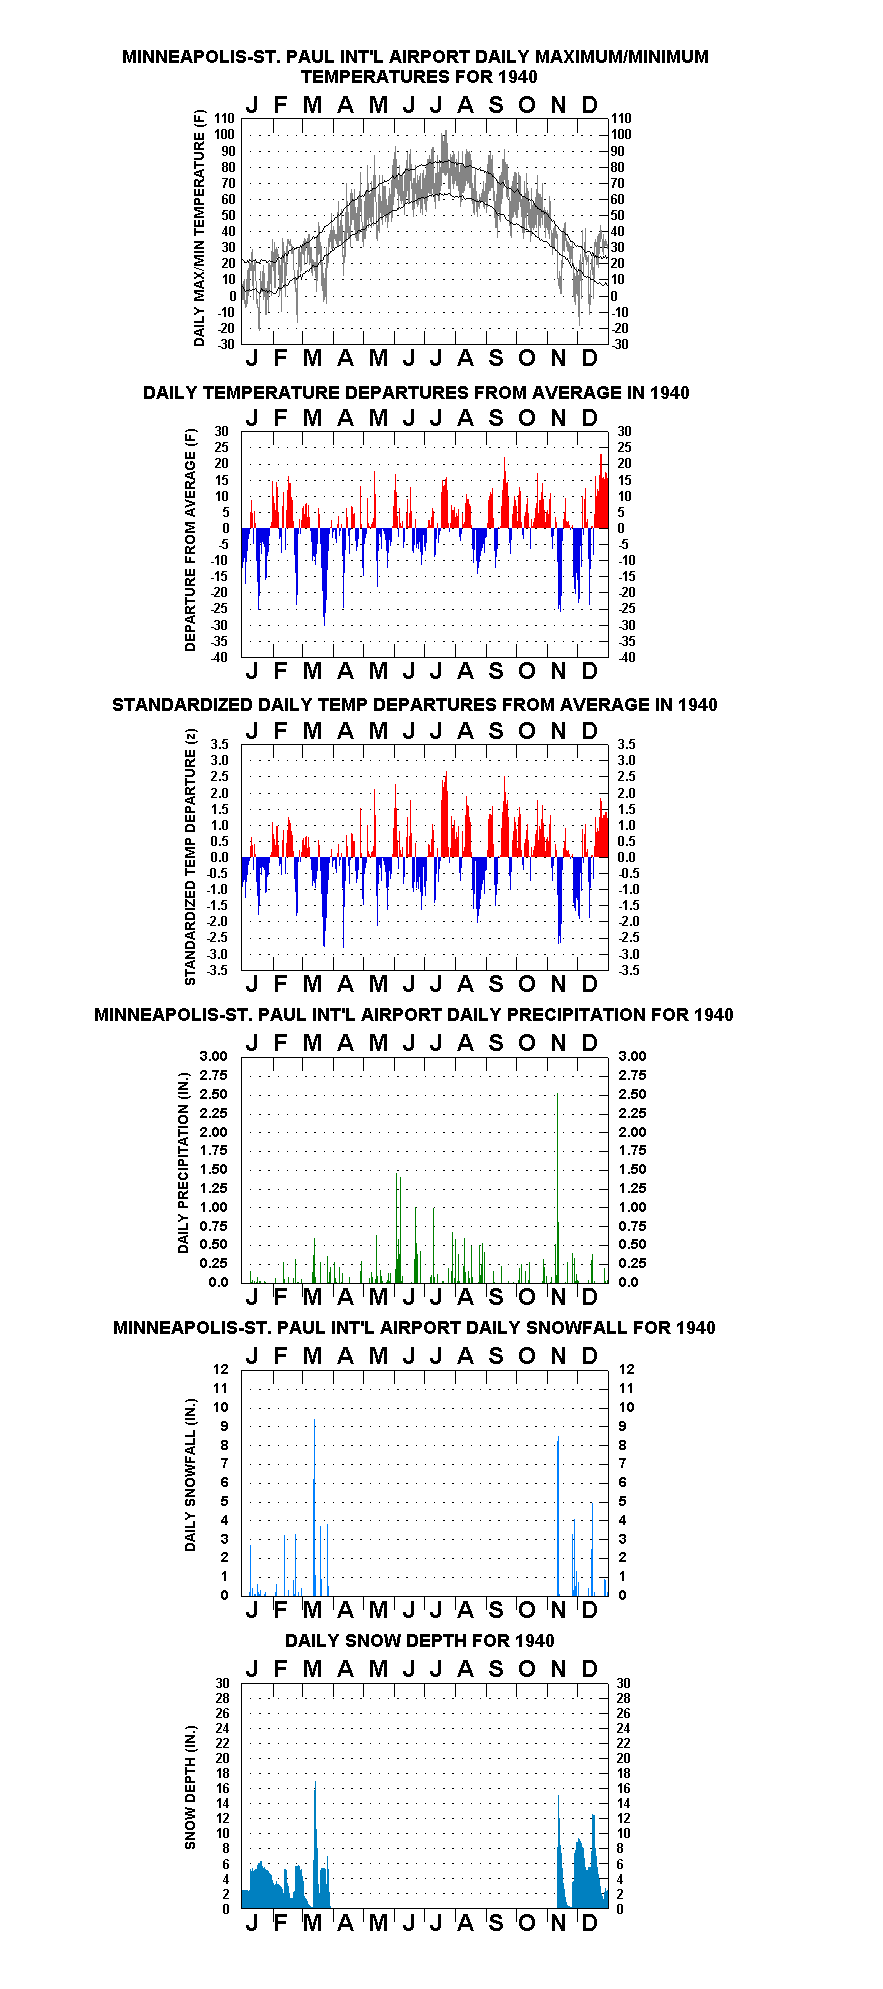
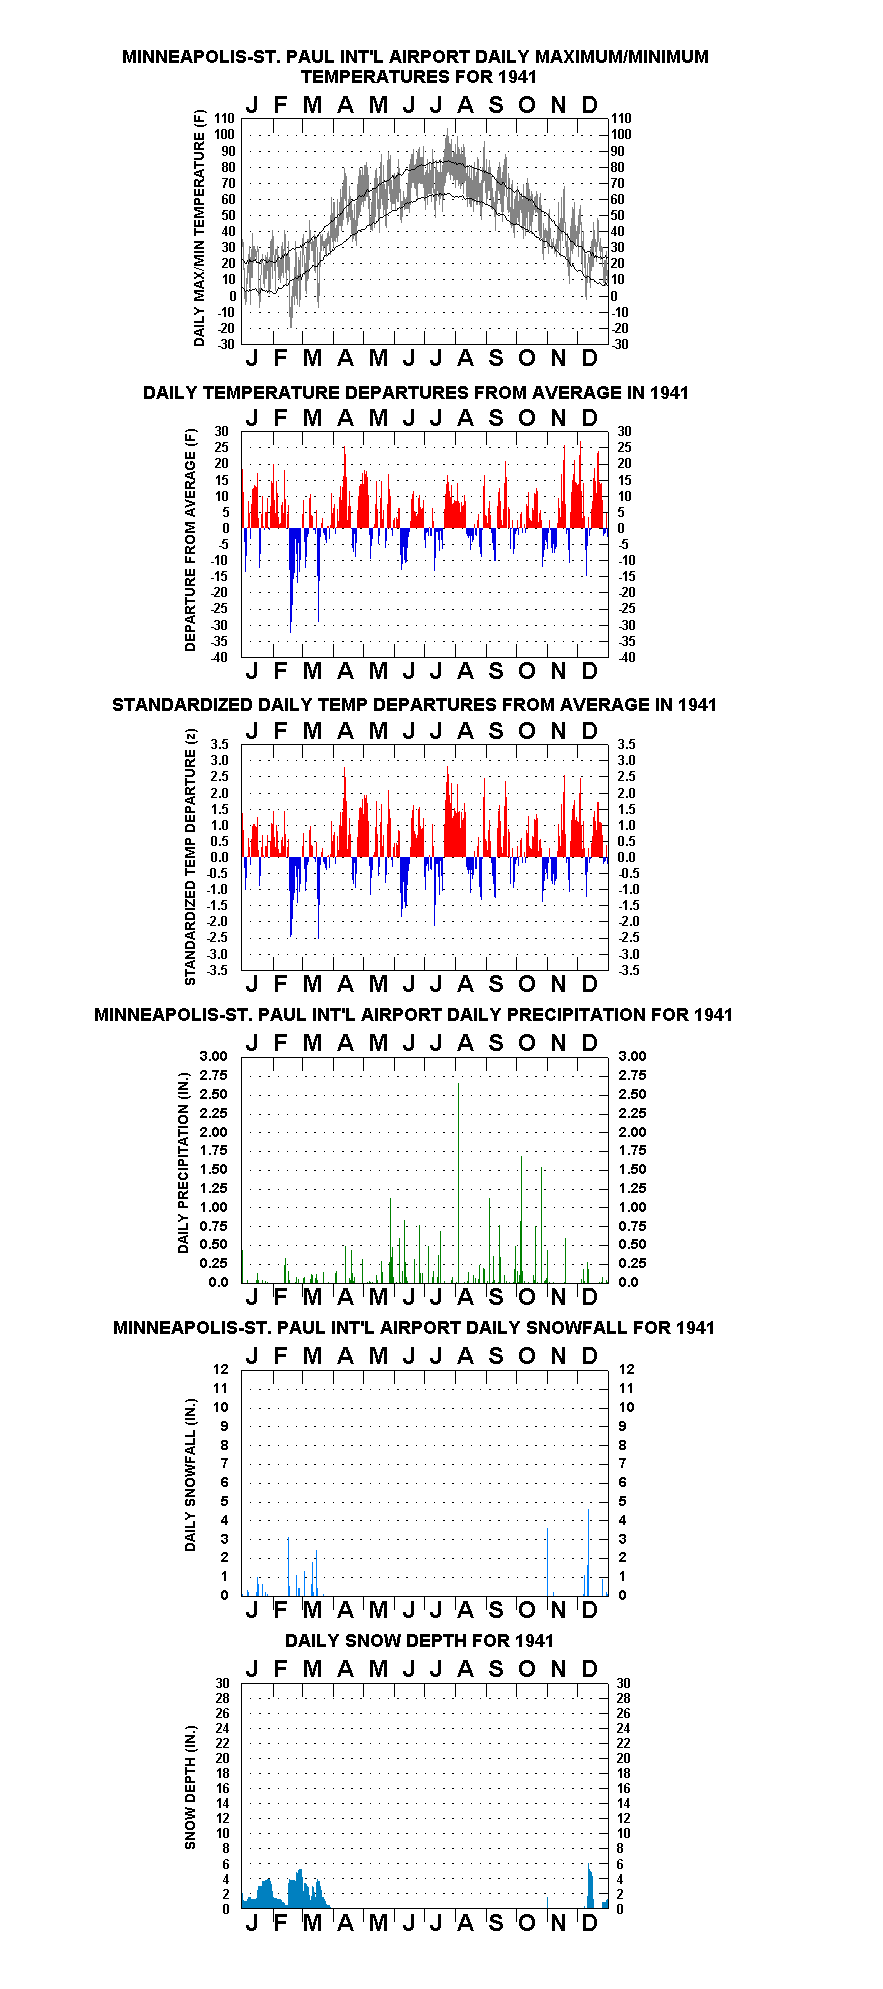
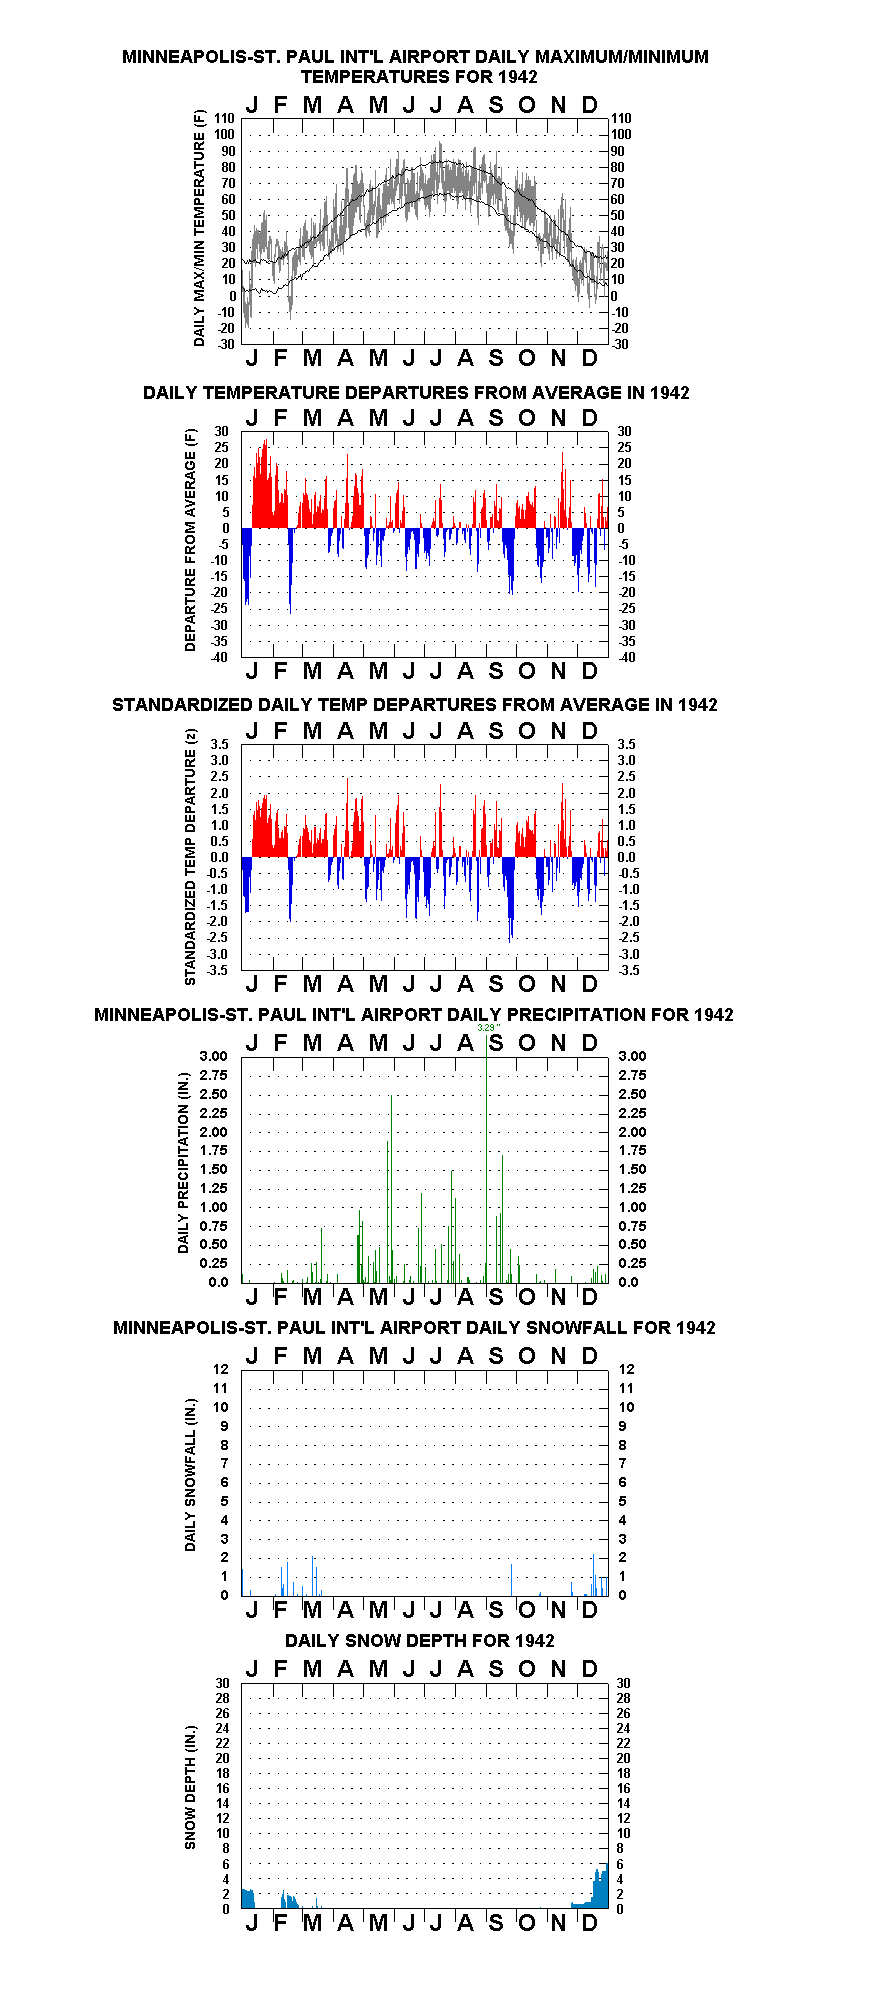
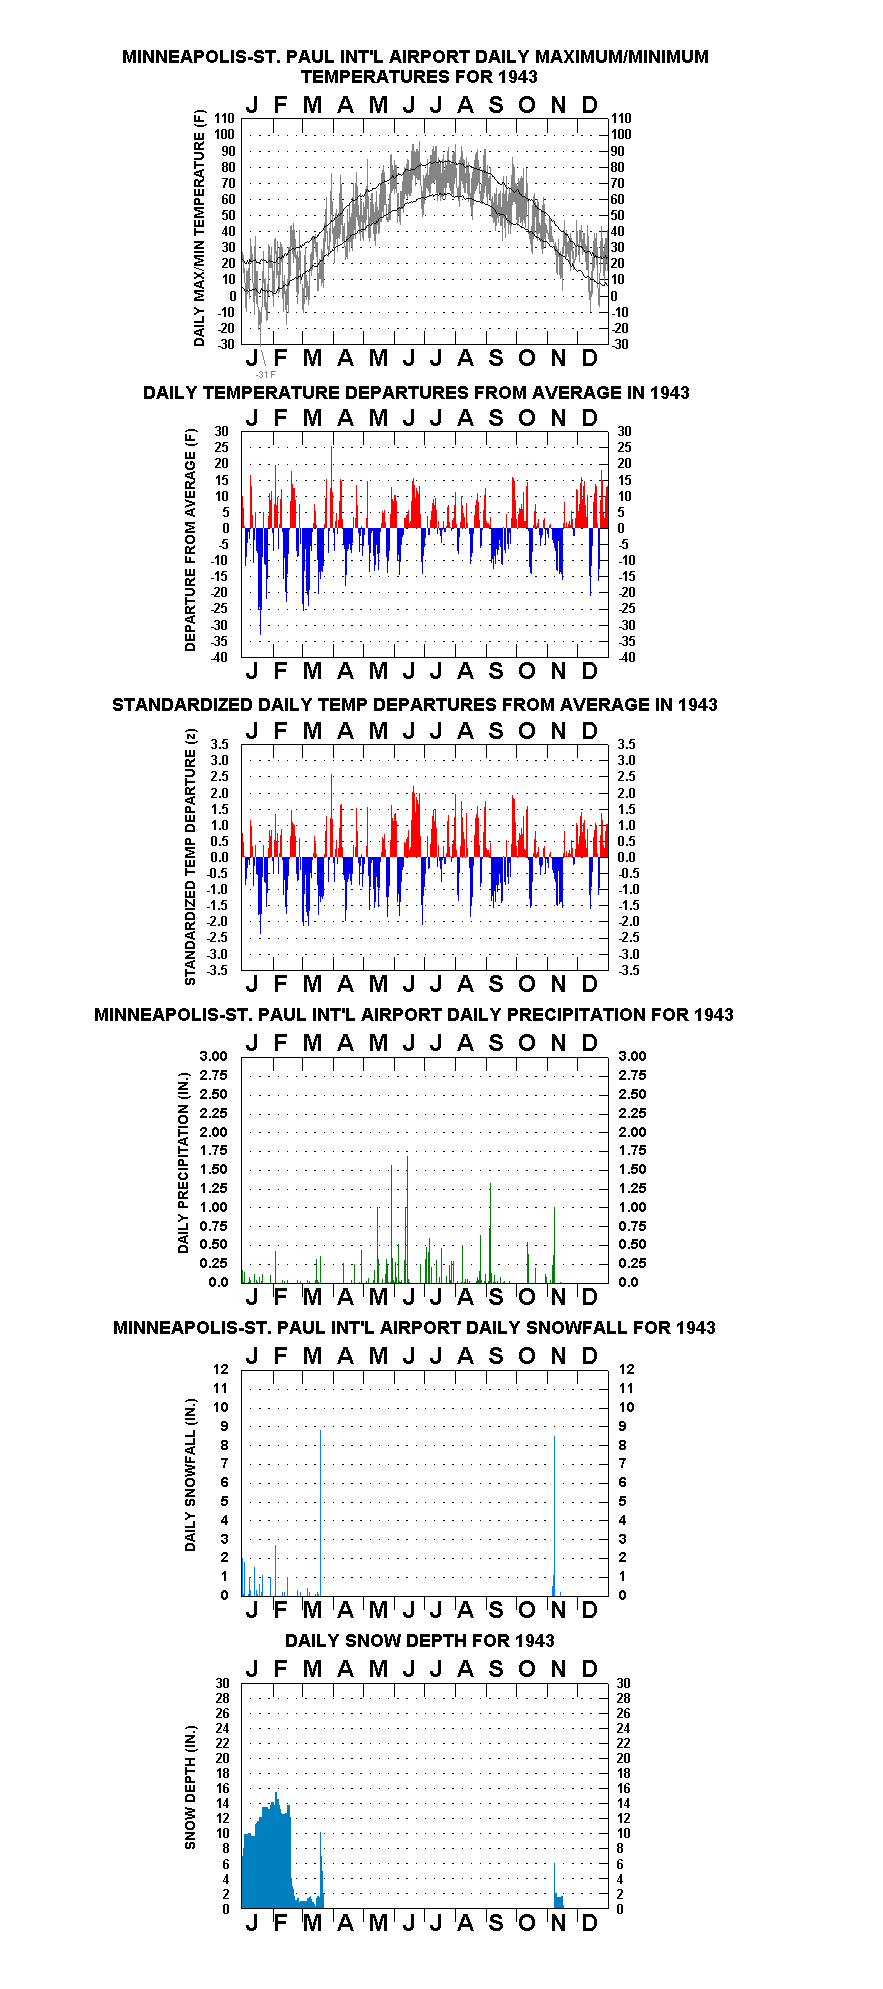
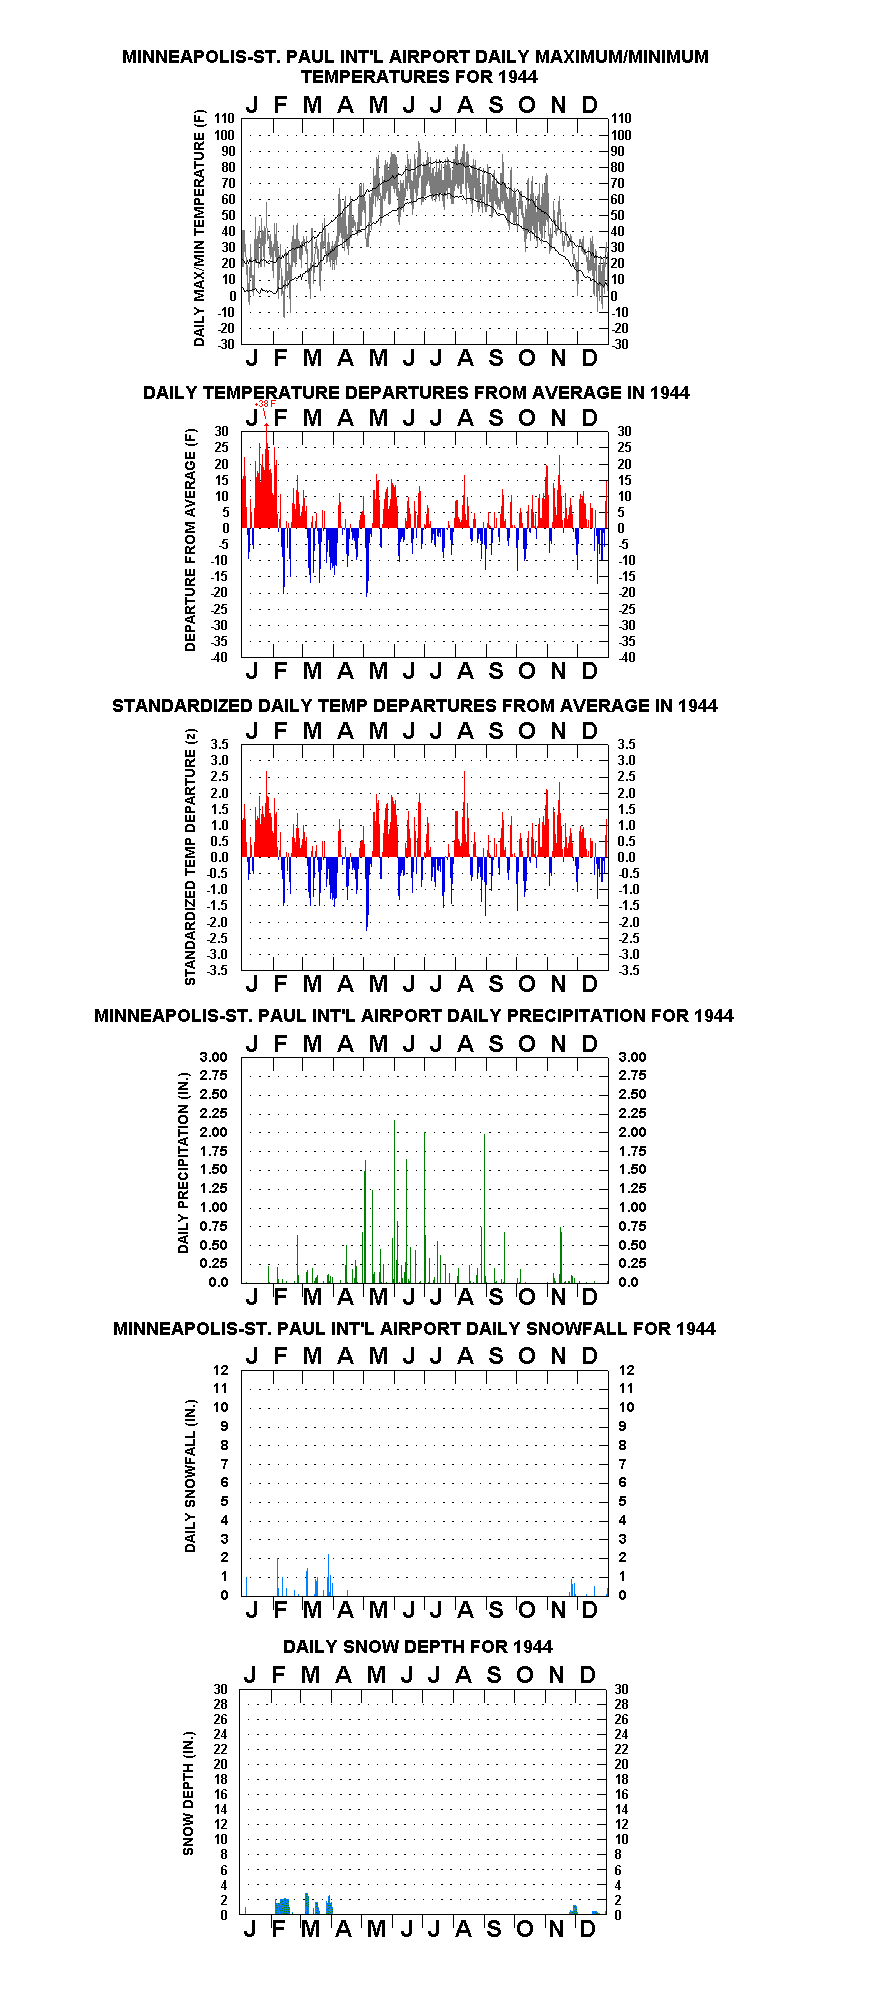
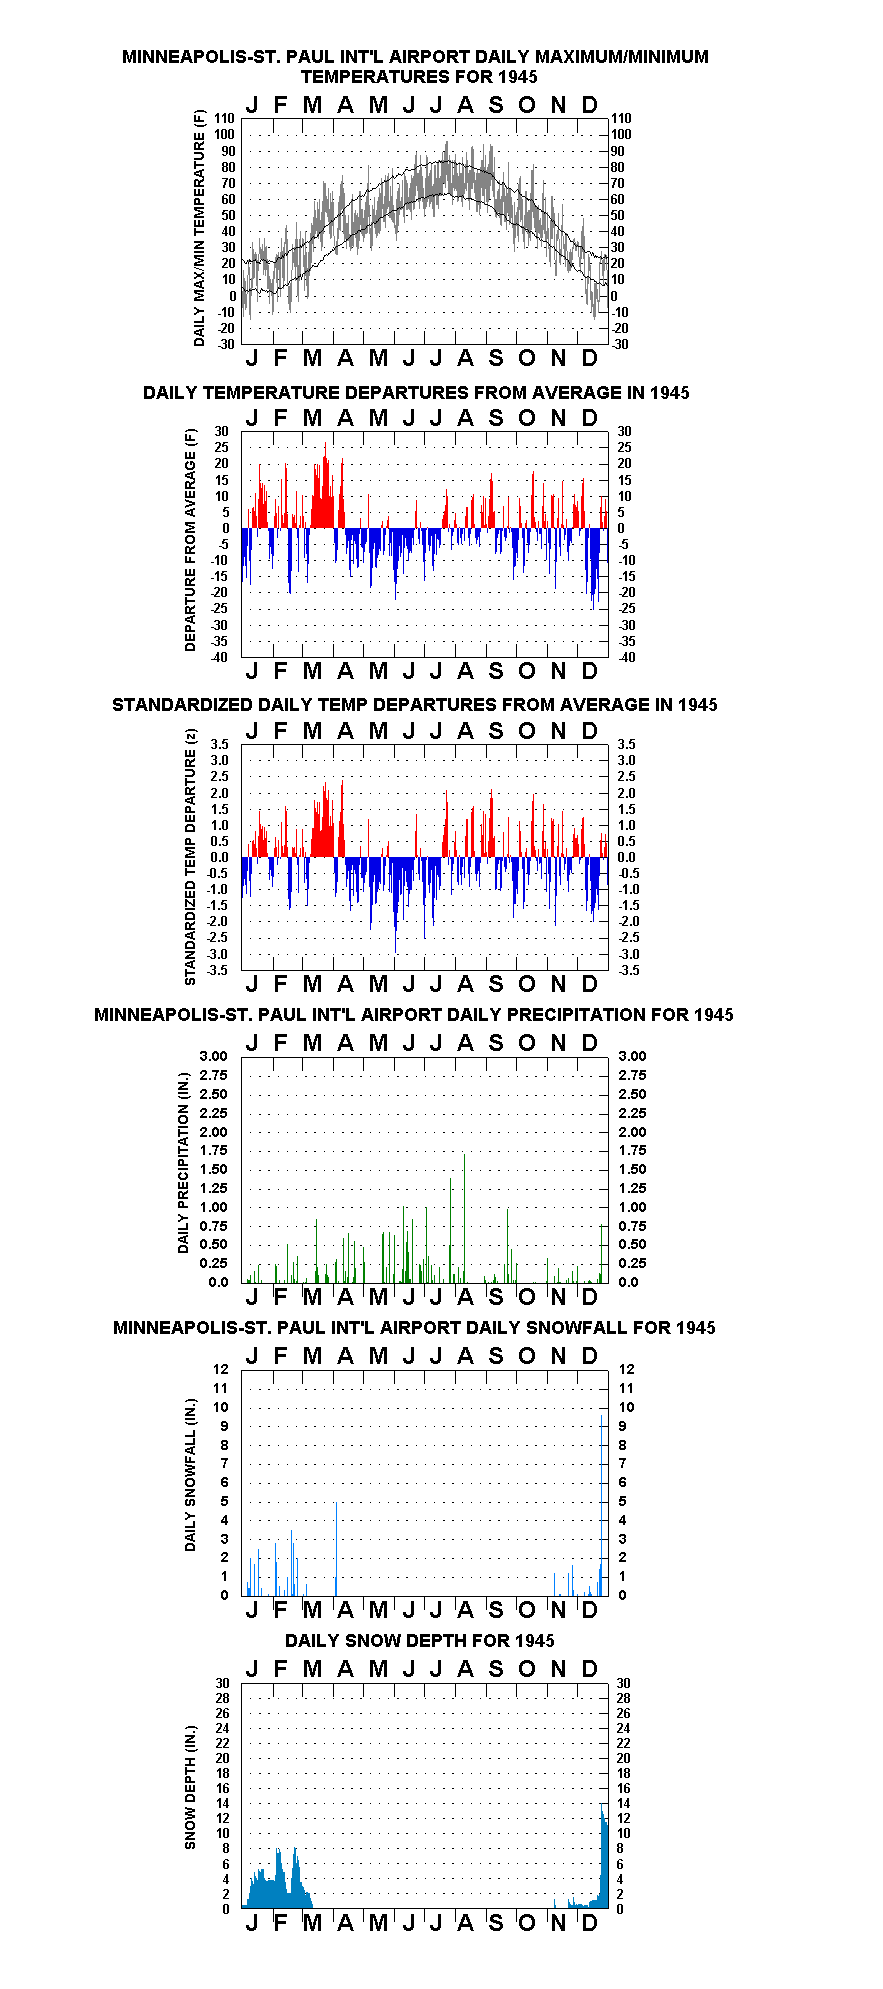
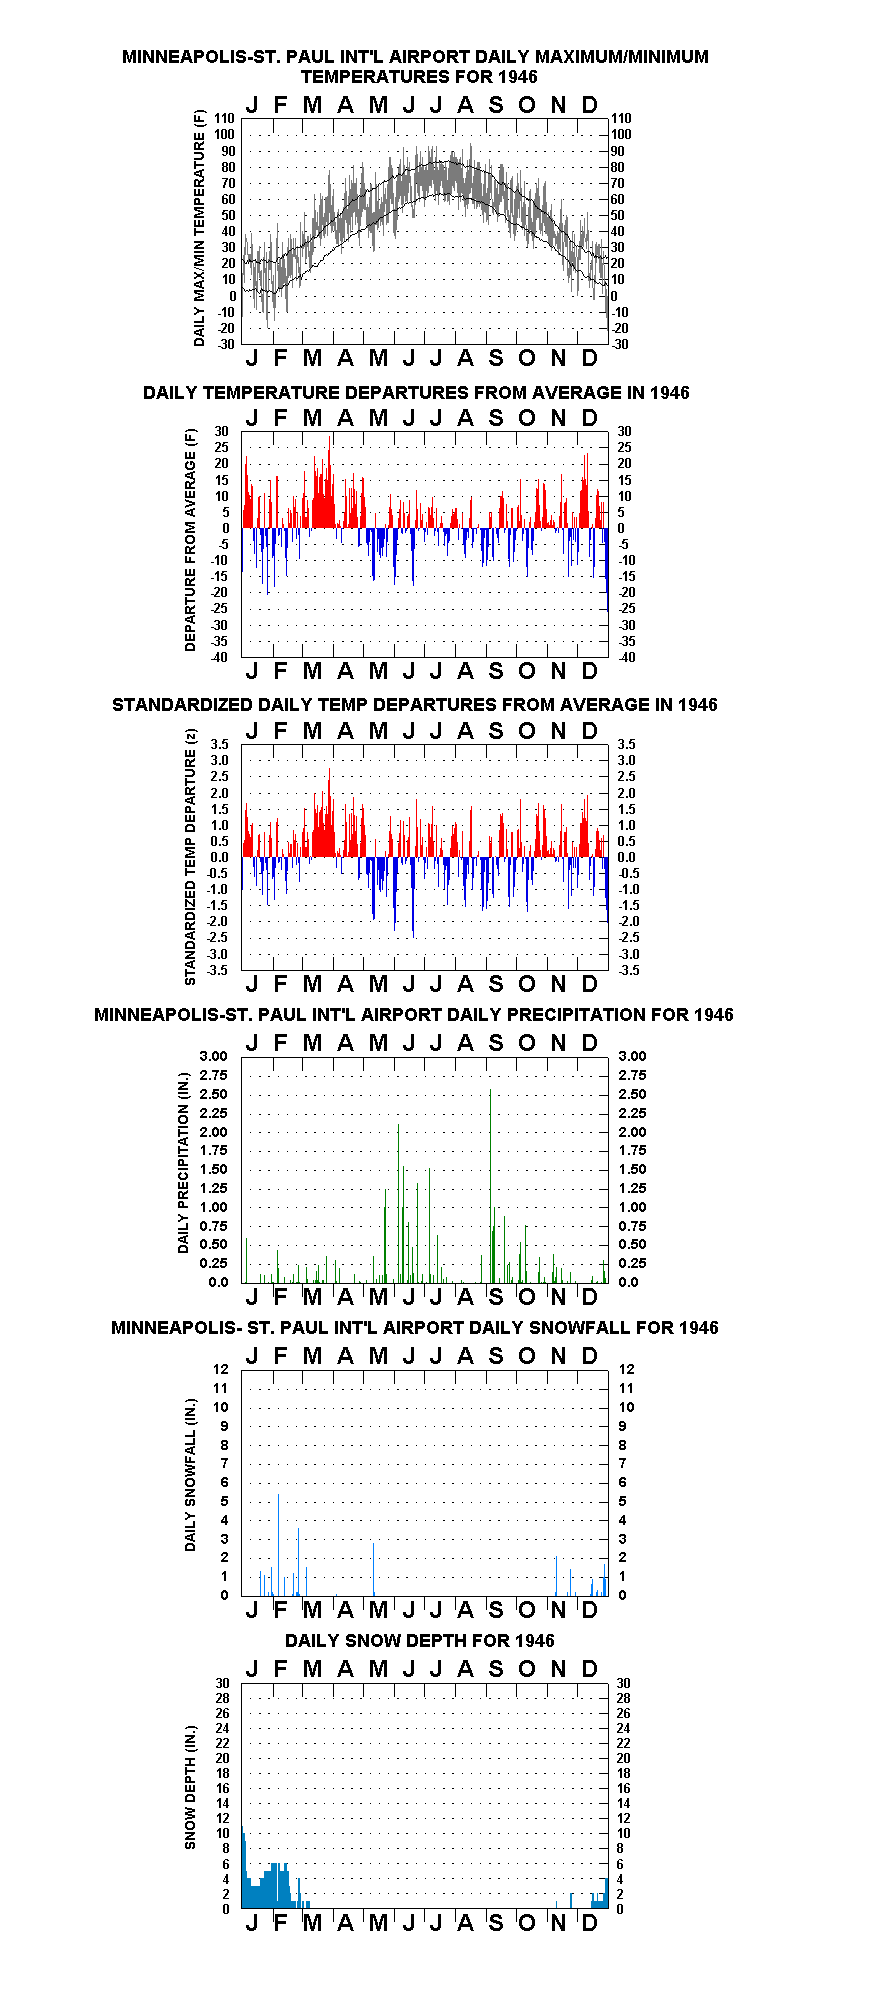
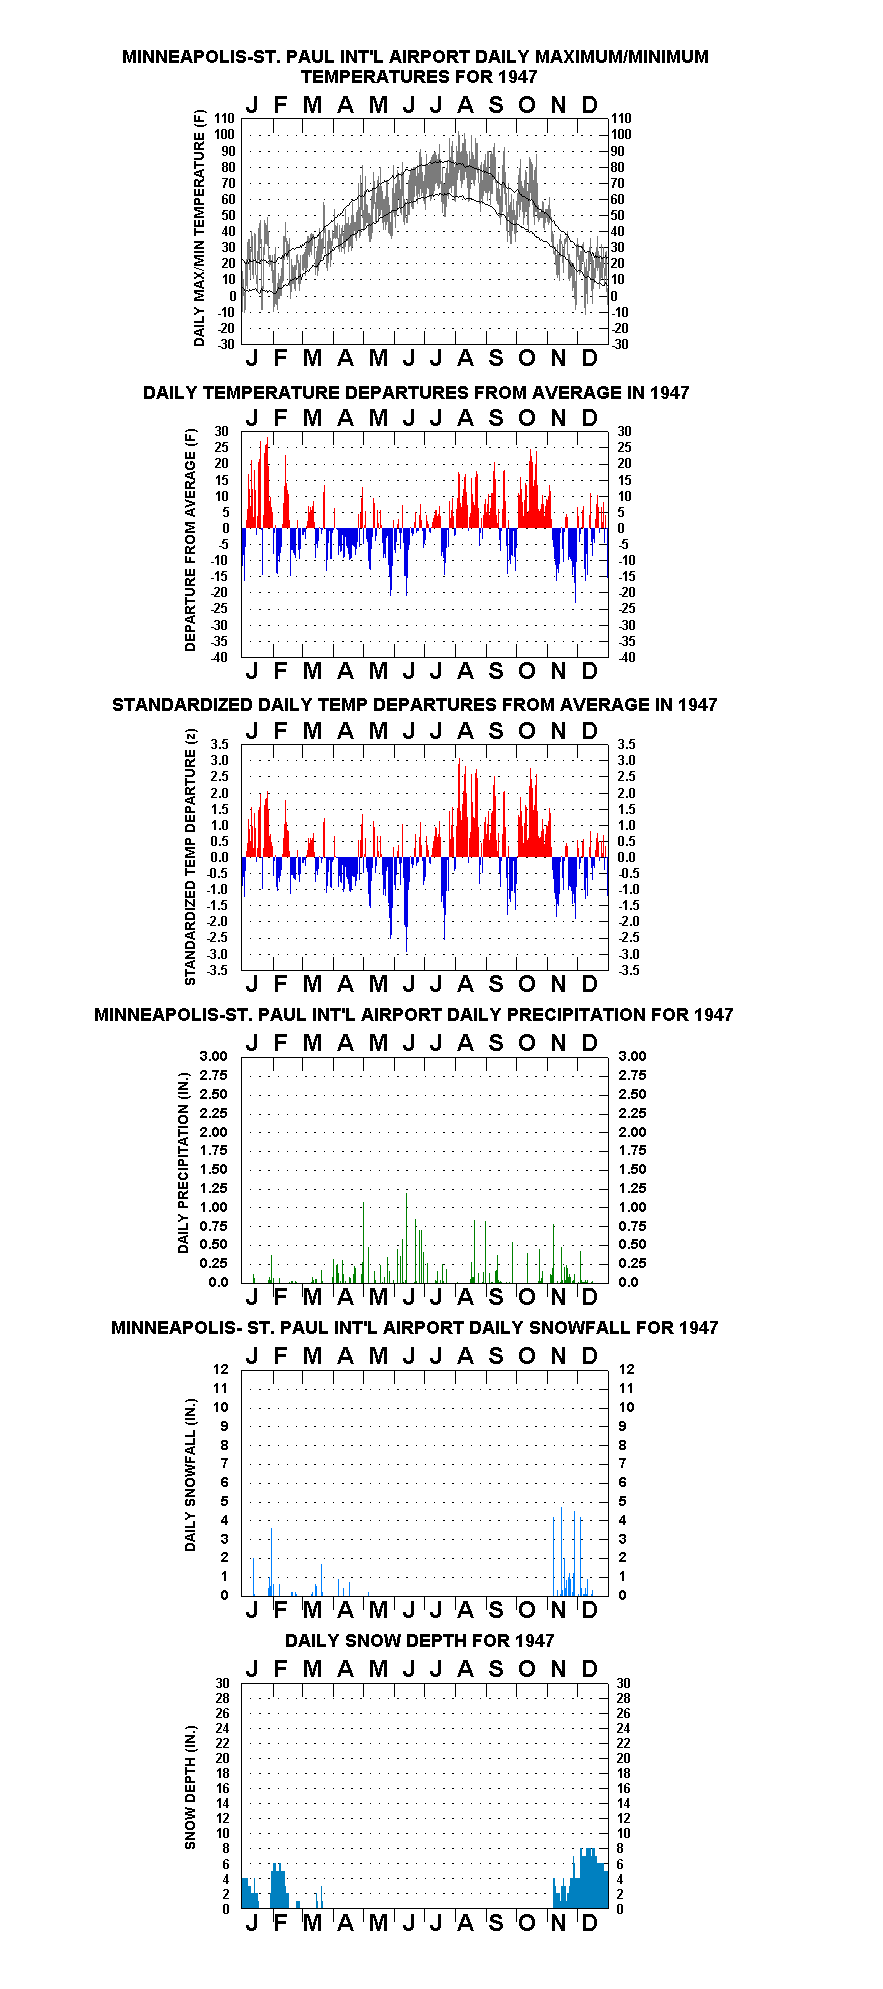
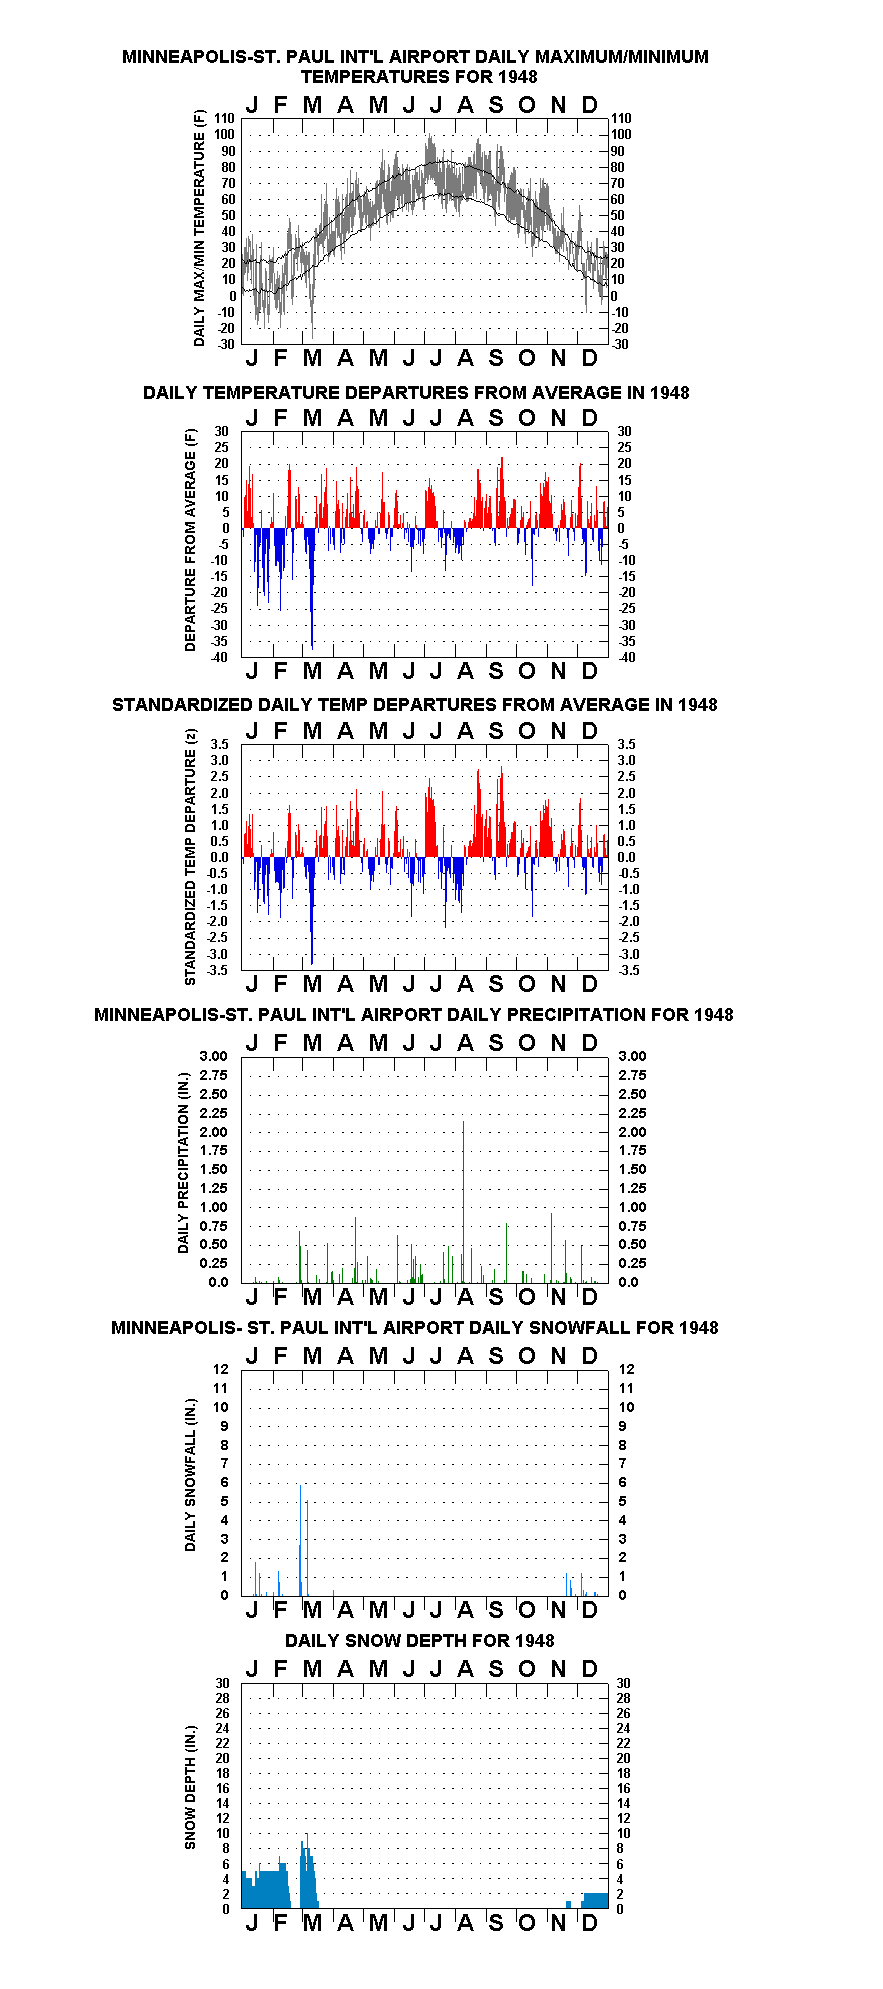
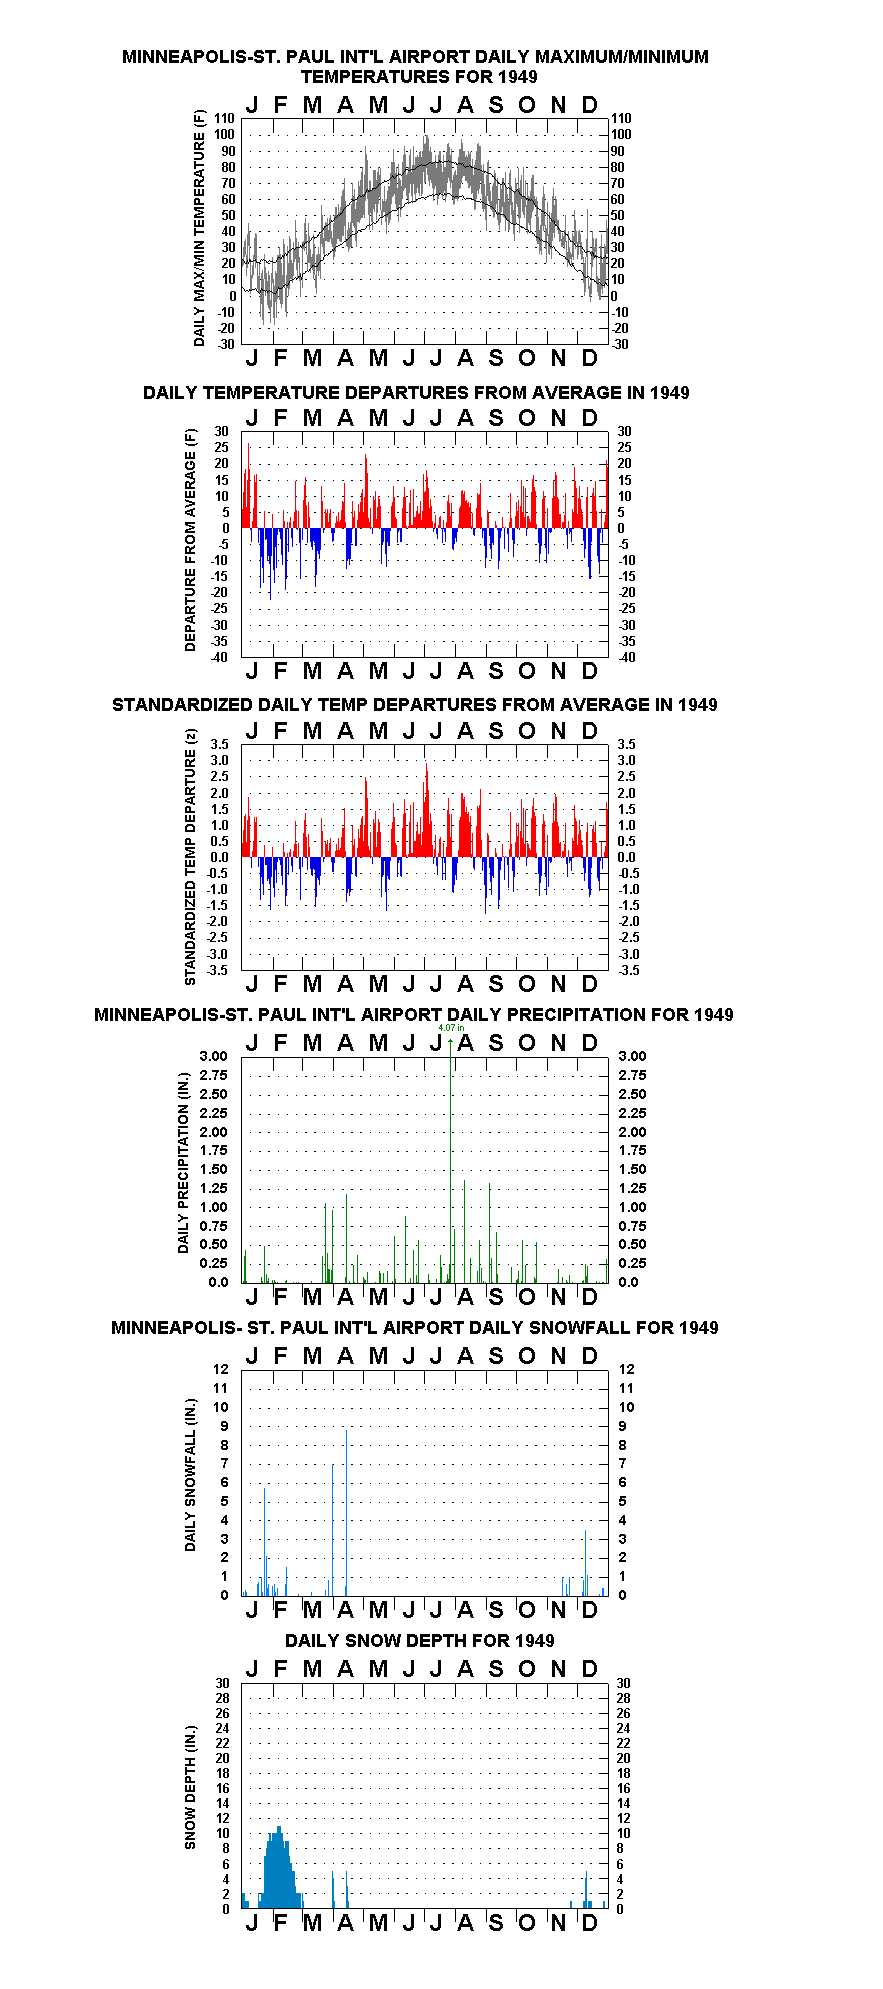
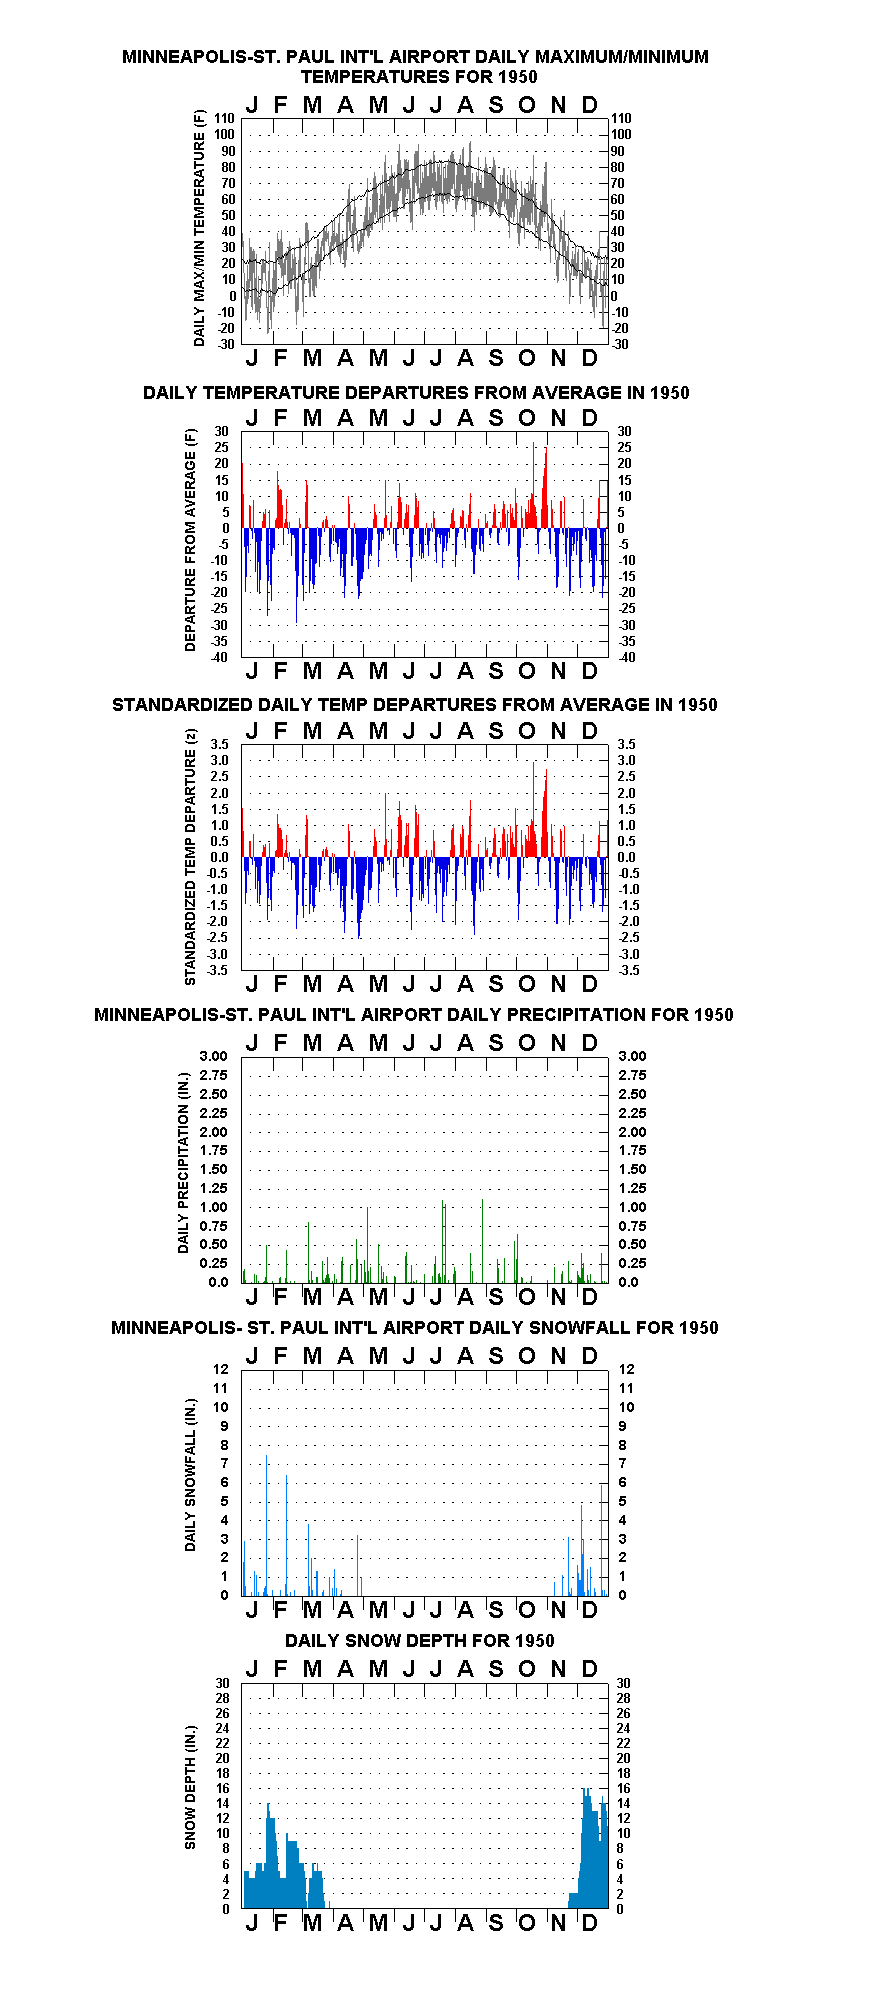
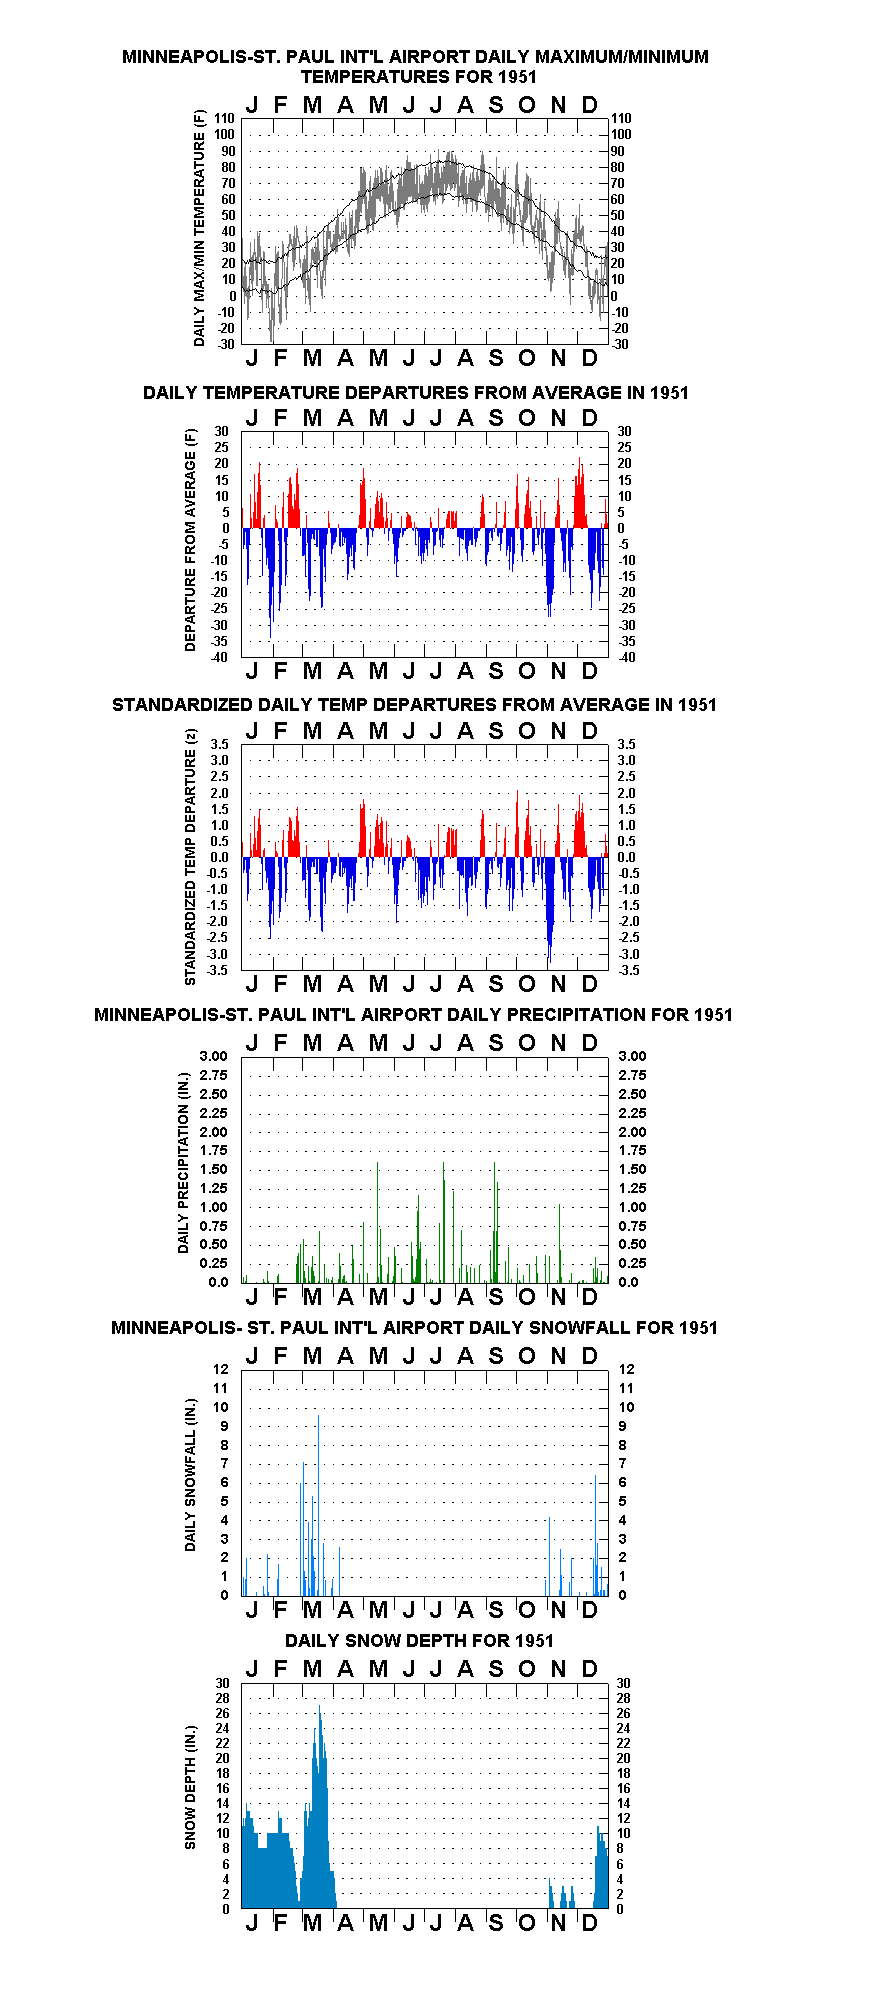
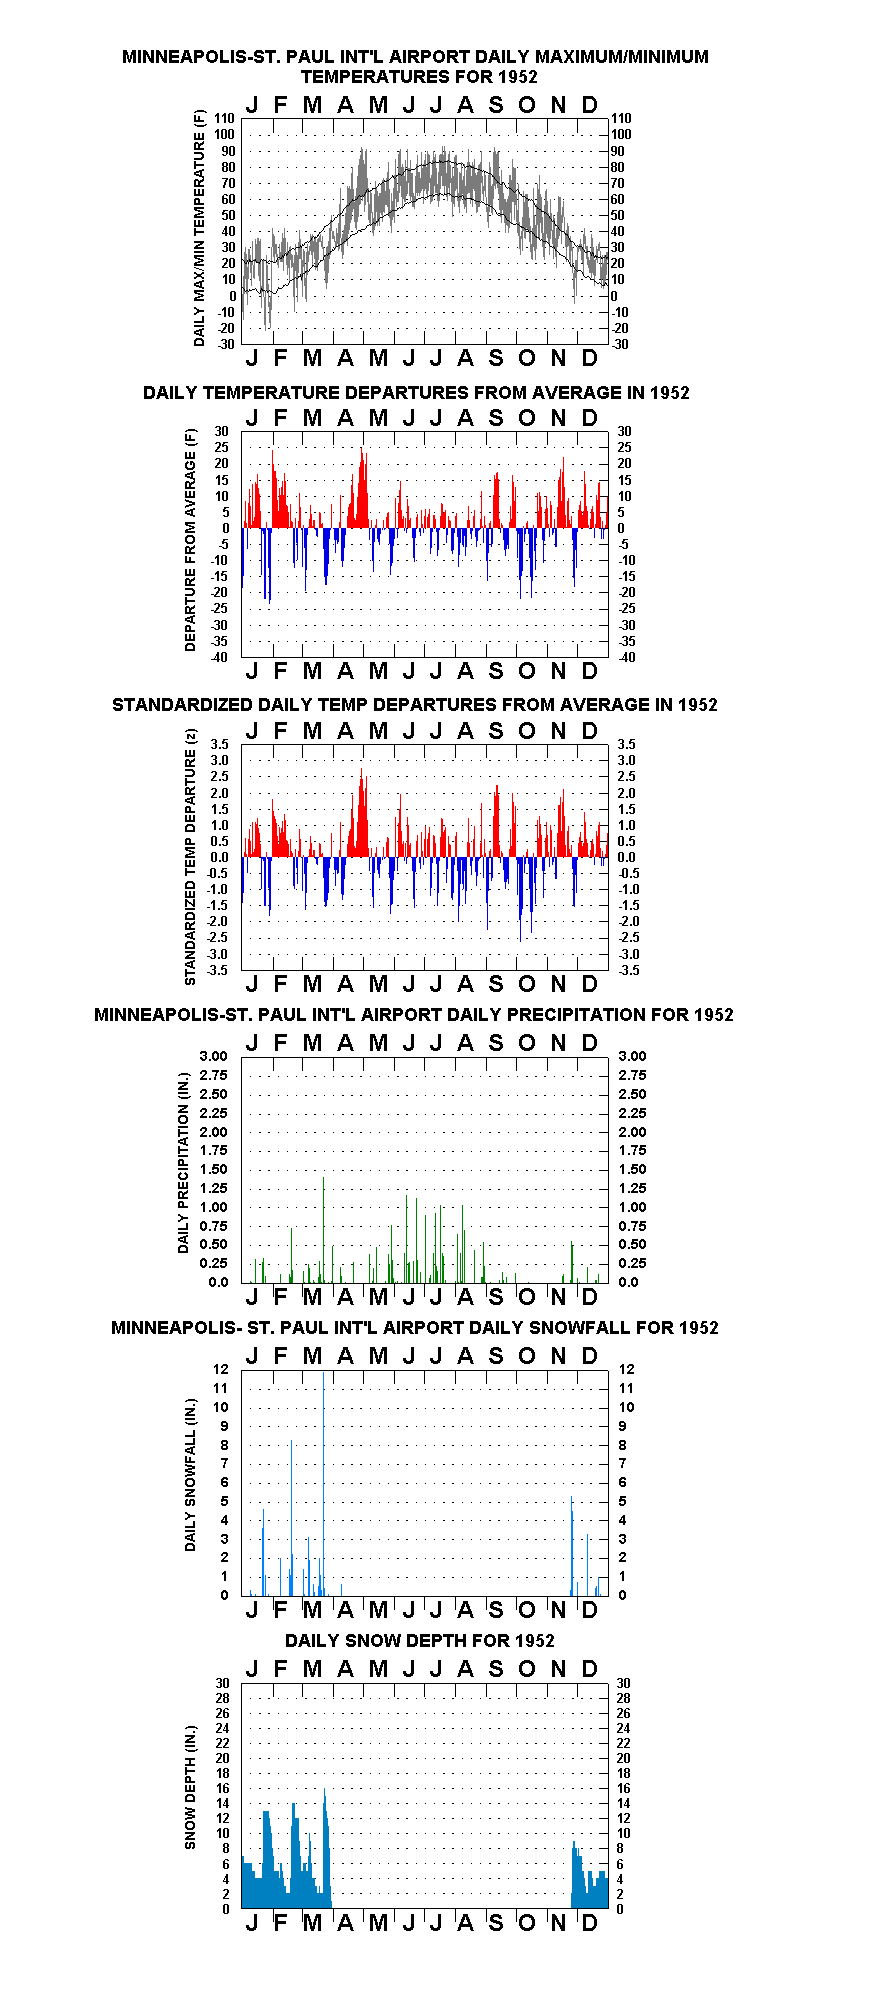
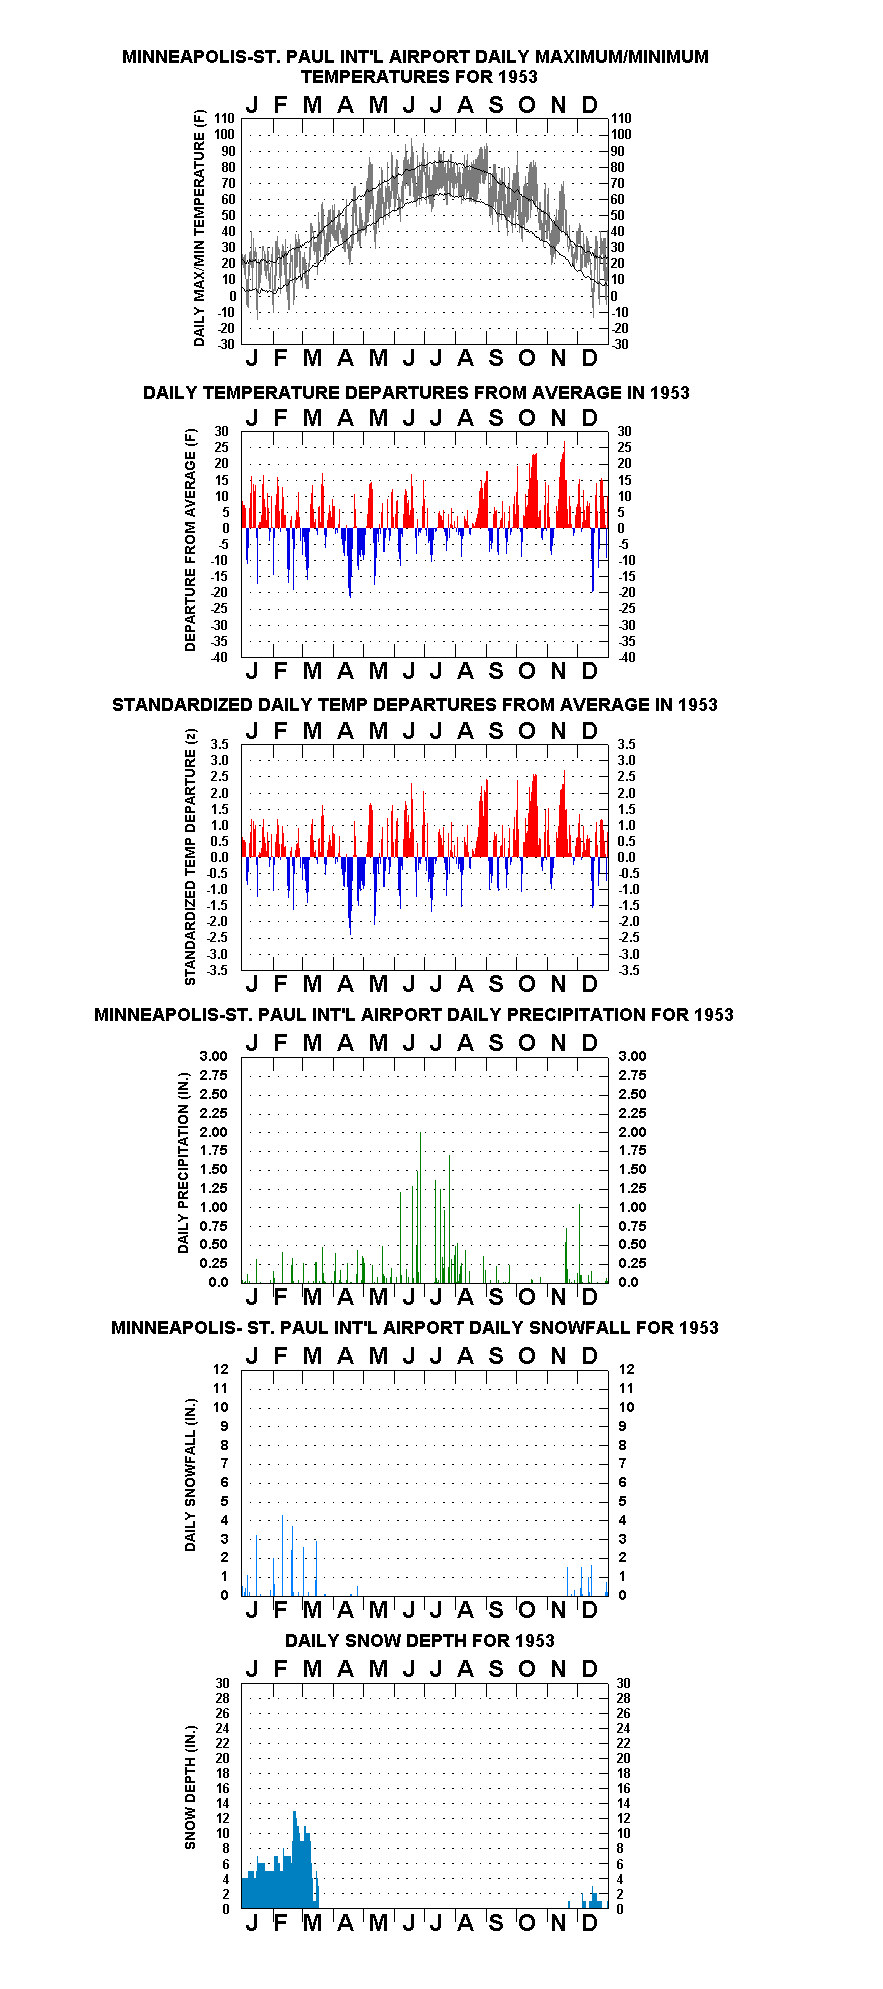
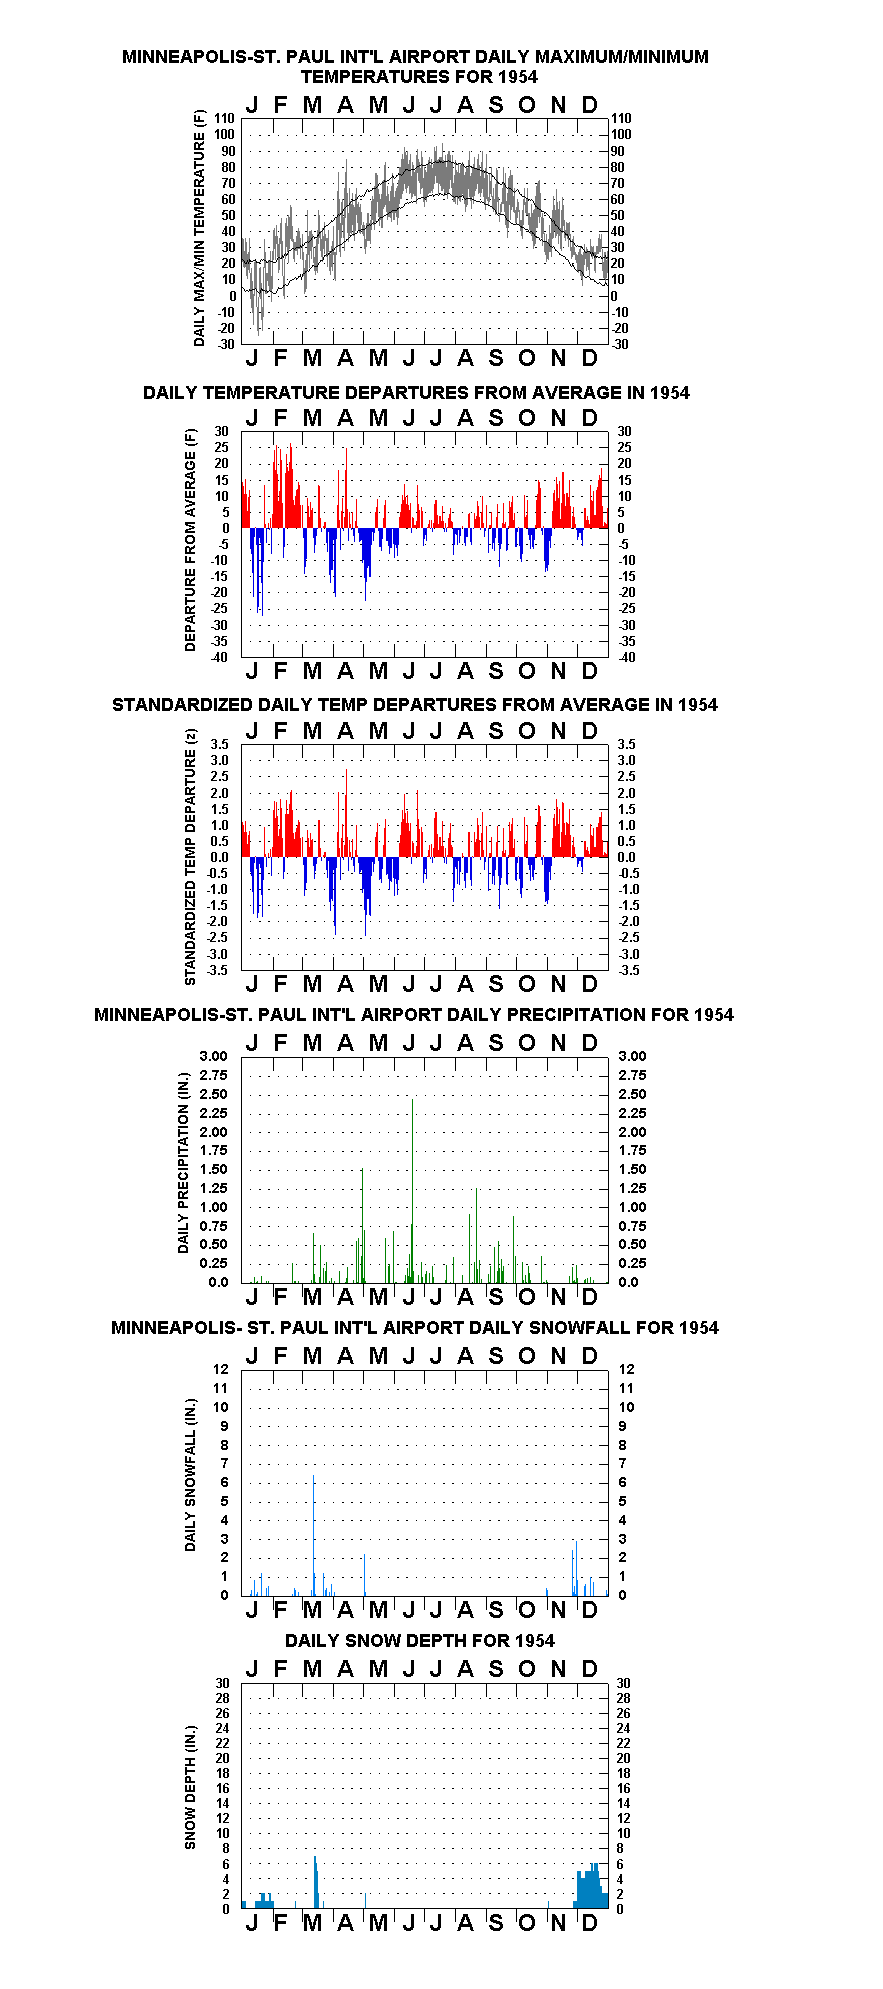
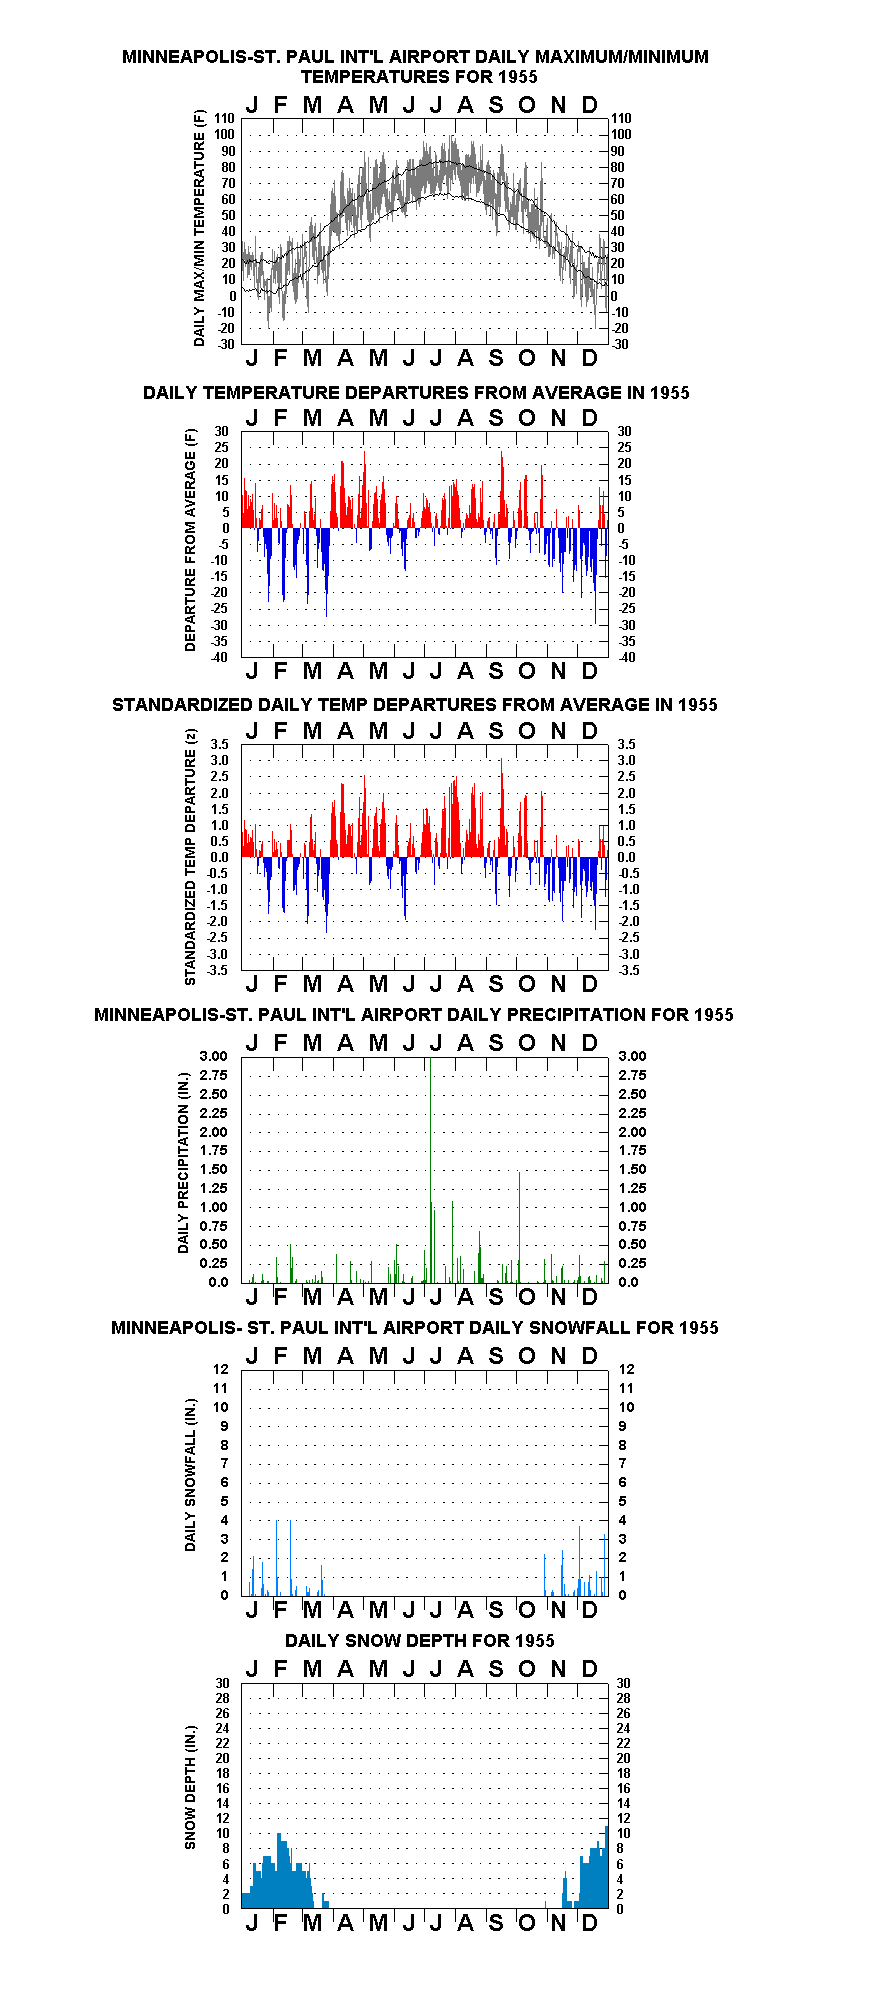
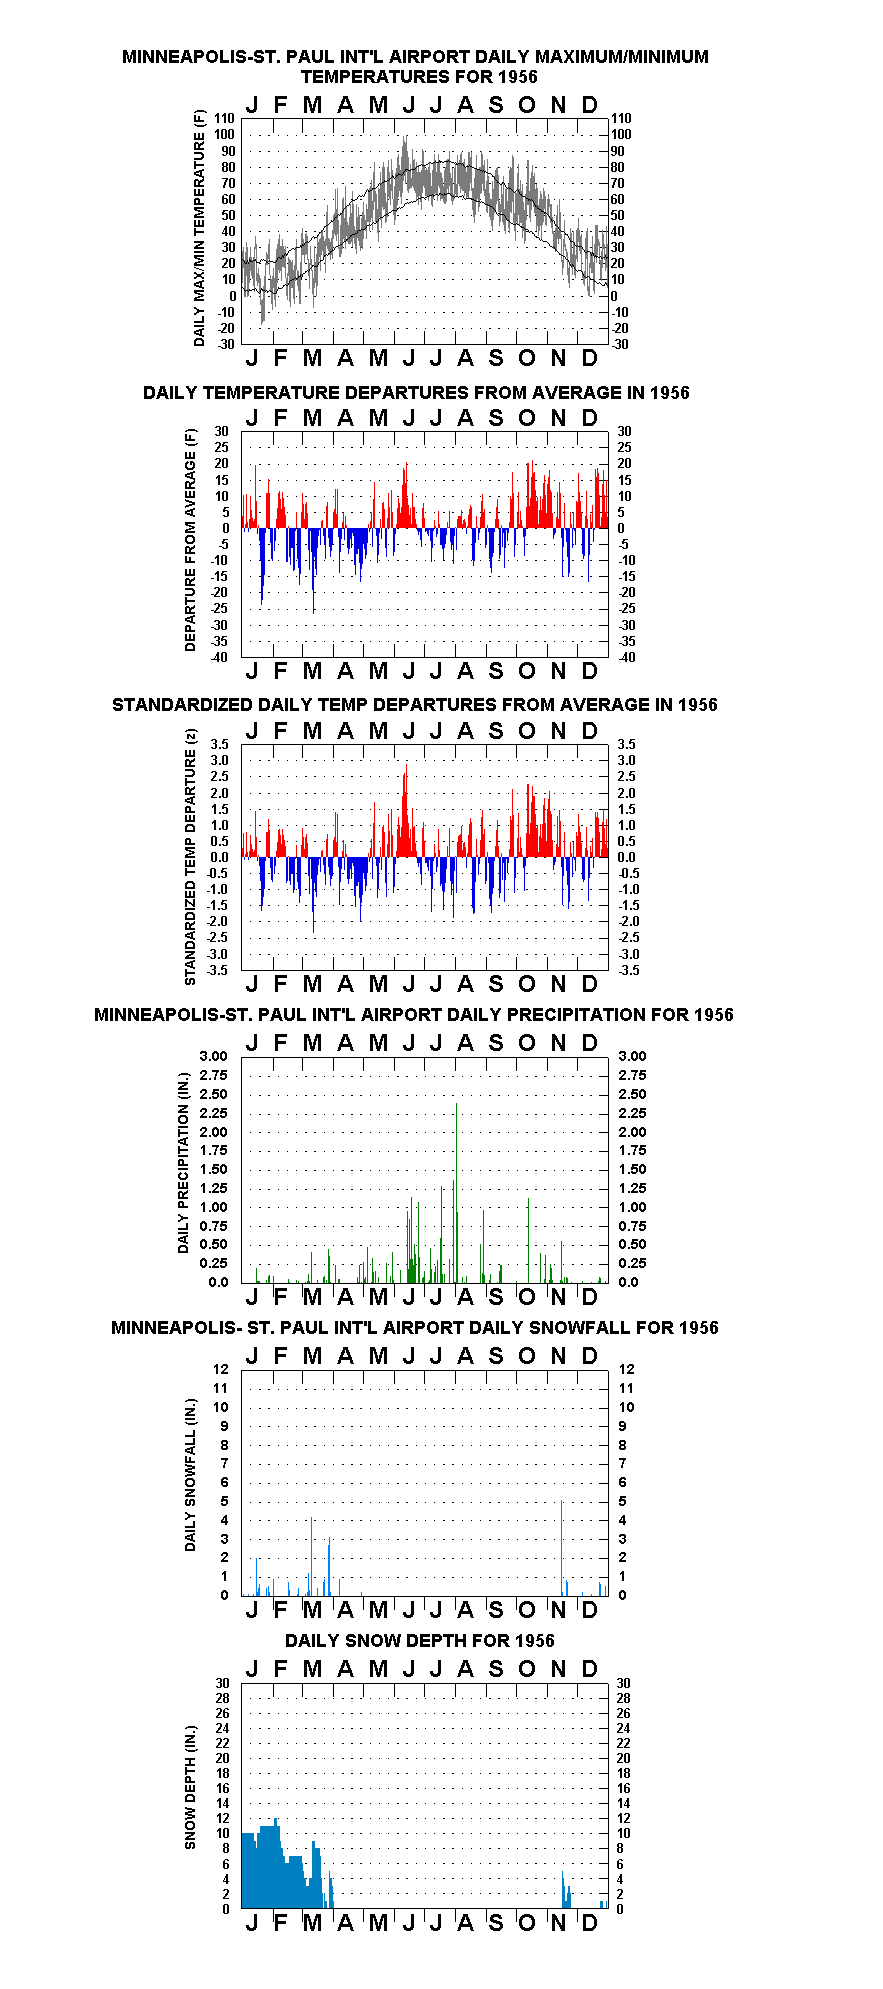
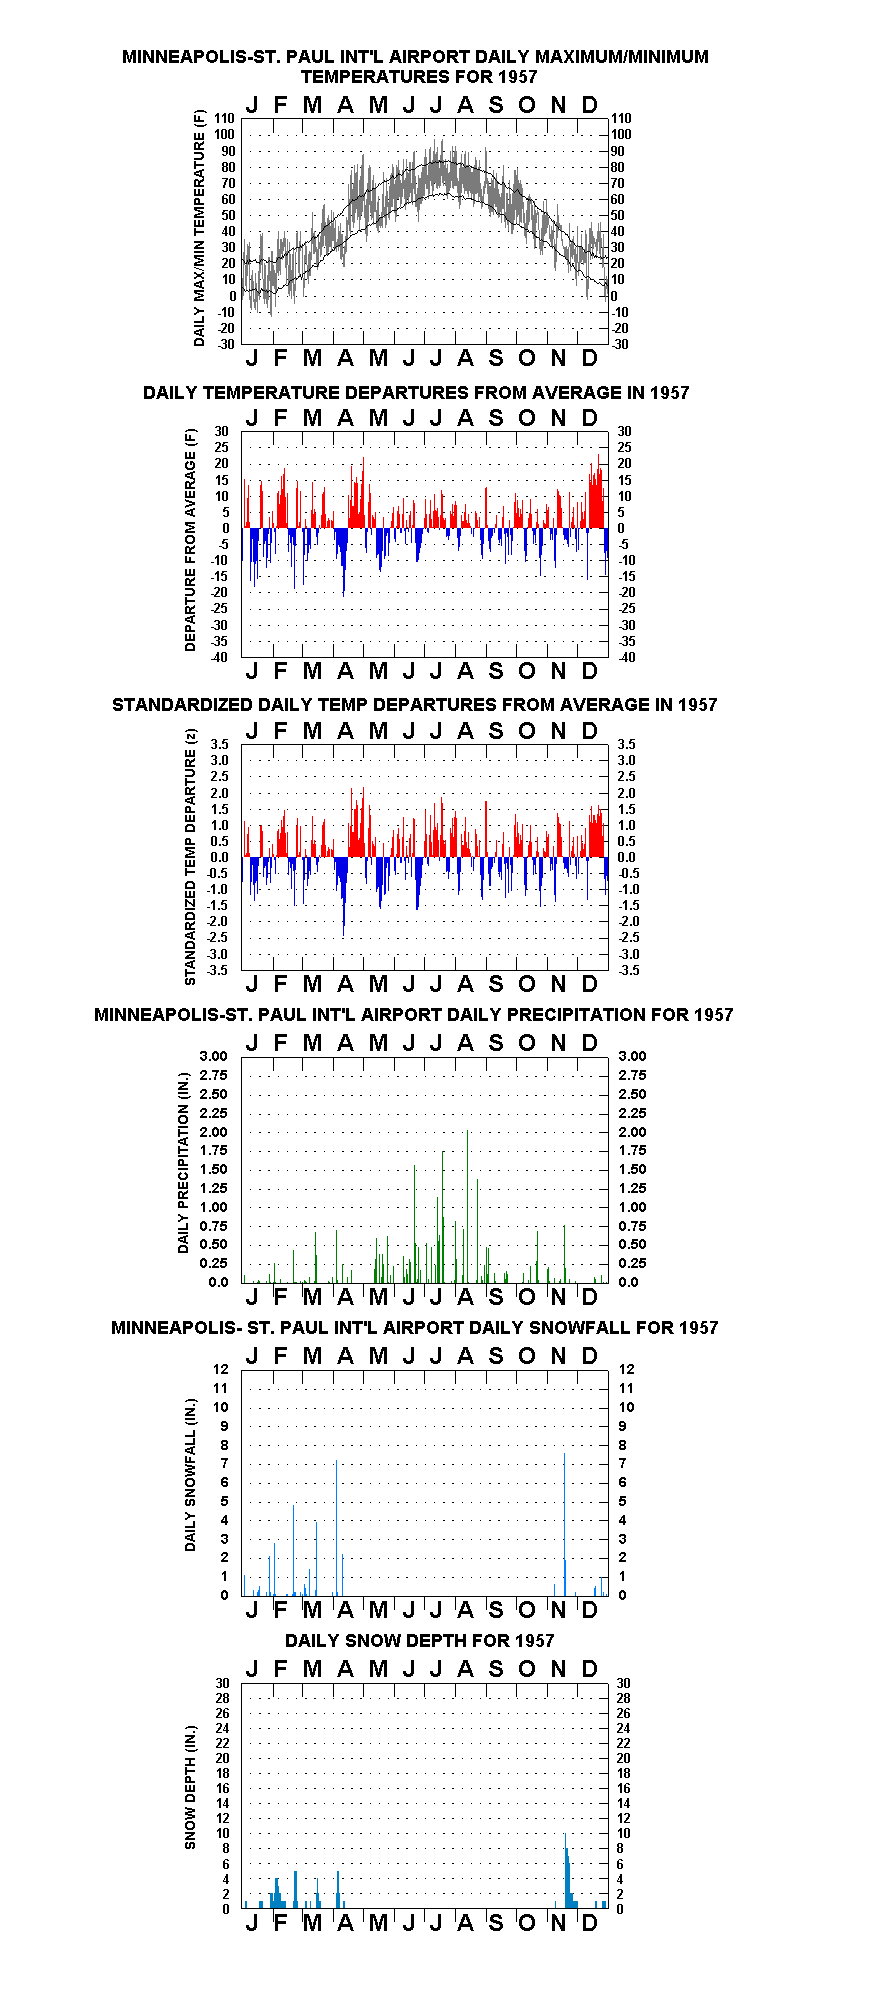
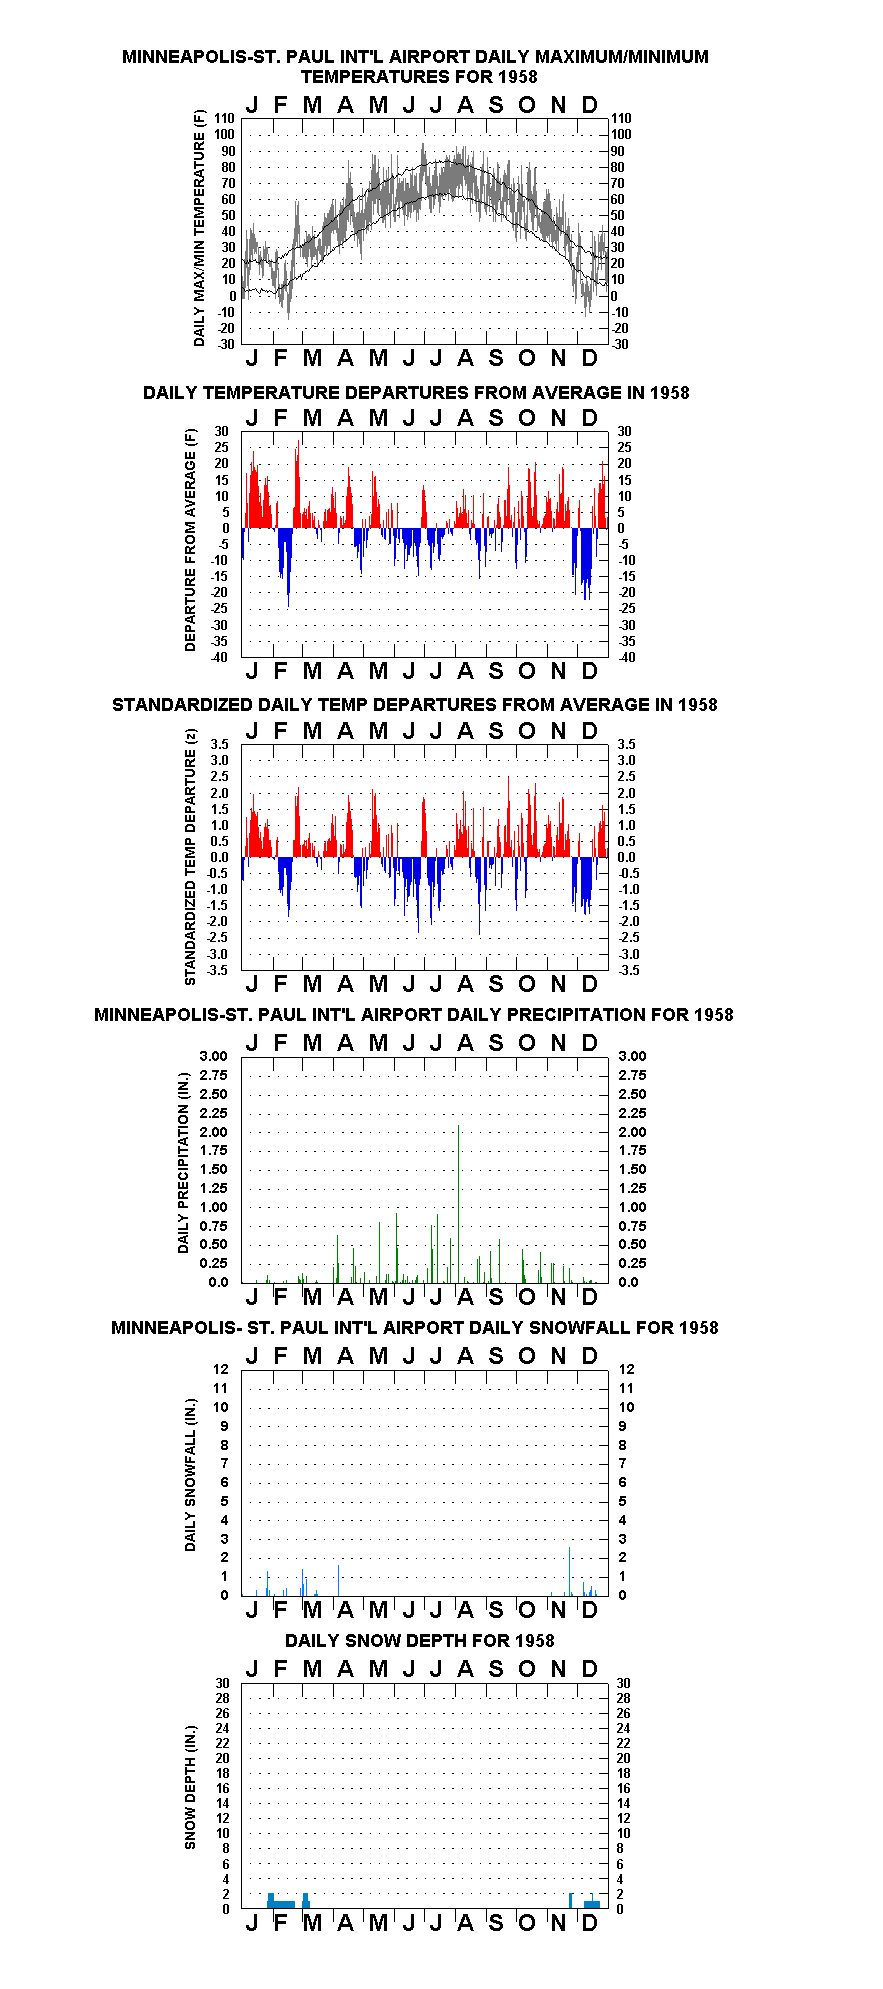
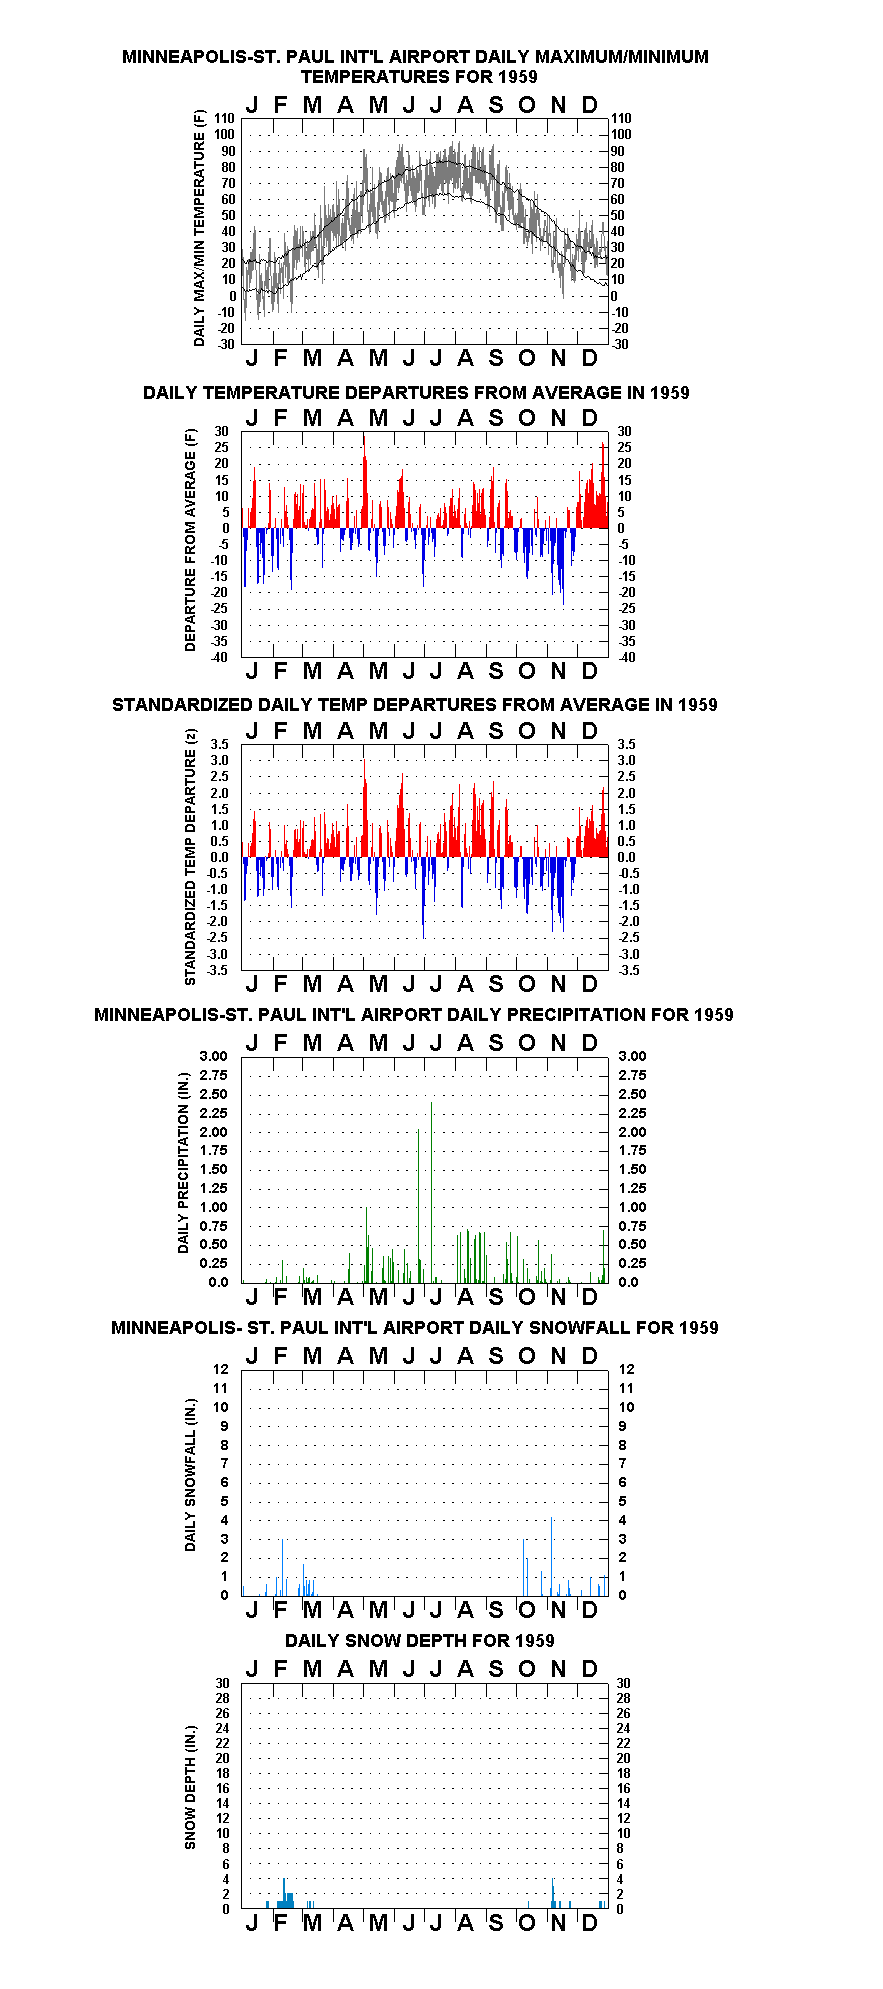
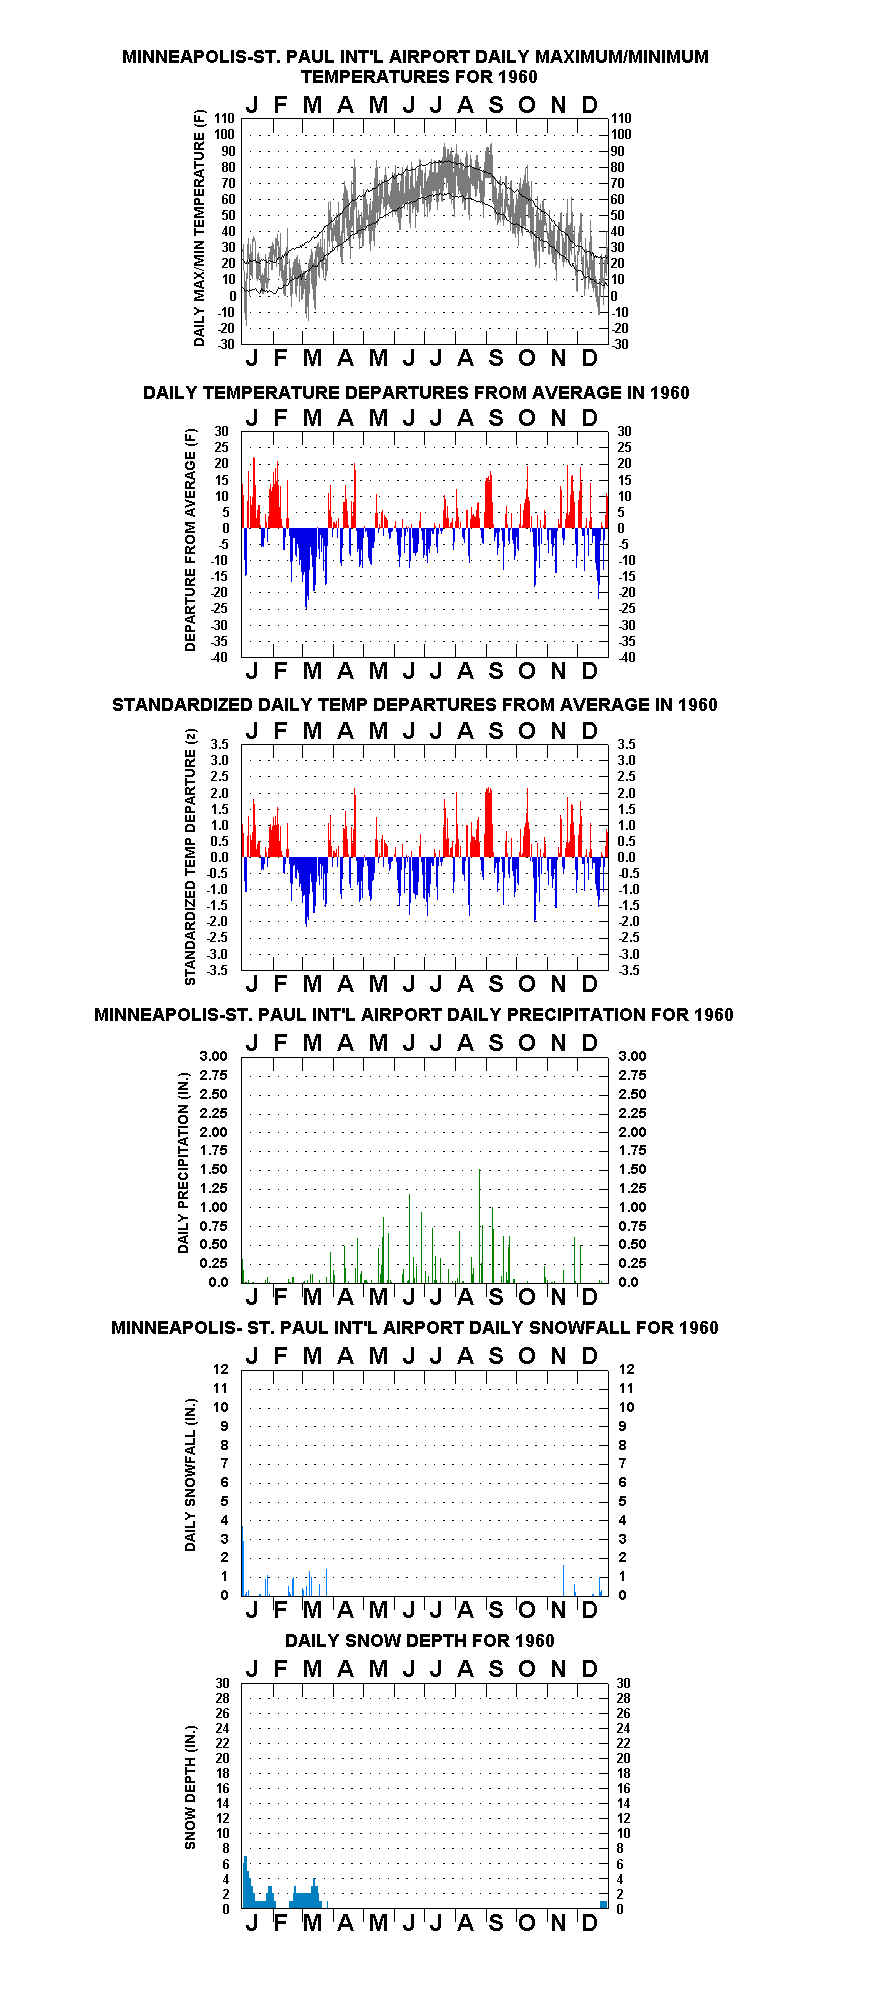
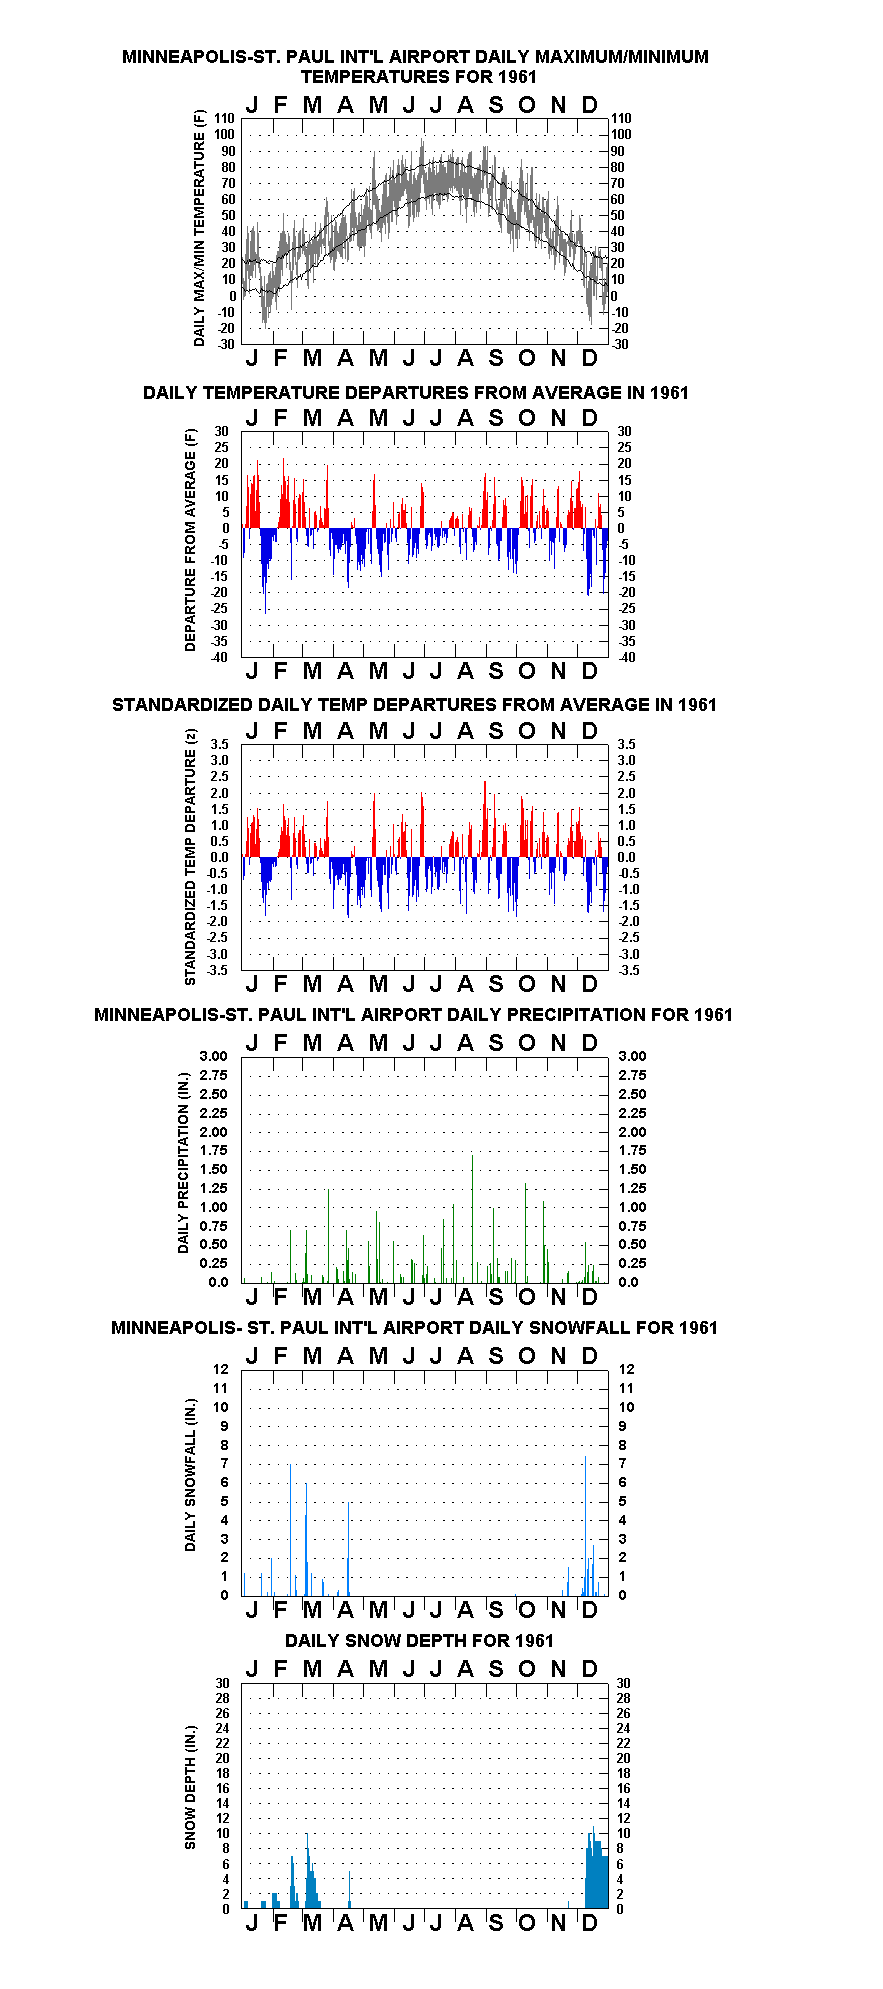
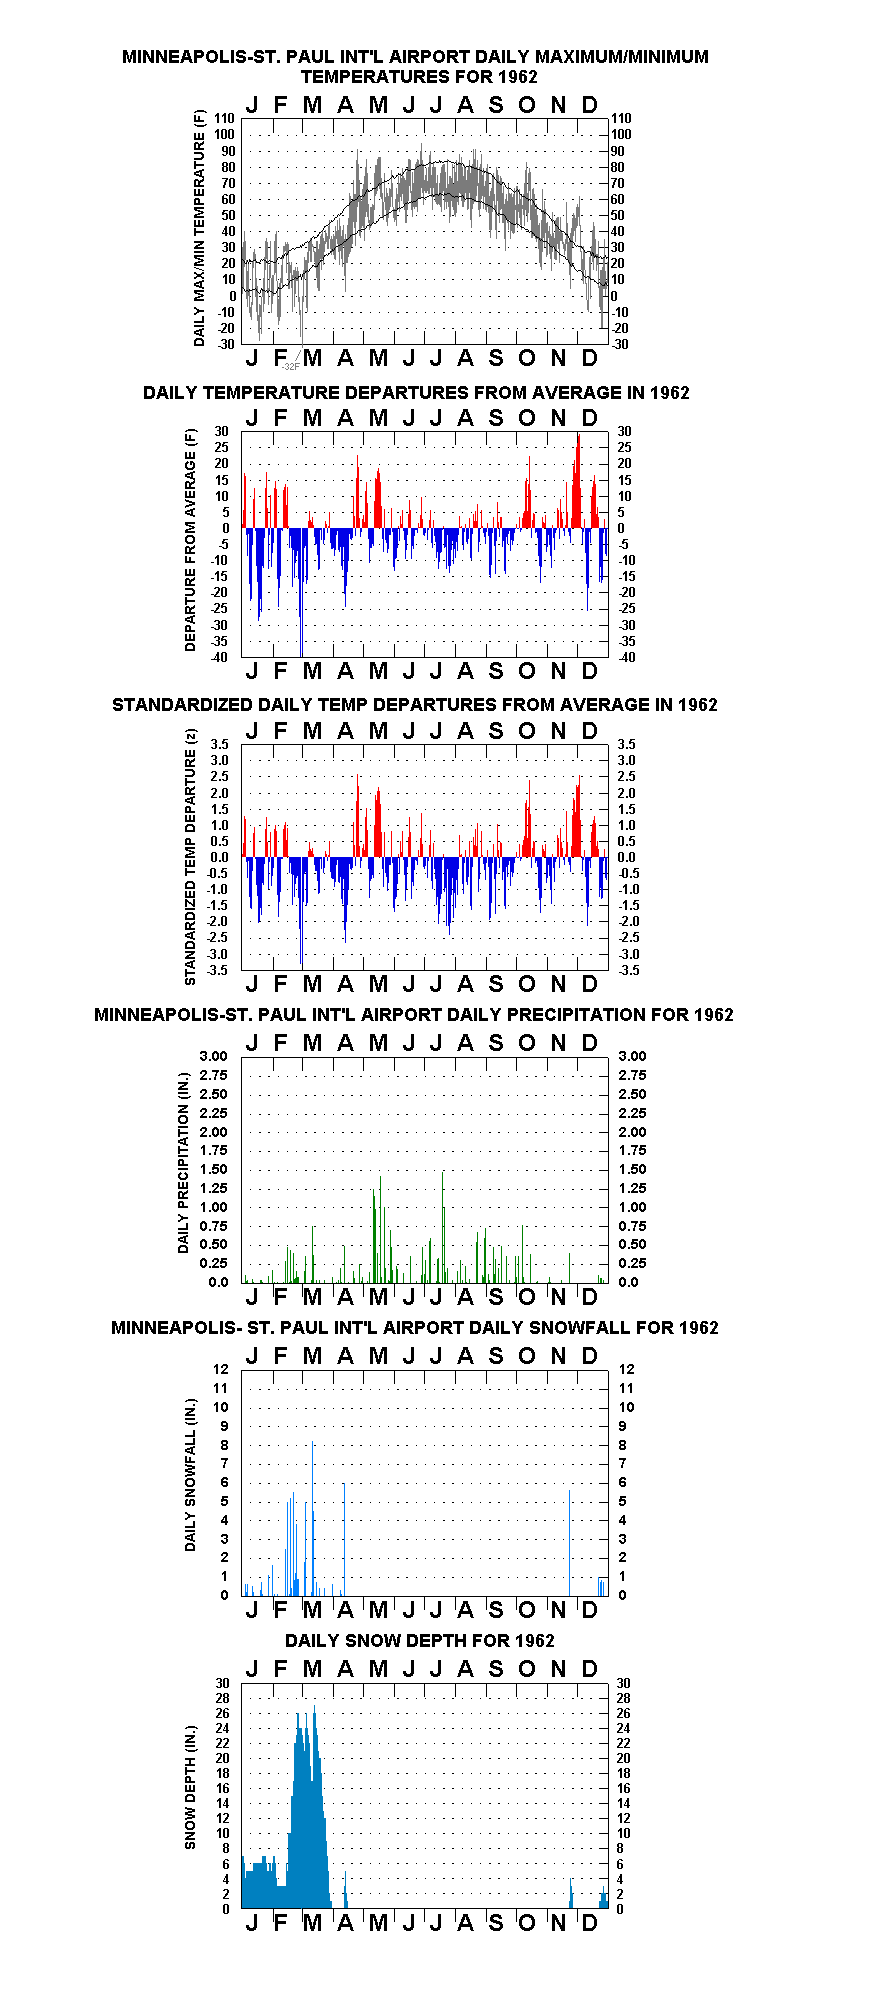
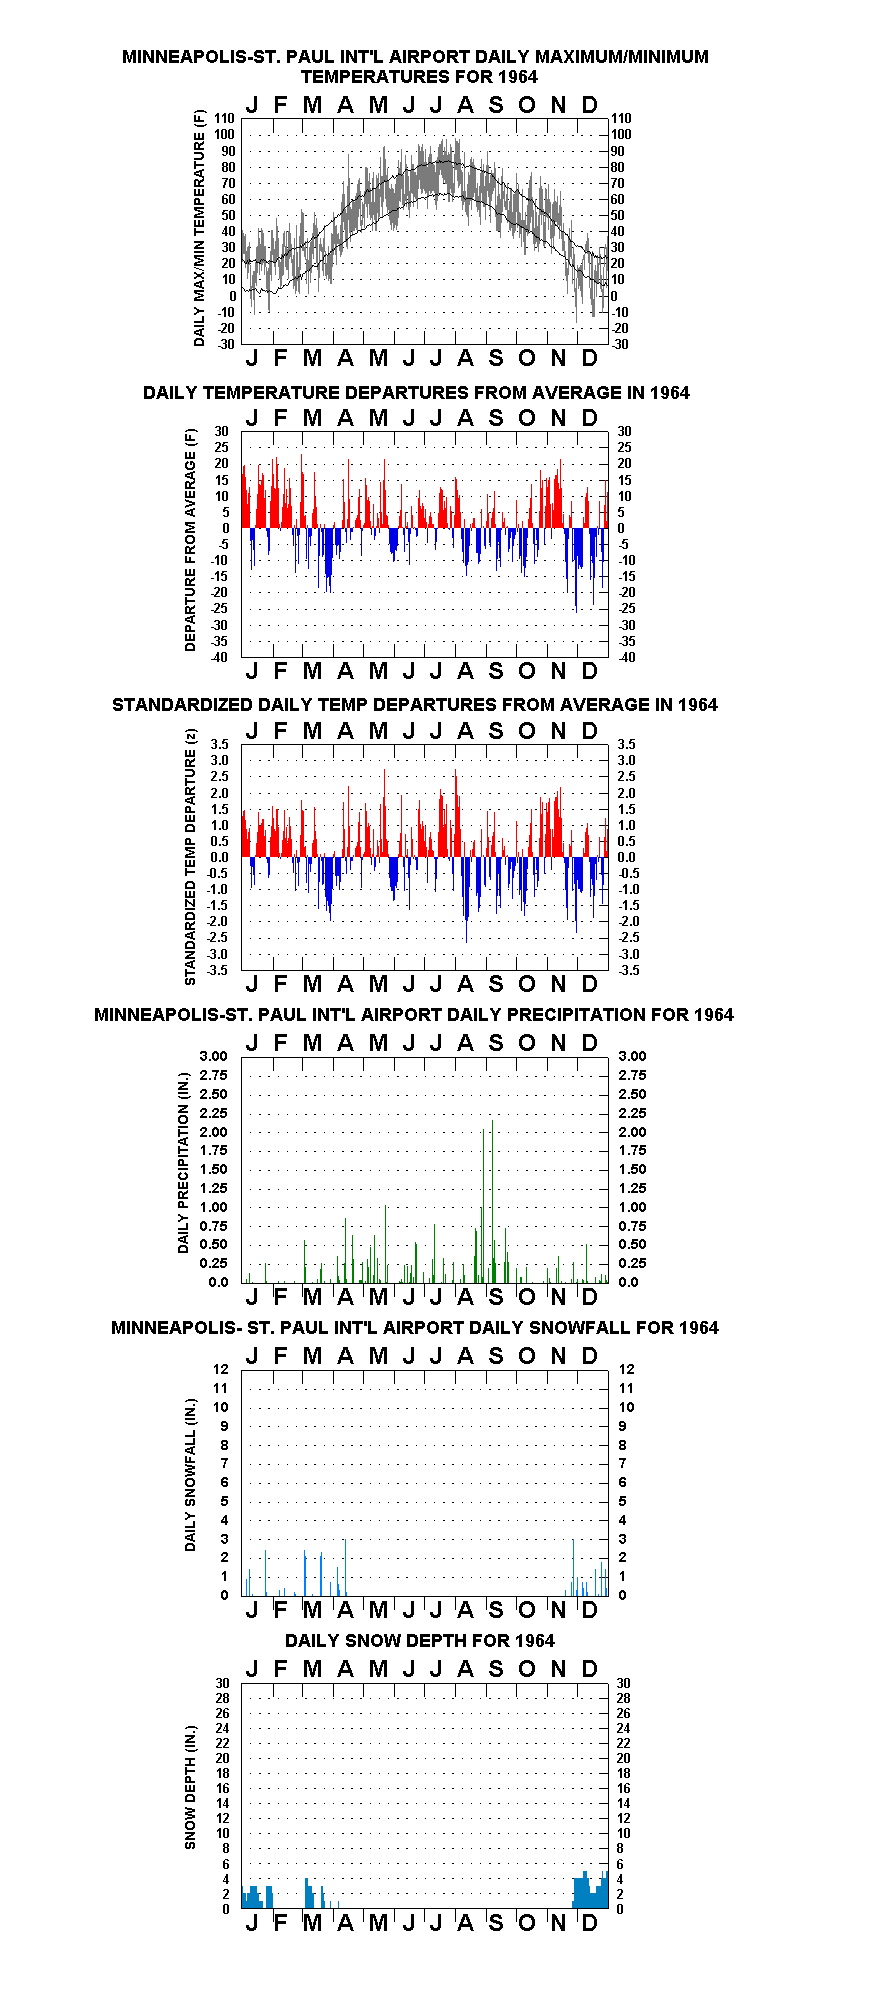
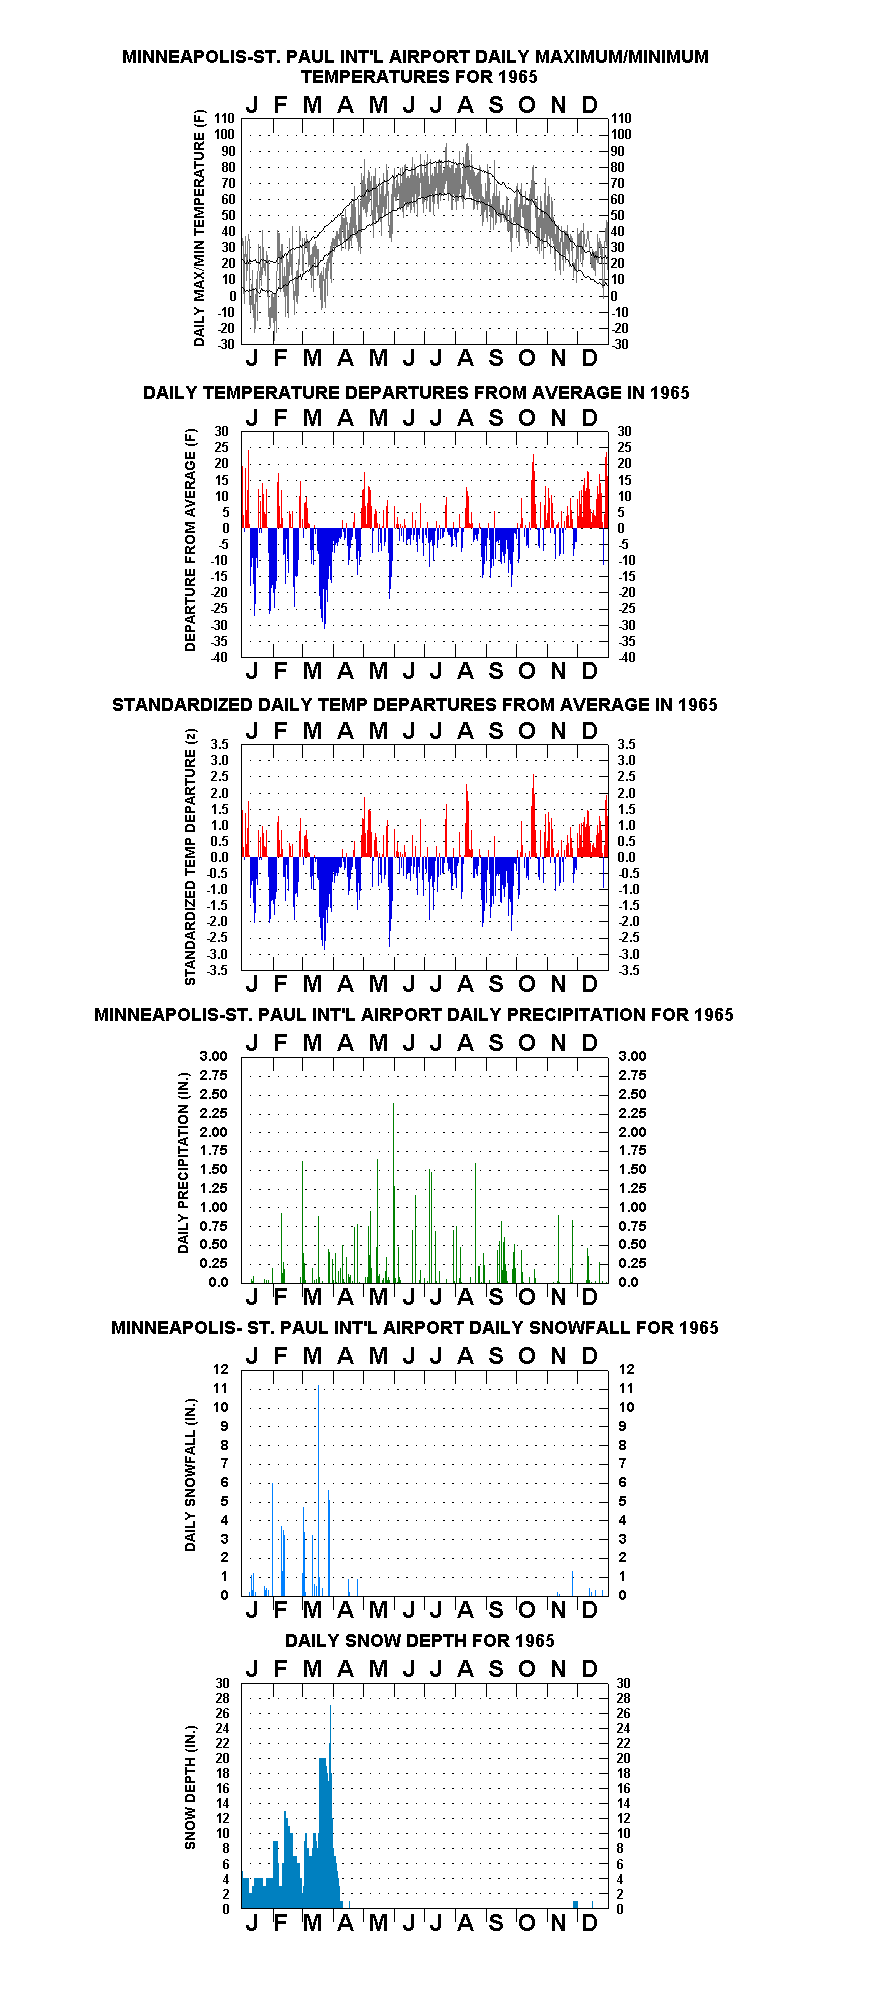
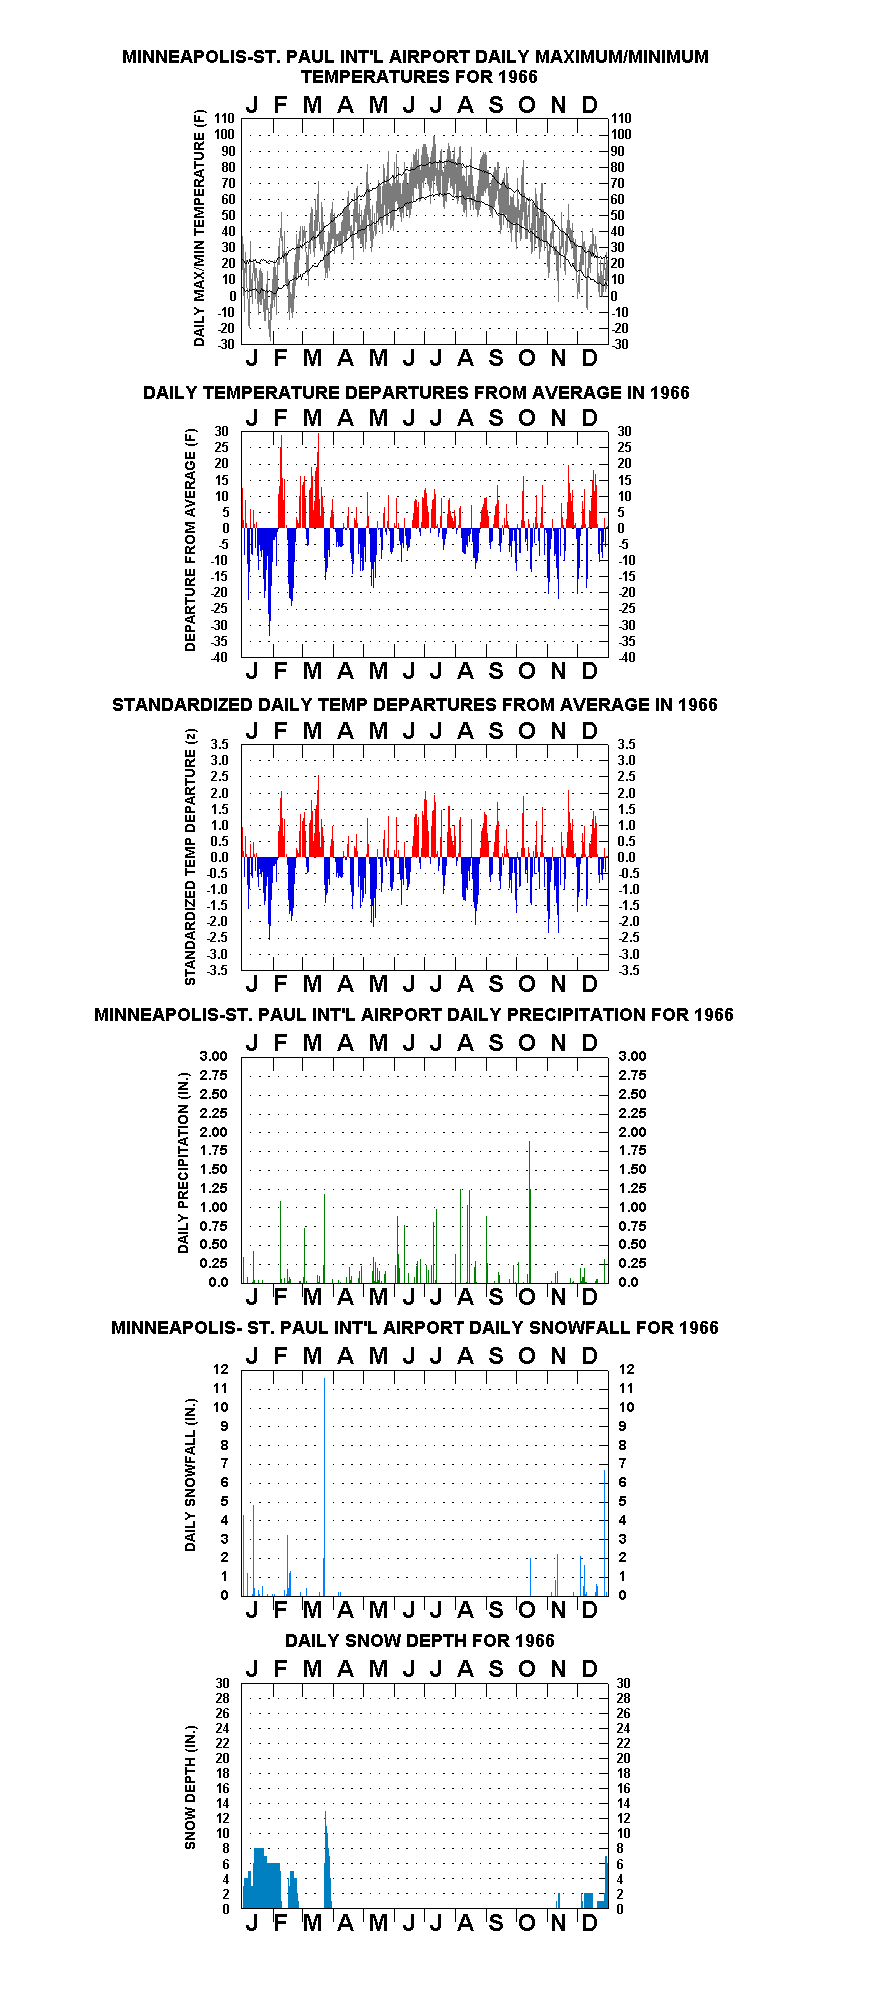
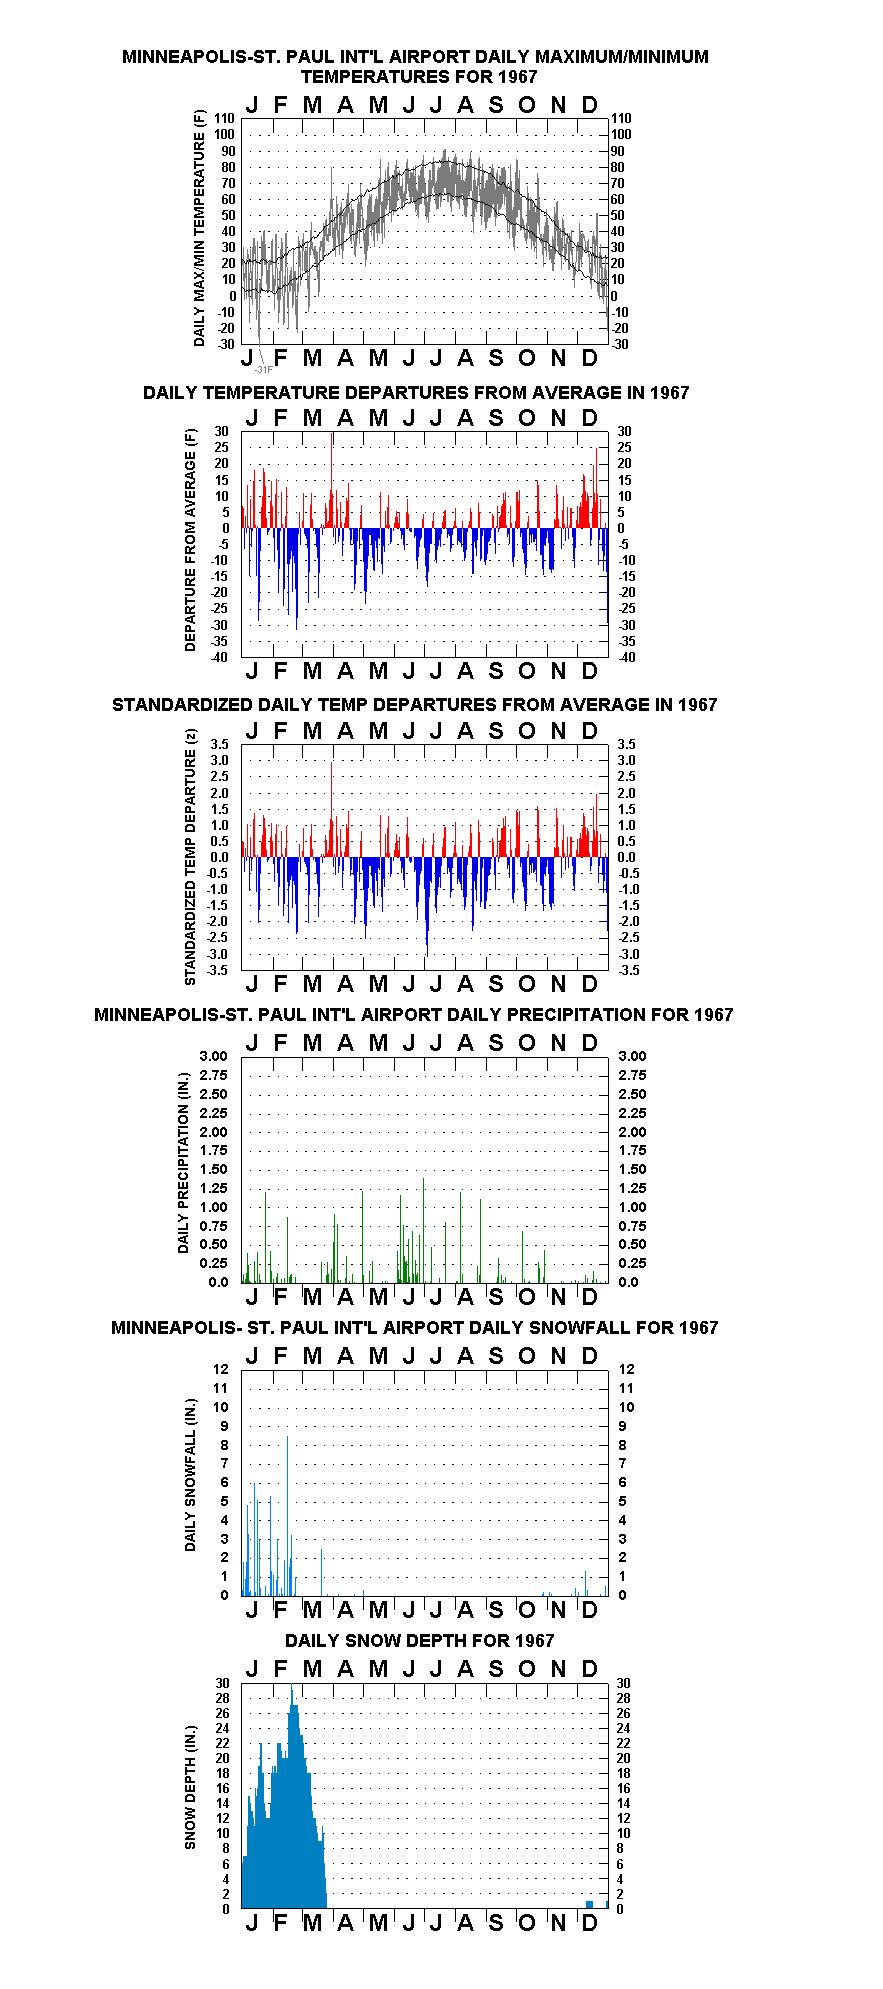
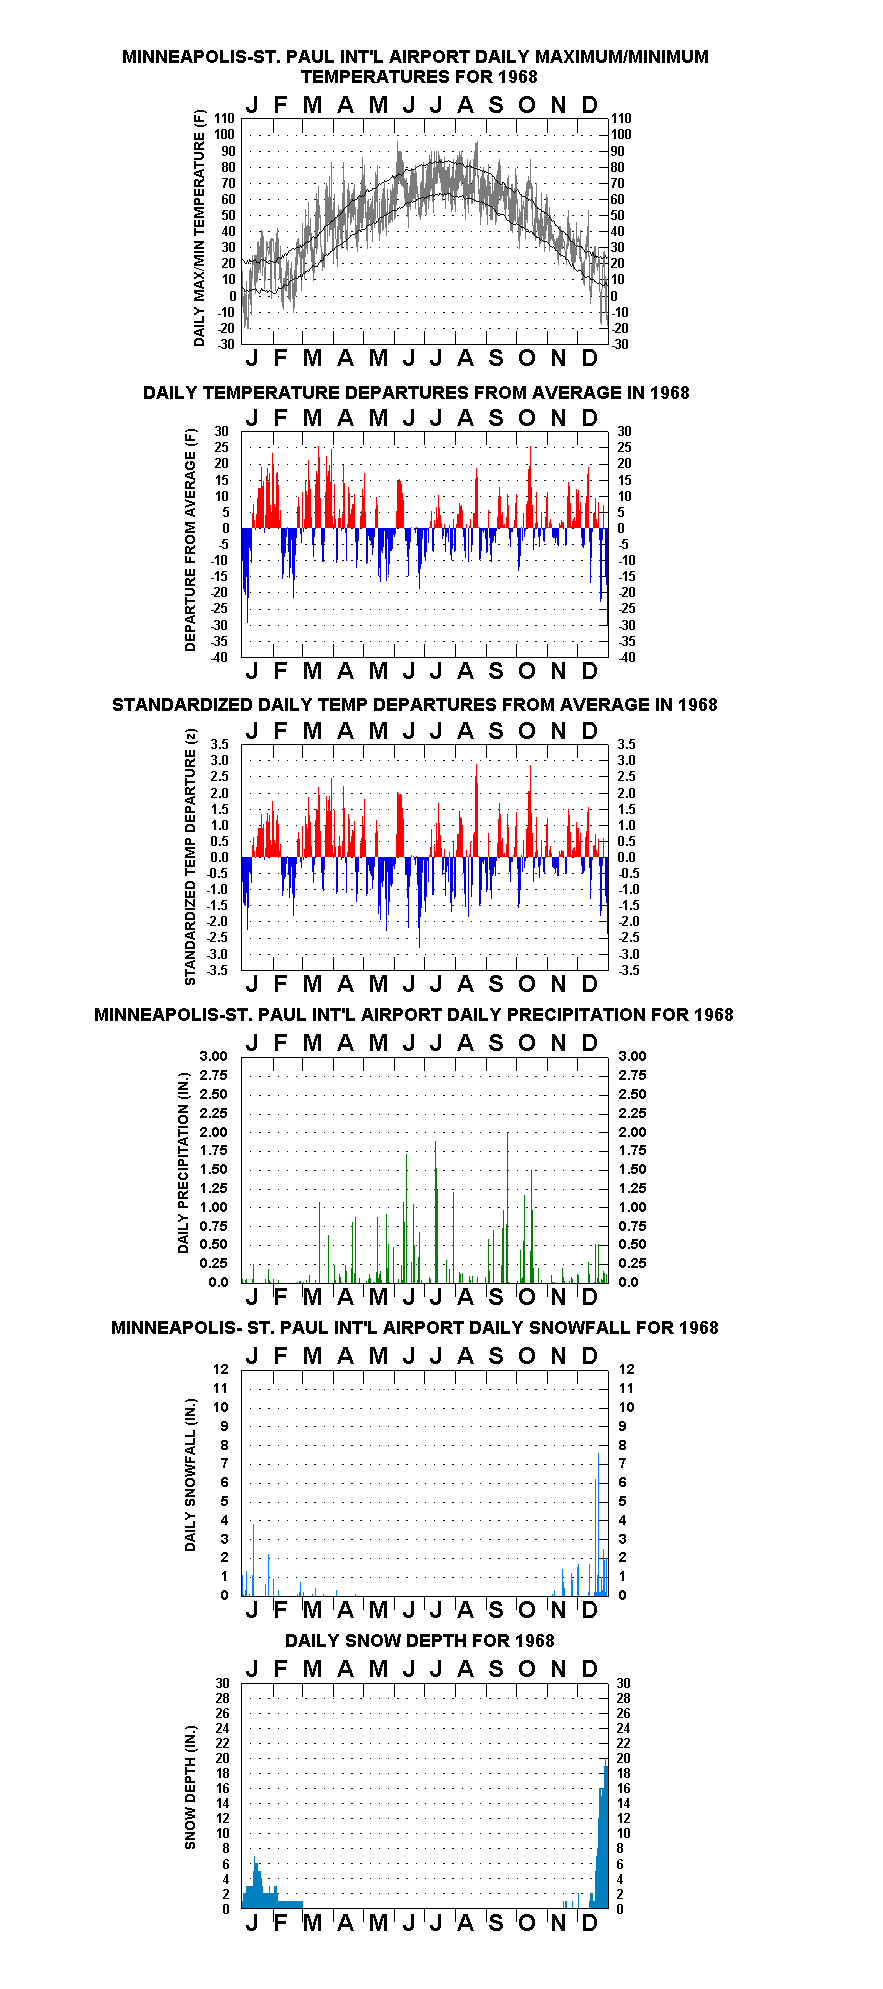
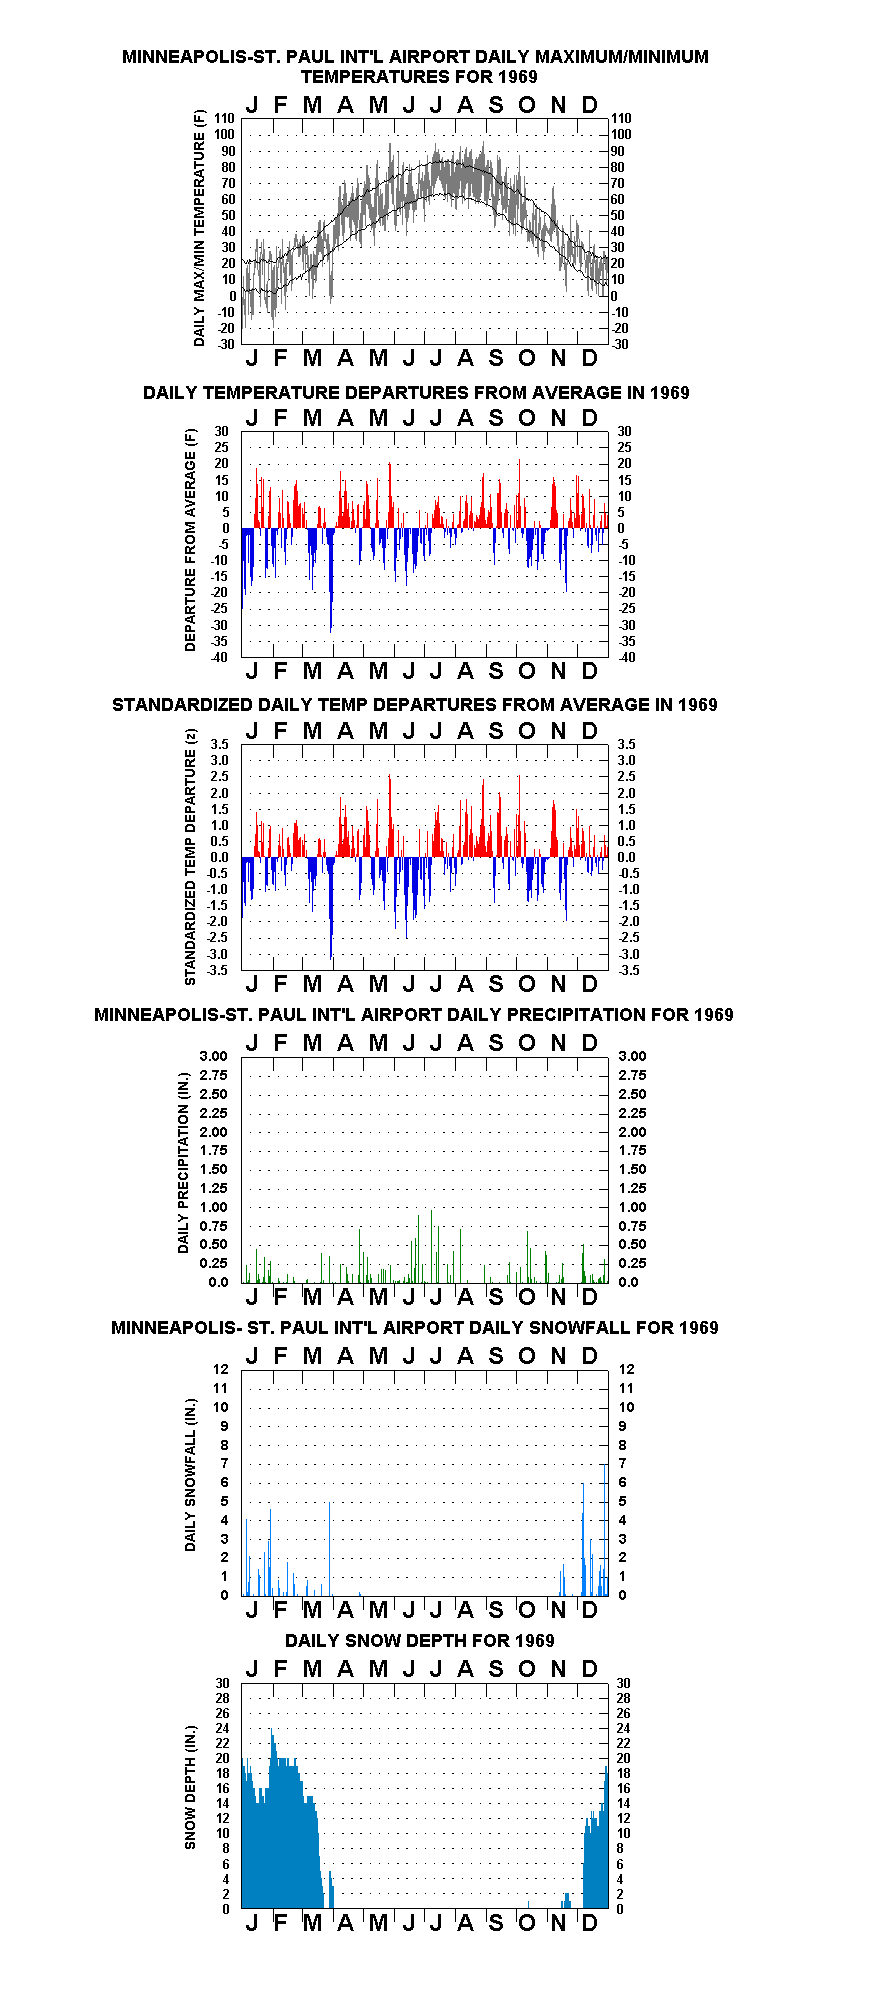
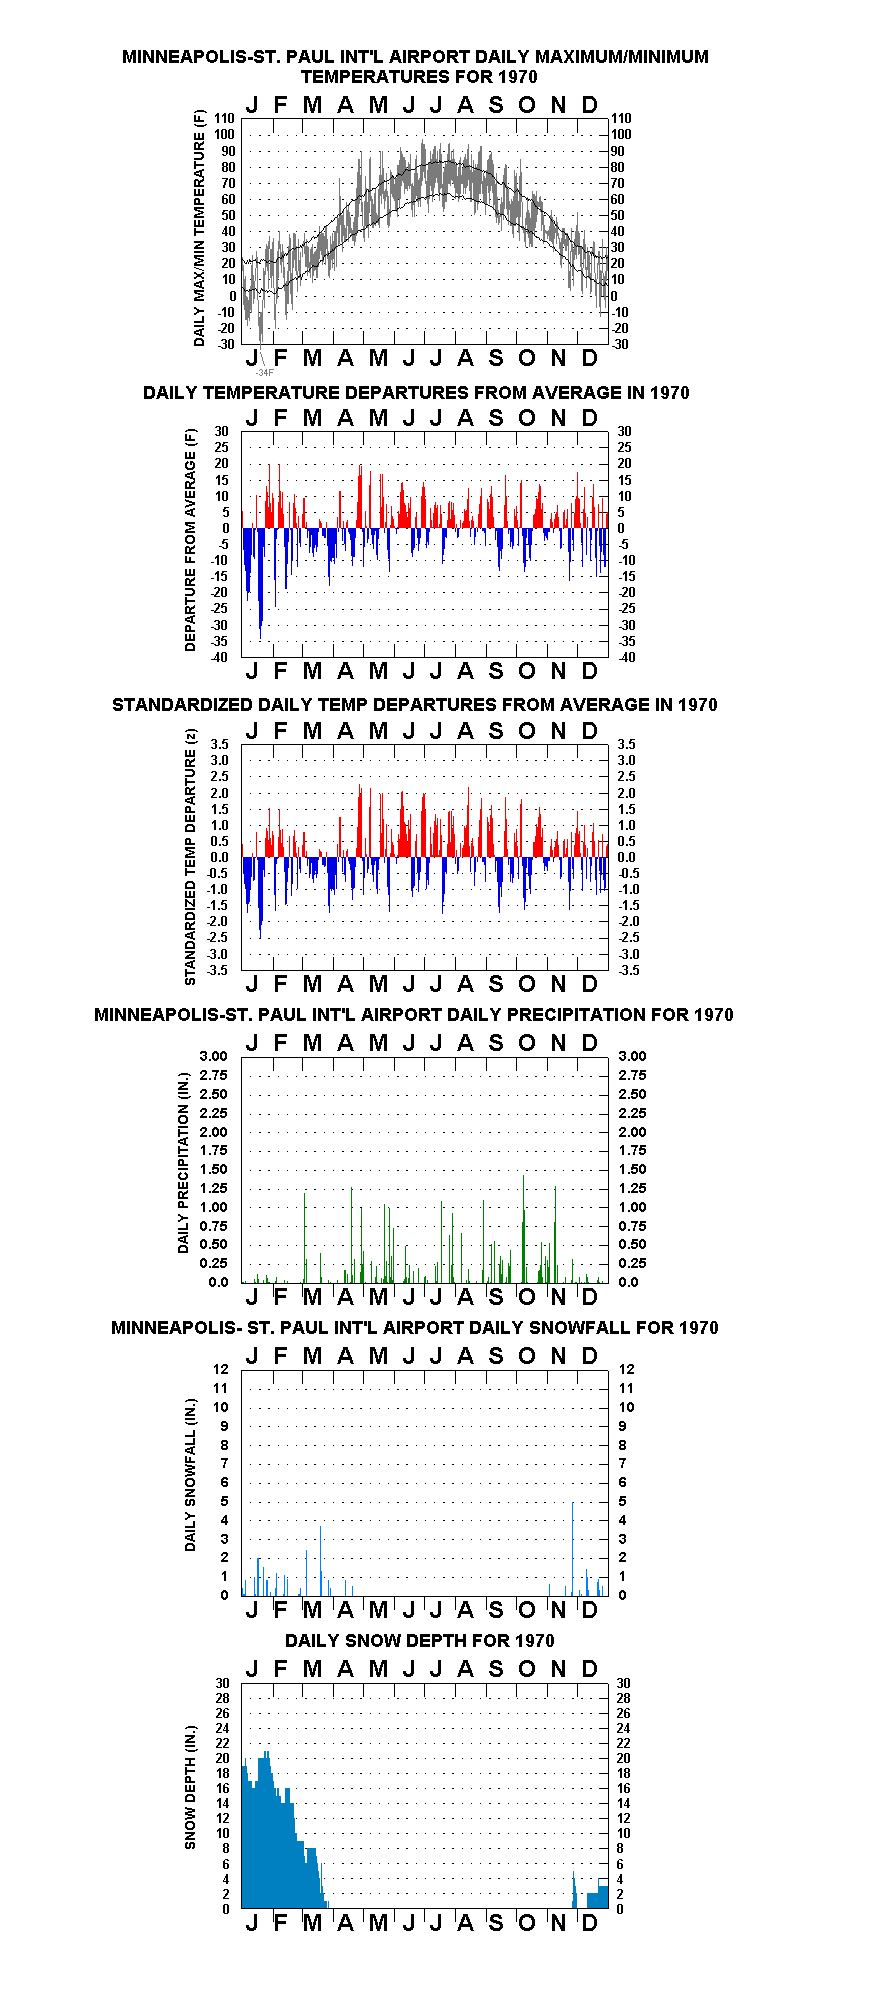
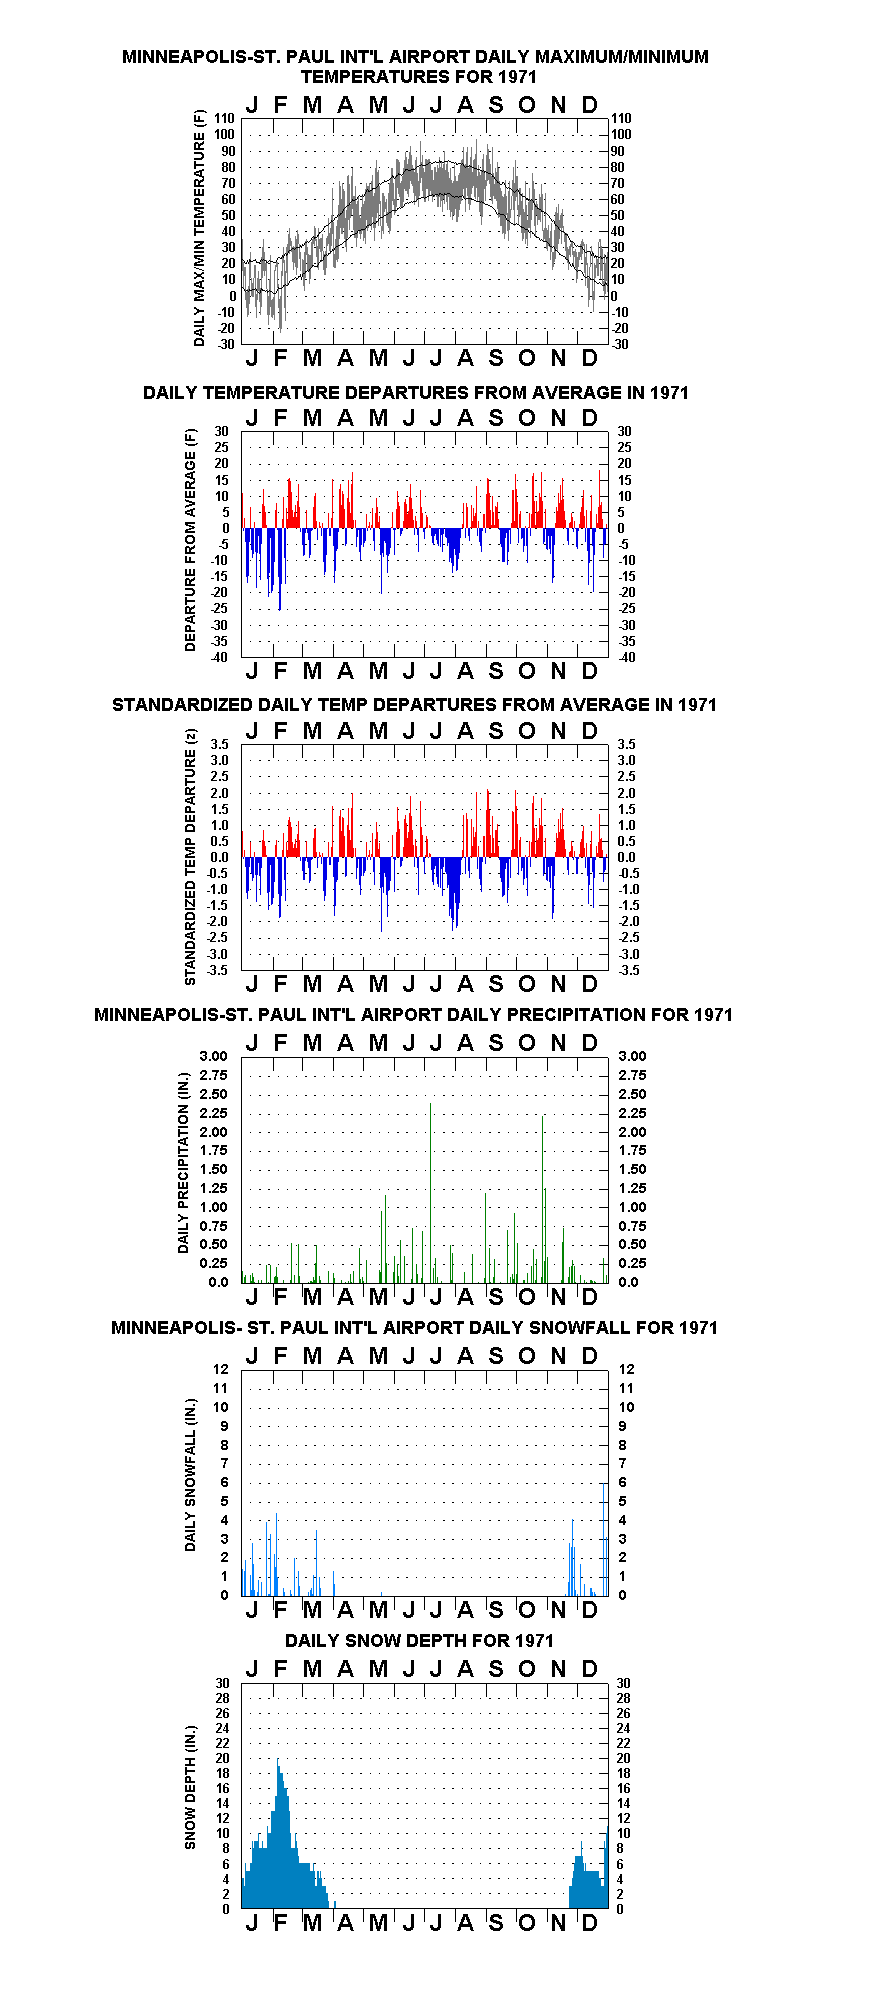
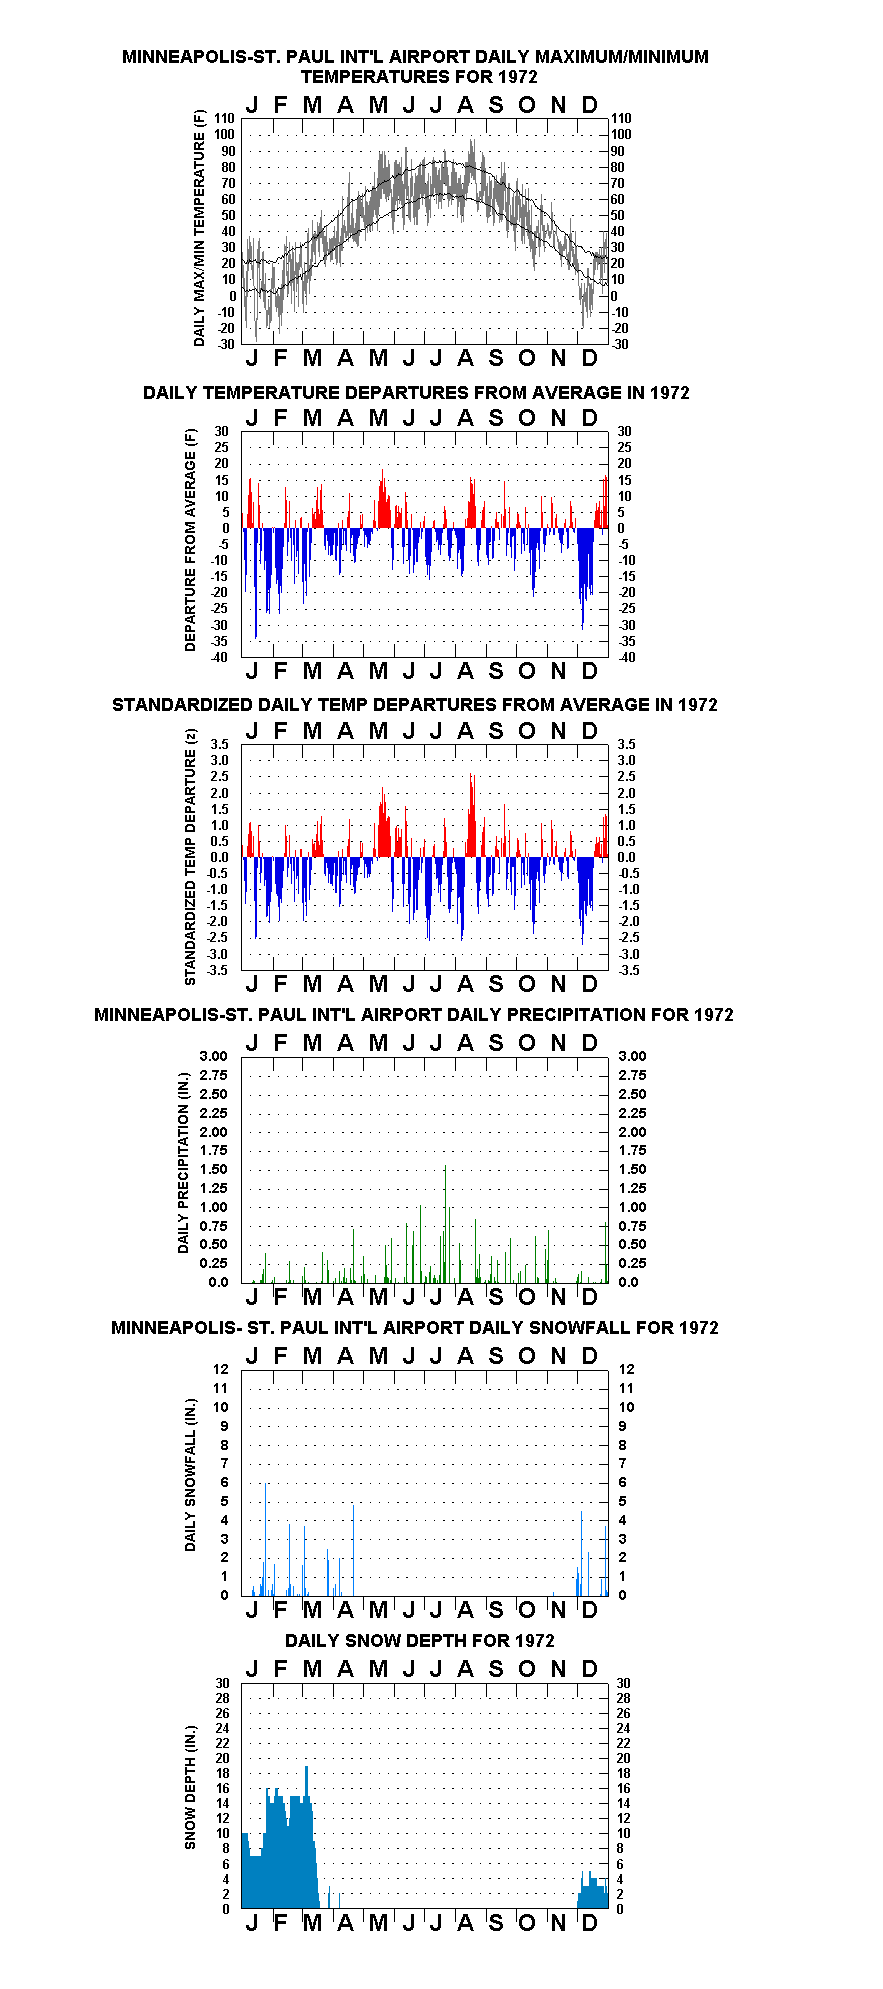
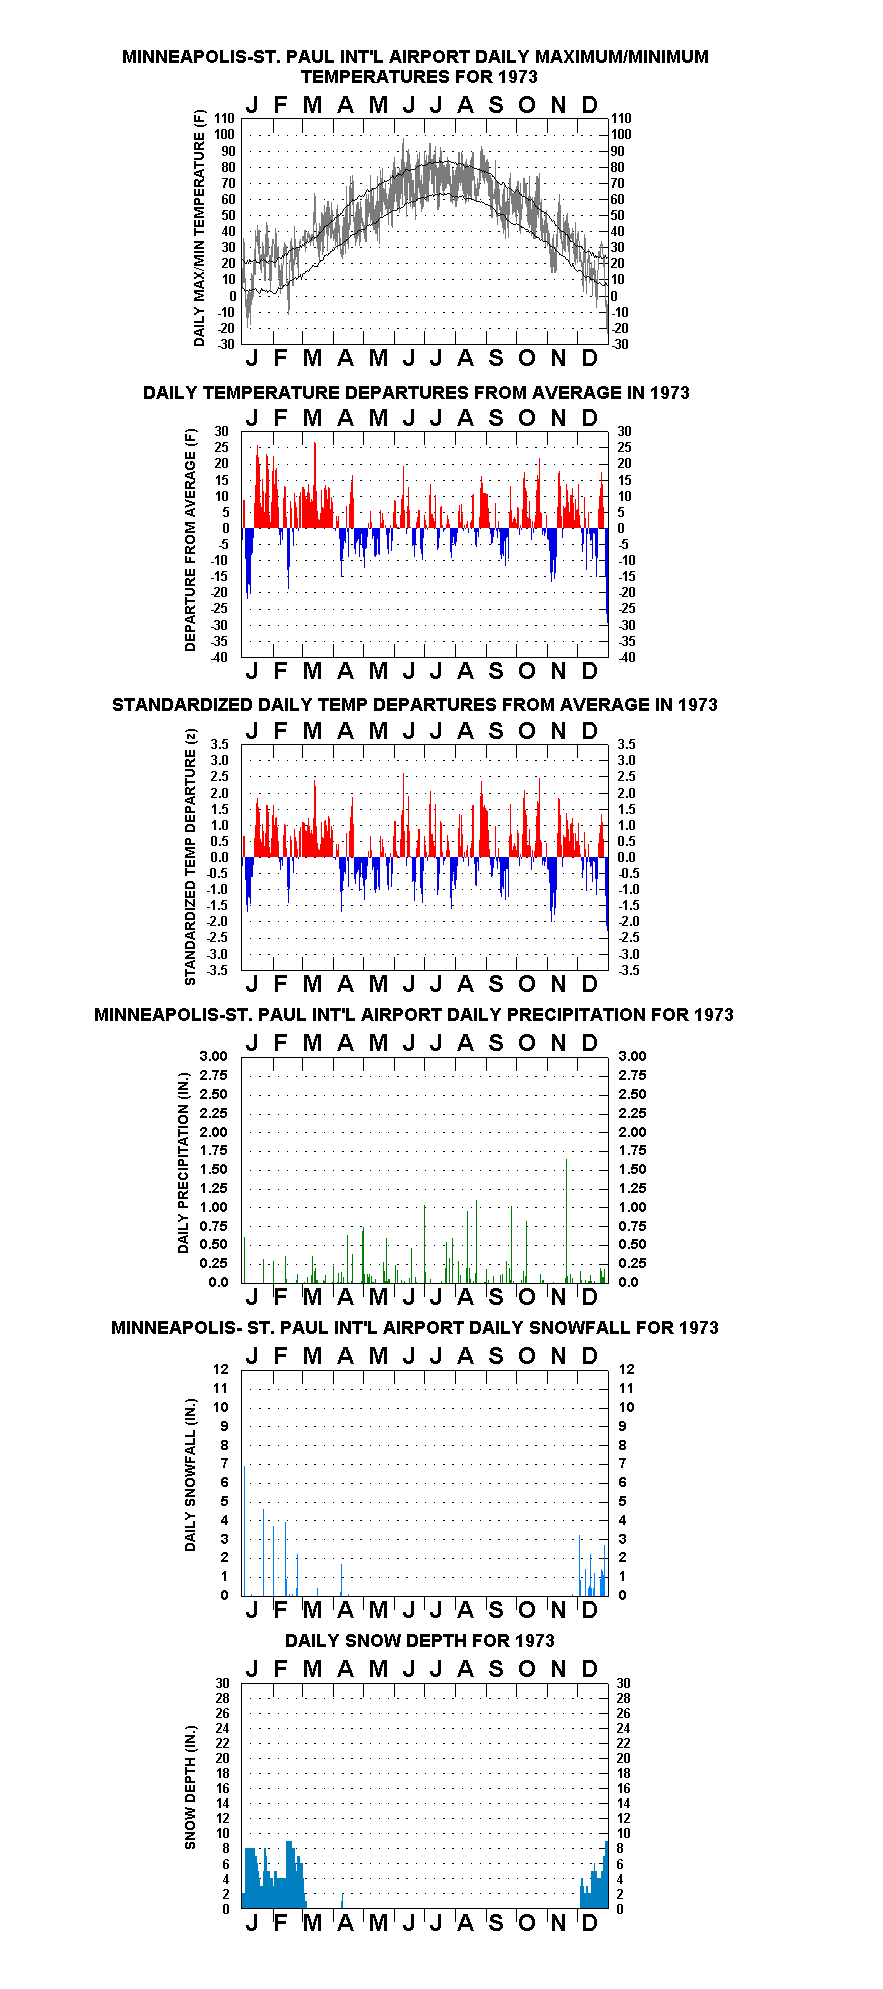
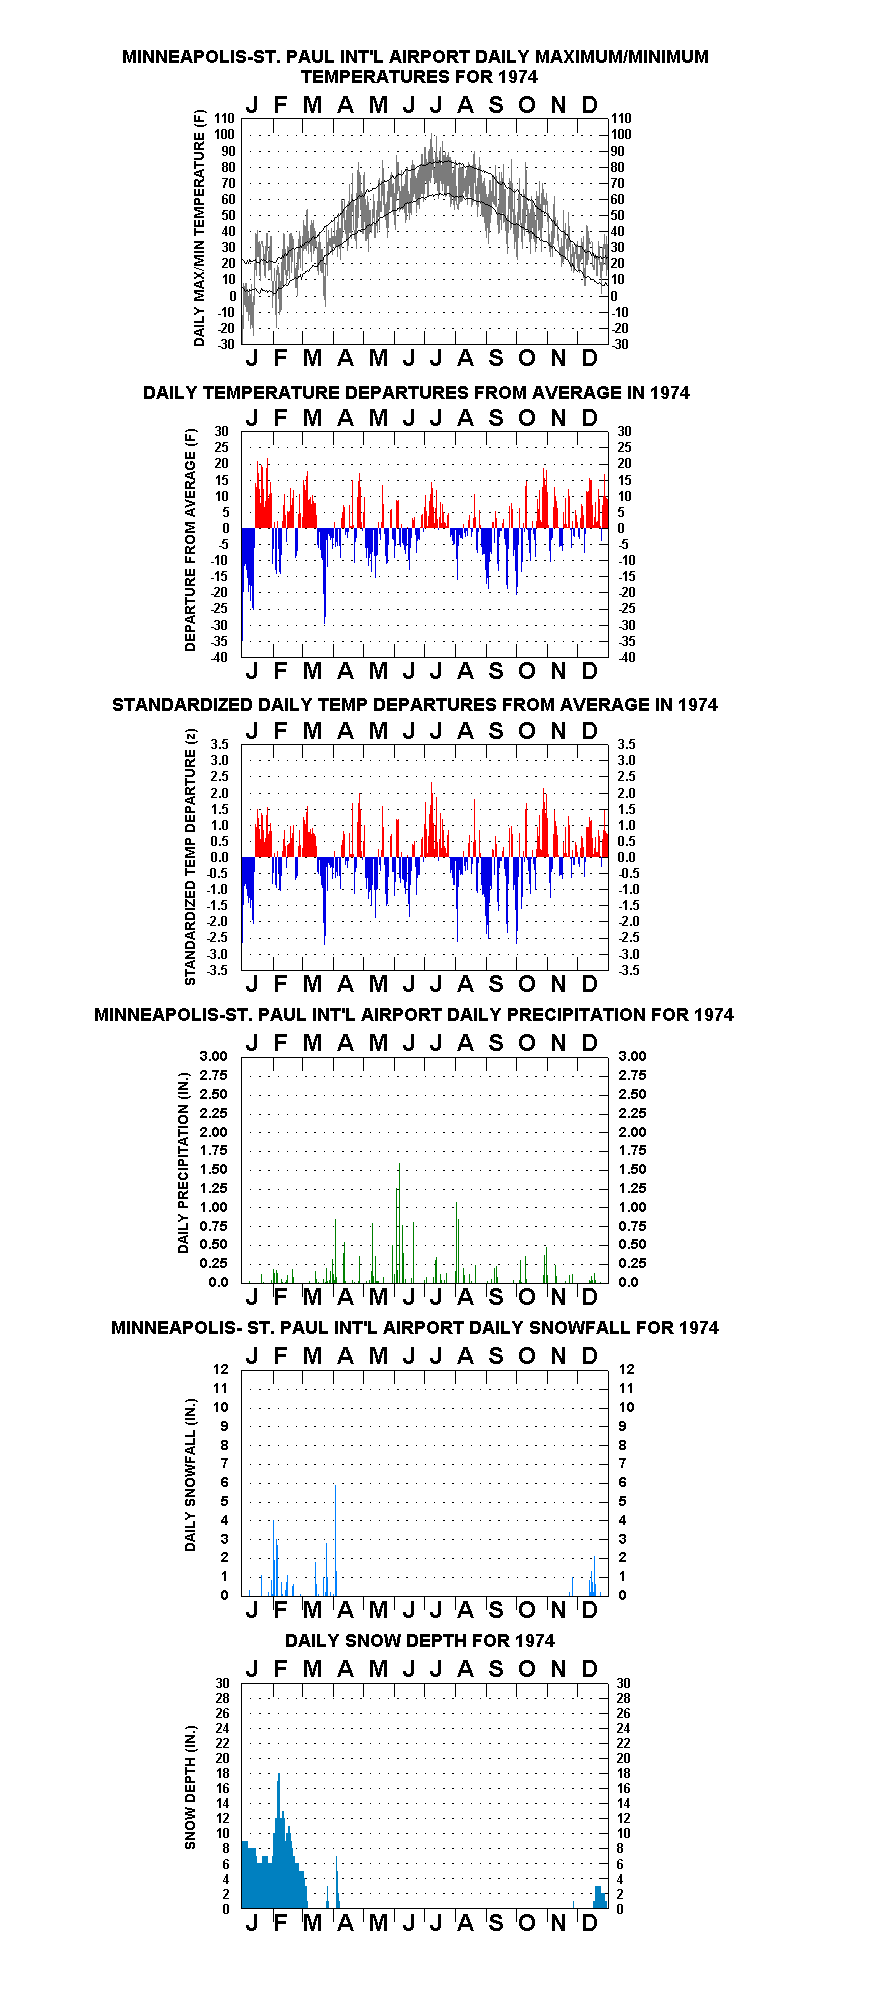
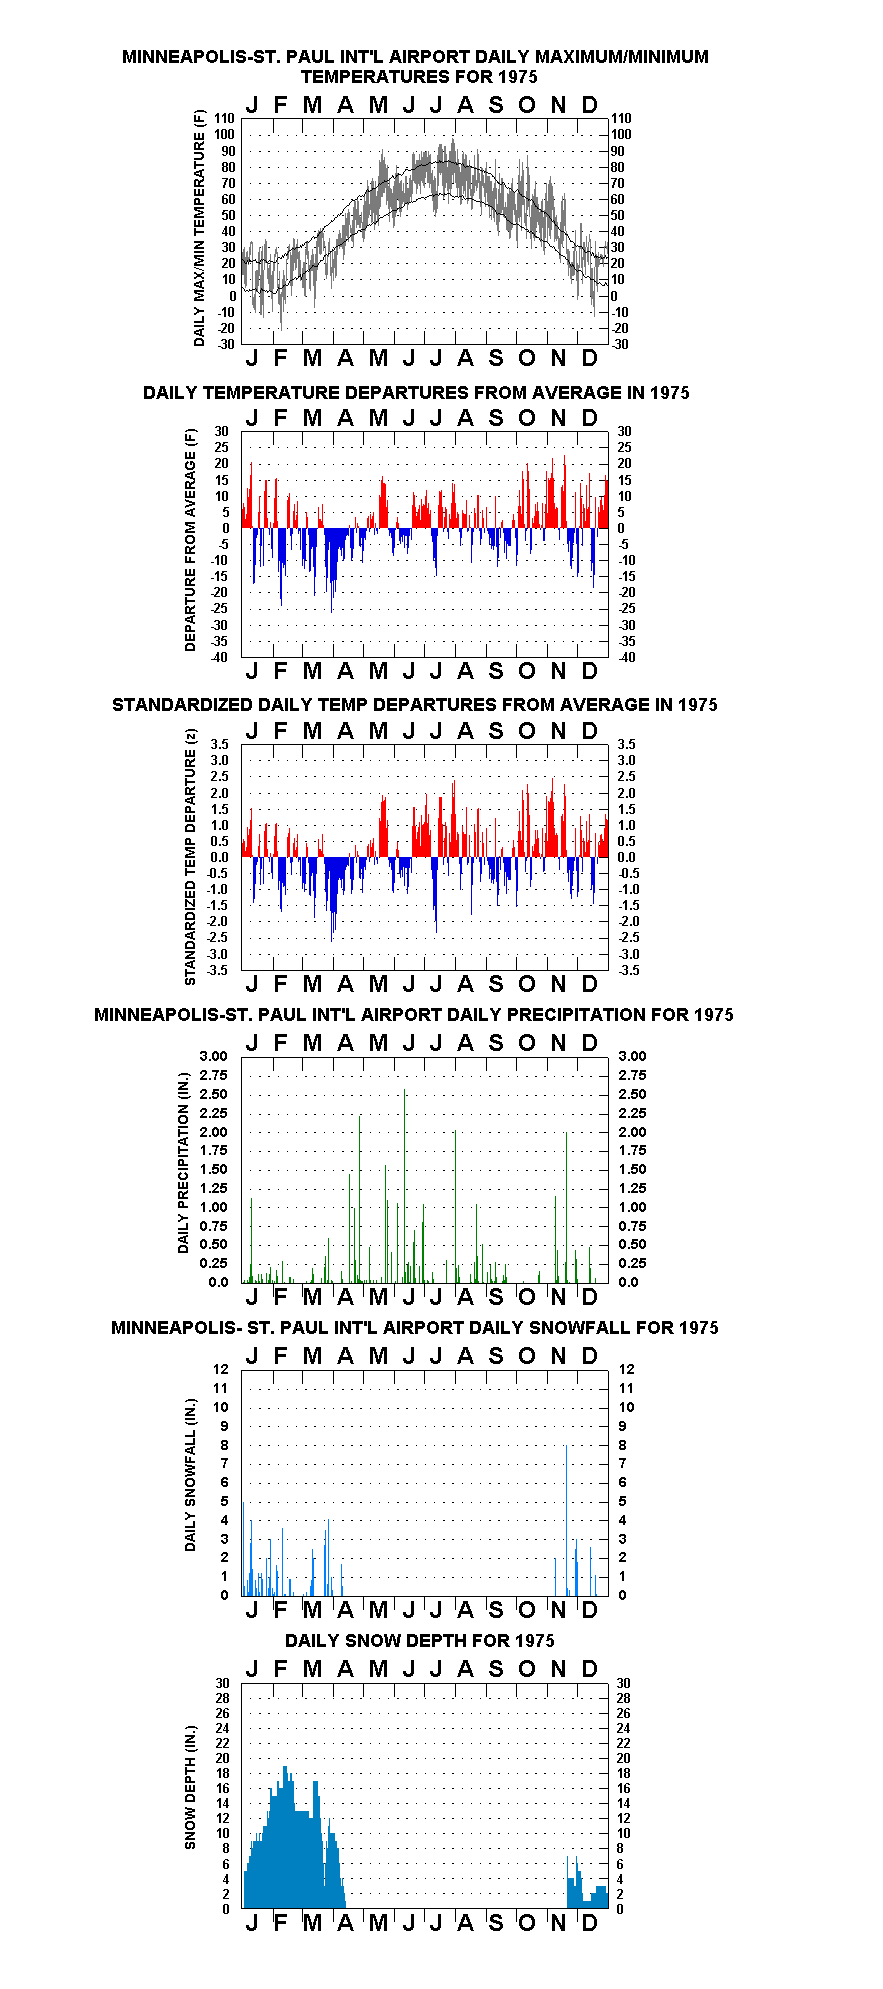
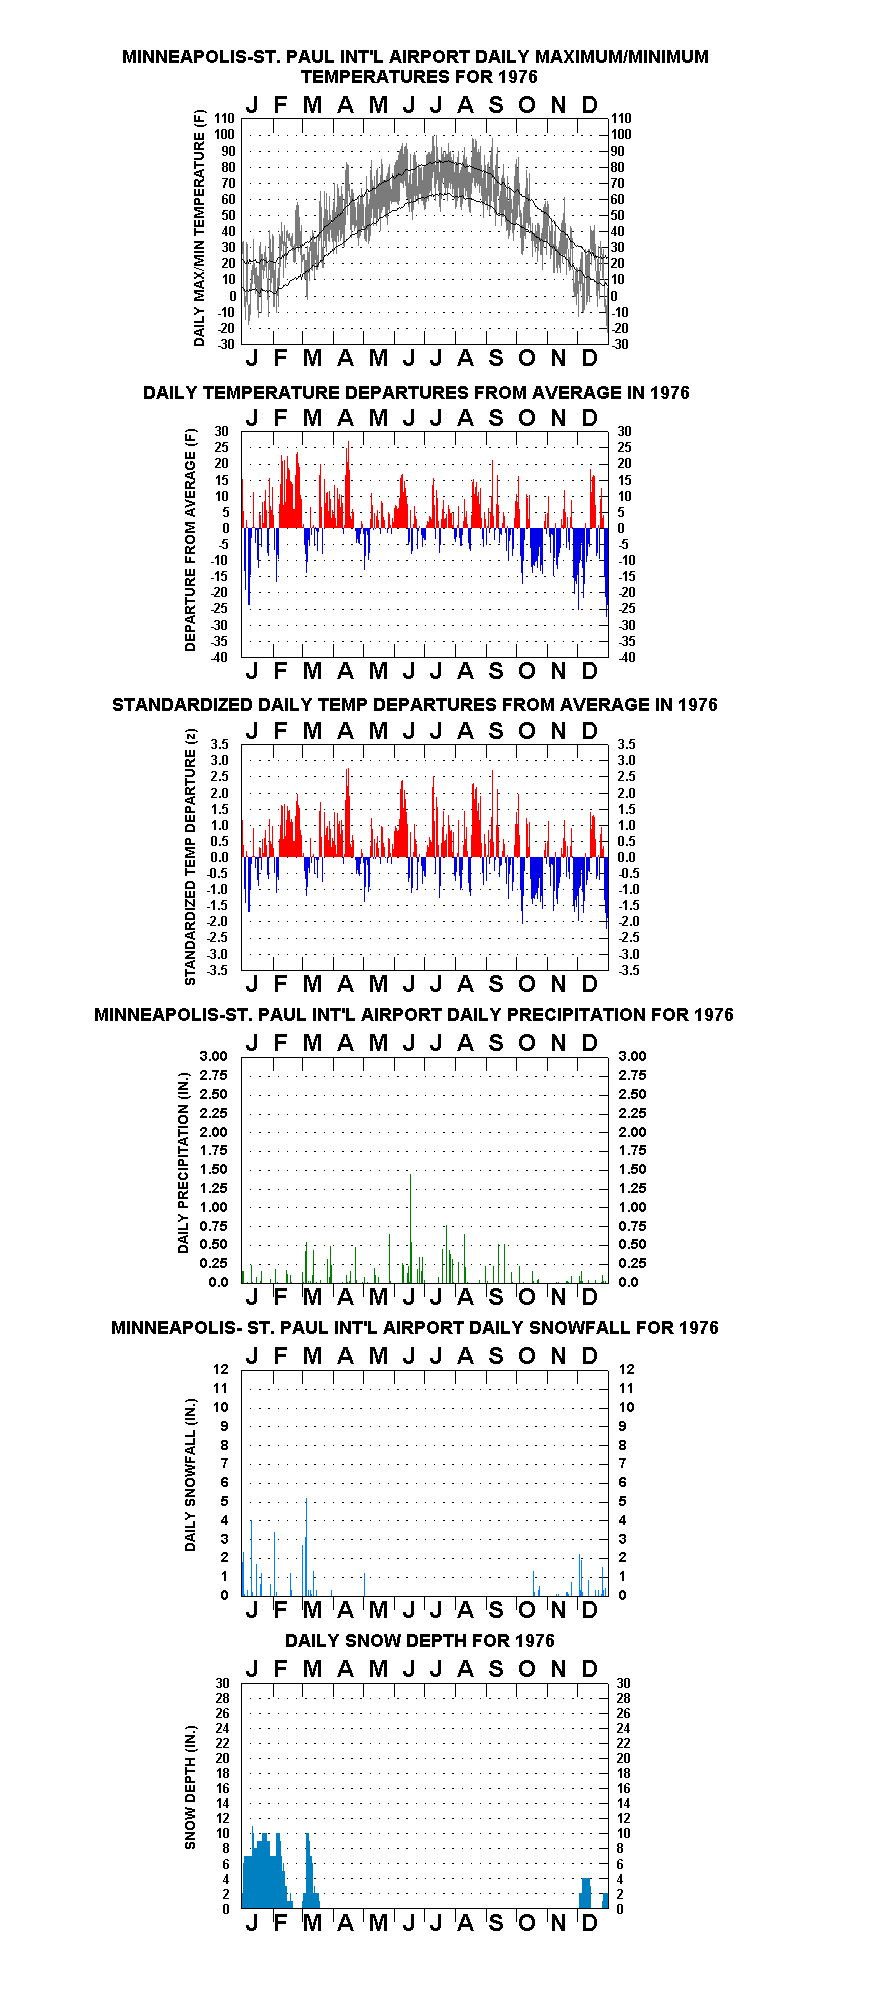
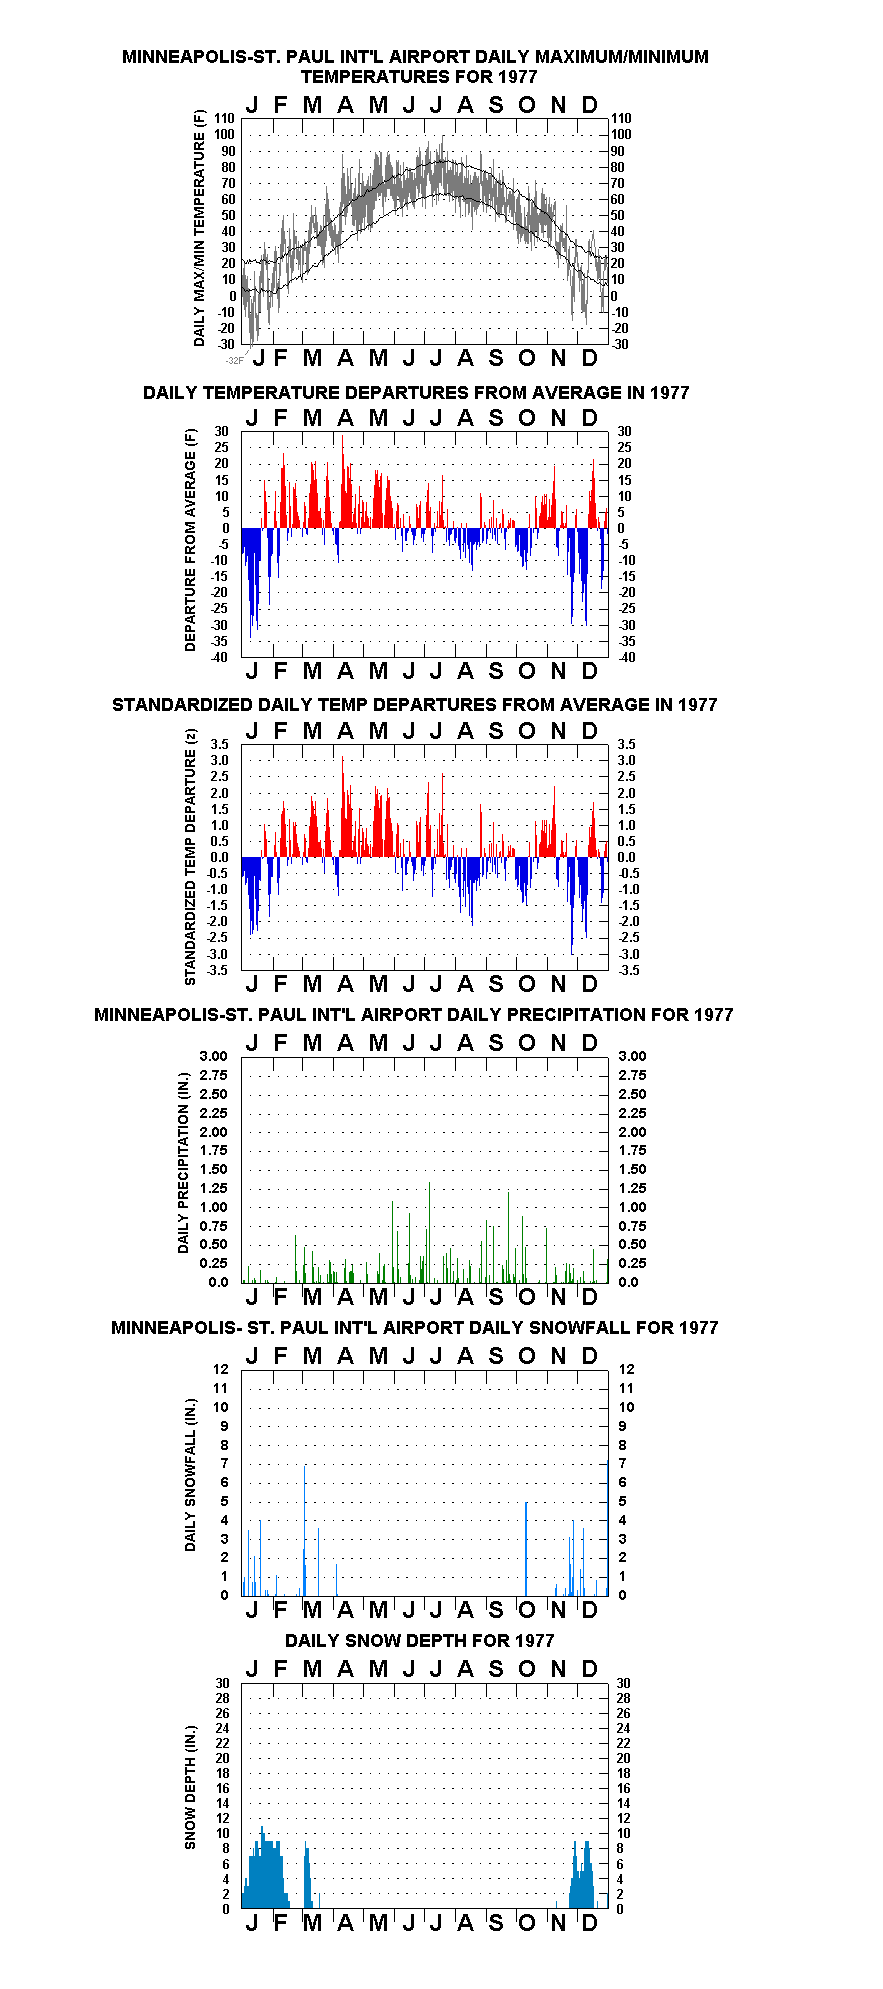
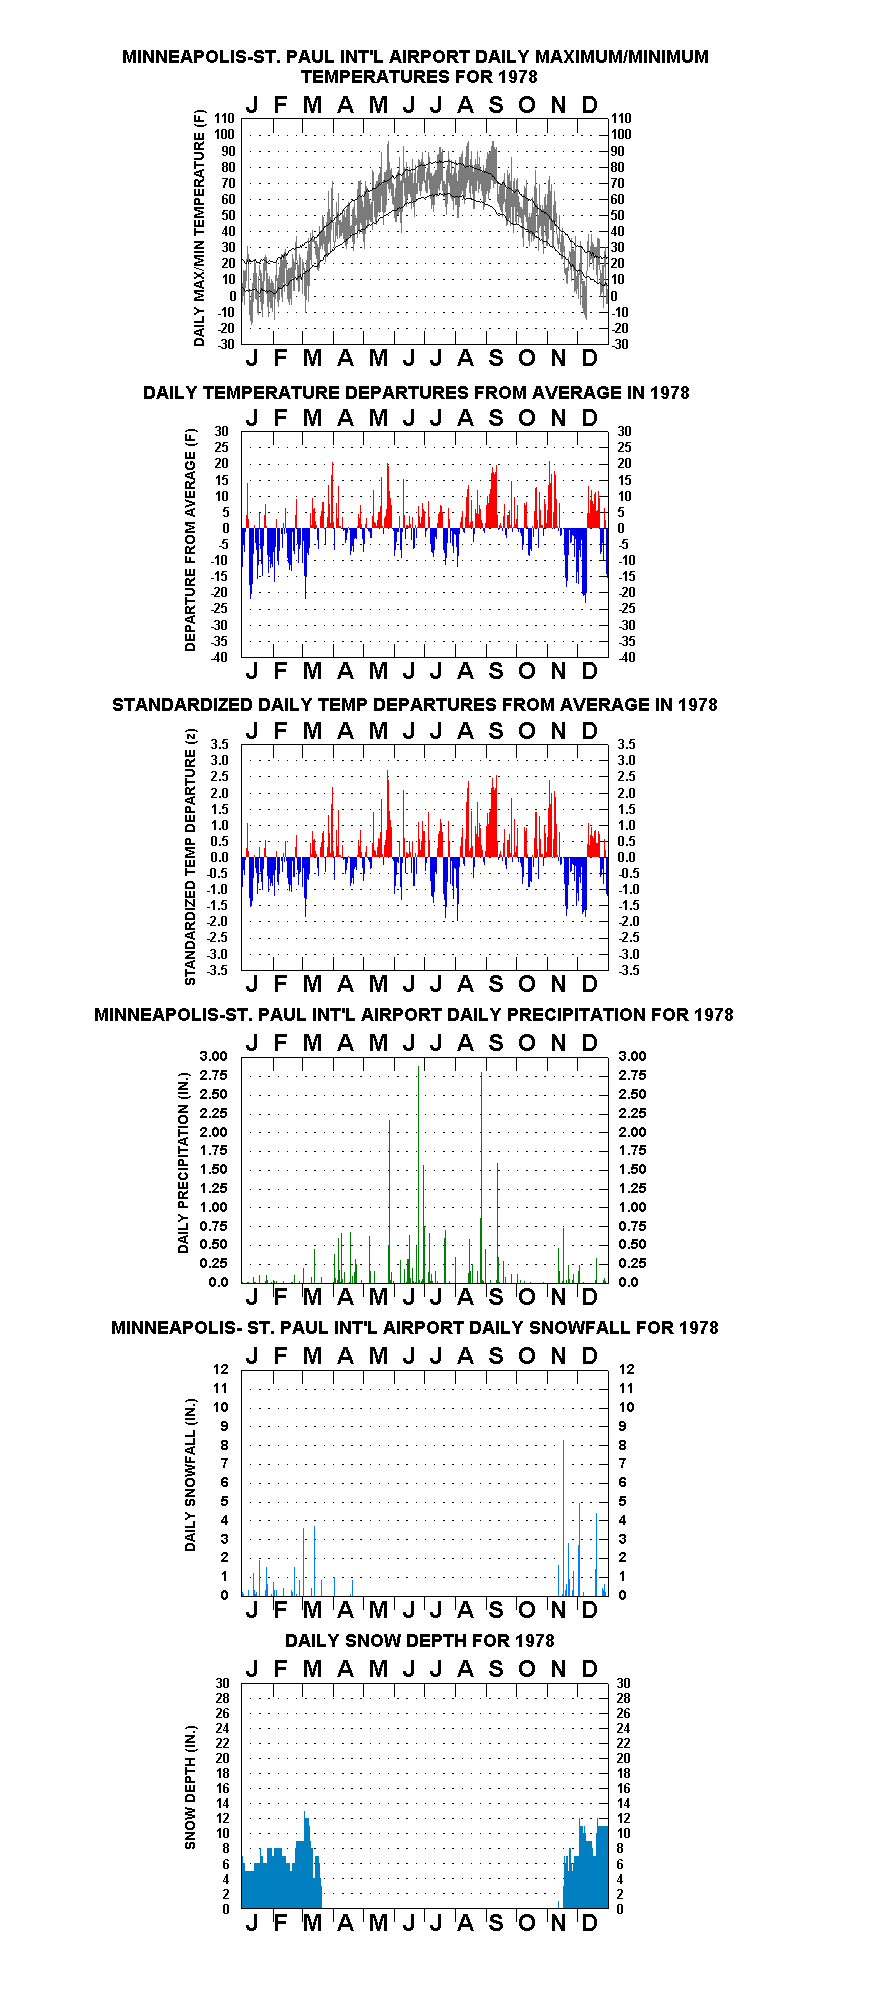
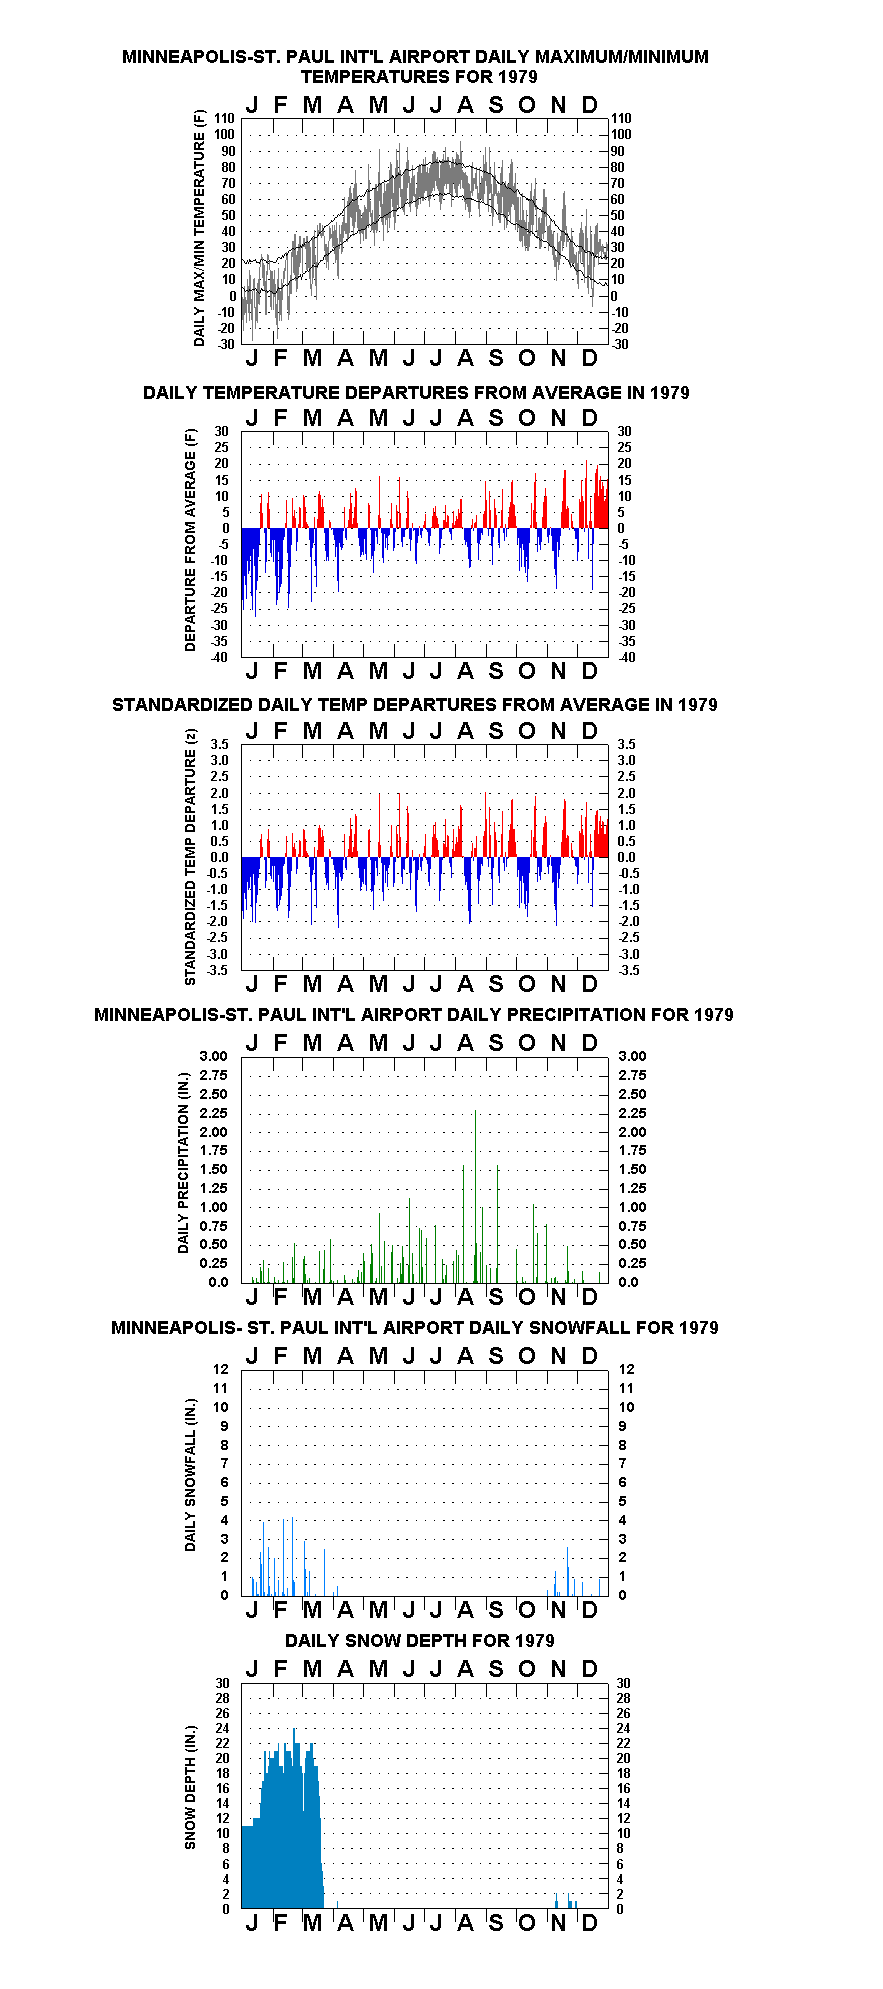
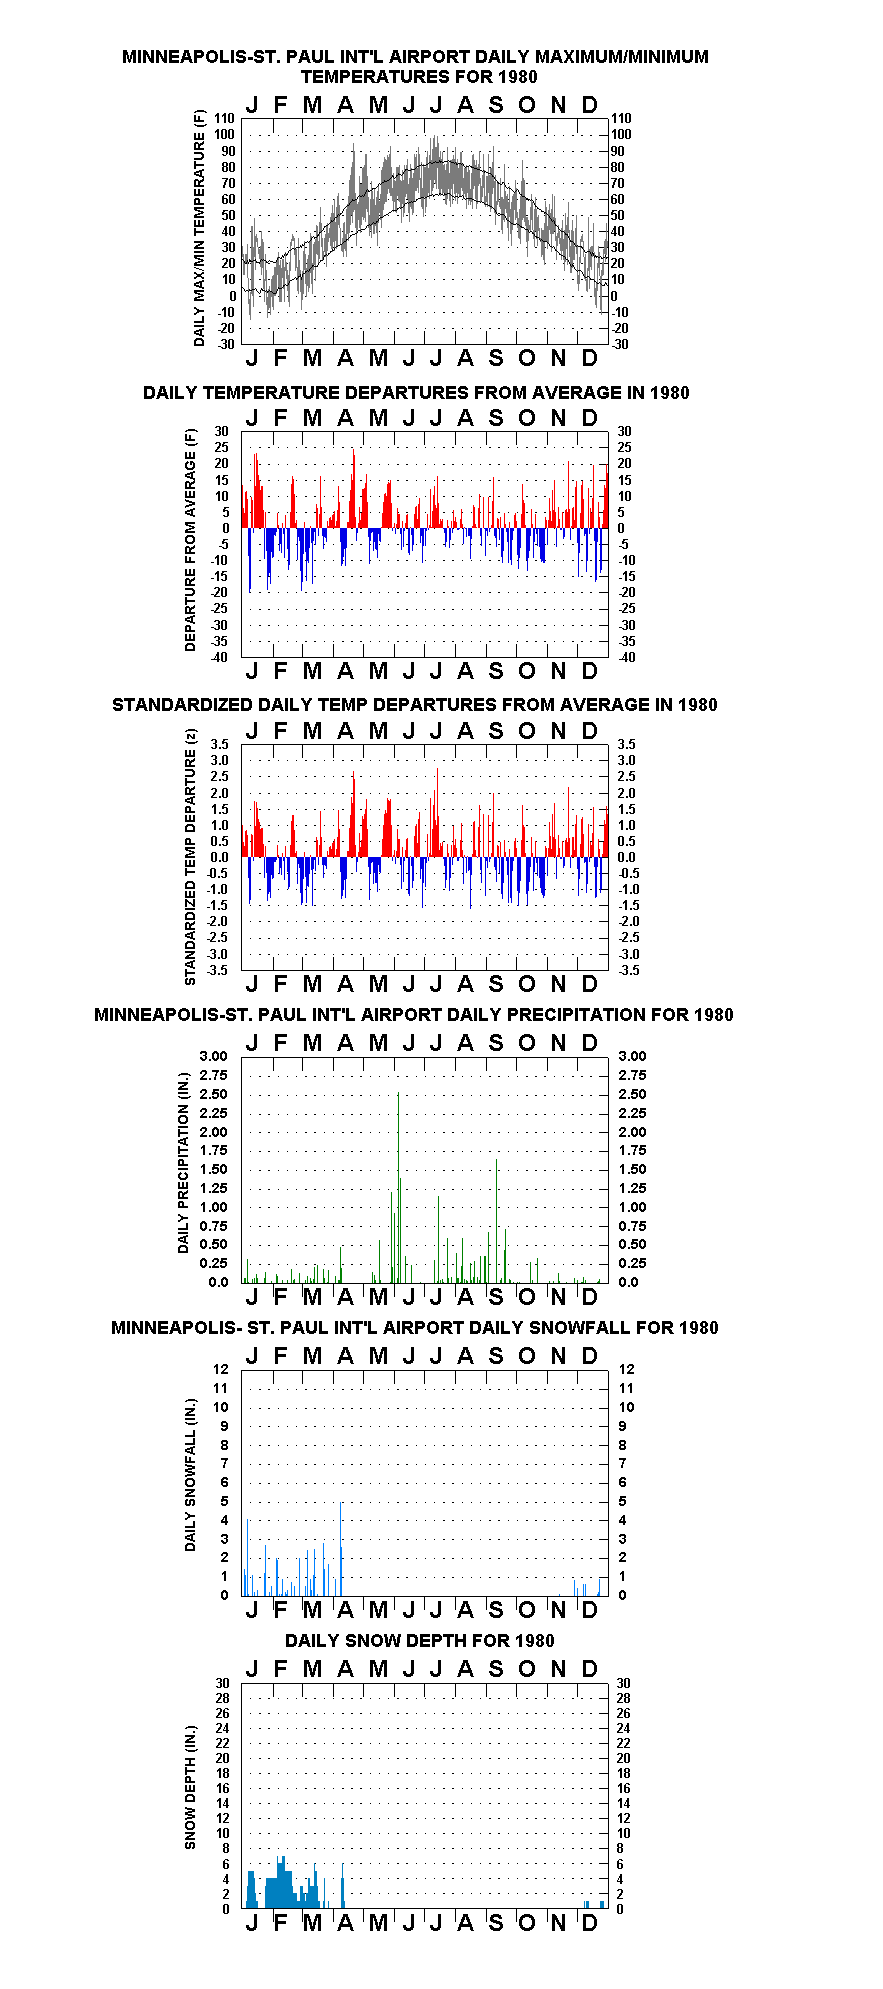
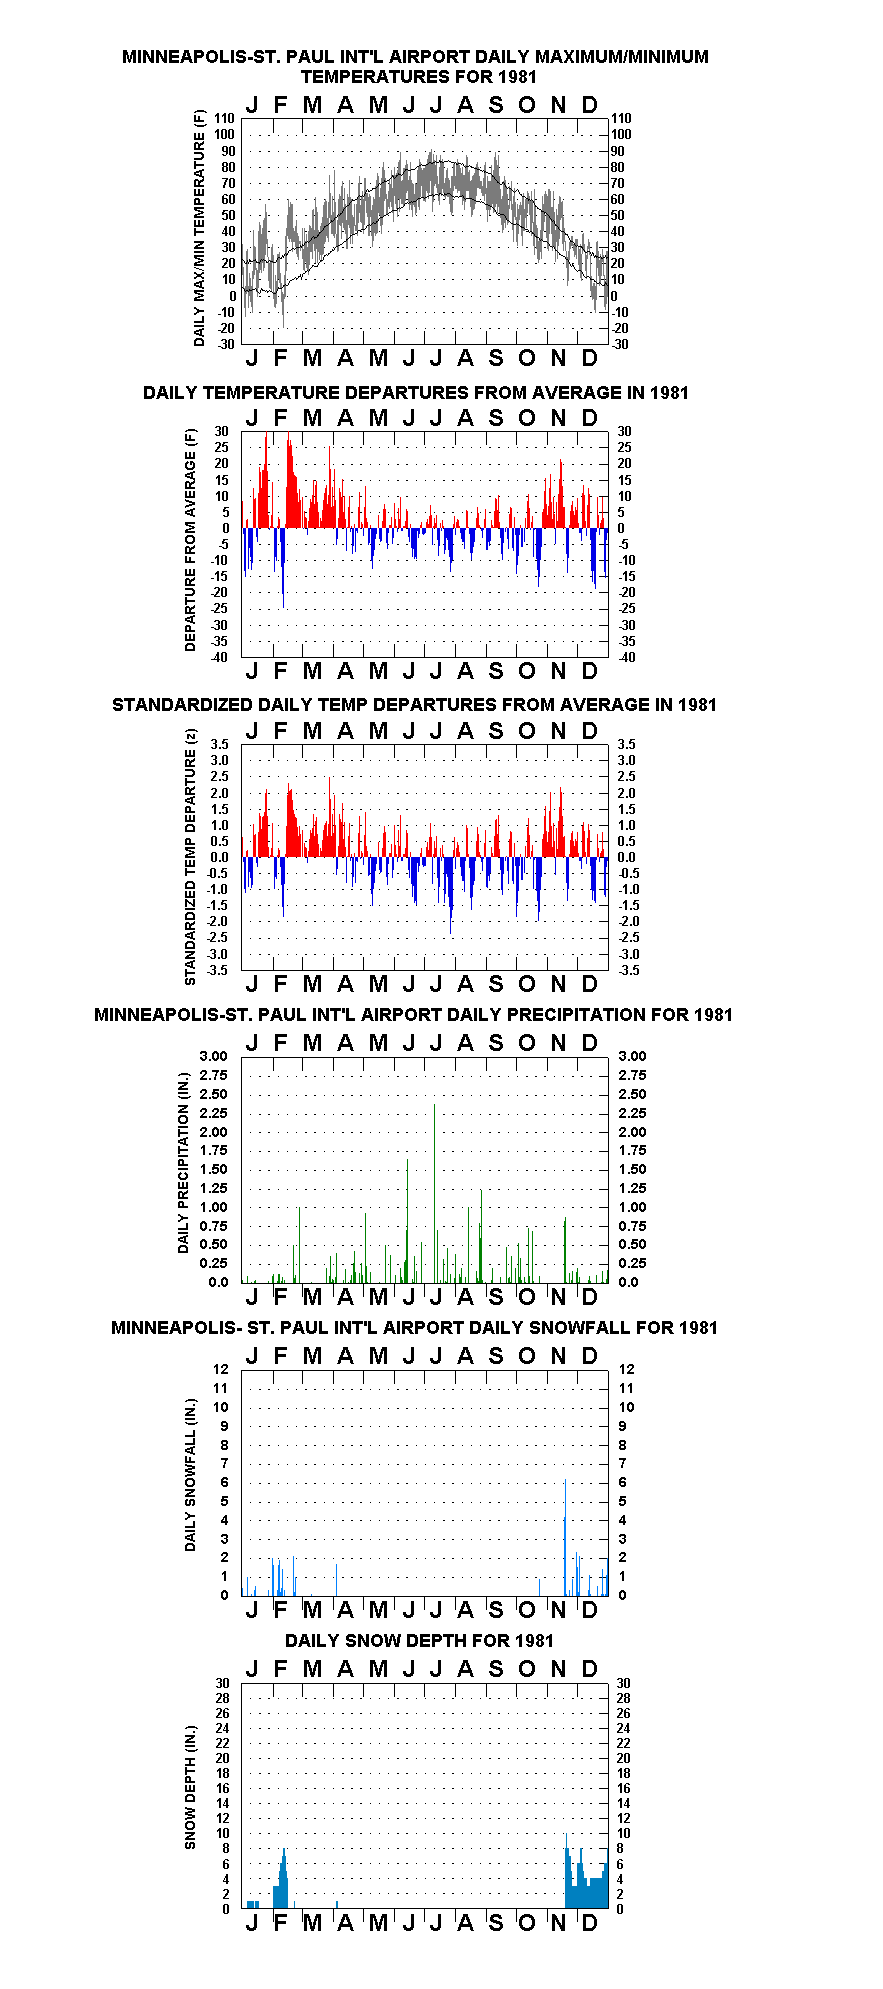
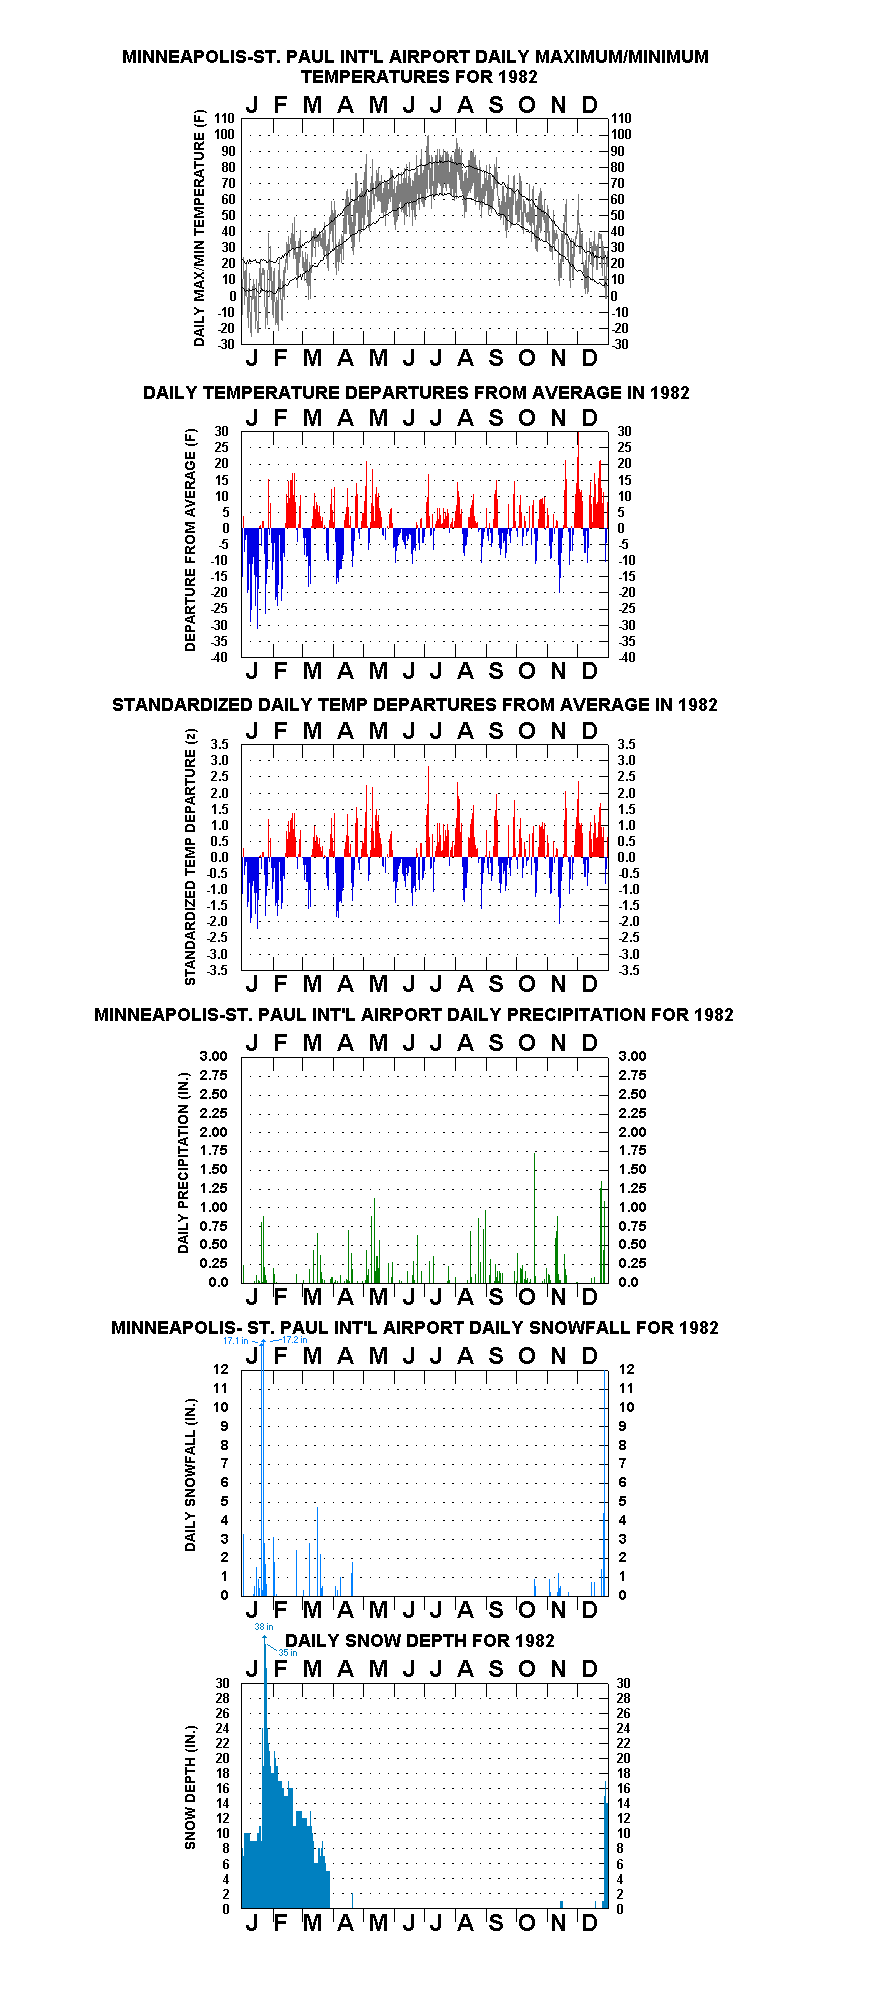
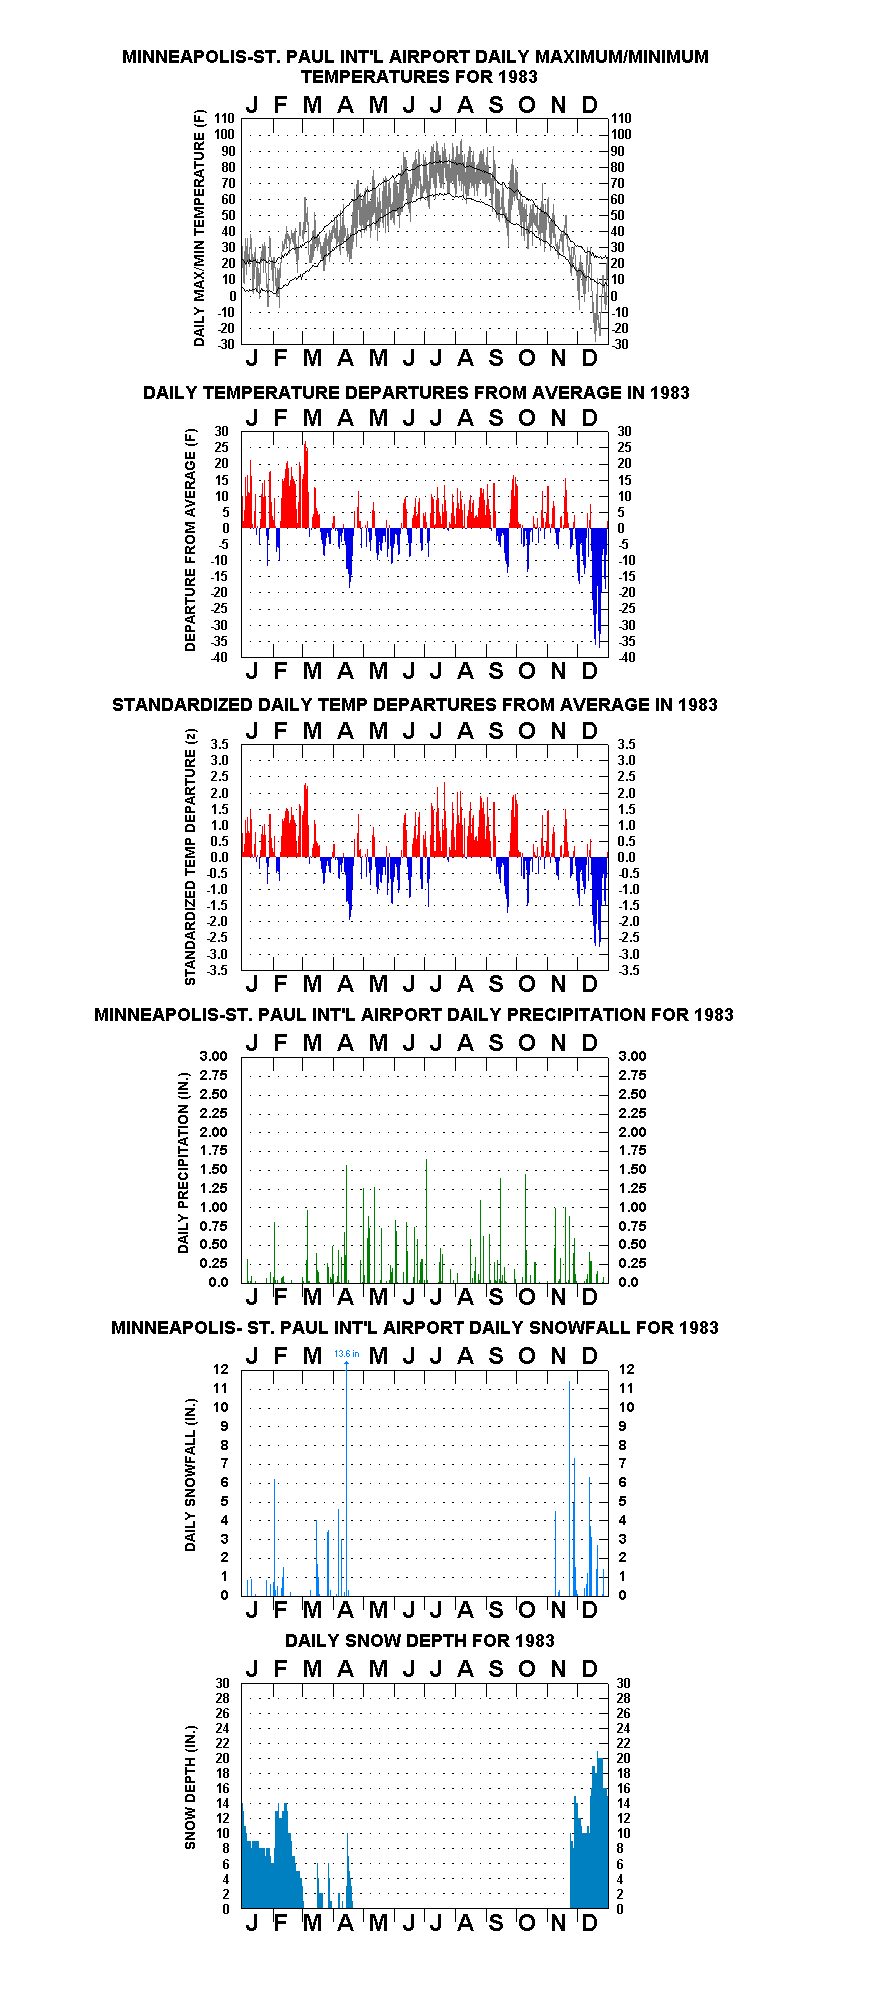
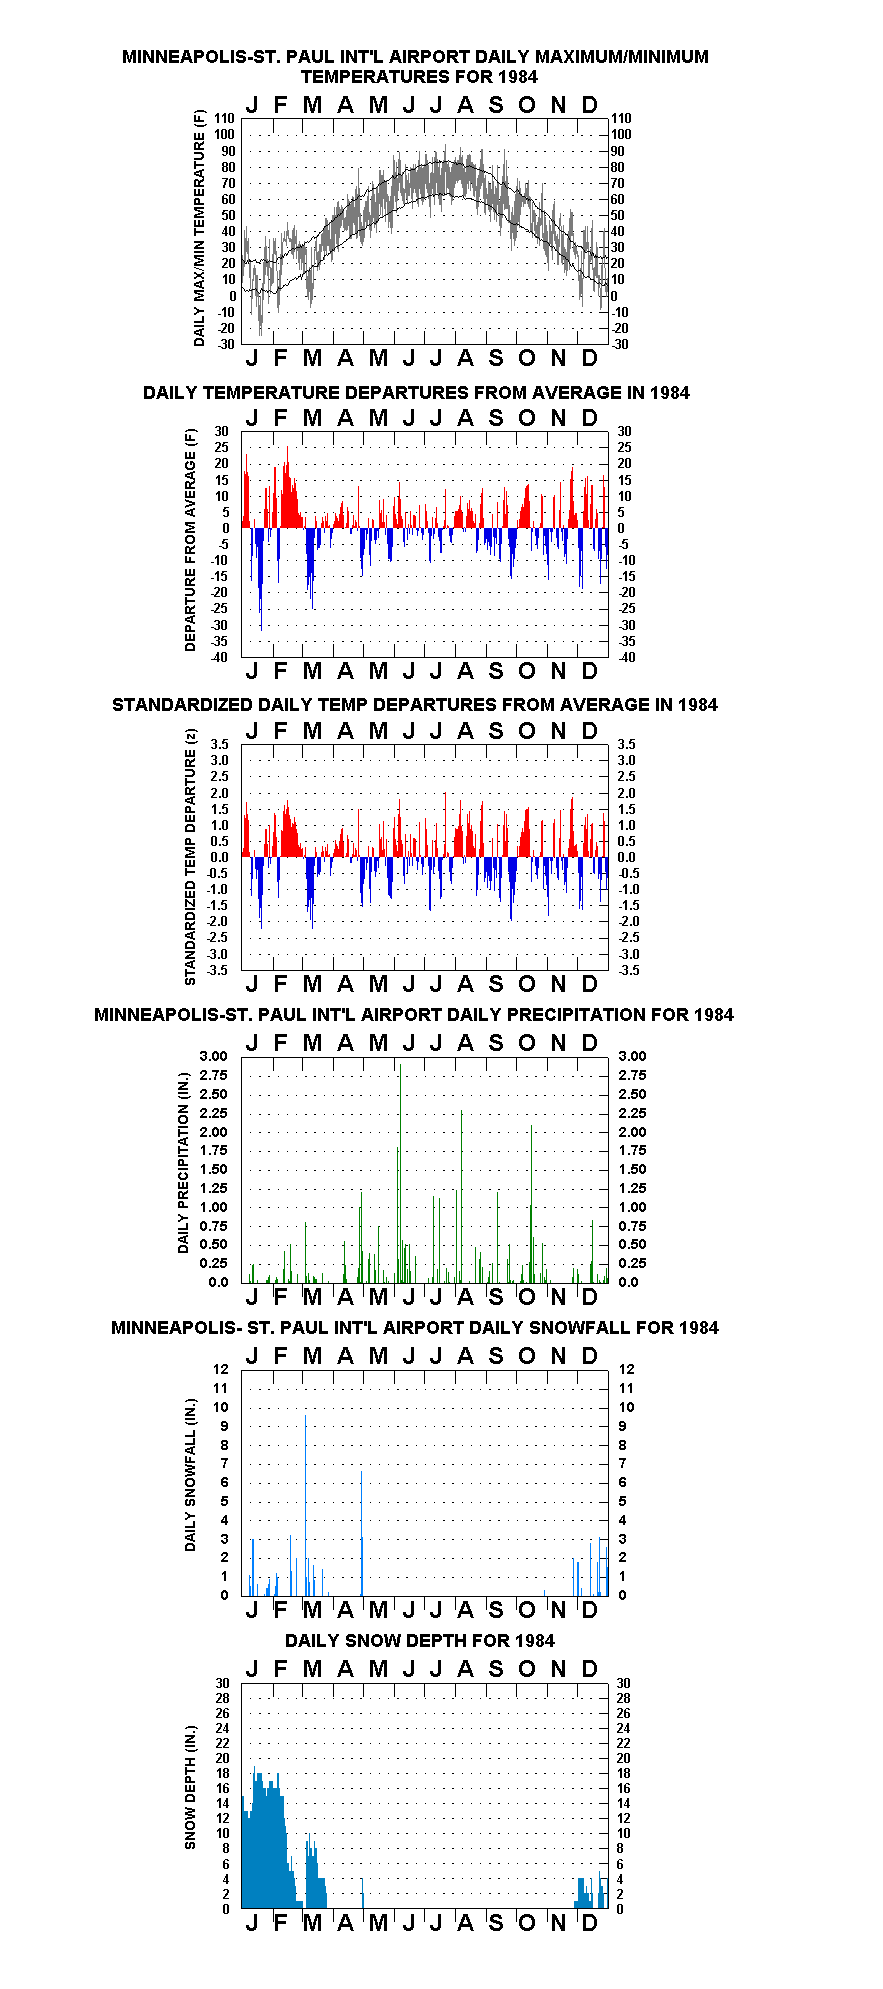
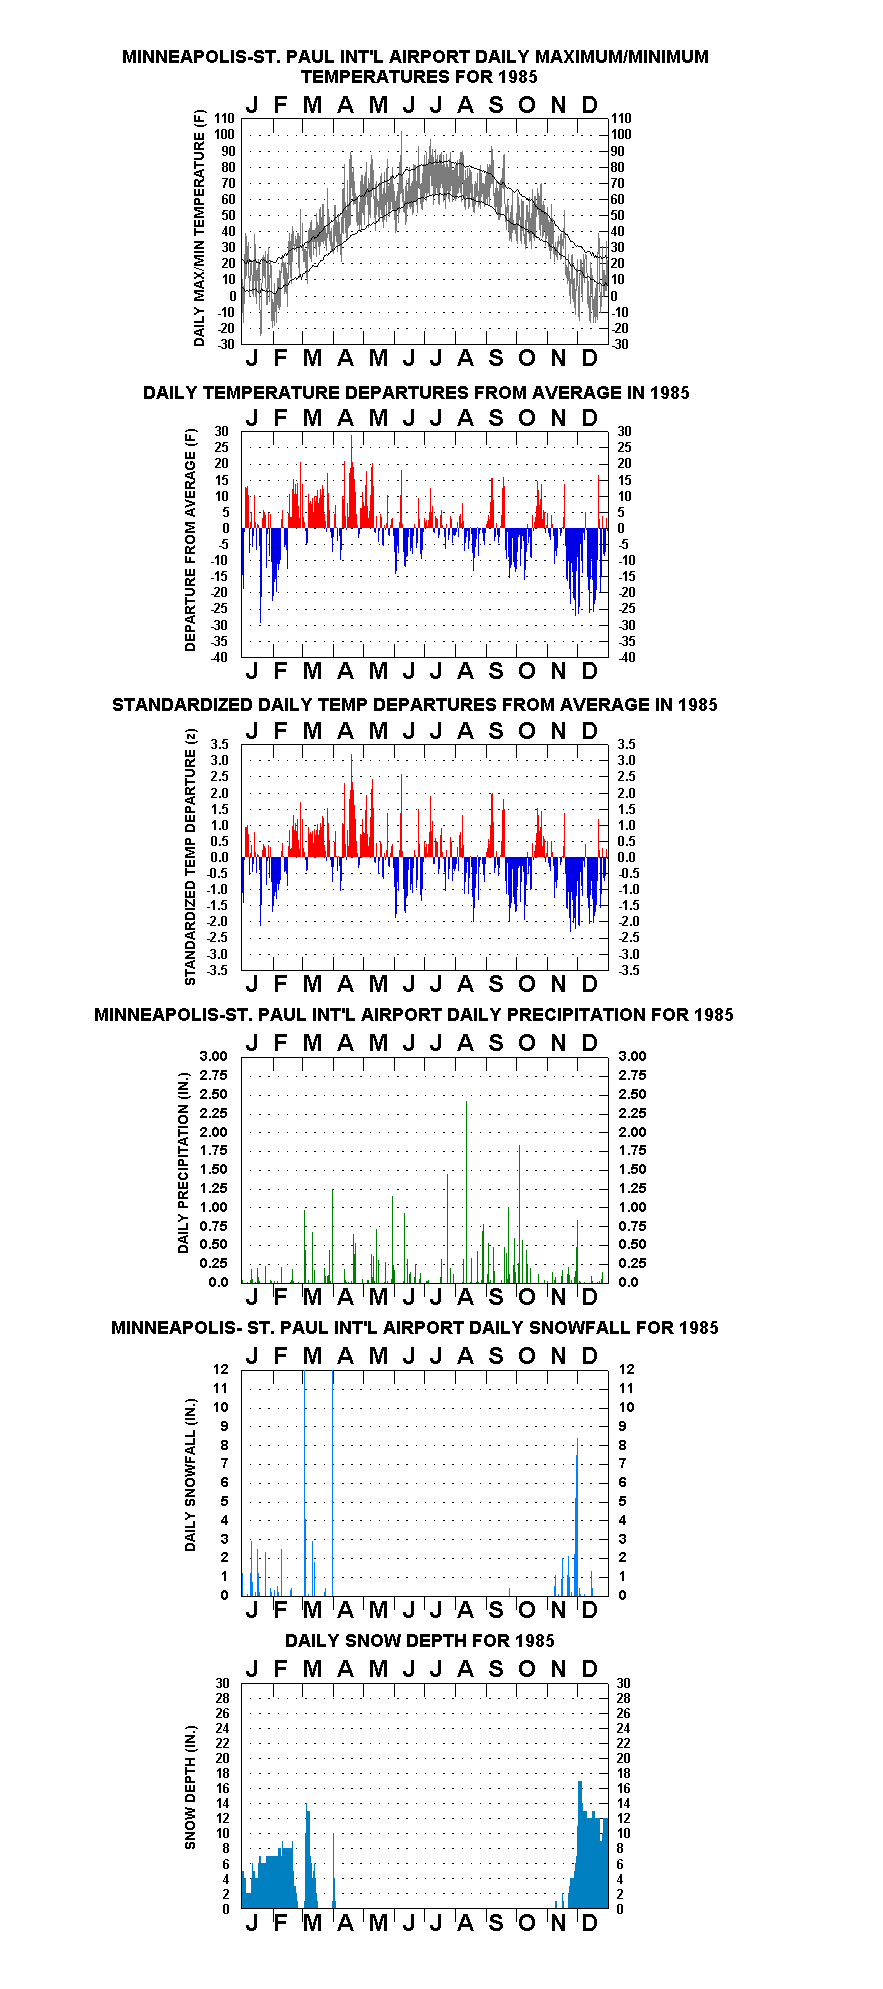
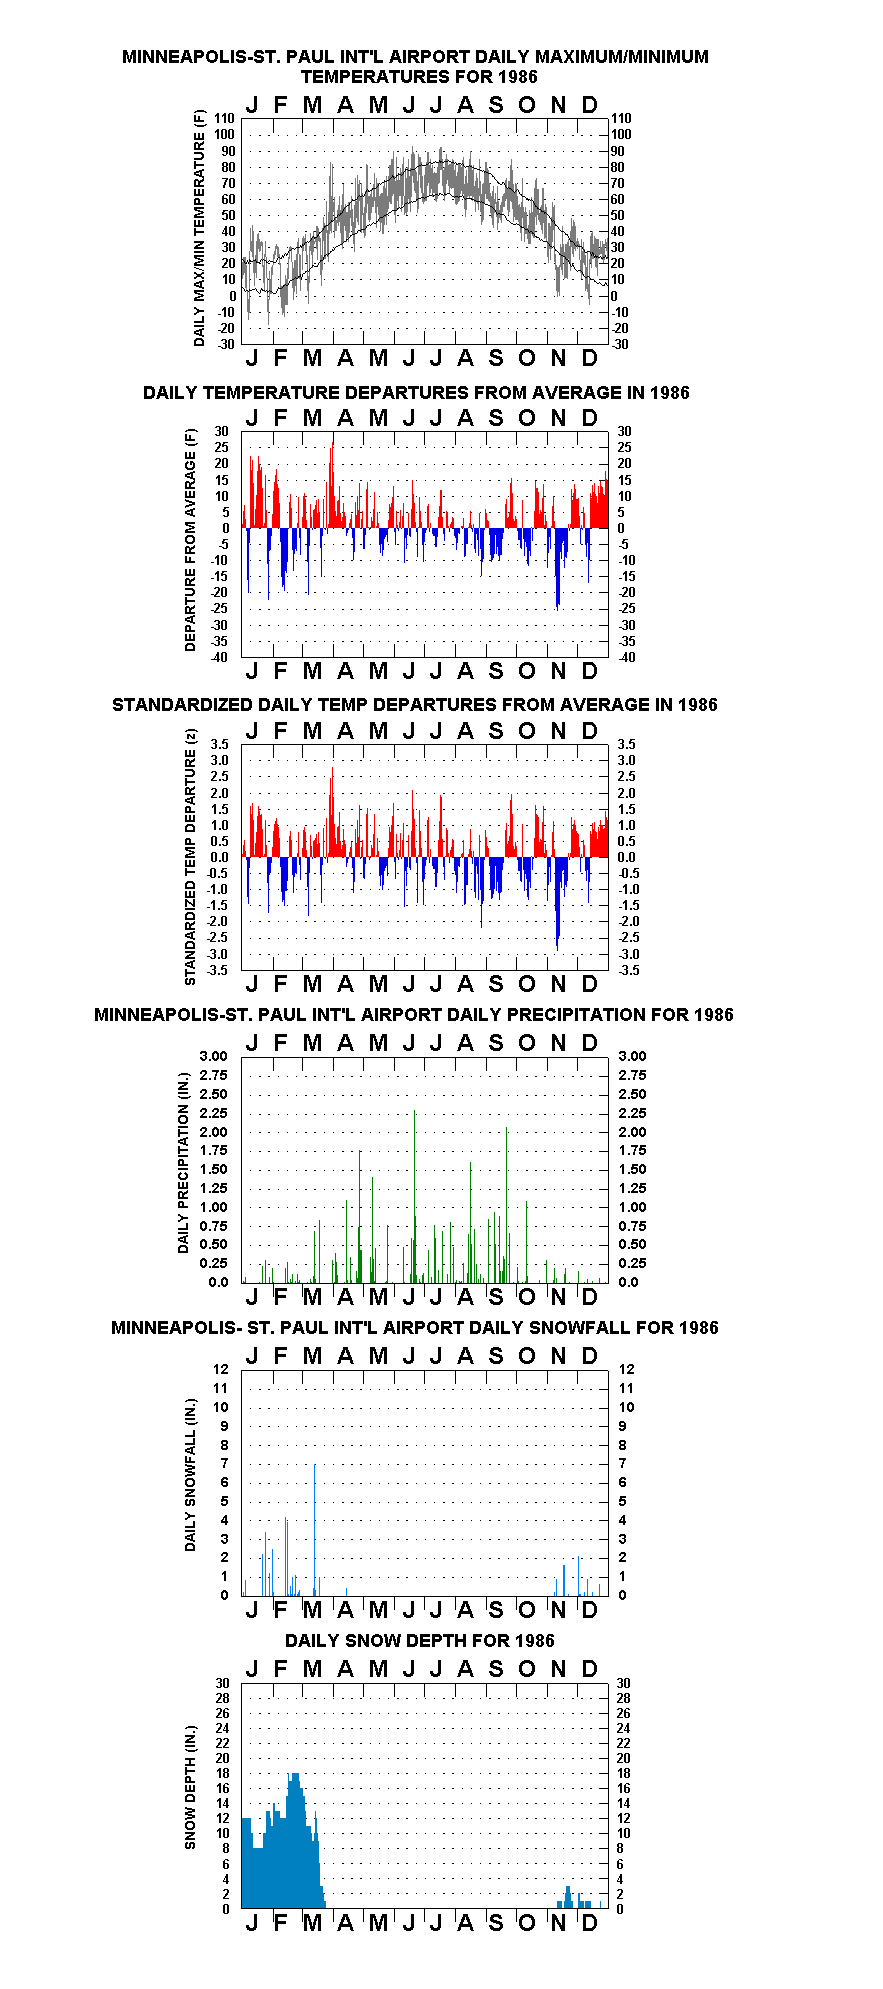
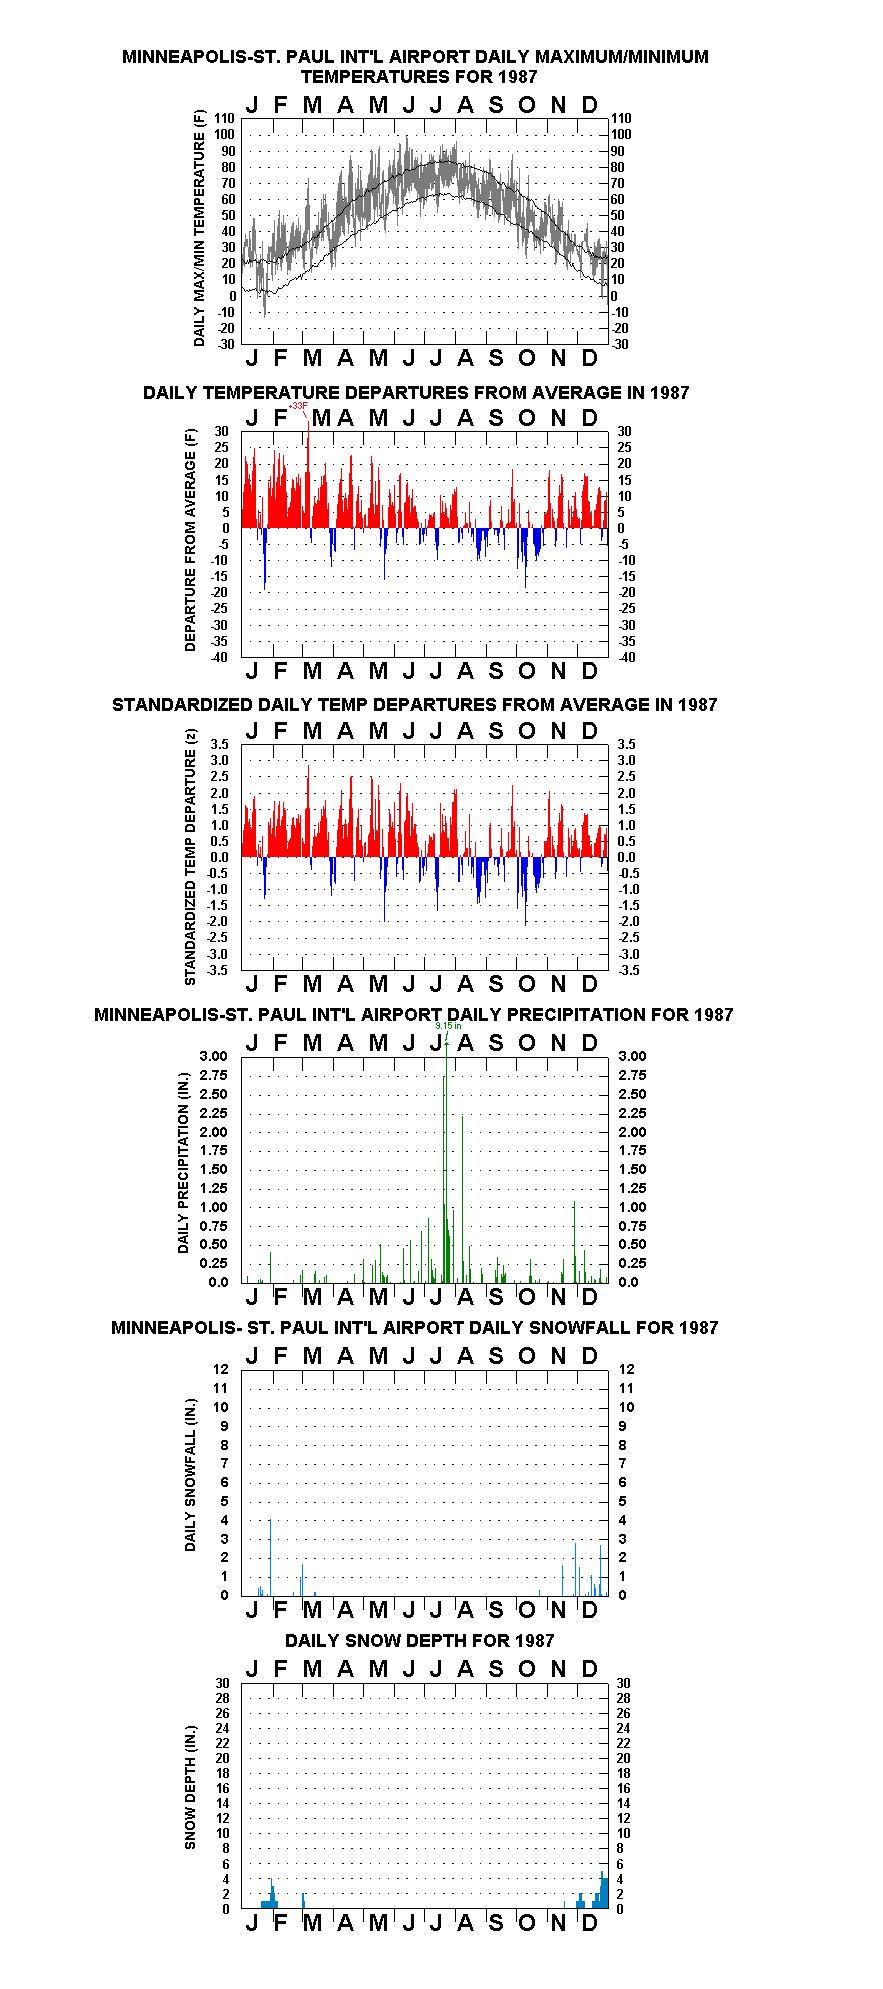
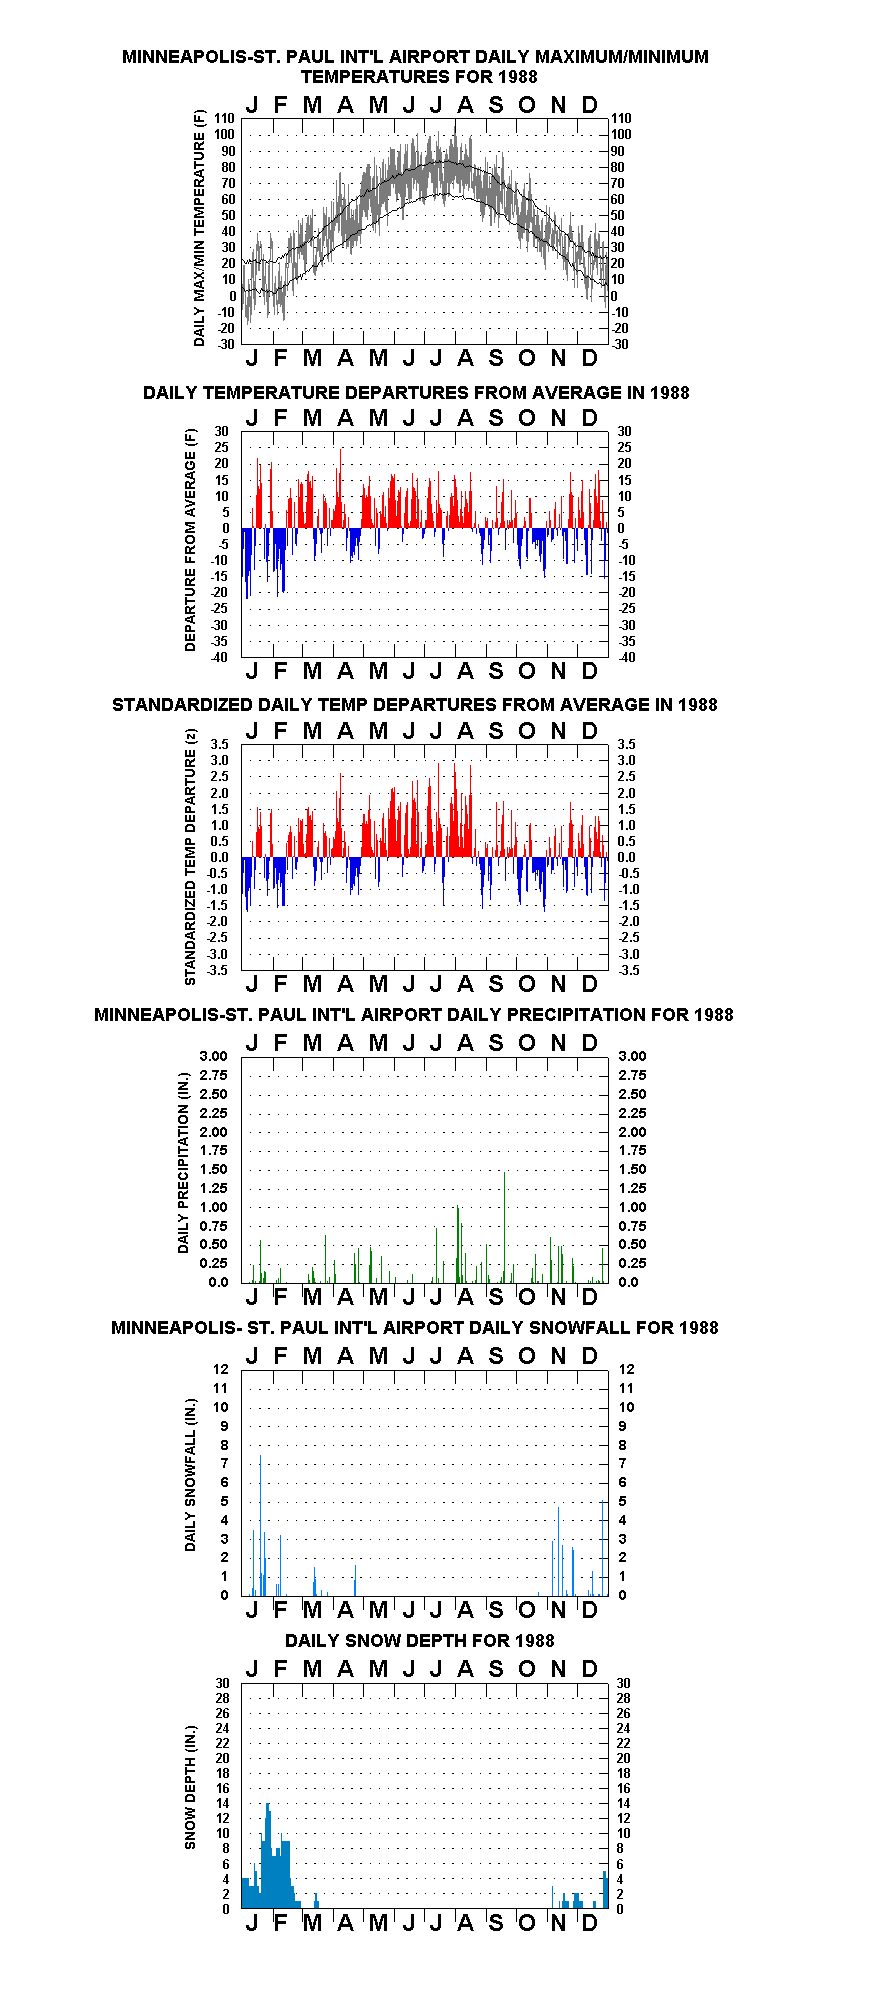
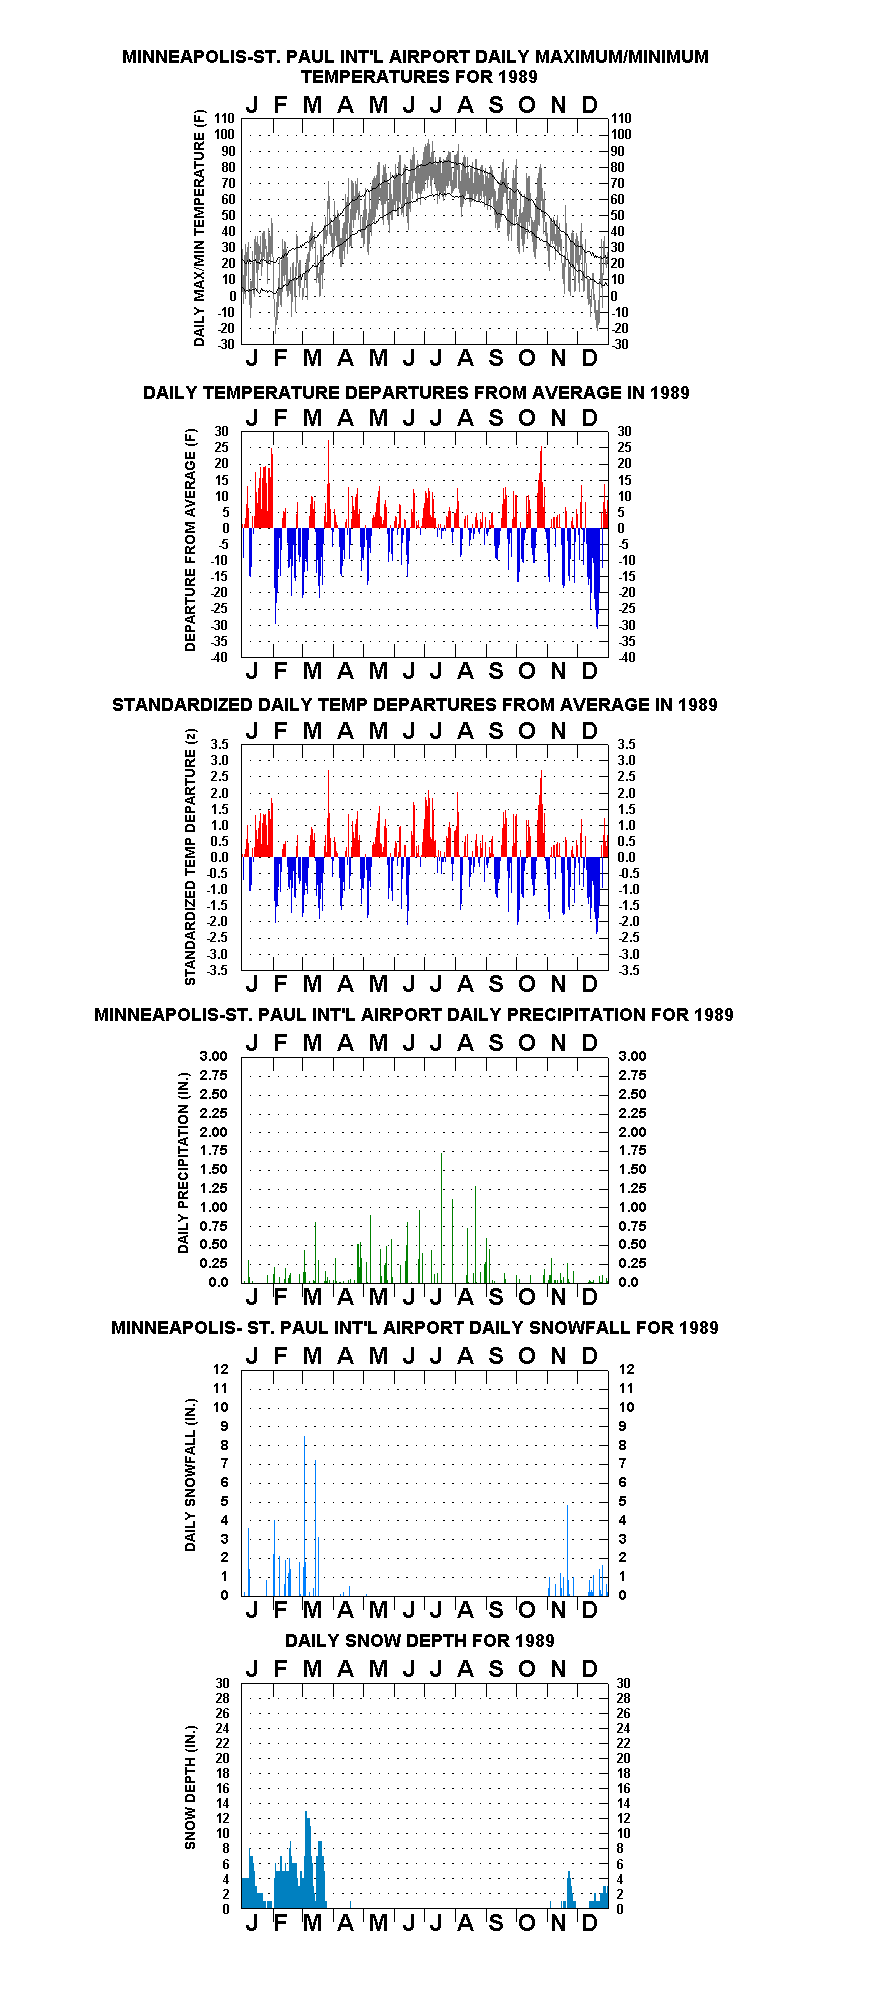
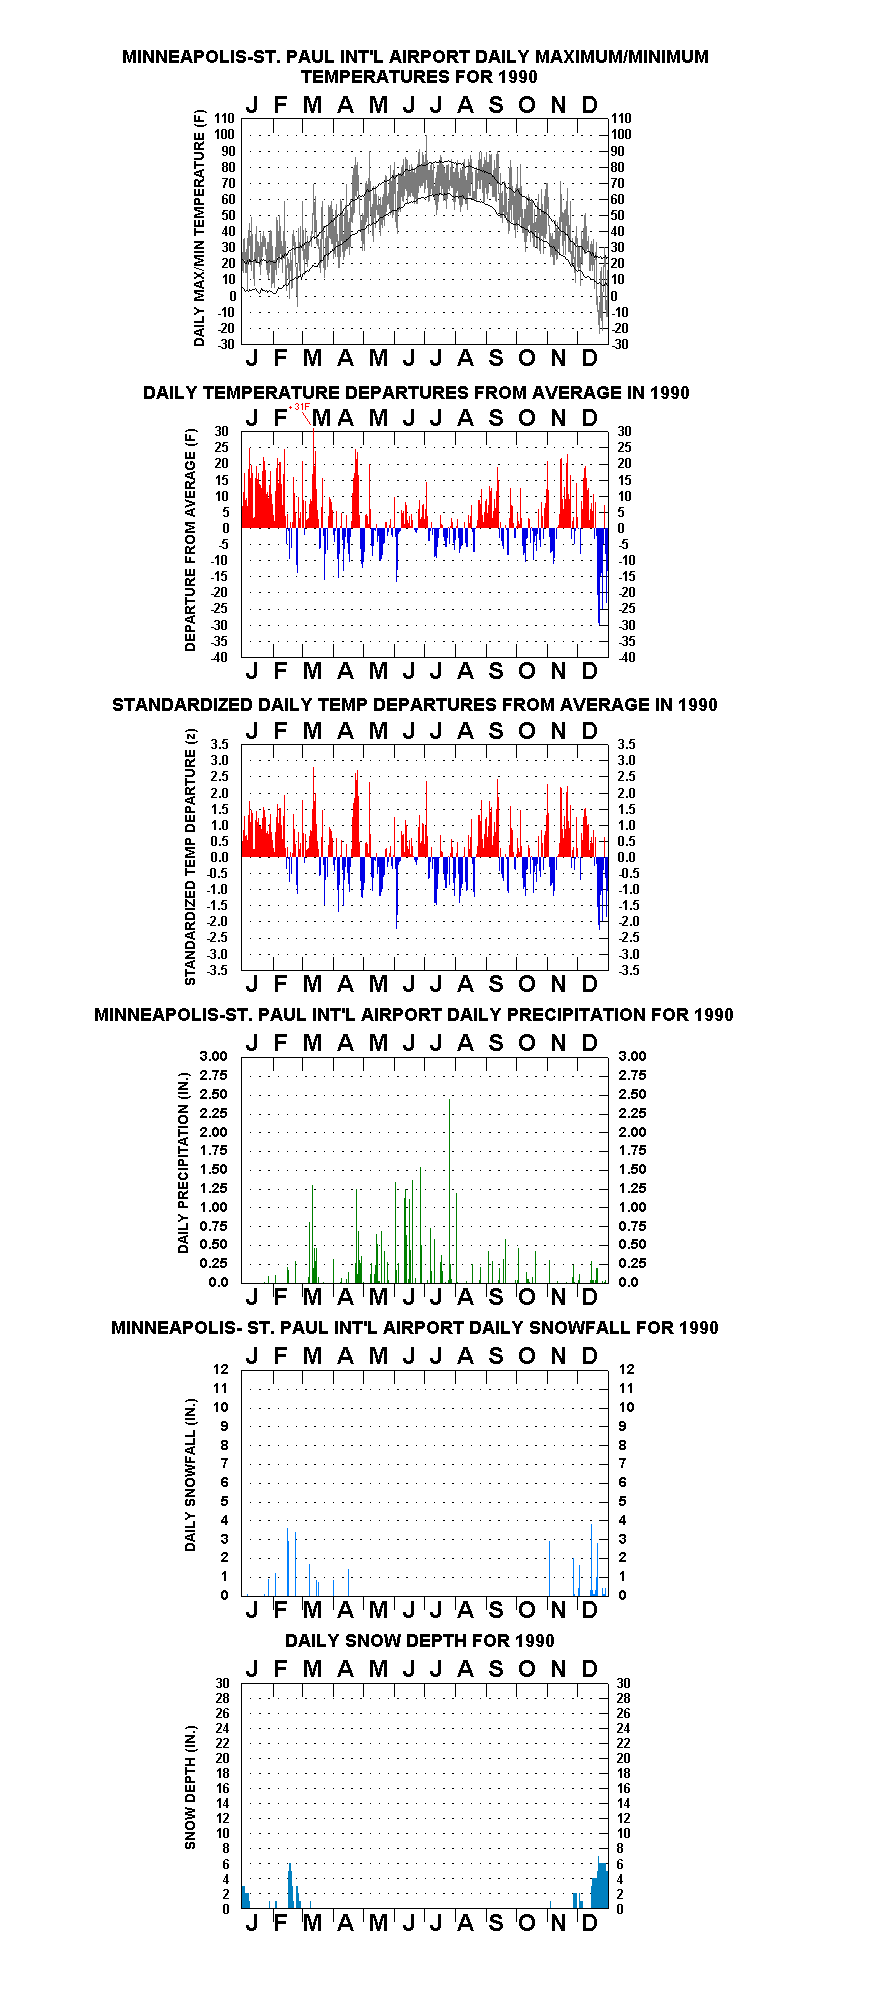
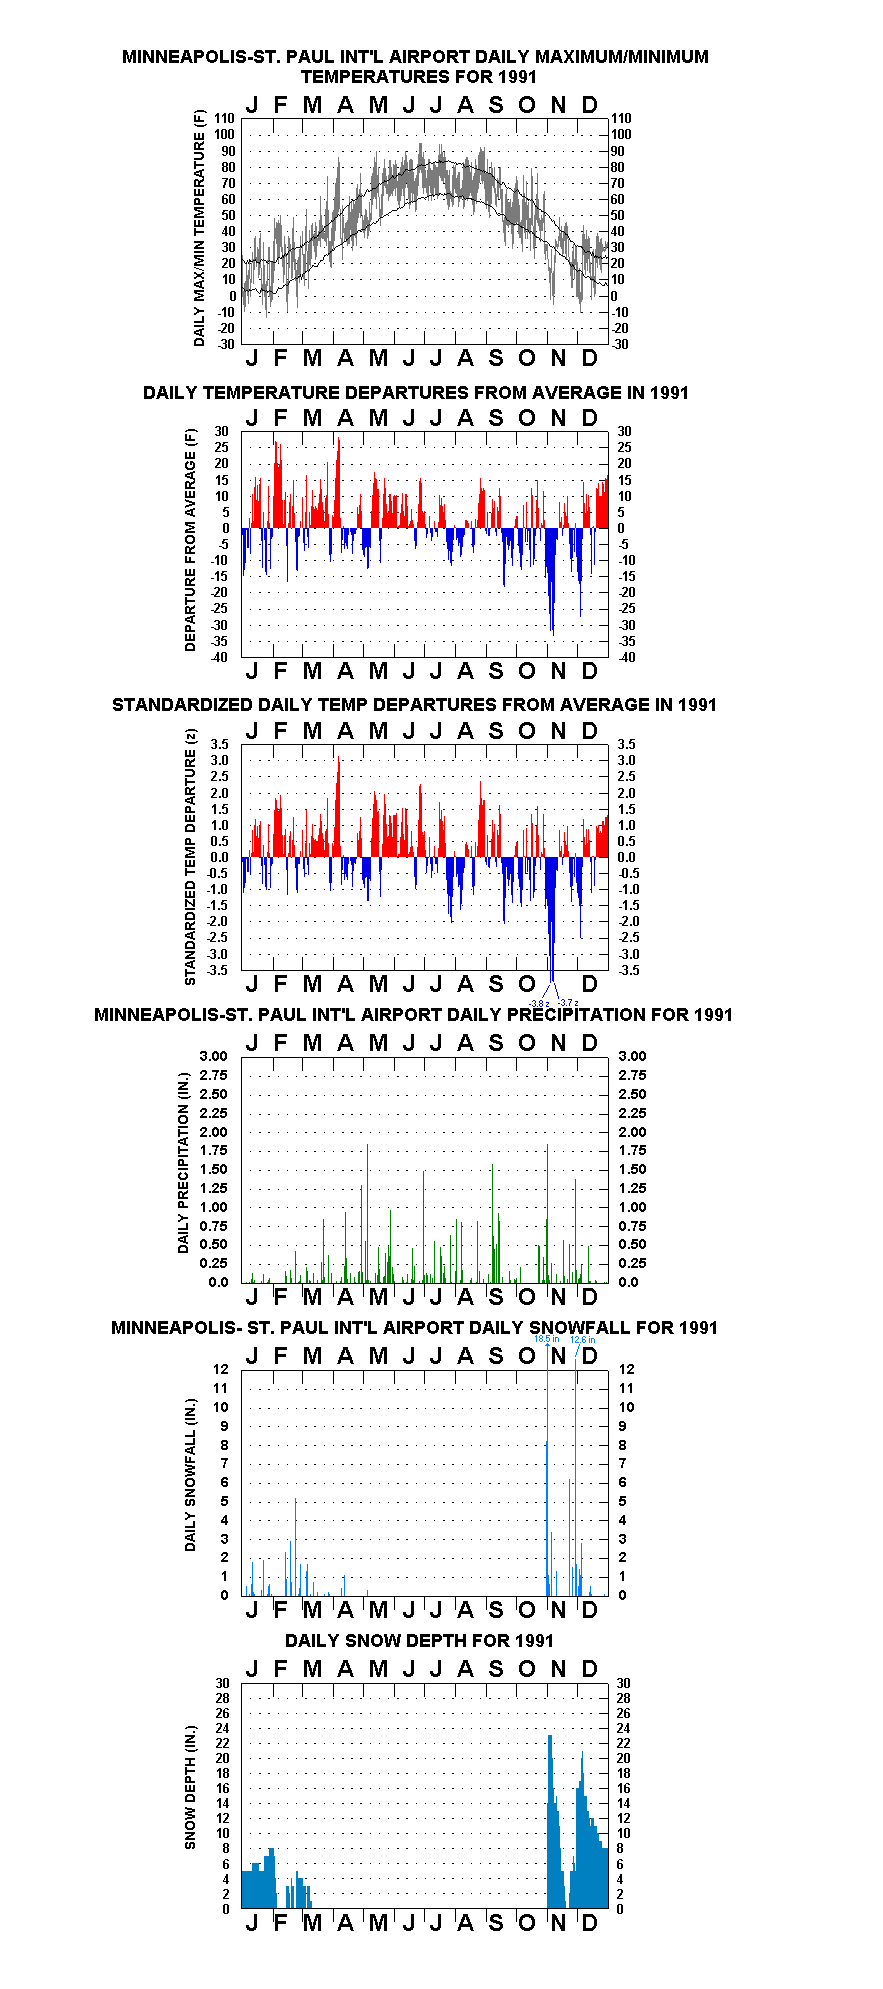
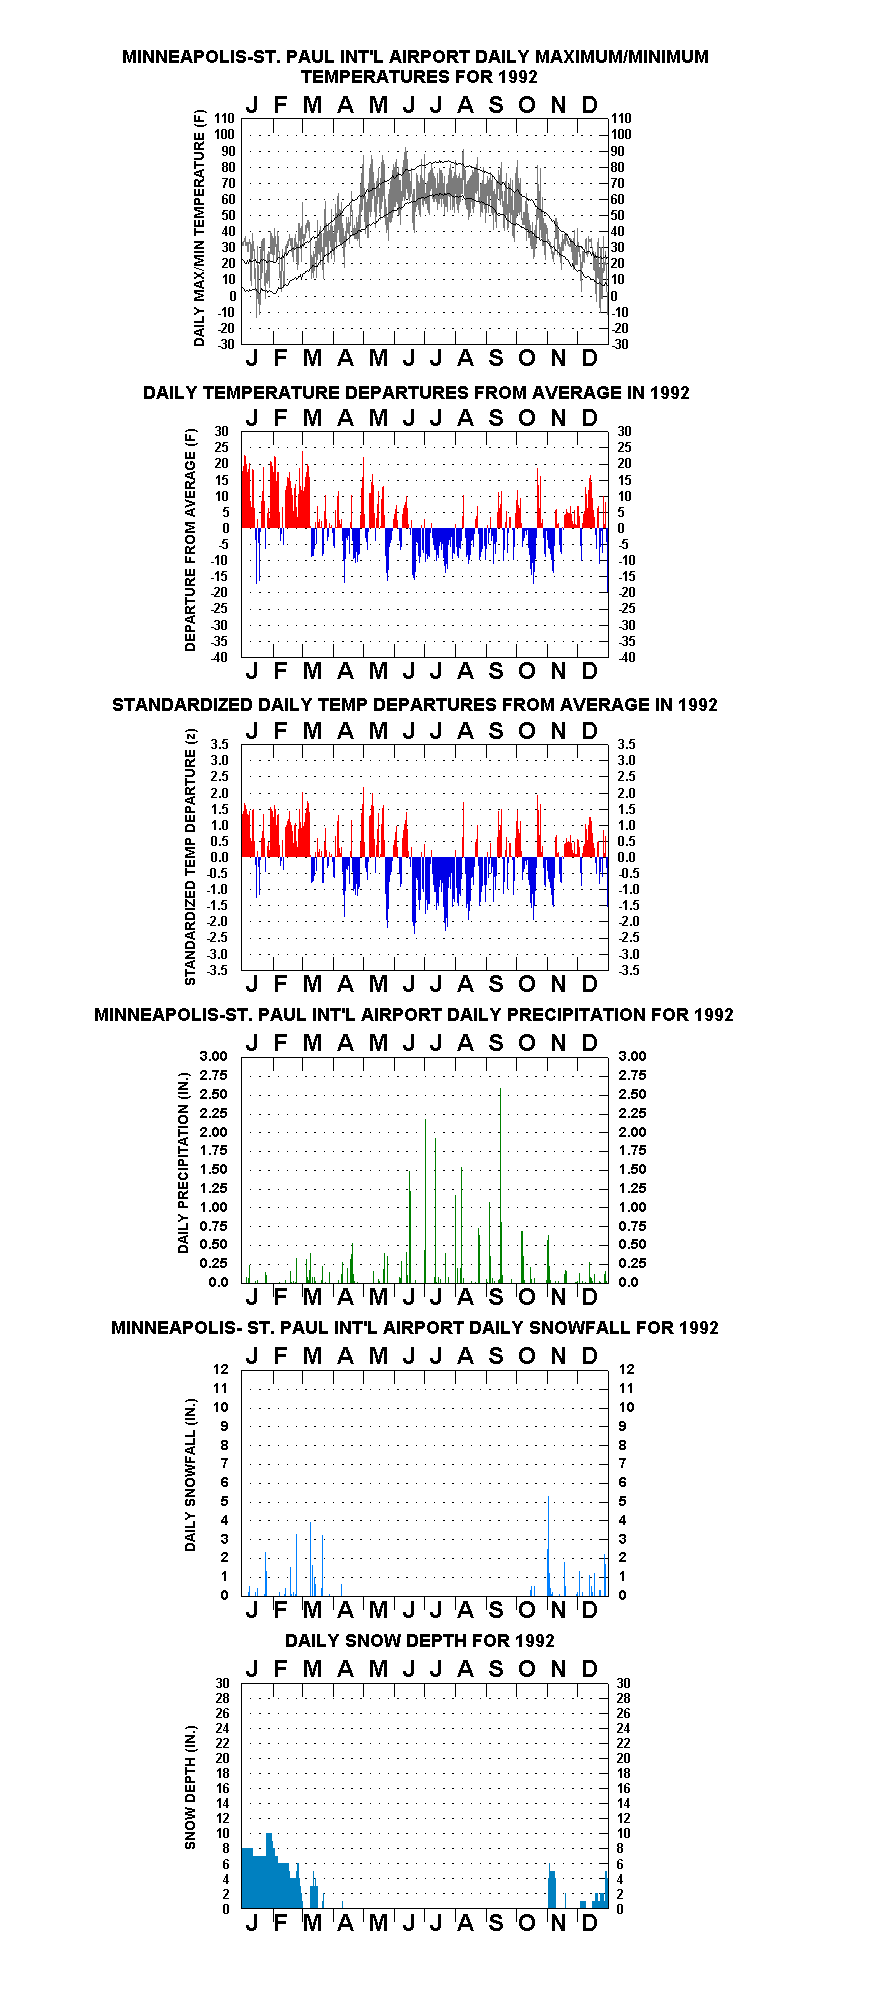
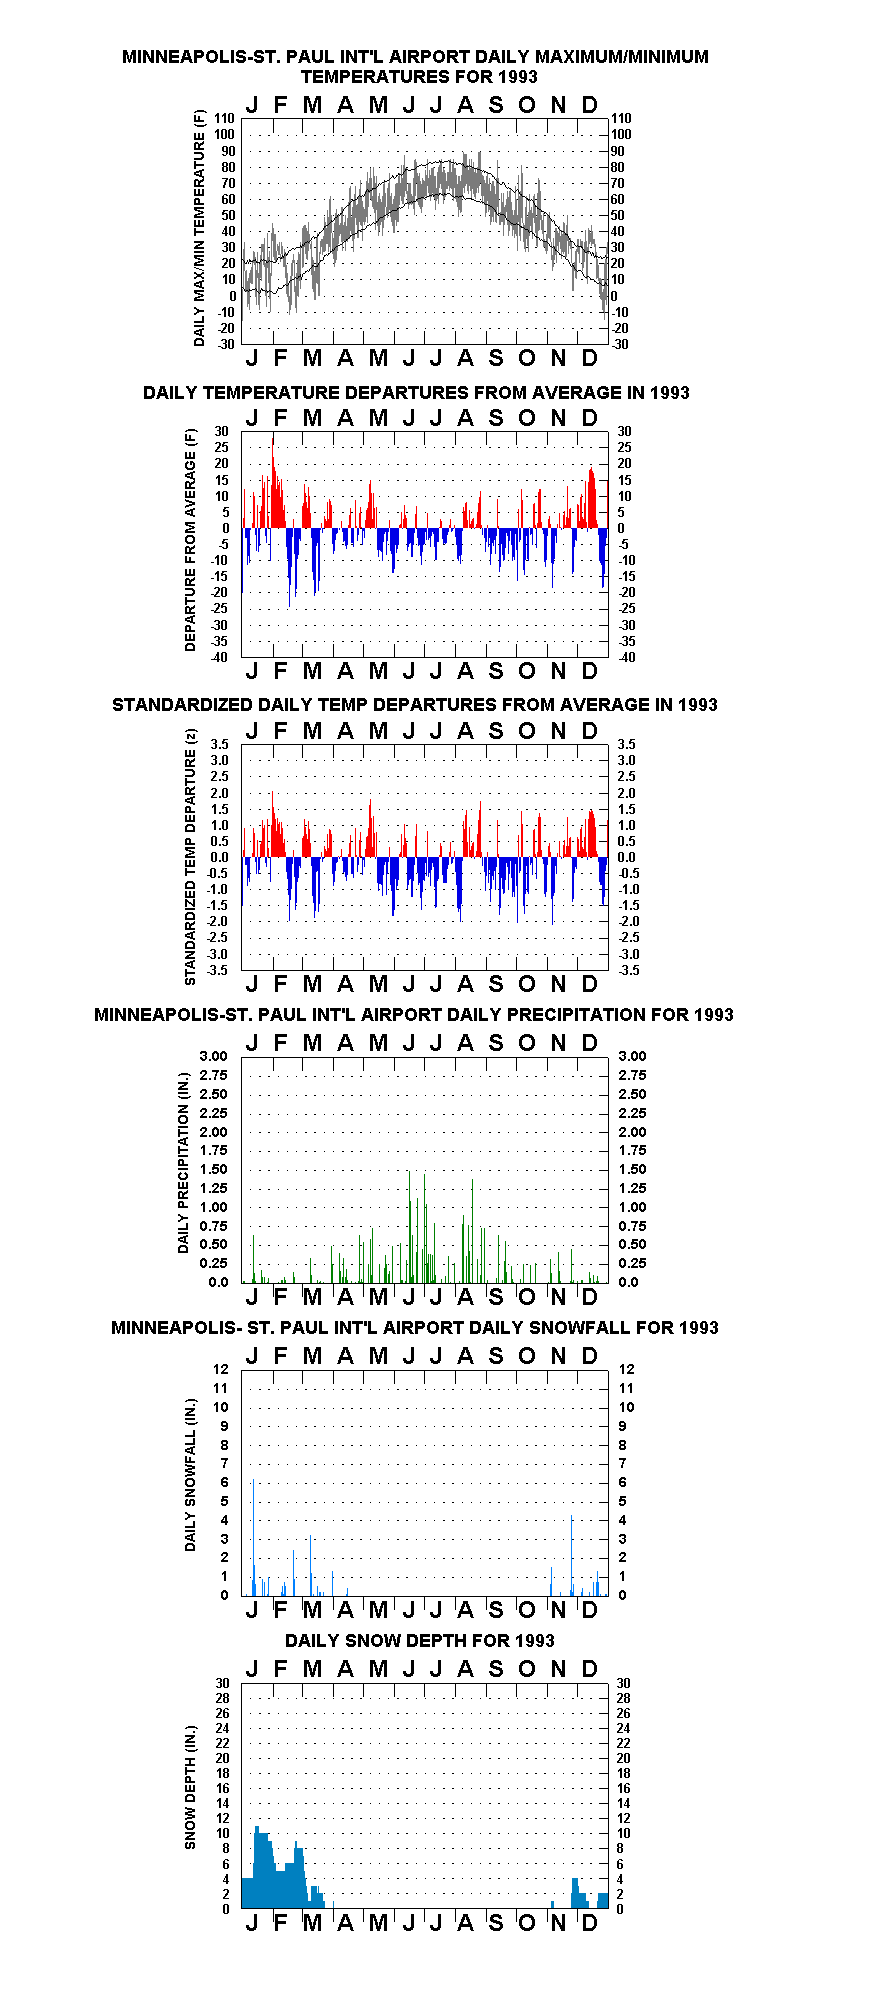
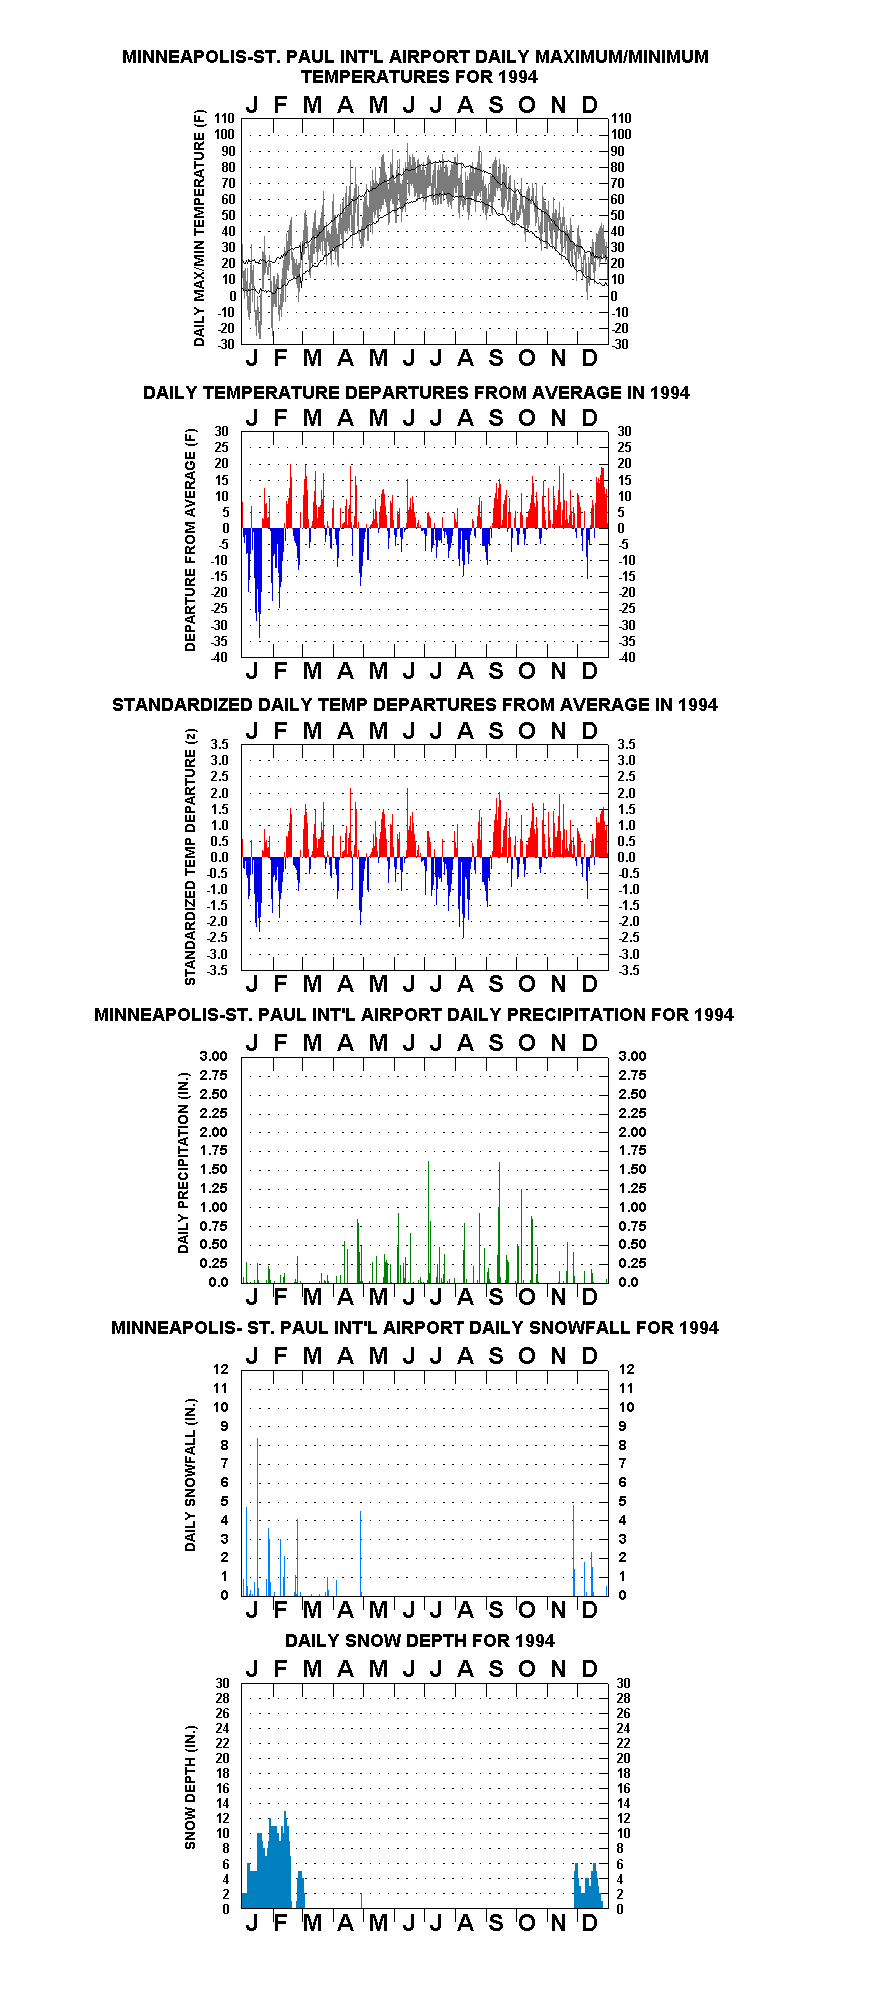
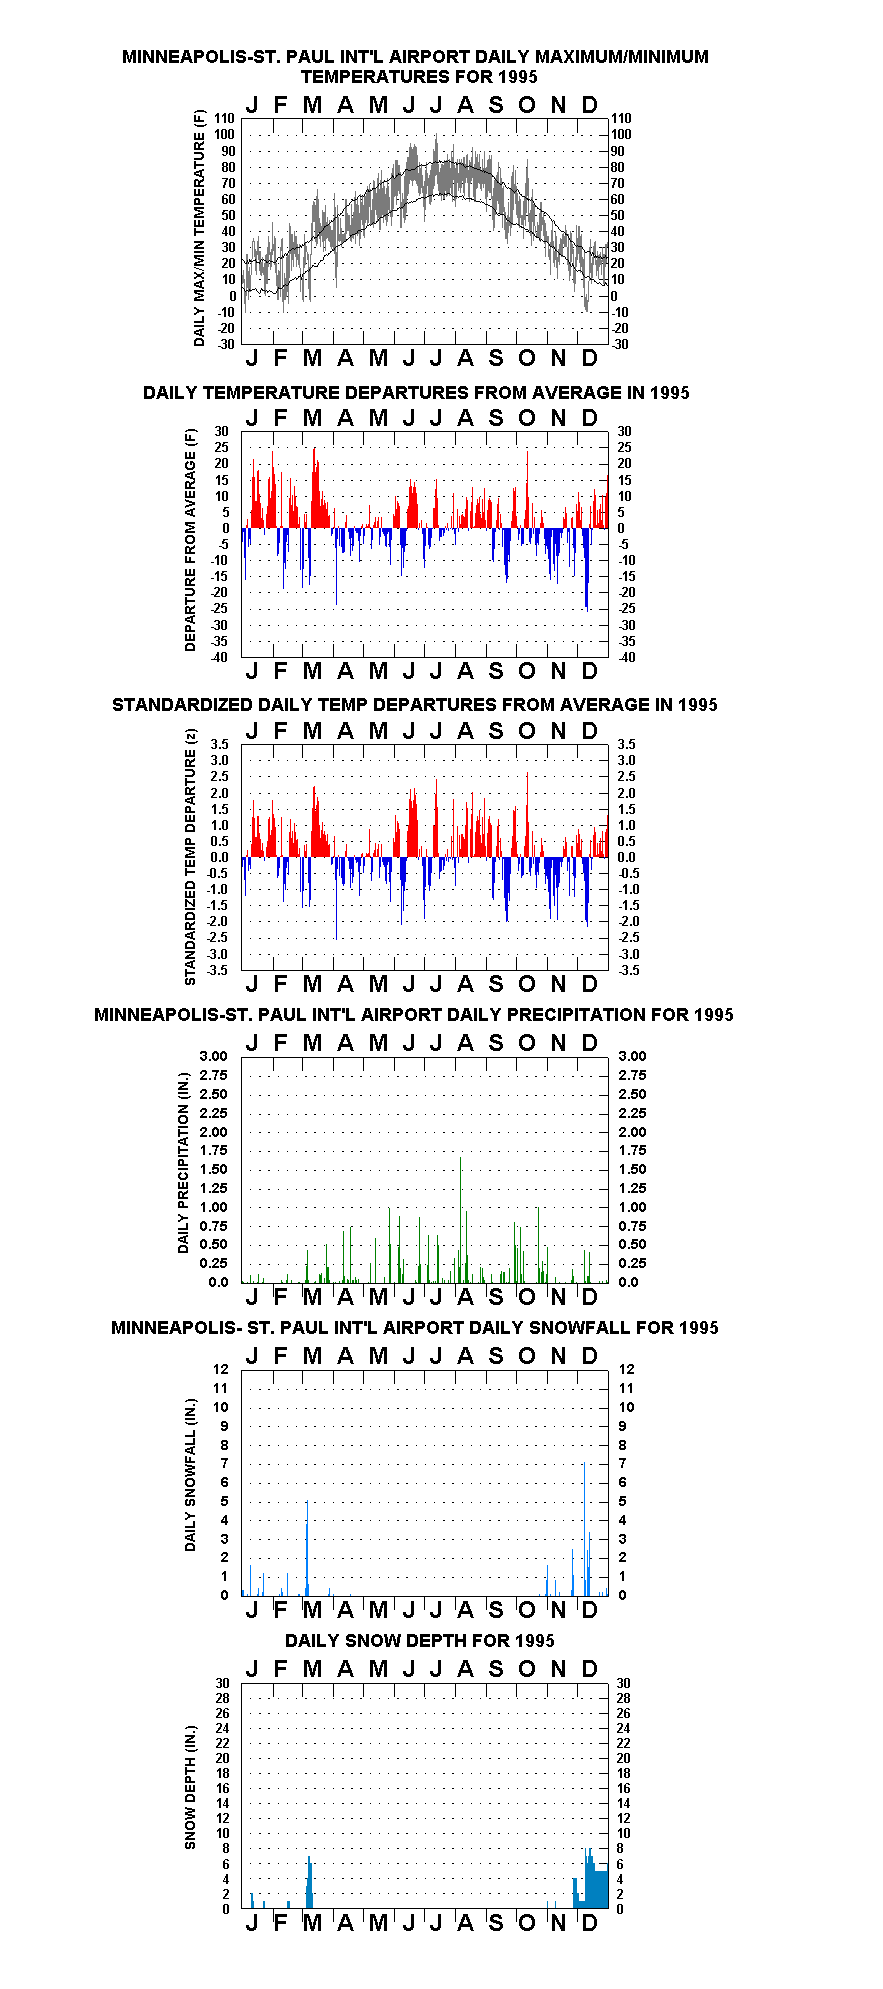
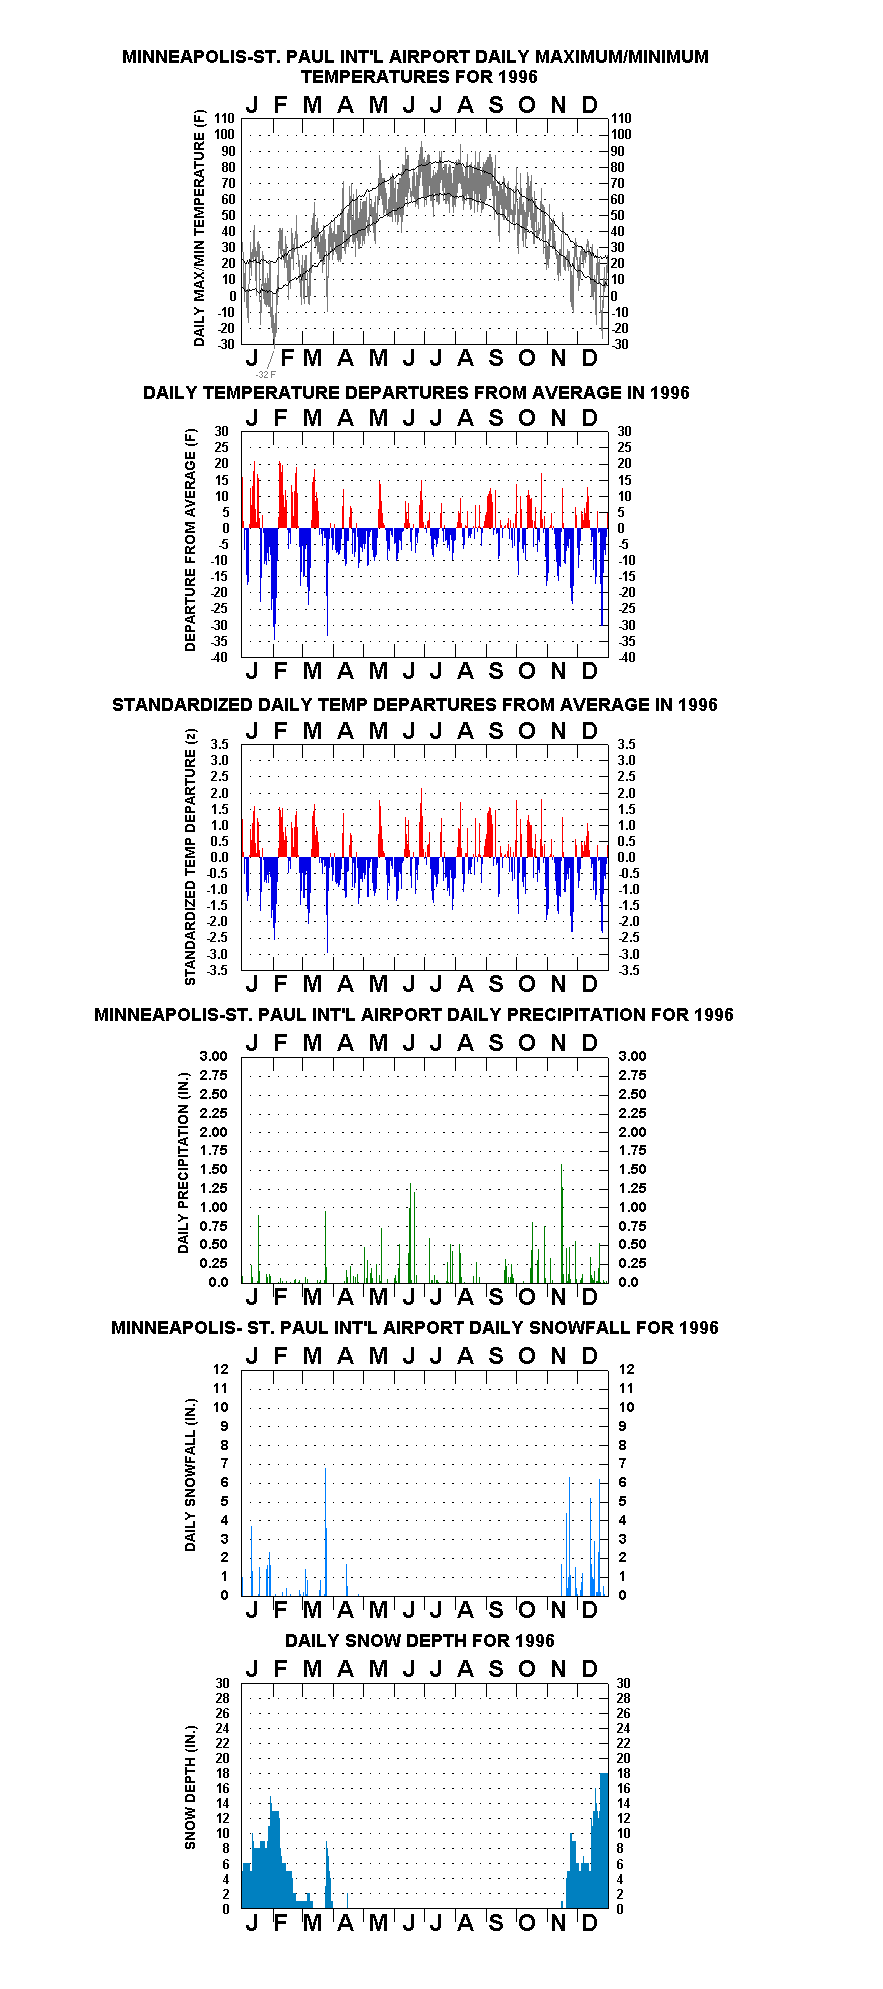
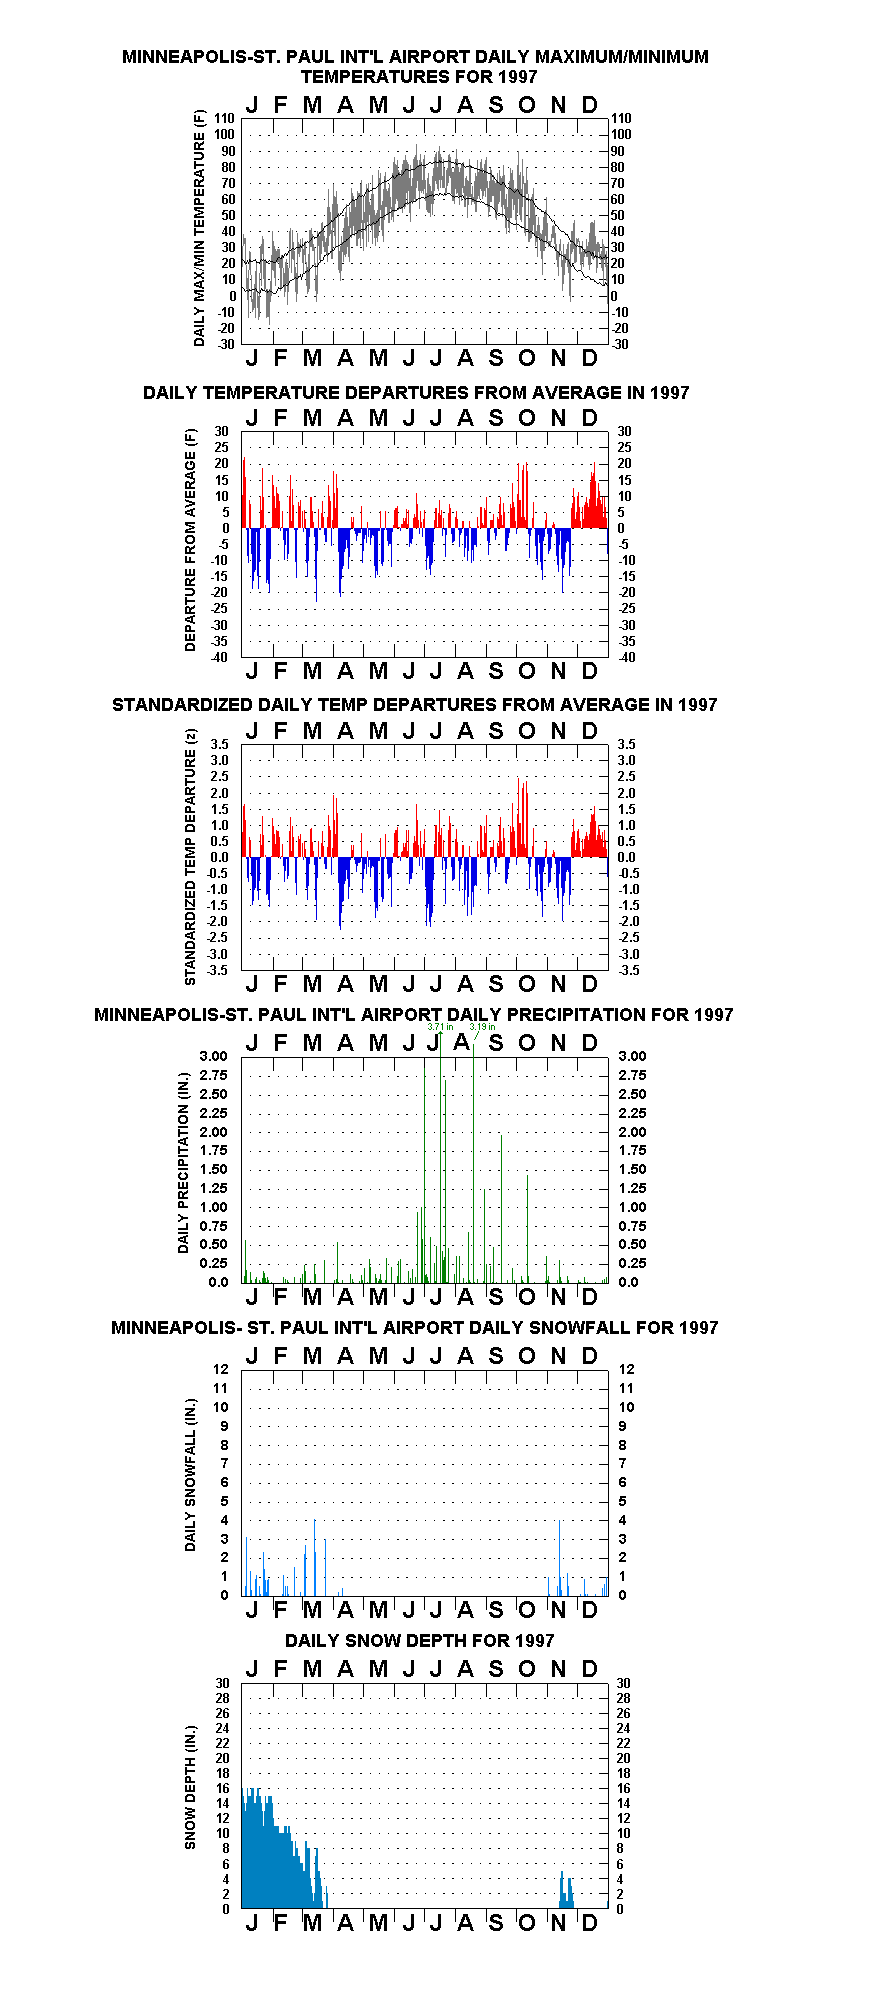
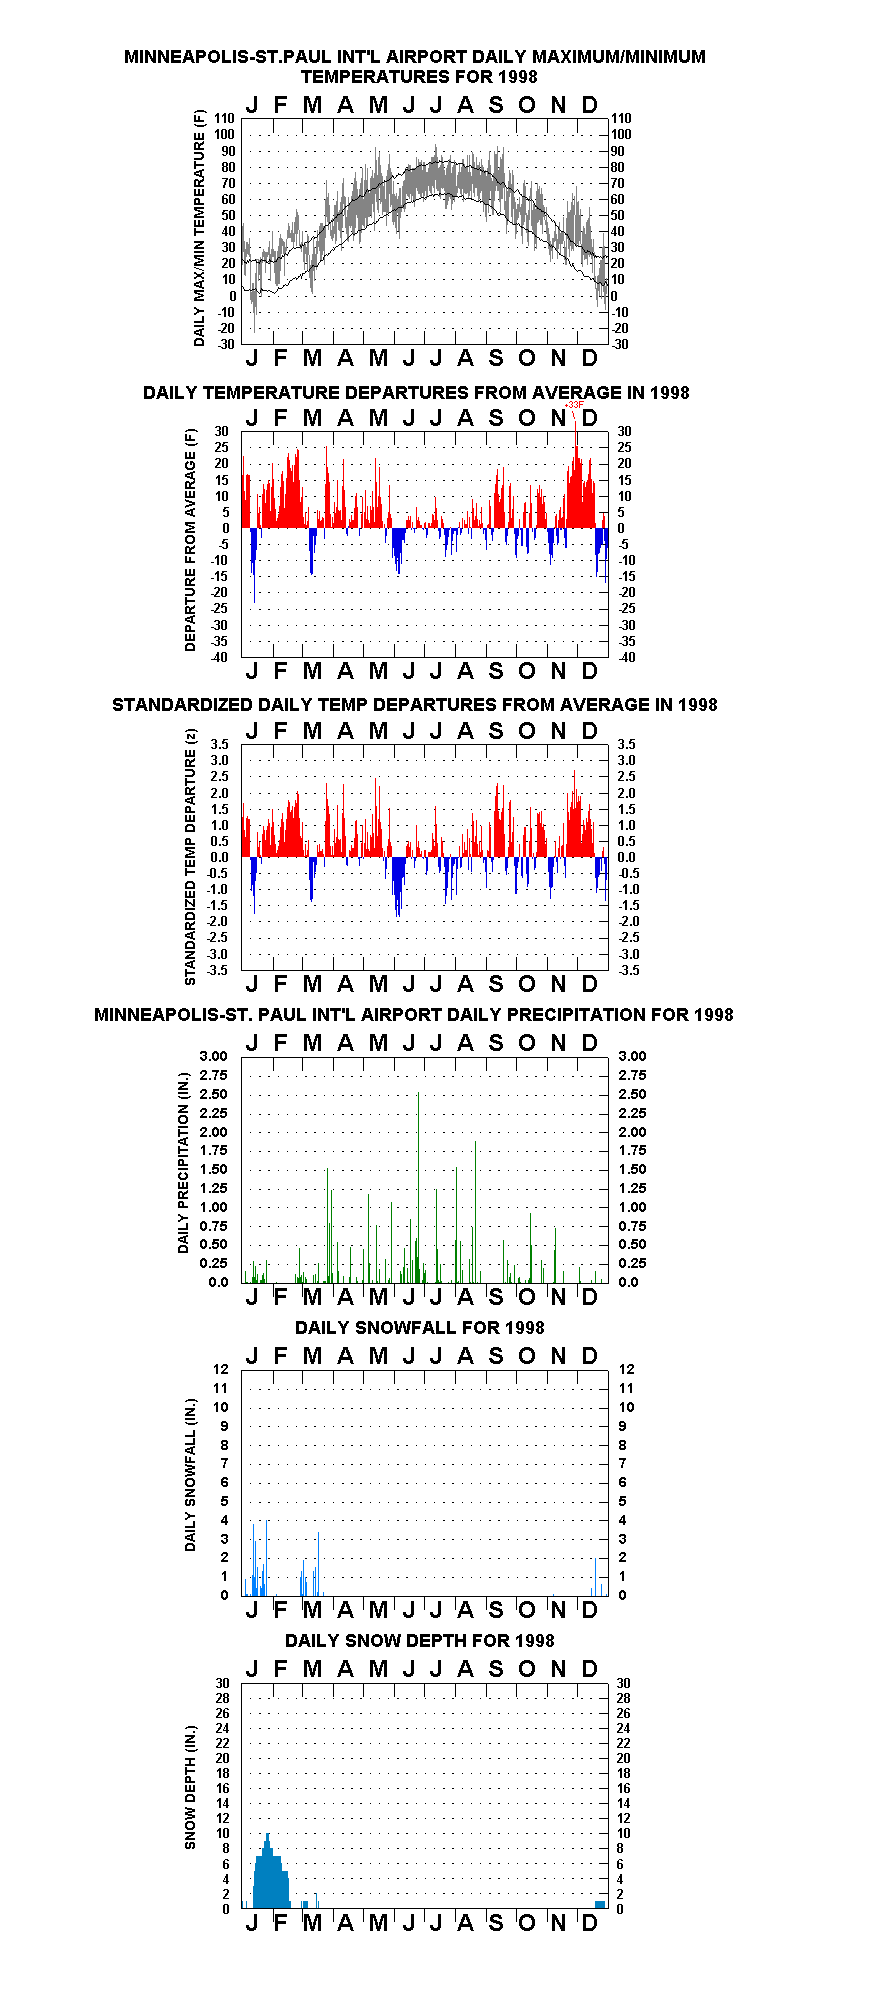
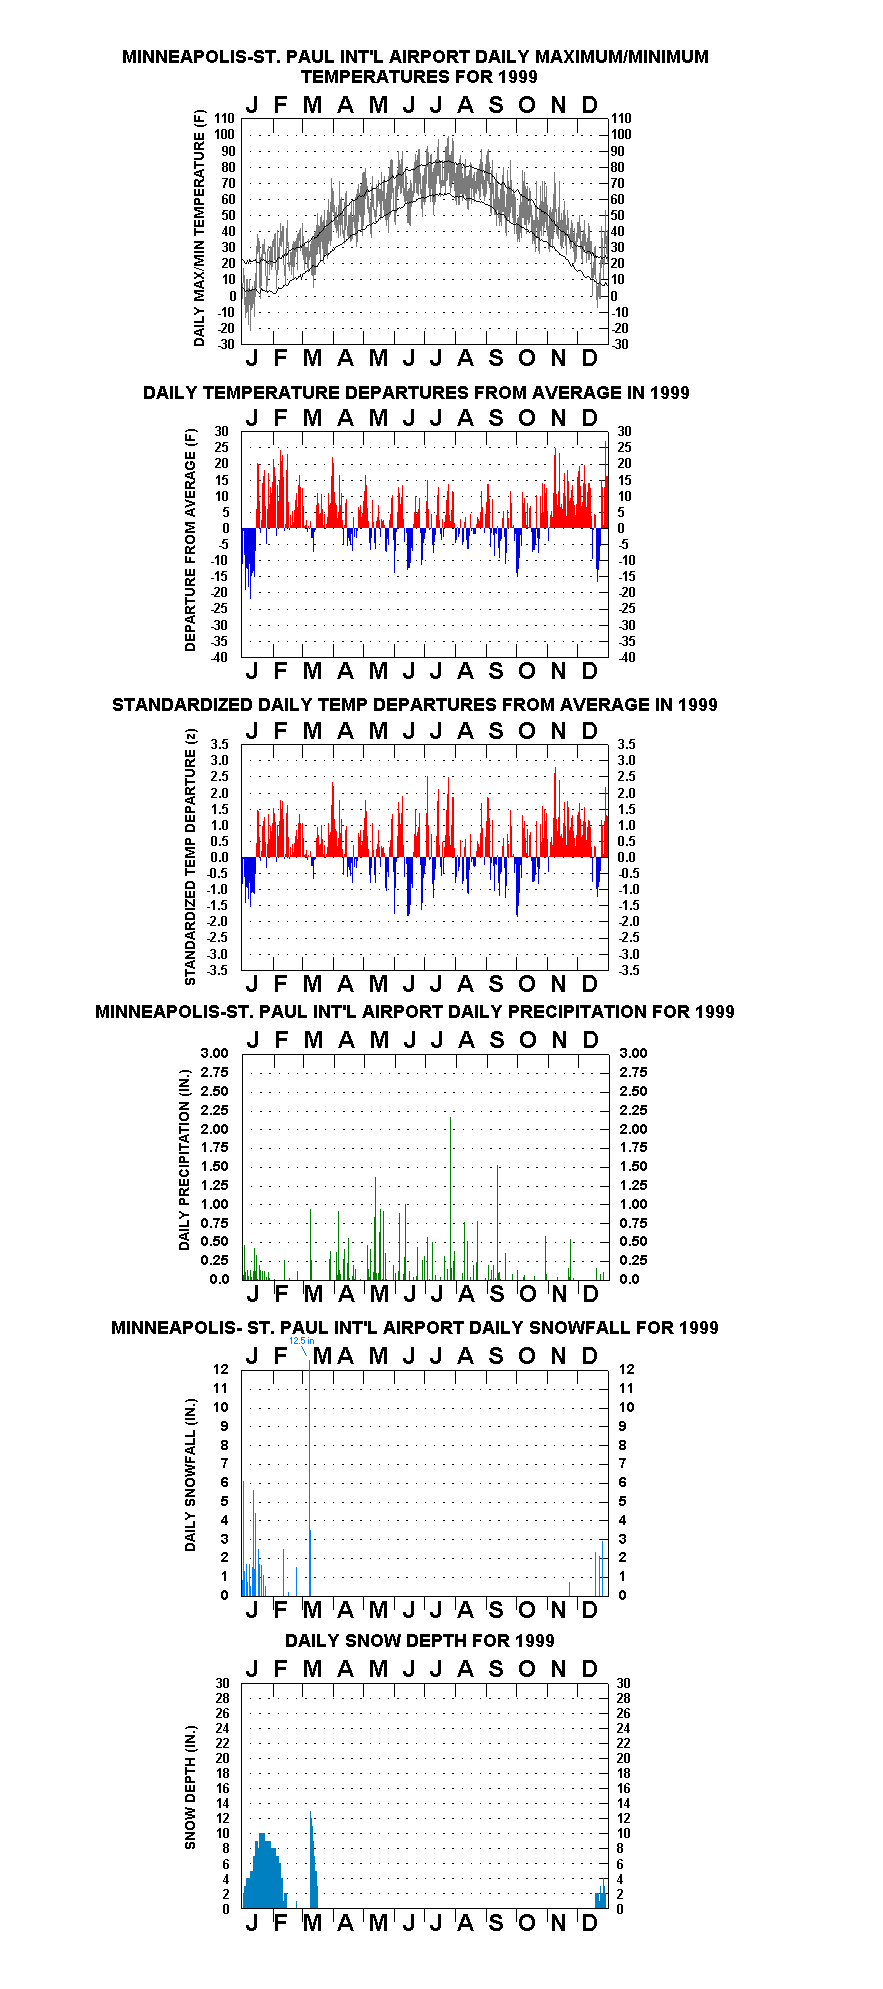
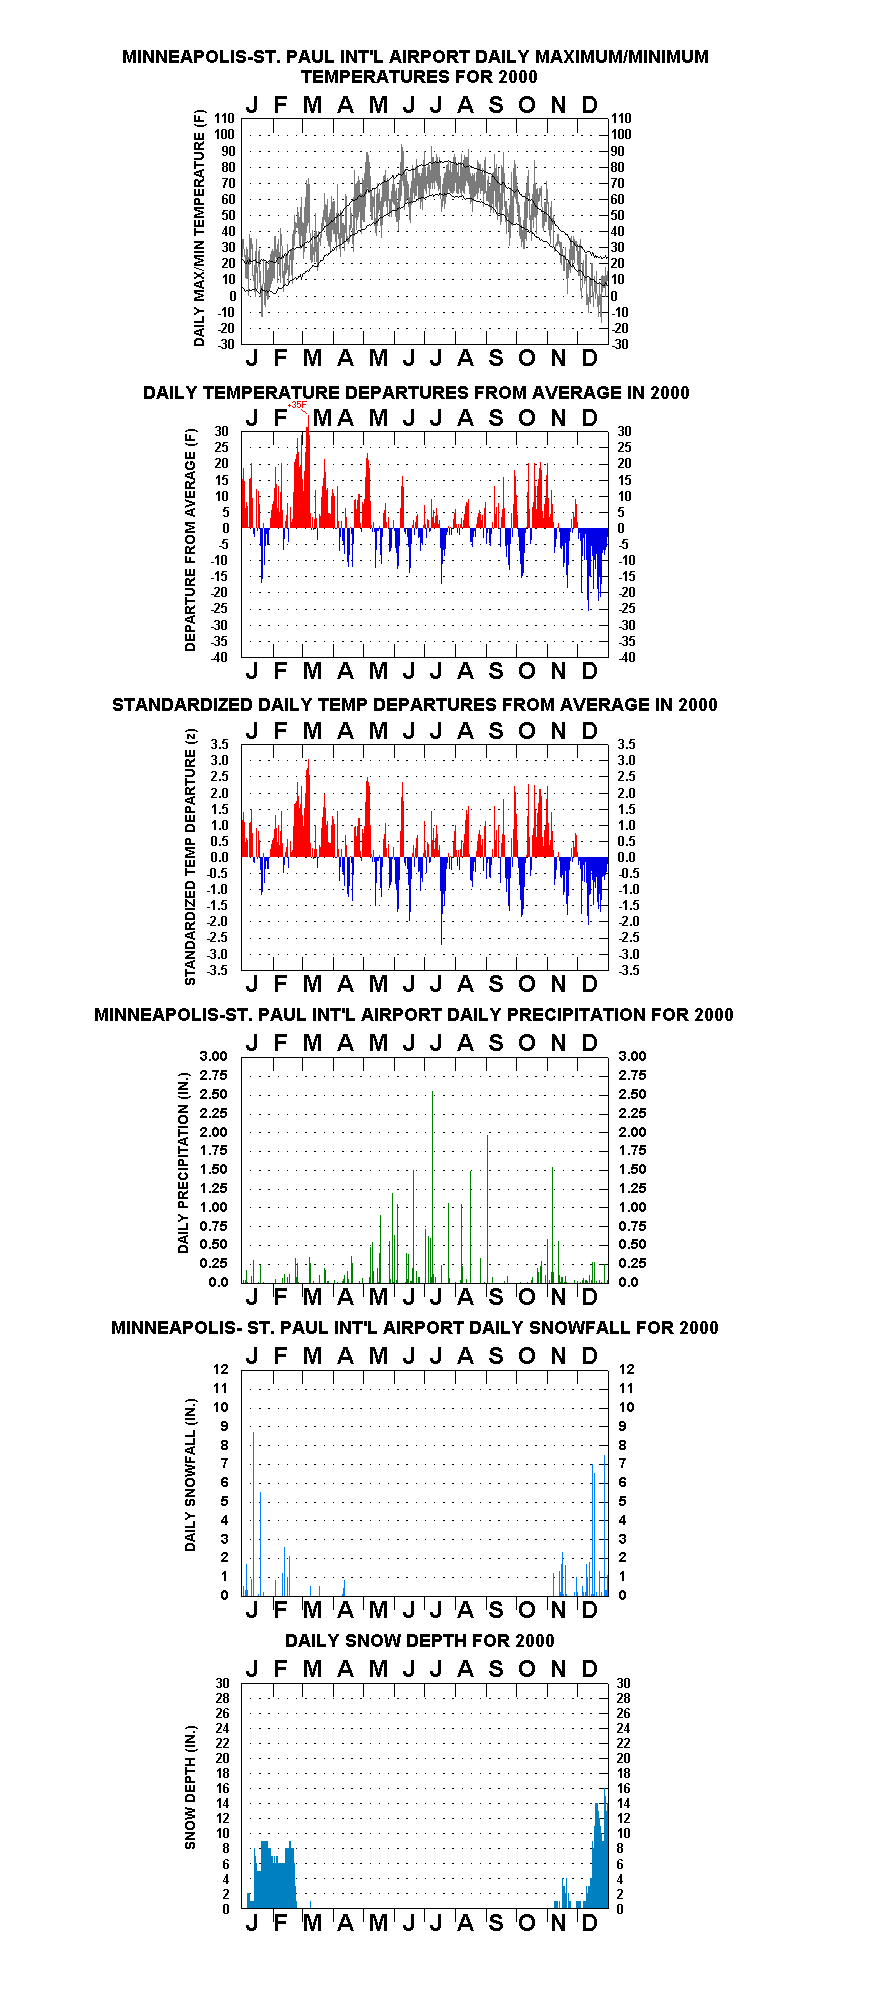
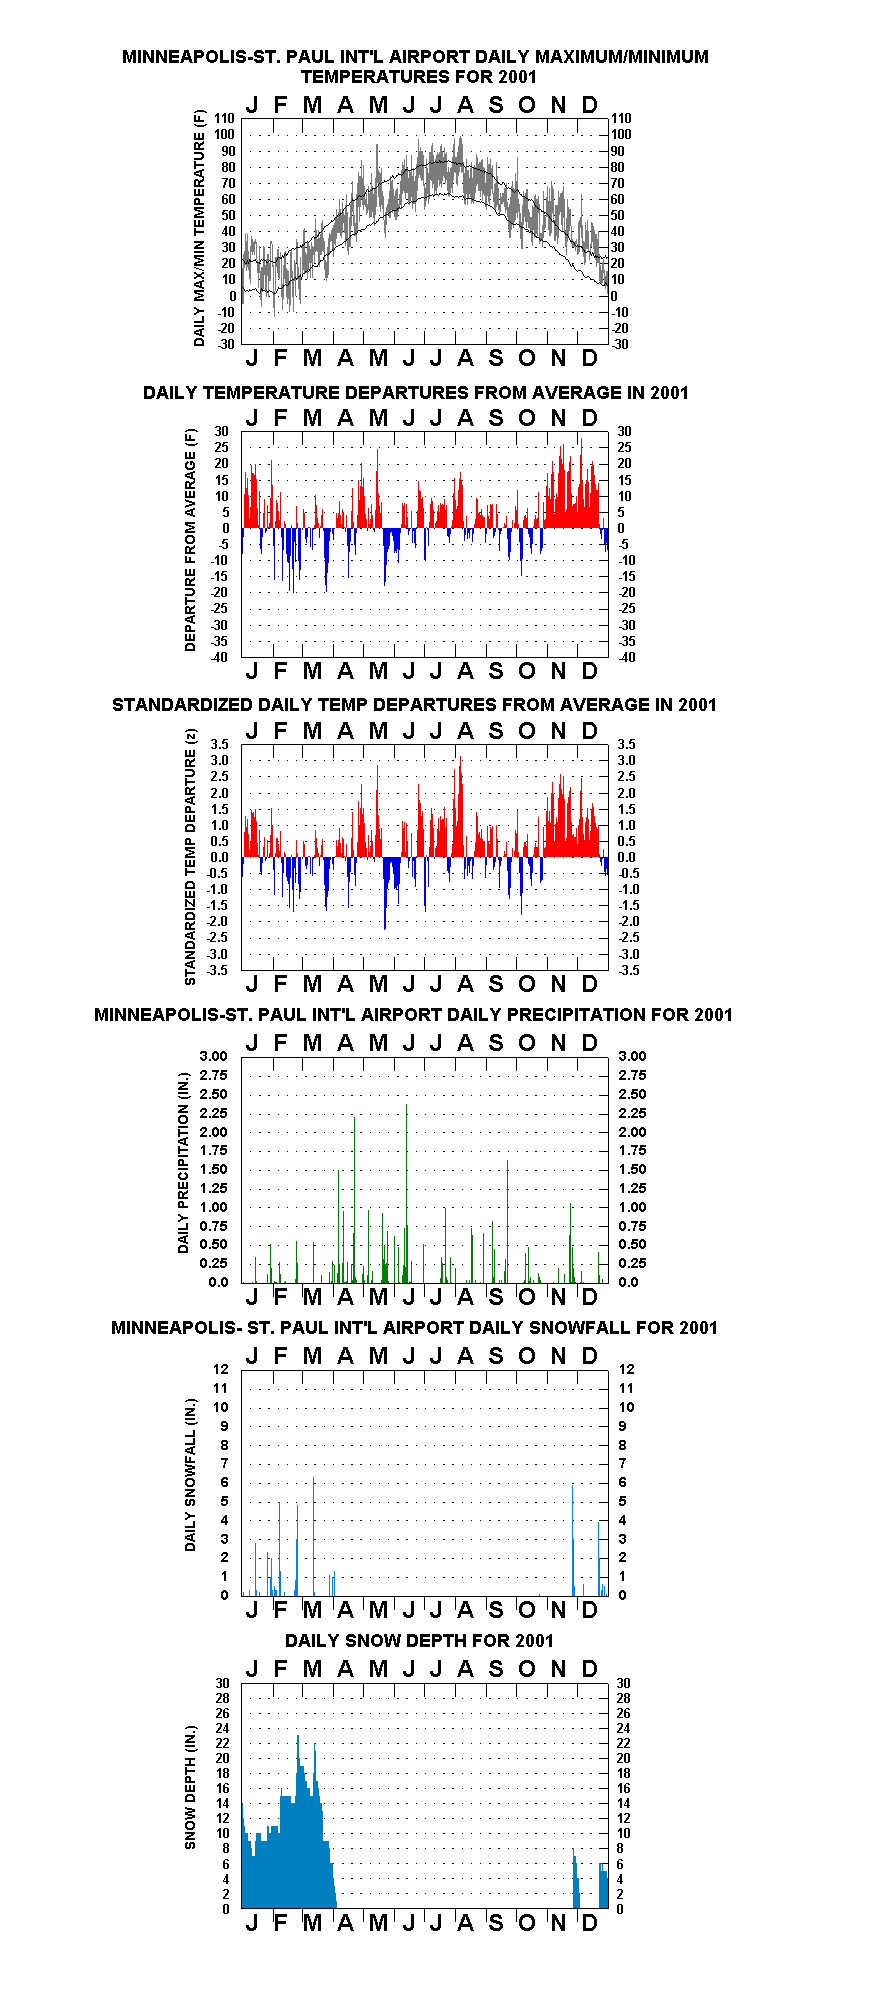
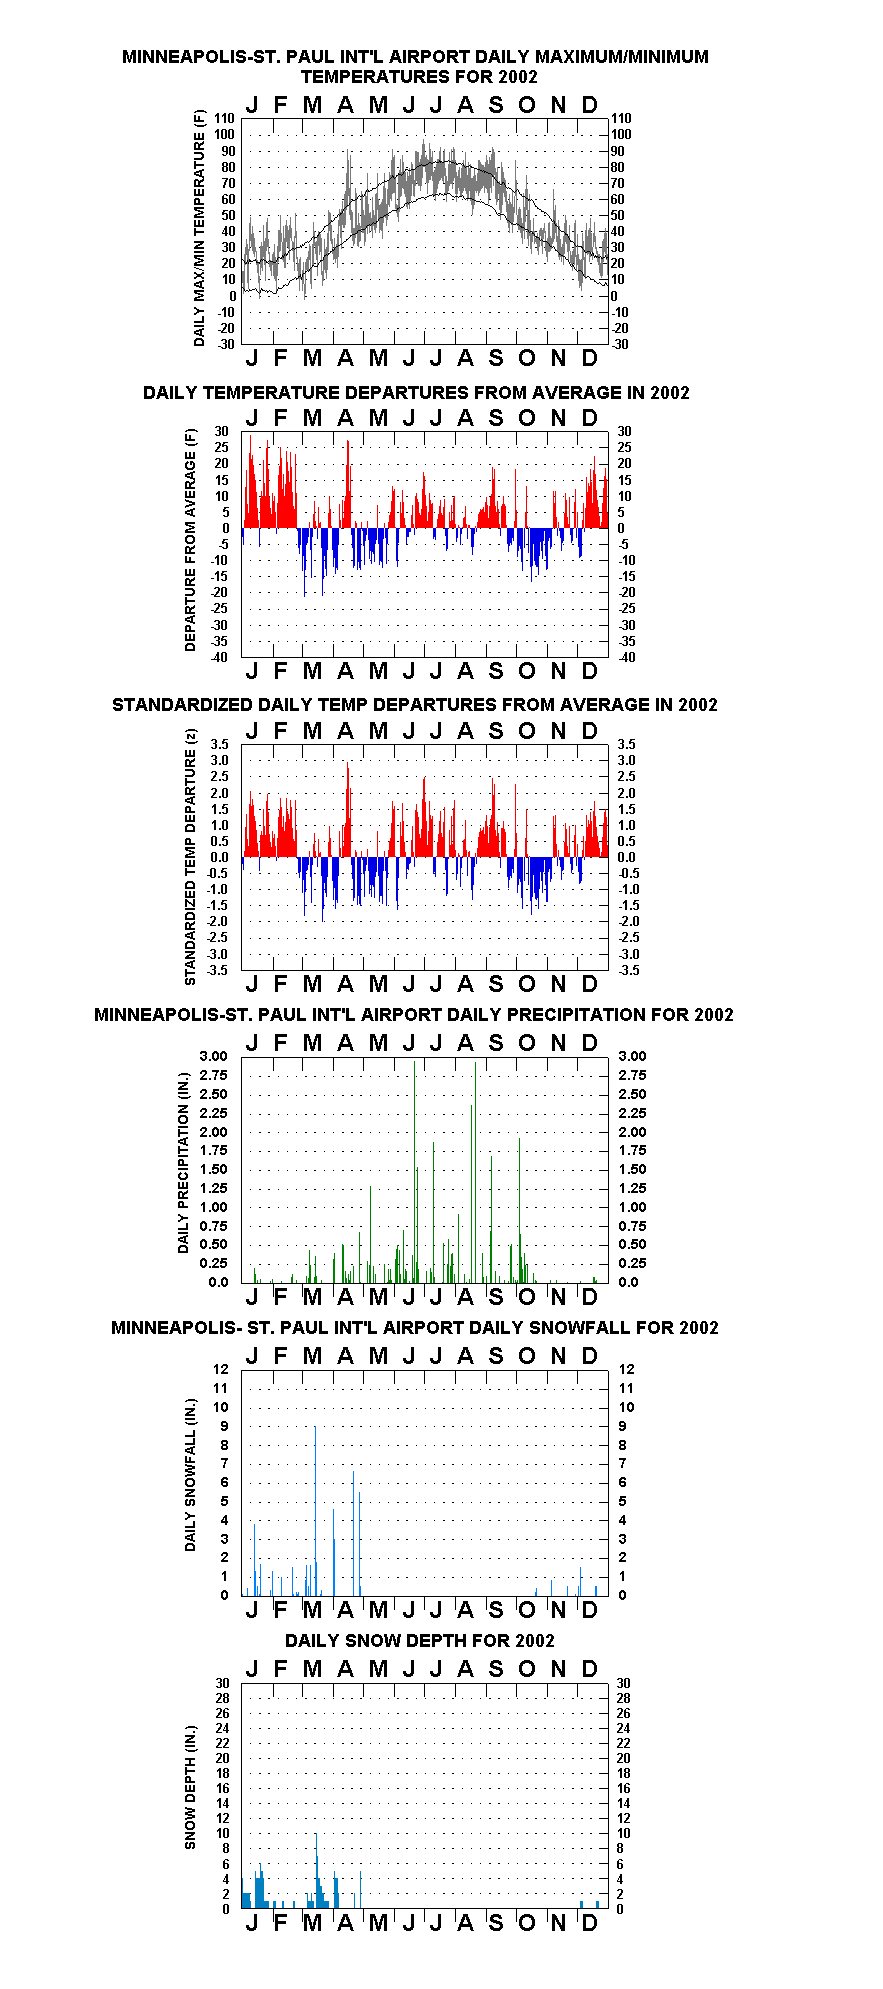
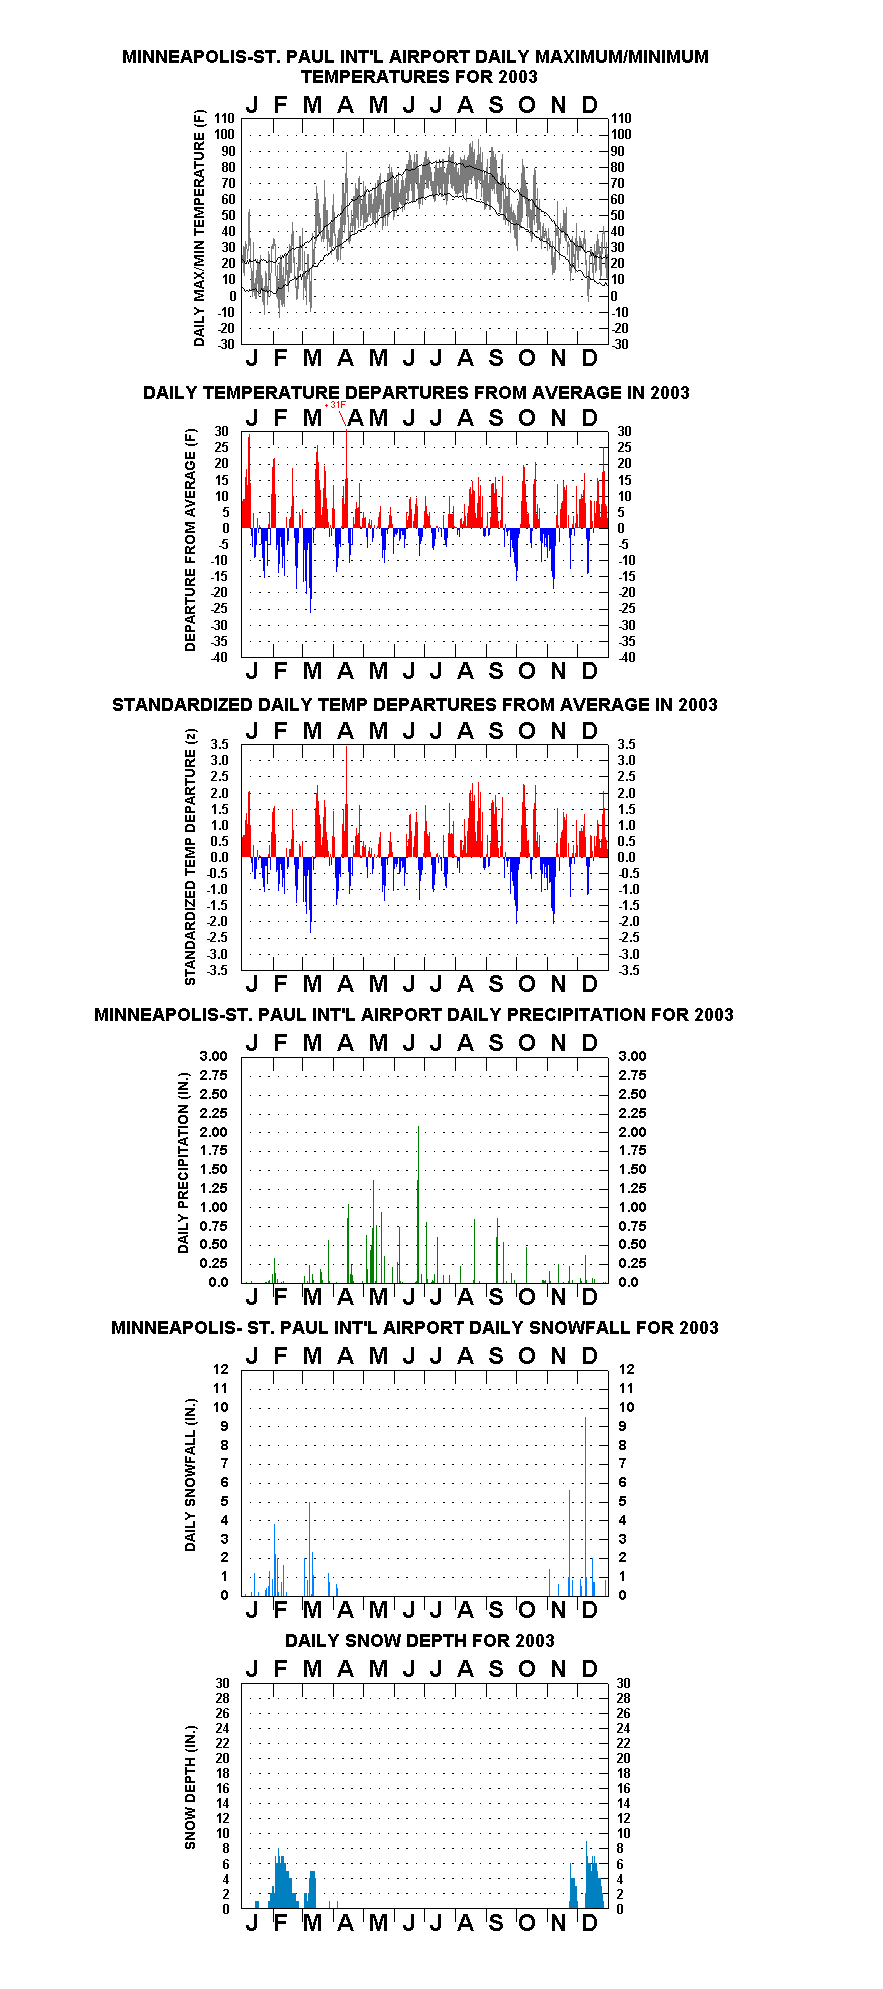
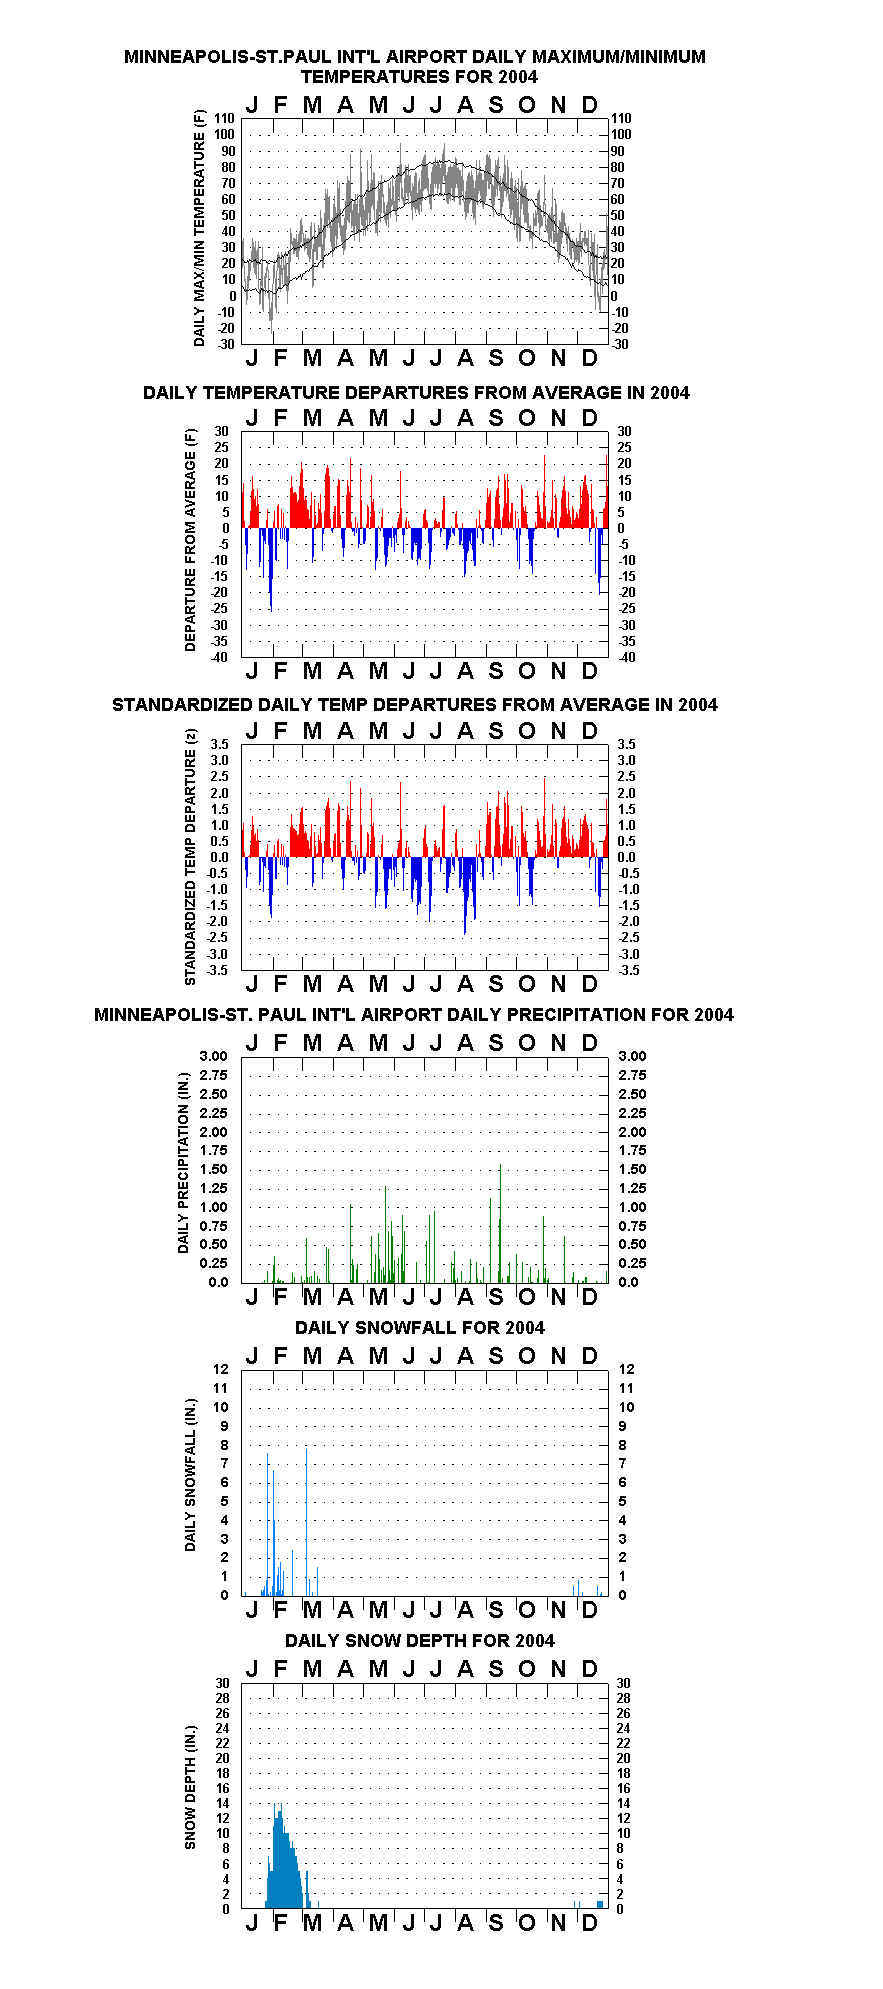
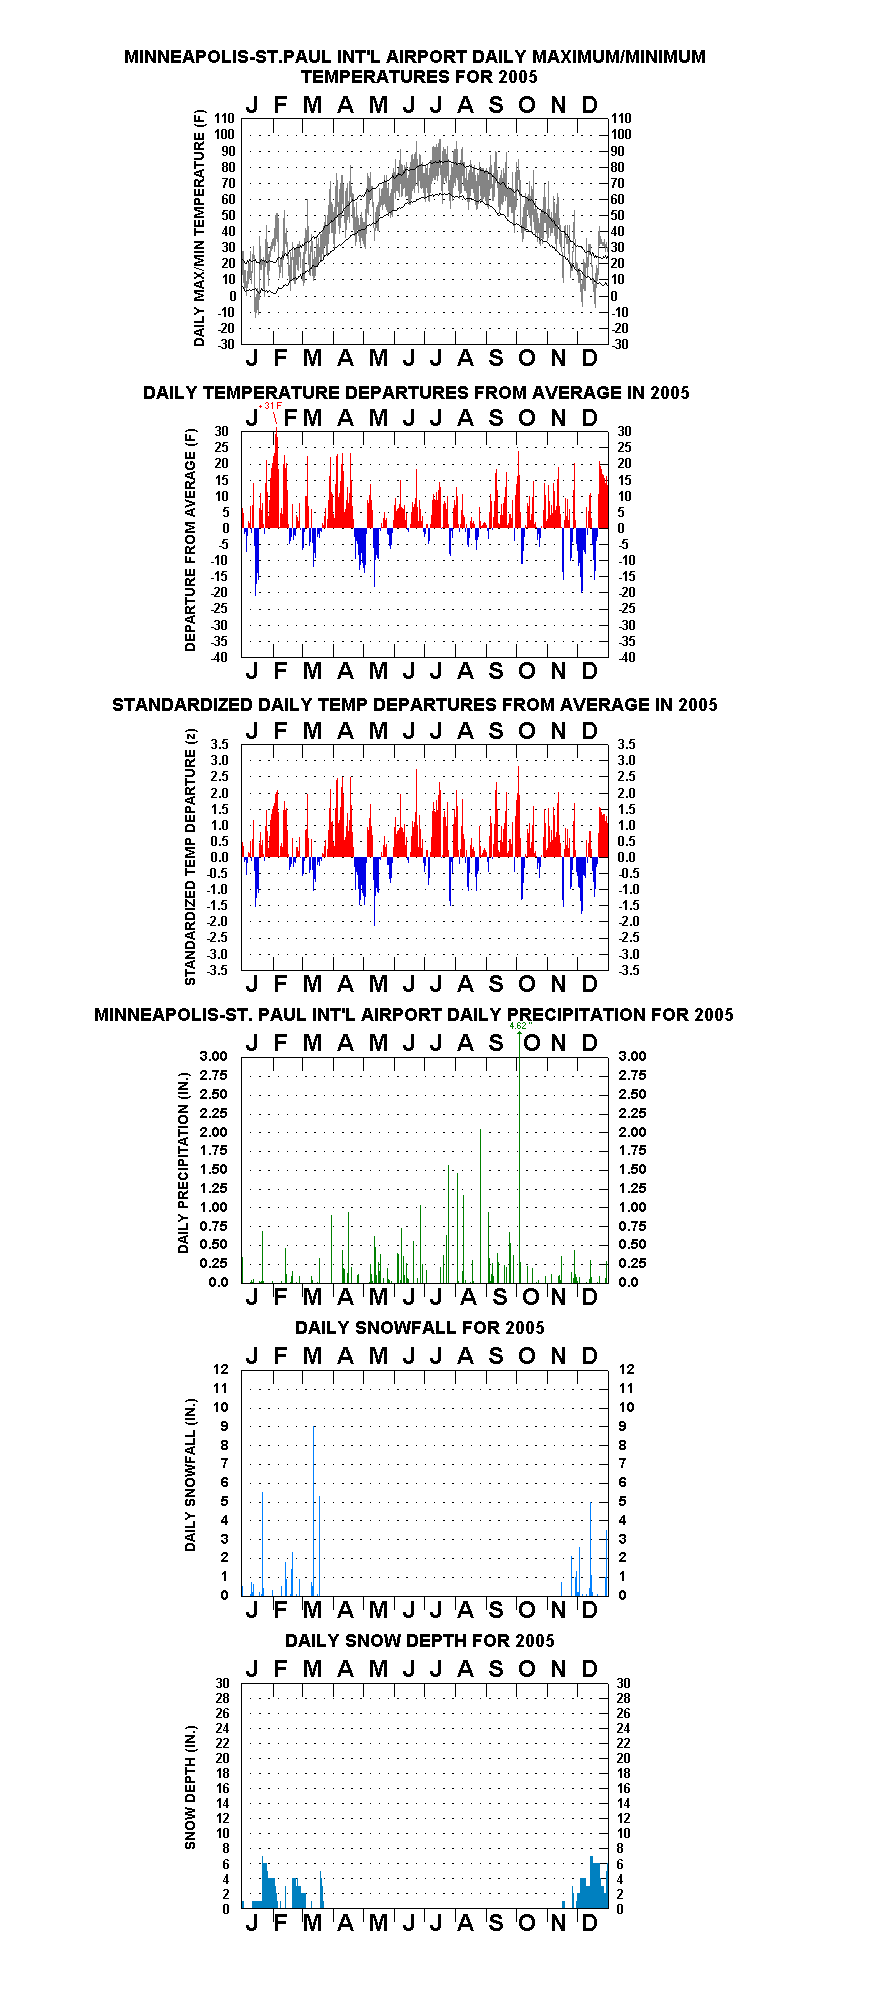
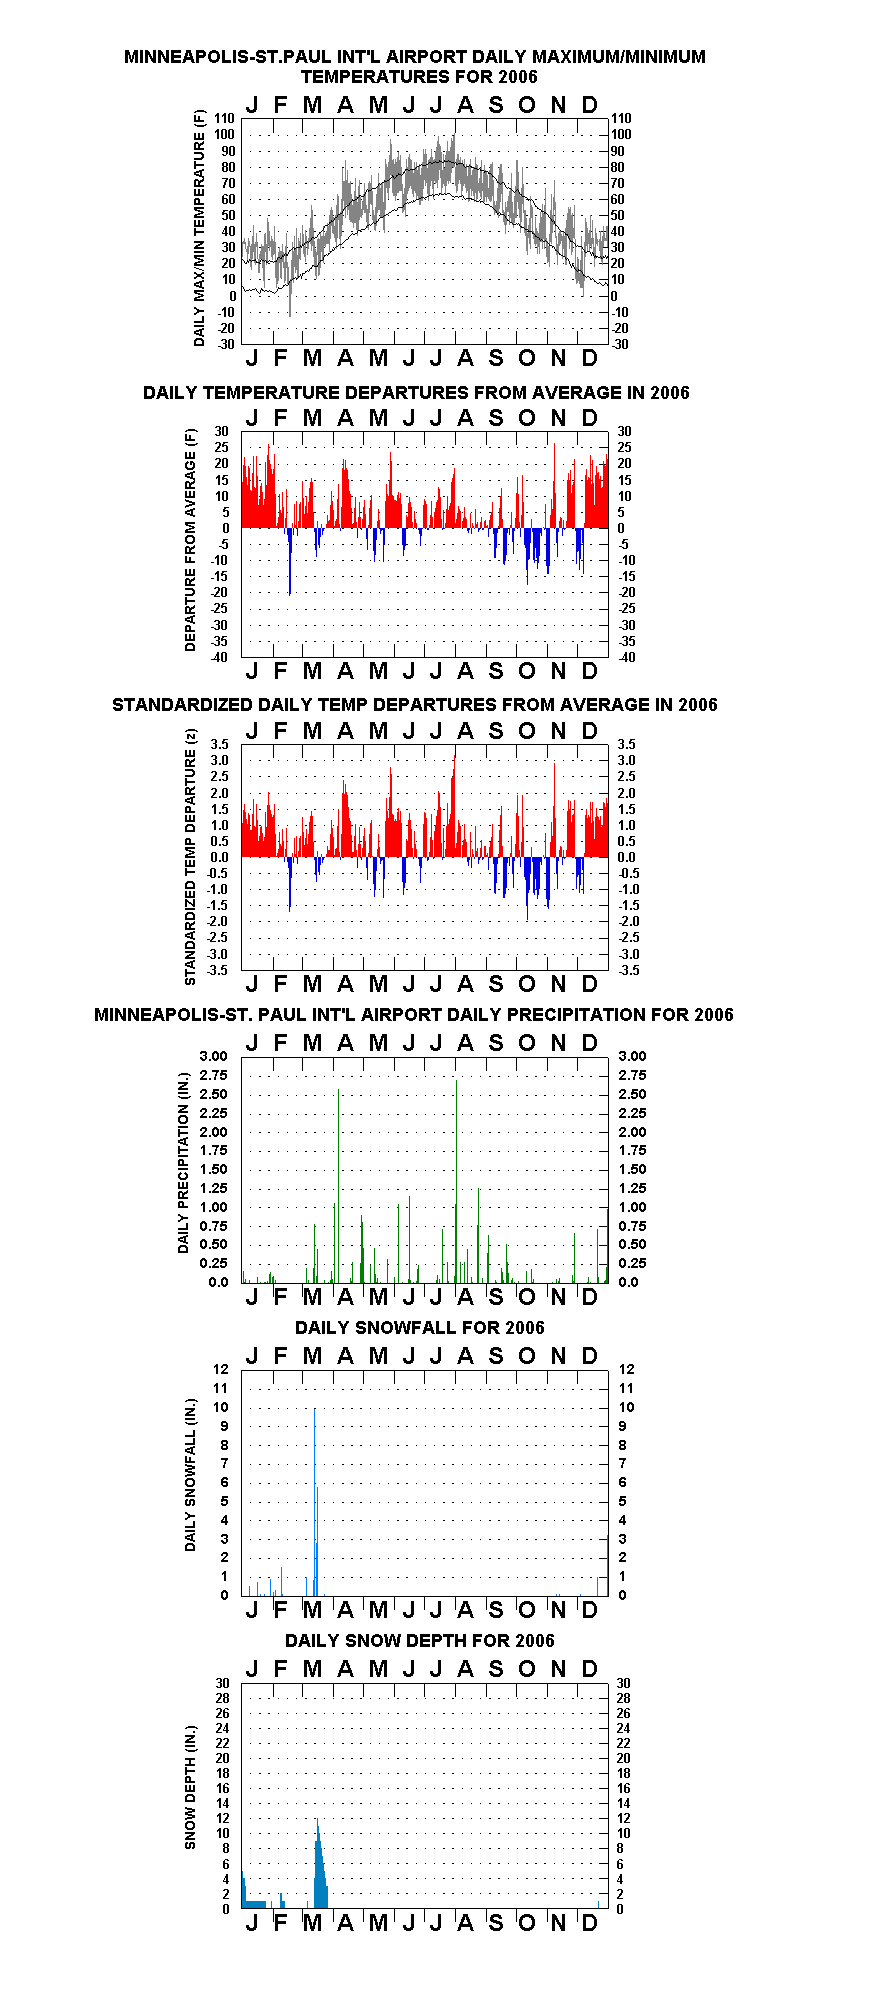
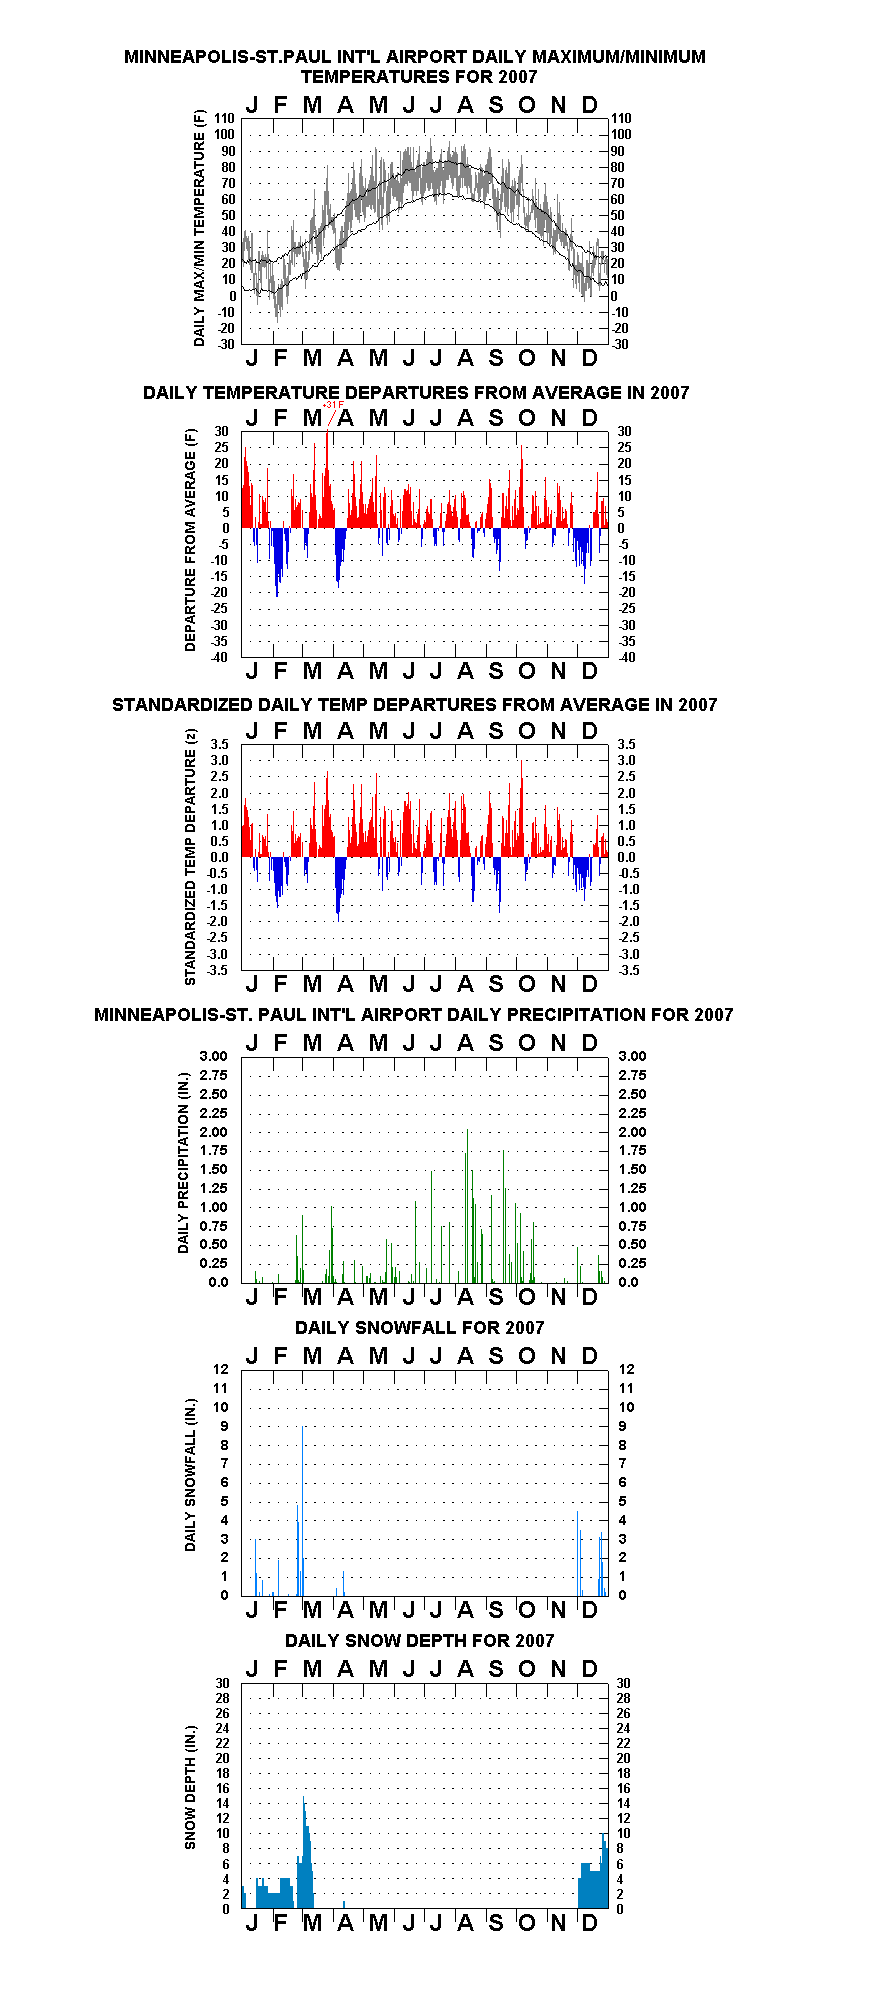
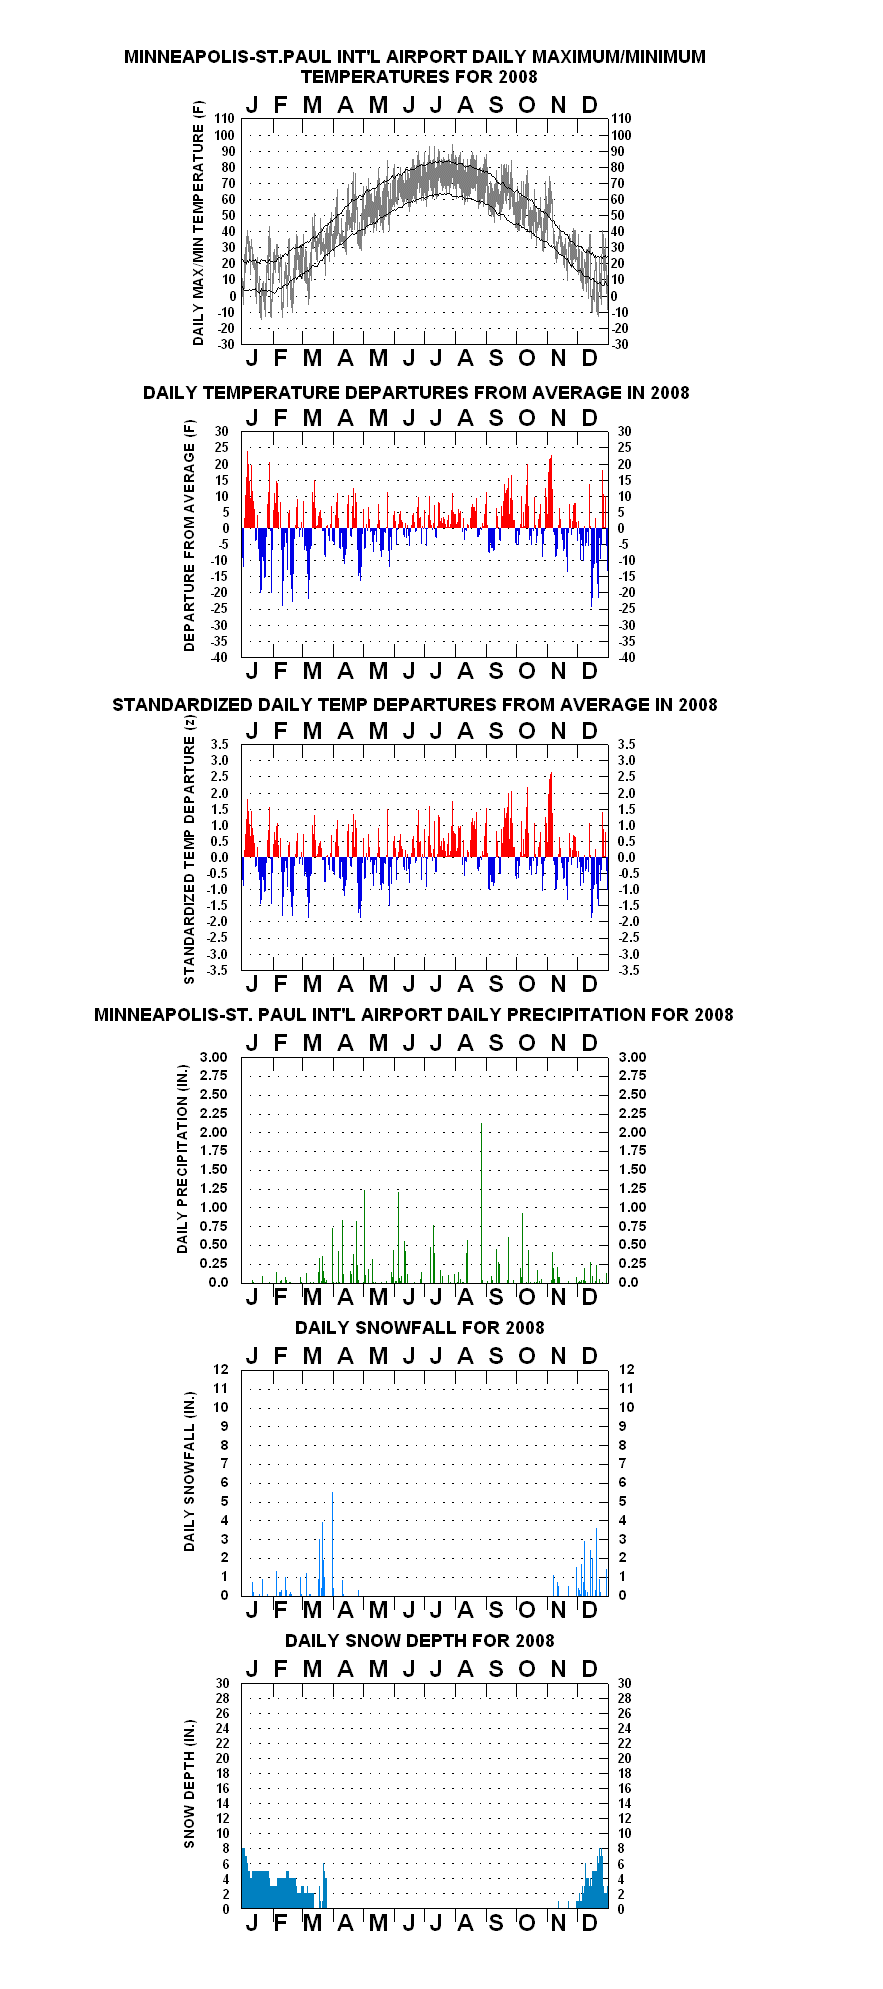
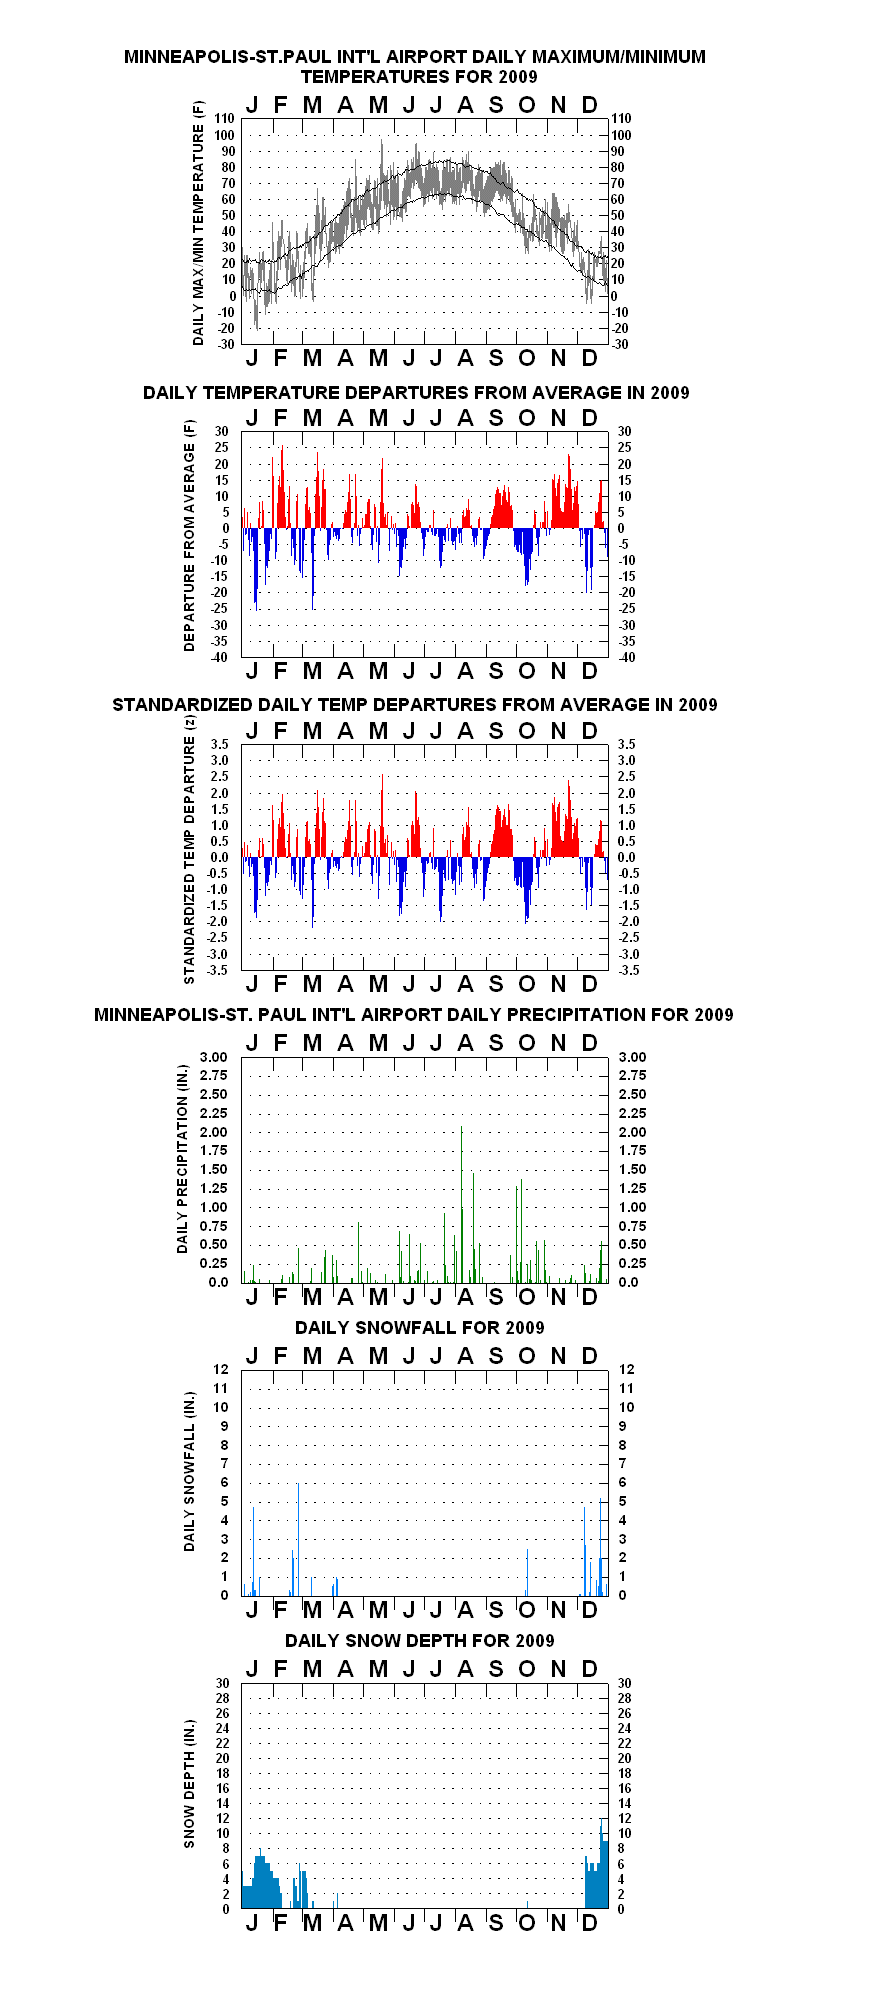
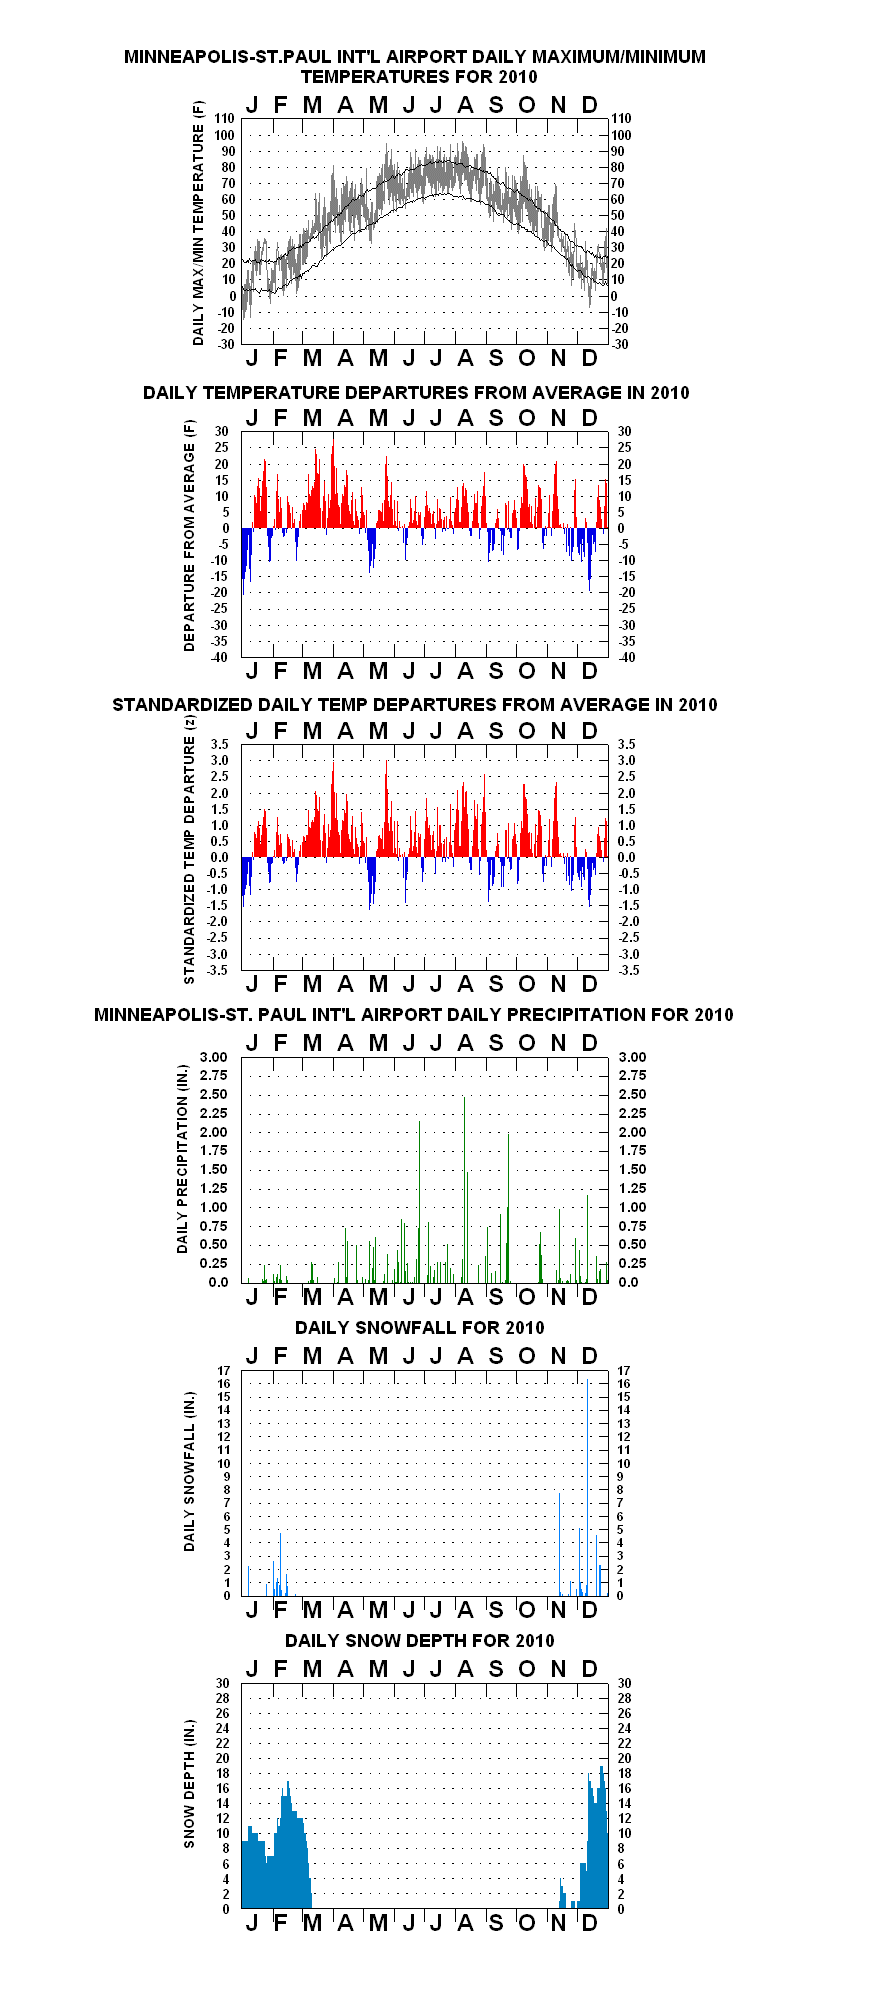
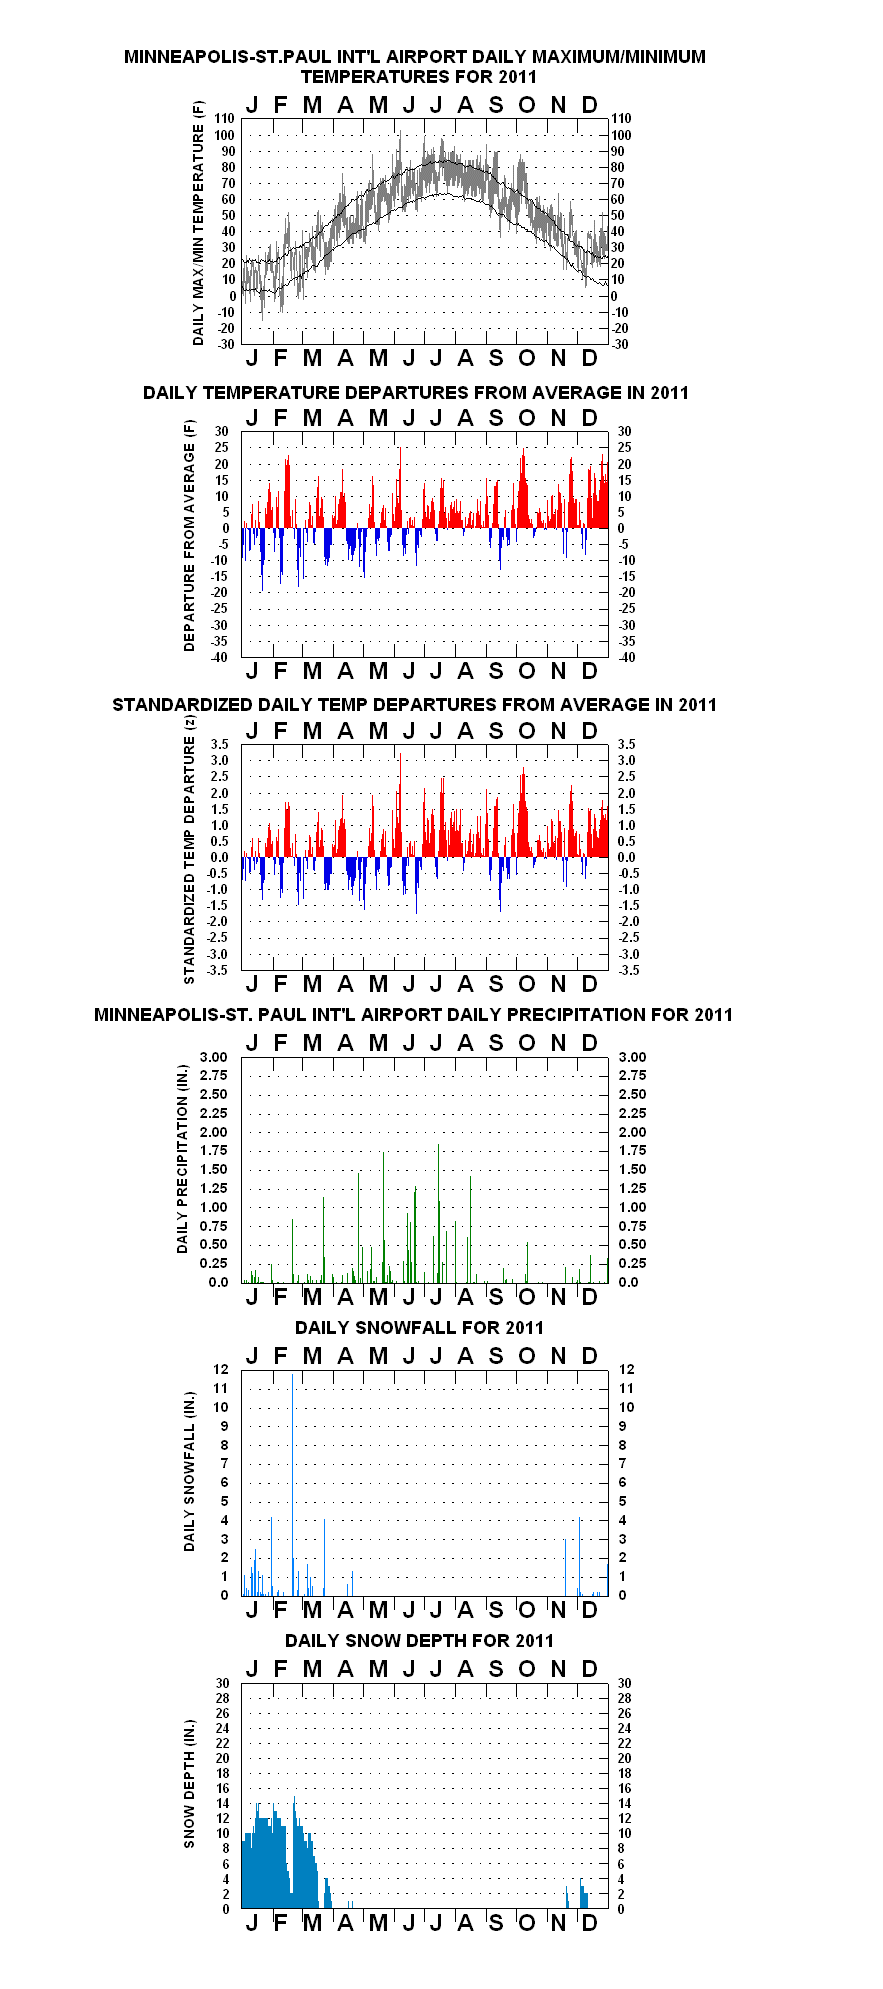
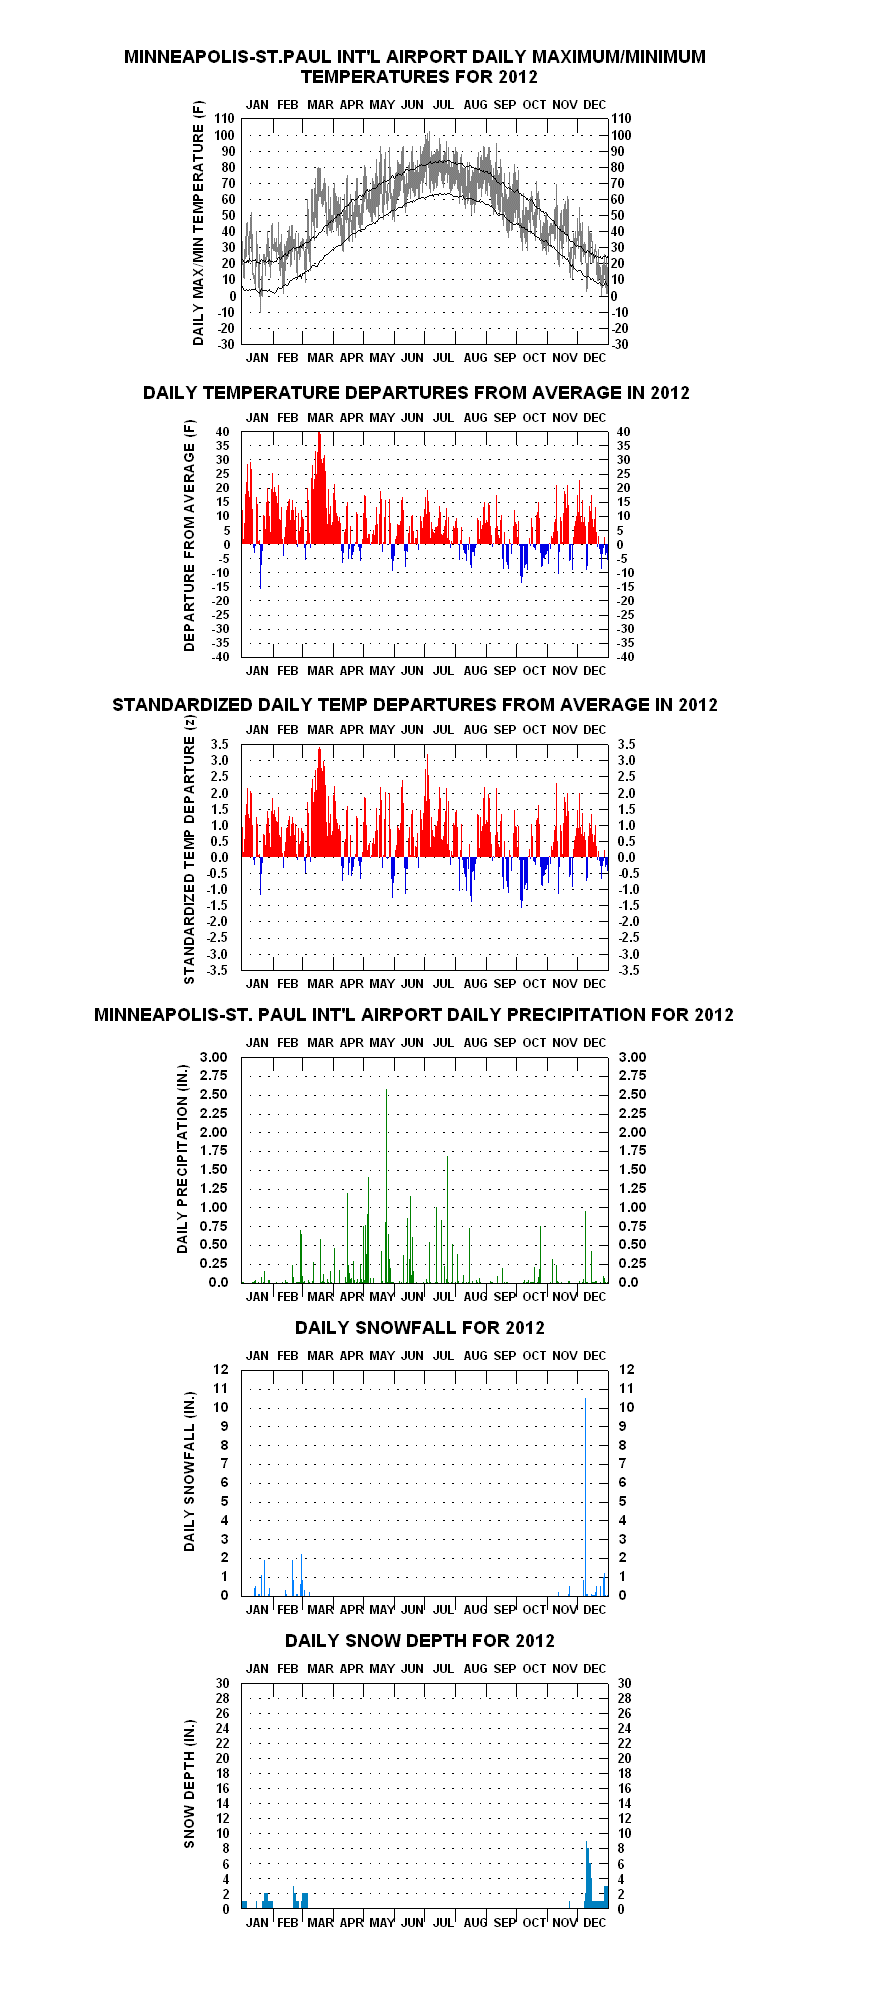
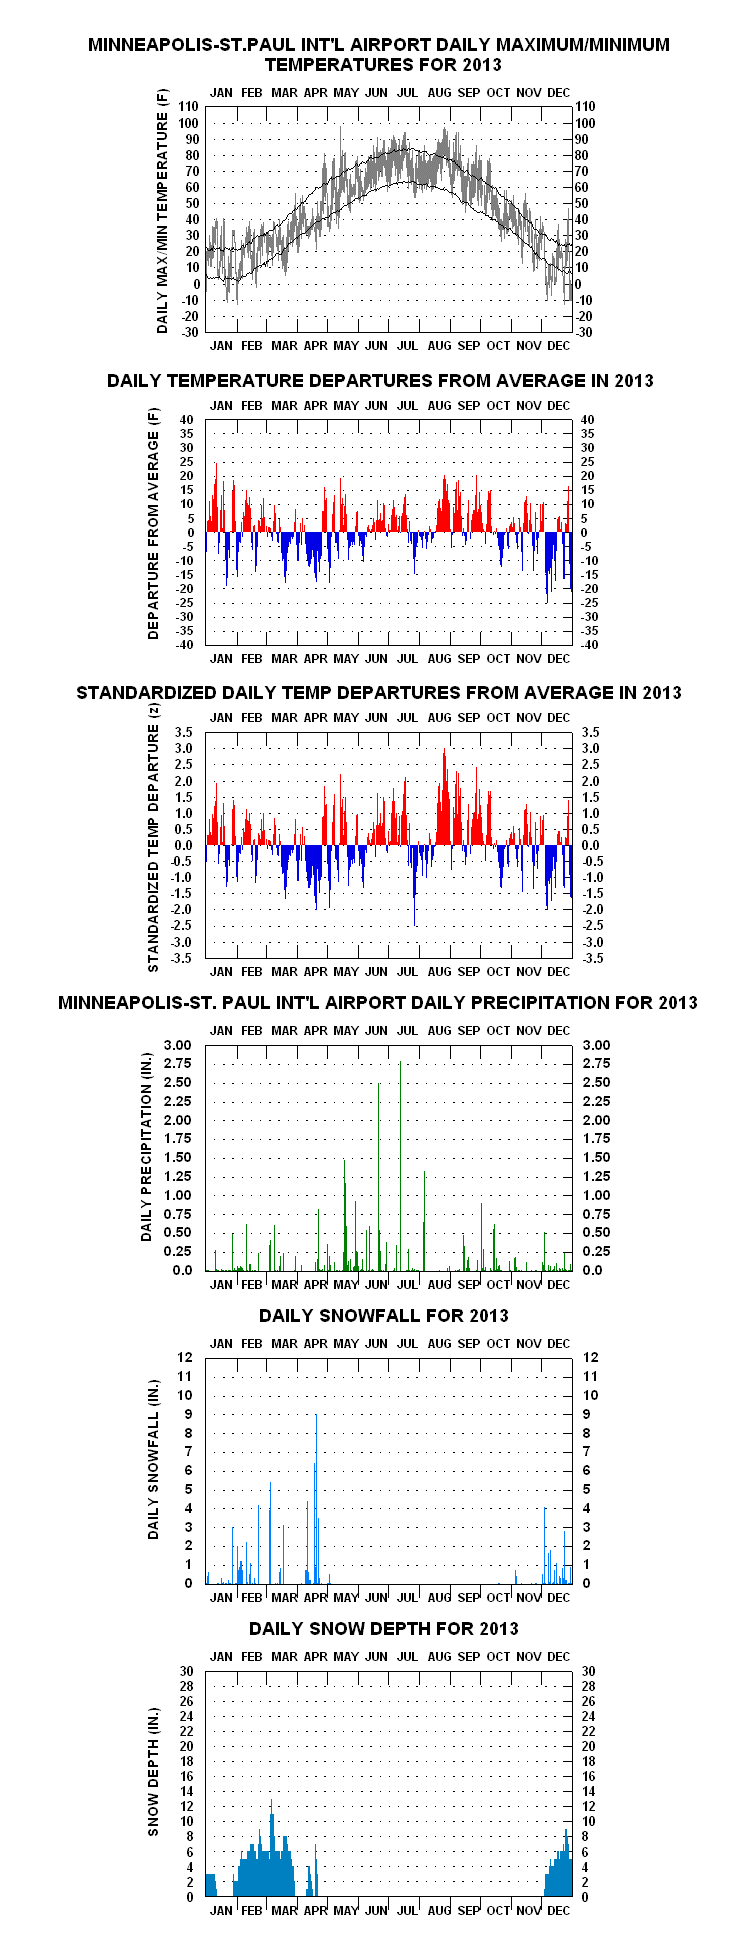
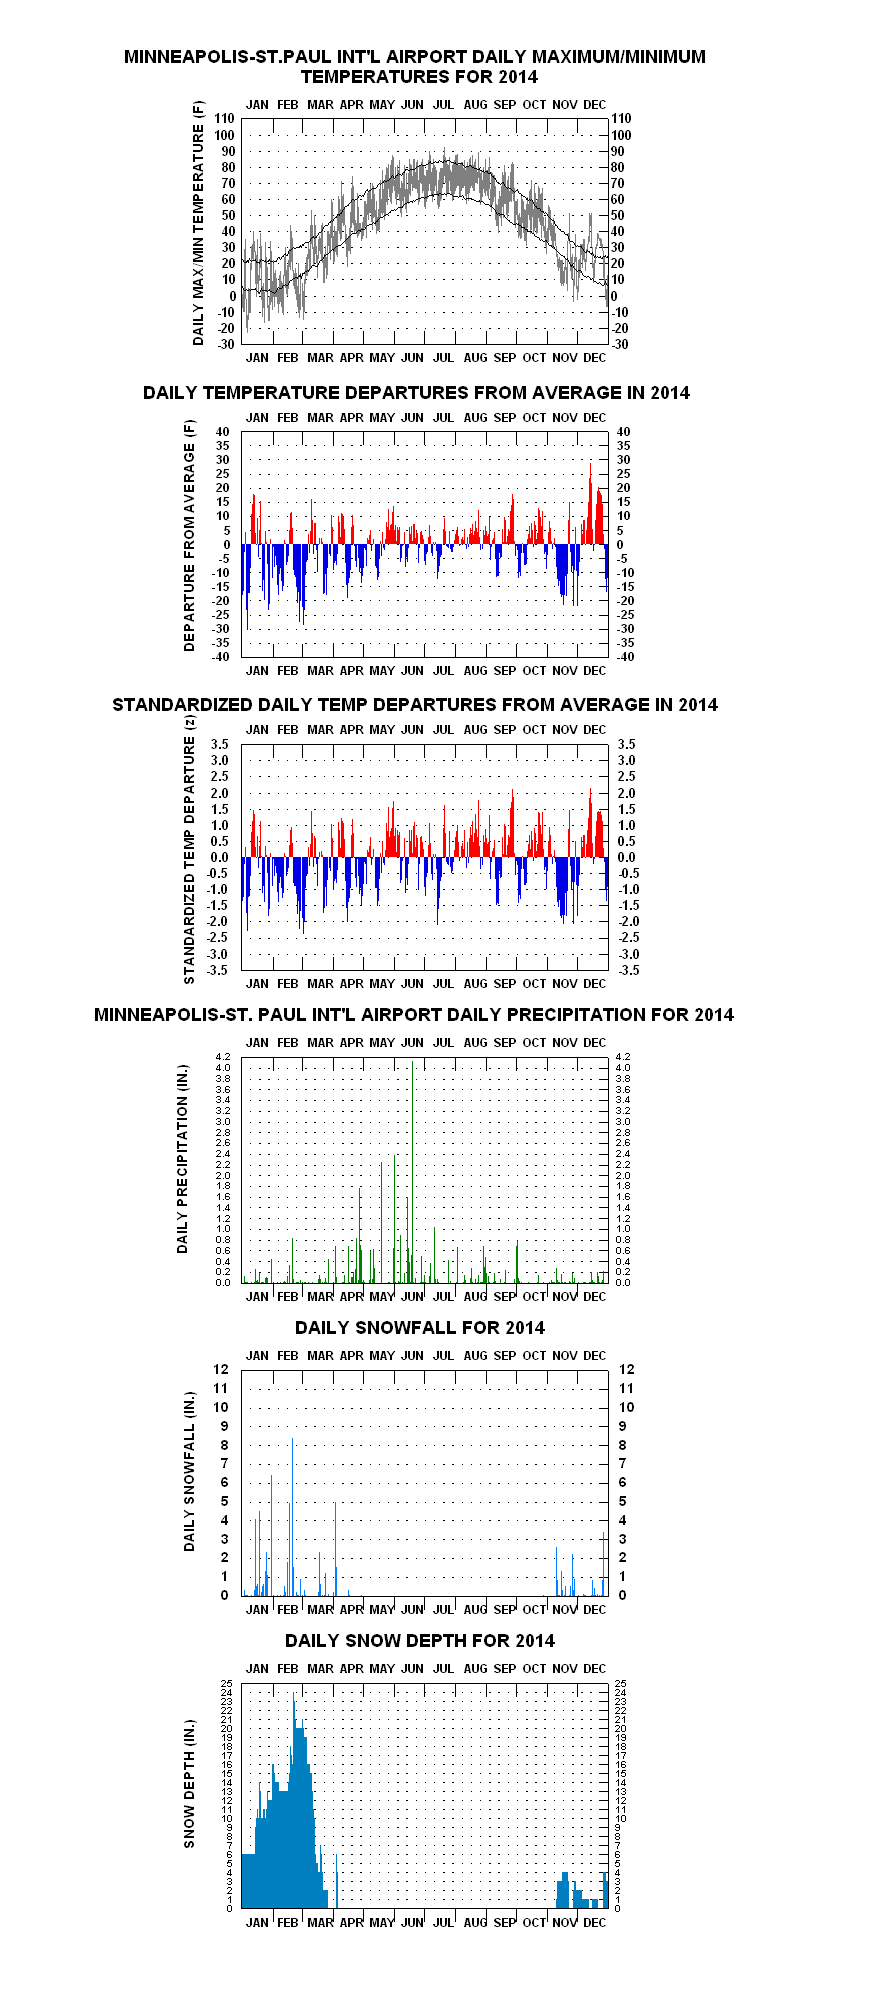
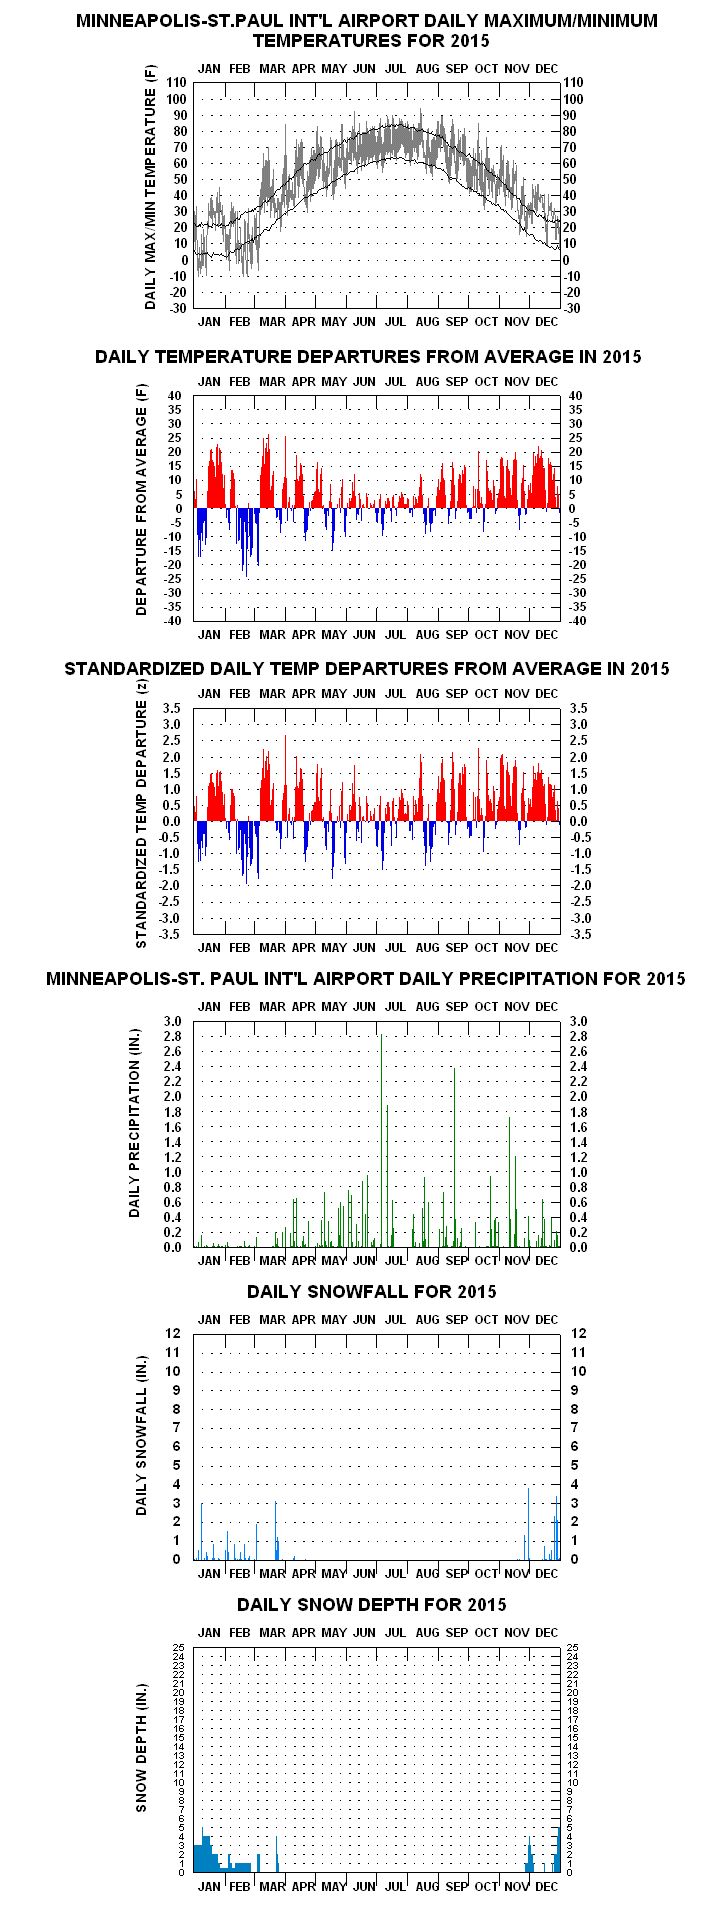
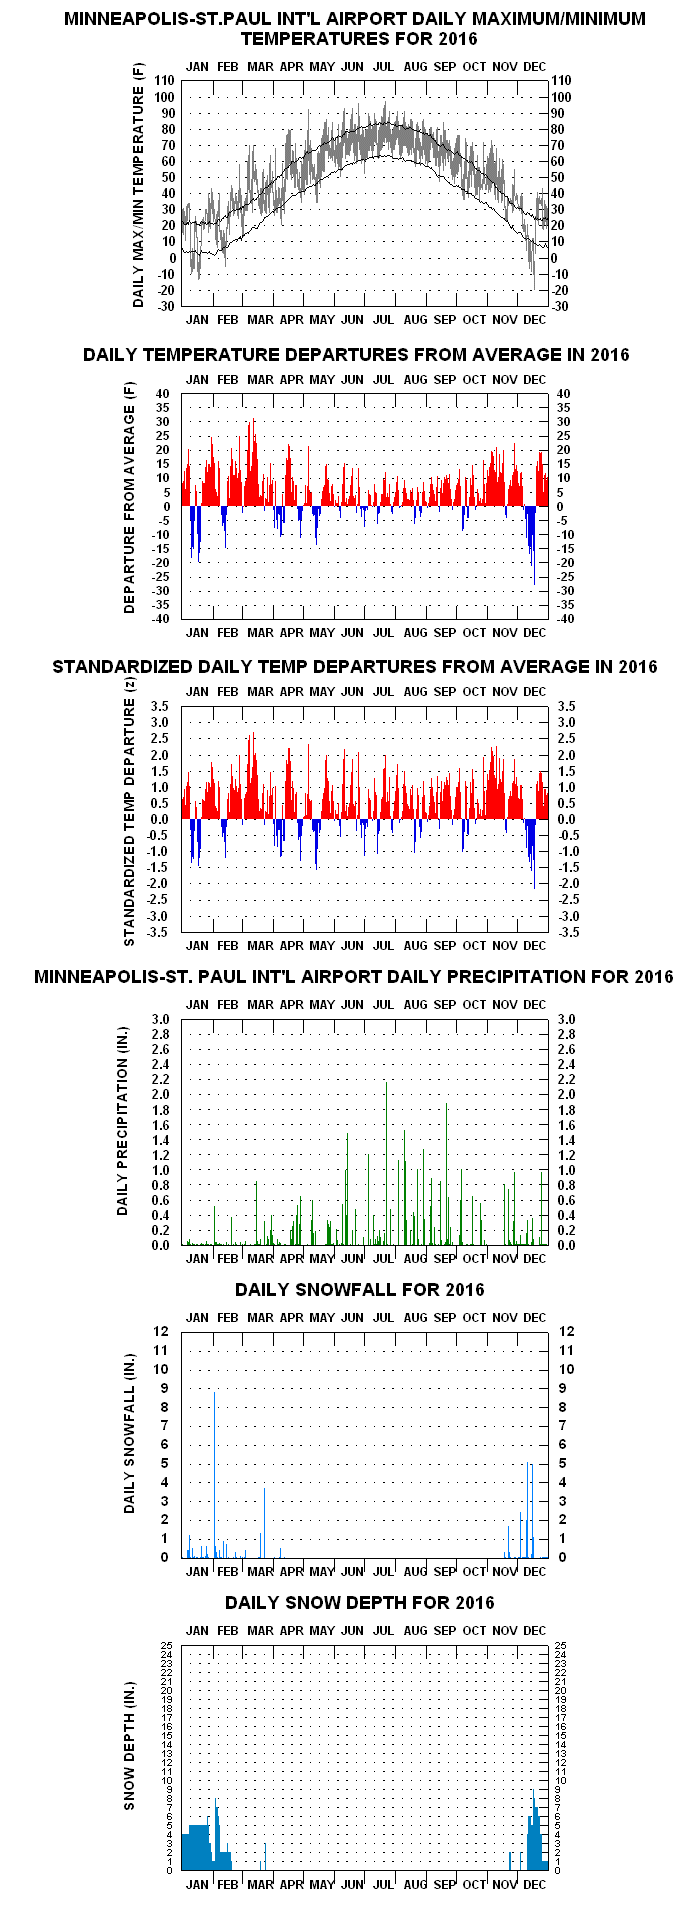
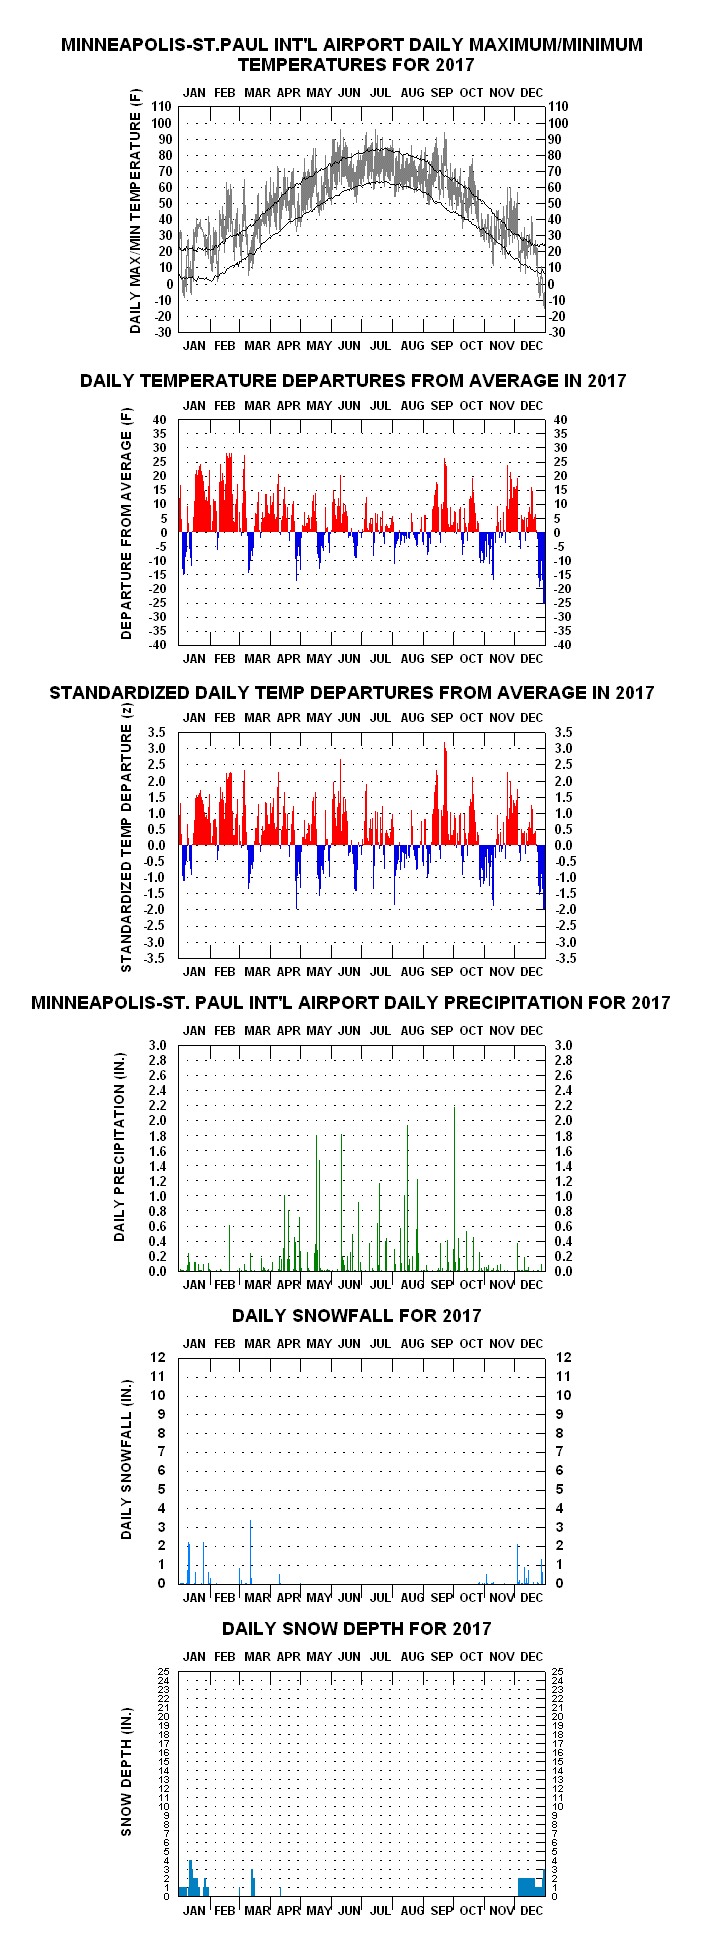
The third chart down shows chart two’s departures in deseasonalized or “standardized” form. This adjusts for the fact that individual calendar days have higher or lower inherent year-to-year variability (standard deviations) in daily mean temperature. Dividing a given day’s departure from average by its’ respective calendar day mean temperature standard deviation creates the “relative” departures or “z-scores”. Only five daily departures in the entire series are plus or minus 3.5 or greater. Three of these, all negatives, came over the four-day period 4-7 November 1991, associated with an unseasonably cold arctic air outbreak in the wake of the Great 1991 Halloween snowstorm. The fourth chart down depicts daily rainfall, the fifth and sixth charts, respectively, daily snowfall and snow depths.
Links To Some Of The More Interesting Year-To-Year Graphs, With Accompanying Notes
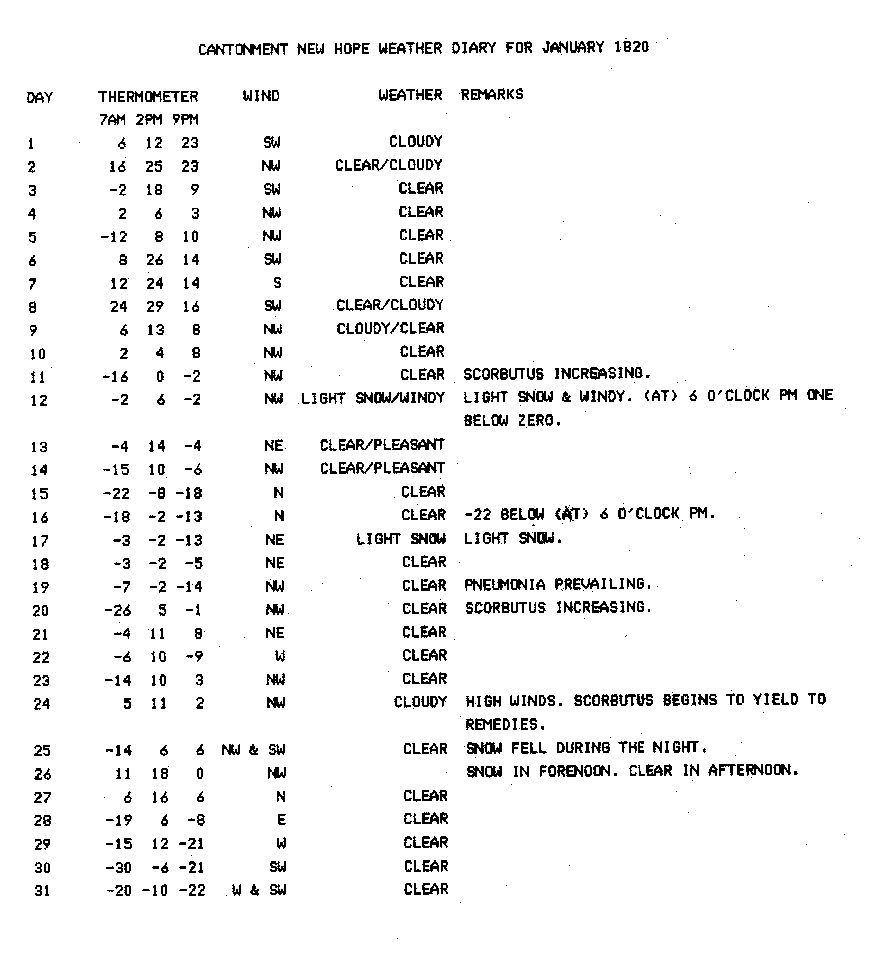
- 1820Year One. Frigid January WEATHER DIARY FOR JAN 1820 , very mild April, eleven-inch snowstorm in mid-October. 1820 Writeup .
- WEATHER DIARY FOR JAN 18201820 – Year One. Frigid January WEATHER DIARY FOR JAN 1820 , very mild April, eleven-inch snowstorm in mid-October. 1820 Writeup .
- 1820 Writeup1820 – Year One. Frigid January WEATHER DIARY FOR JAN 1820 , very mild April, eleven-inch snowstorm in mid-October. 1820 Writeup .
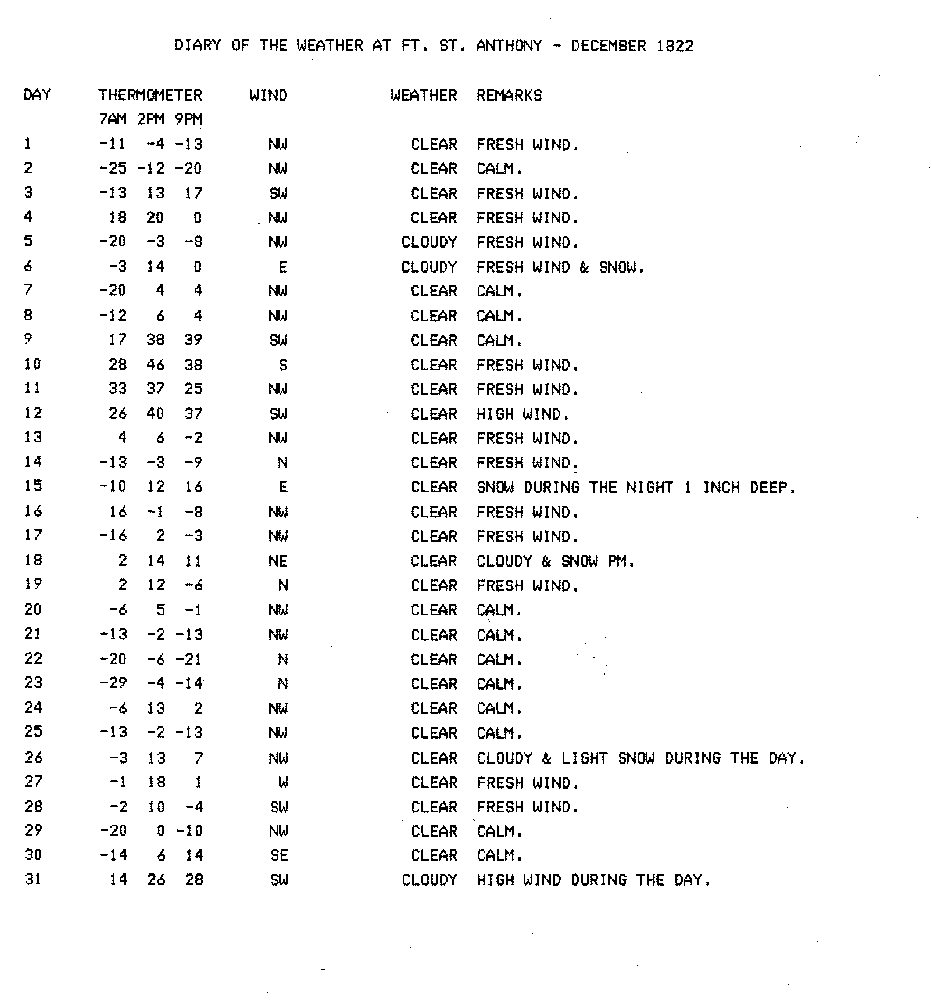
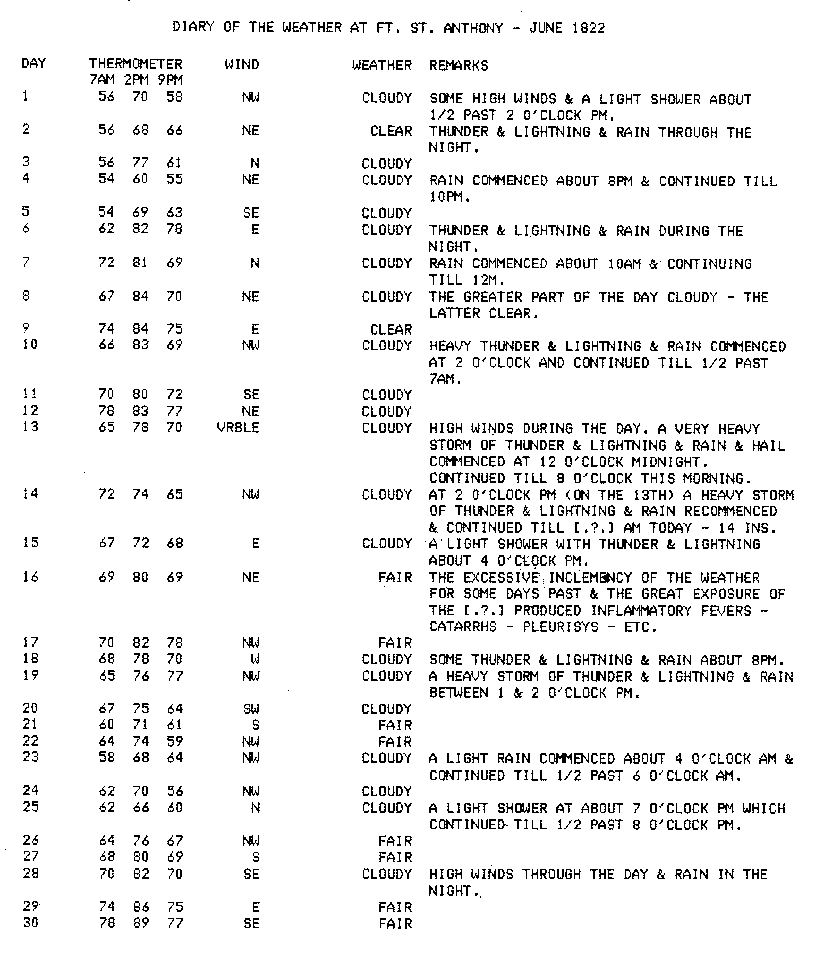
- 1822Coldest December in history DEC 1822 ; December 2nd 42 F below average. Also torrential June rains, producing local flooding JUN 1822 . 1822 Writeup
- DEC 18221822 – Coldest December in history DEC 1822 ; December 2nd 42 F below average. Also torrential June rains, producing local flooding JUN 1822 . 1822 Writeup
- JUN 18221822 – Coldest December in history DEC 1822 ; December 2nd 42 F below average. Also torrential June rains, producing local flooding JUN 1822 . 1822 Writeup
- 1822 Writeup1822 – Coldest December in history DEC 1822 ; December 2nd 42 F below average. Also torrential June rains, producing local flooding JUN 1822 . 1822 Writeup
- 1824-1825(July-June view). Exceptionally mild December ‘24 to April ’25 period; likely El Nino influence. 1825 Writeup
- 1825 Writeup1824-1825 – (July-June view). Exceptionally mild December ‘24 to April ’25 period; likely El Nino influence. 1825 Writeup
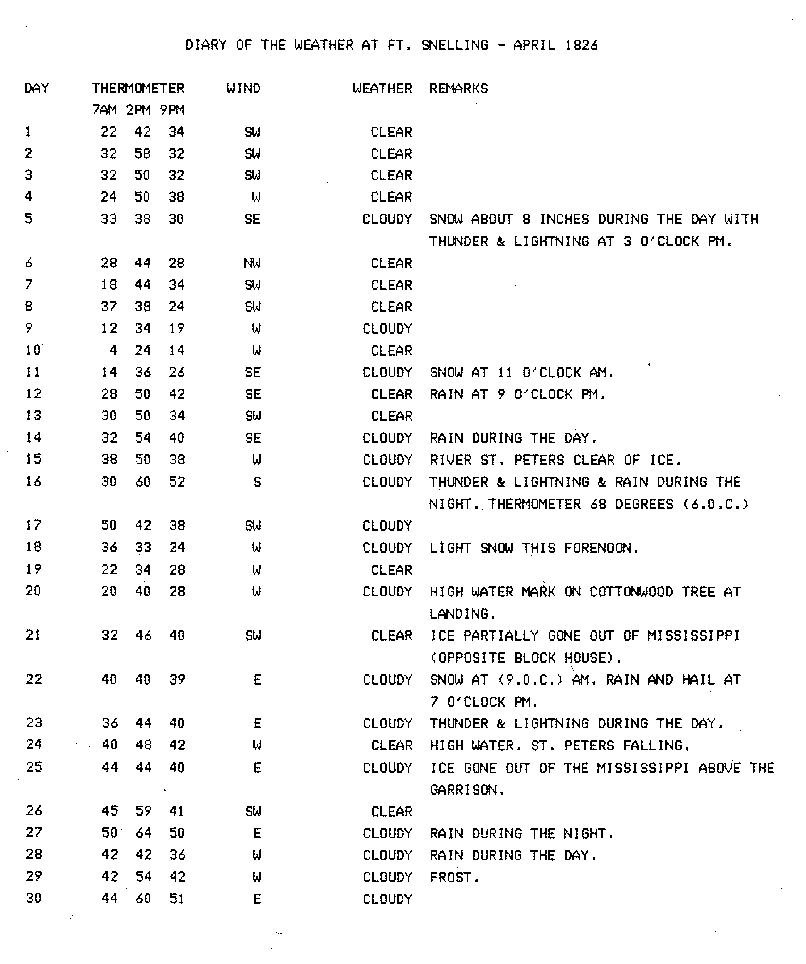
- 1826Very backward April APR 1826 (accompanied by severe flooding), but May 28 F warmer than April. 1826 Writeup
- APR 18261826 – Very backward April APR 1826 (accompanied by severe flooding), but May 28 F warmer than April. 1826 Writeup
- 1826 Writeup1826 – Very backward April APR 1826 (accompanied by severe flooding), but May 28 F warmer than April. 1826 Writeup
- 1829“The Dry Year”, as described by early Minnesota history texts. Severely cold February and other extreme temperature spells throughout year. 1829 Writeup
- 1829 Writeup1829 – “The Dry Year”, as described by early Minnesota history texts. Severely cold February and other extreme temperature spells throughout year. 1829 Writeup
- 1830Hottest July until 1936 , and much above normal October/November. 1830 Writeup
- 19361830 – Hottest July until 1936 , and much above normal October/November. 1830 Writeup
- 1830 Writeup1830 – Hottest July until 1936 , and much above normal October/November. 1830 Writeup
- 1833El Nino winter of ‘32-’33 mildest for another 45 years. Very mild December ’33 also. 1833 Writeup
- 1833 Writeup1833 – El Nino winter of ‘32-’33 mildest for another 45 years. Very mild December ’33 also. 1833 Writeup
- 1833-34(July-June view). Greatest three-month thermal “see-saw” in history: January 1834 29 F colder than December 1833, February 1834 28 F warmer than January. 1834 Writeup
- 1834 Writeup1833-34 – (July-June view). Greatest three-month thermal “see-saw” in history: January 1834 29 F colder than December 1833, February 1834 28 F warmer than January. 1834 Writeup
- 1835Volcanic dust-veil produces series of anomalous cold spells during second half. 1835 Writeup
- 1835 Writeup1835 – Volcanic dust-veil produces series of anomalous cold spells during second half. 1835 Writeup
- 1838Great temperature extremes. Minus 40 F in February and a late May hard freeze. Hot summer, but unseasonable cold in fall and early winter. 1838 Writeup
- 1838 Writeup1838 – Great temperature extremes. Minus 40 F in February and a late May hard freeze. Hot summer, but unseasonable cold in fall and early winter. 1838 Writeup
- 1838-39(July-June view). Abnormal cold over October to December ’38 gives way to abnormal warmth over January to April ‘39.
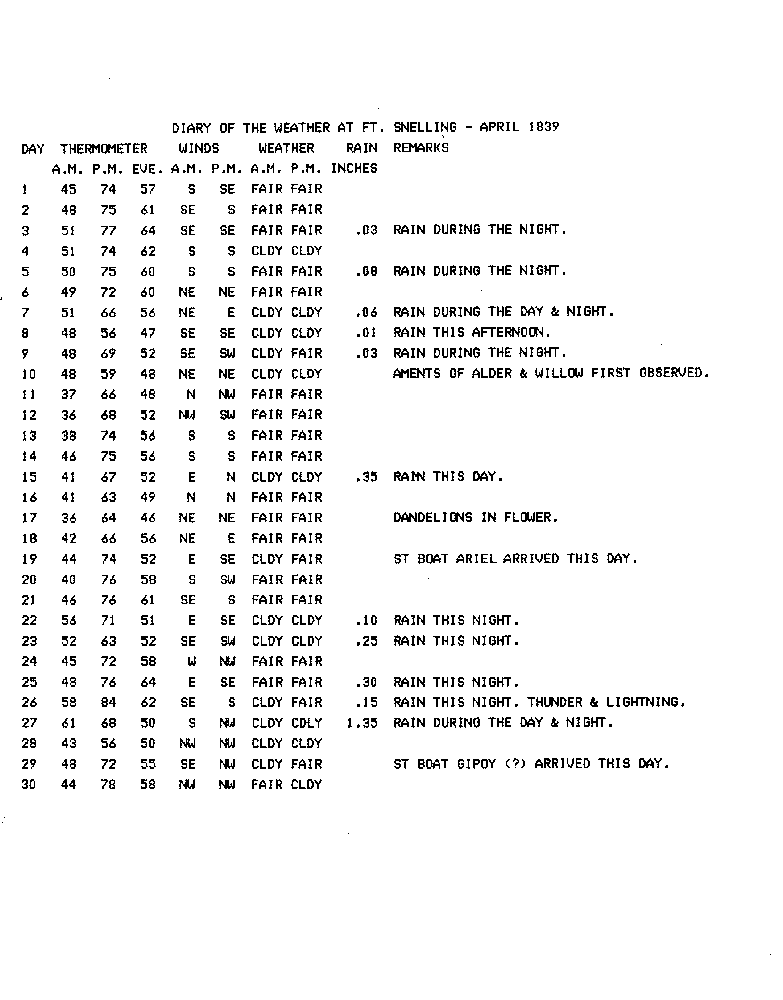
- 1839Warmest recorded year up to this time; warmest April APR 1839 down to the present day. 1839 Writeup
- APR 18391839 – Warmest recorded year up to this time; warmest April APR 1839 down to the present day. 1839 Writeup
- 1839 Writeup1839 – Warmest recorded year up to this time; warmest April APR 1839 down to the present day. 1839 Writeup
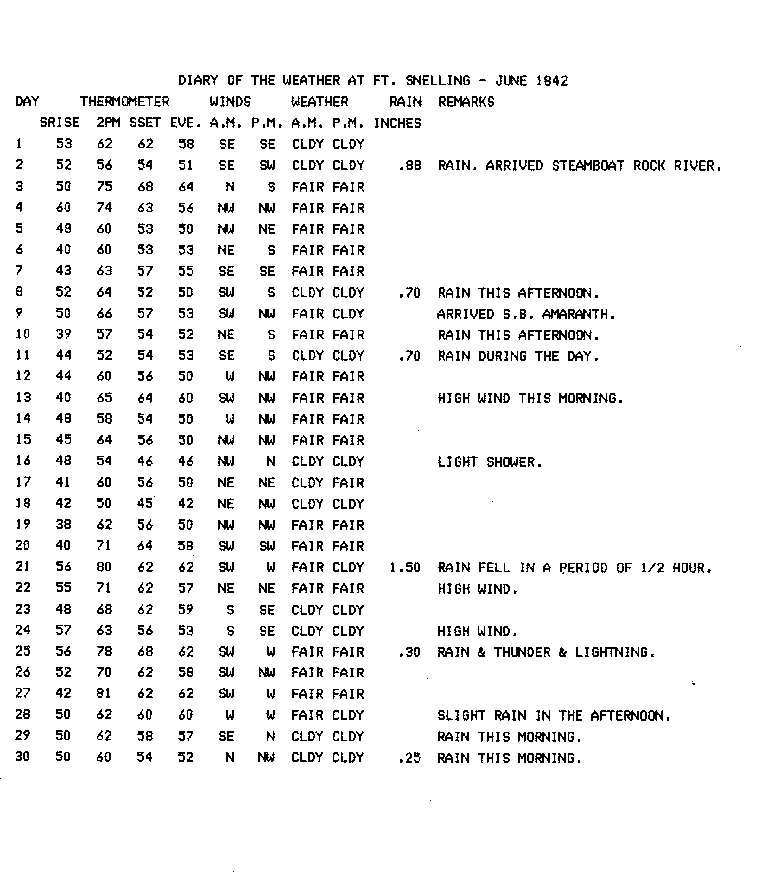
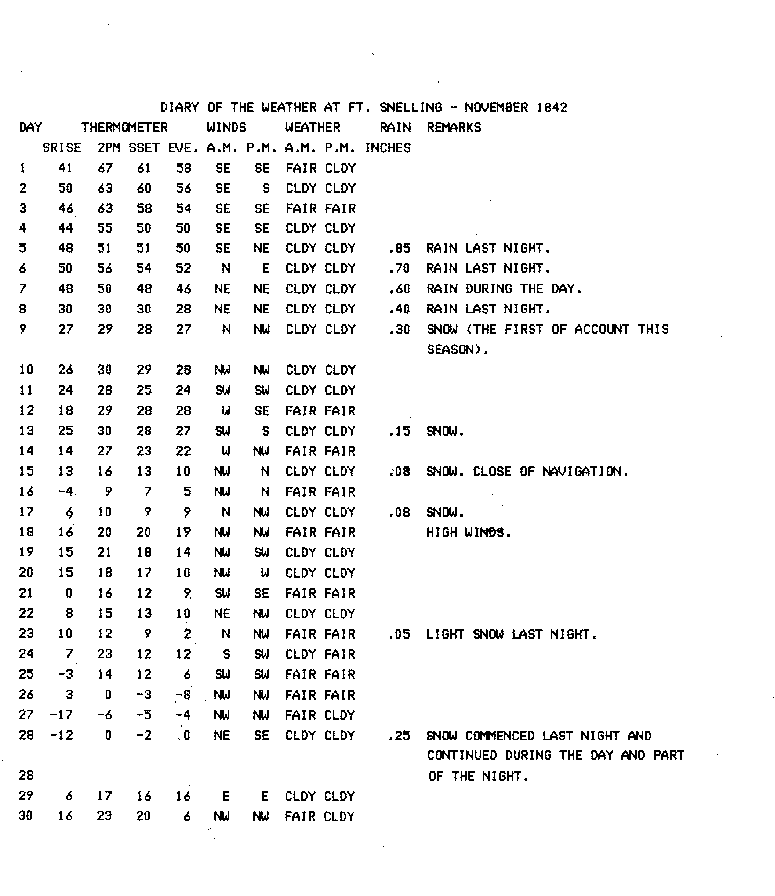
- 1842Extraordinary coolness over mid-May into July. Coldest June JUN 1842 and coldest November NOV 1842 in all history down to present. 1842 Writeup
- JUN 18421842 – Extraordinary coolness over mid-May into July. Coldest June JUN 1842 and coldest November NOV 1842 in all history down to present. 1842 Writeup
- NOV 18421842 – Extraordinary coolness over mid-May into July. Coldest June JUN 1842 and coldest November NOV 1842 in all history down to present. 1842 Writeup
- 1842 Writeup1842 – Extraordinary coolness over mid-May into July. Coldest June JUN 1842 and coldest November NOV 1842 in all history down to present. 1842 Writeup
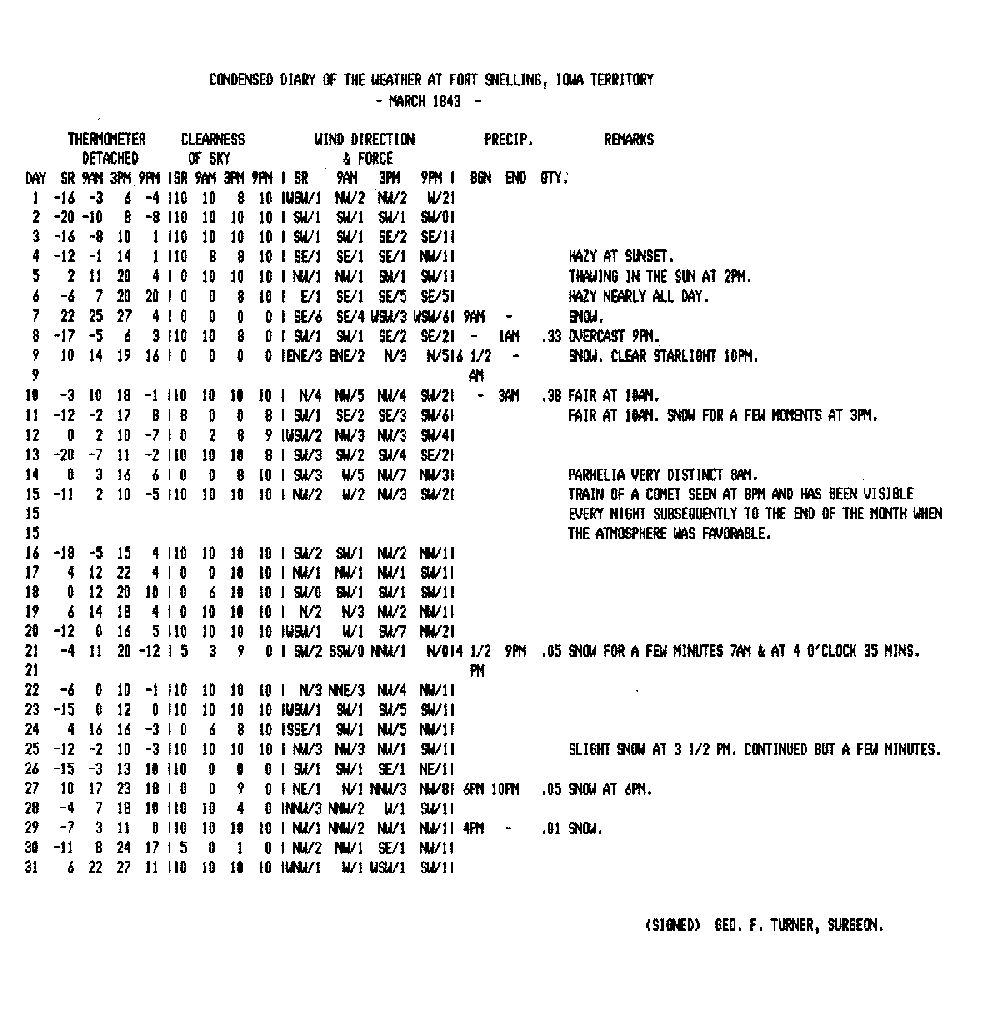
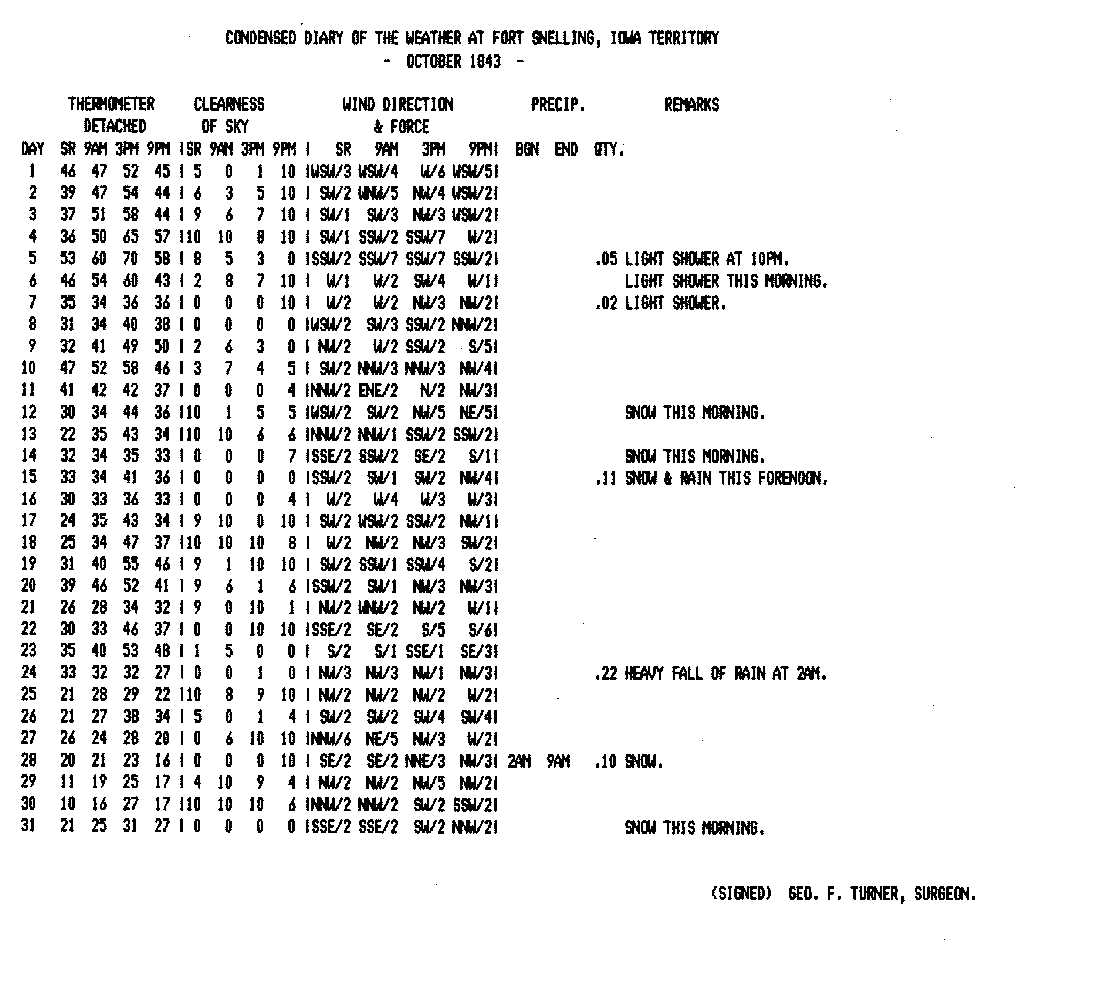
- 1843Coldest year in area history. Extraordinary persistent arctic cold over February and March. Coldest March (more than 25 F below average) MAR 1843 , and coldest October OCT 1843 in all history down to present. 1843 Writeup
- MAR 18431843 – Coldest year in area history. Extraordinary persistent arctic cold over February and March. Coldest March (more than 25 F below average) MAR 1843 , and coldest October OCT 1843 in all history down to present. 1843 Writeup
- OCT 18431843 – Coldest year in area history. Extraordinary persistent arctic cold over February and March. Coldest March (more than 25 F below average) MAR 1843 , and coldest October OCT 1843 in all history down to present. 1843 Writeup
- 1843 Writeup1843 – Coldest year in area history. Extraordinary persistent arctic cold over February and March. Coldest March (more than 25 F below average) MAR 1843 , and coldest October OCT 1843 in all history down to present. 1843 Writeup
- 1842-43(July-June view).
- 1845Steep temperature plunge over mid-to-late November. 1845 Writeup
- 1845 Writeup1845 – Steep temperature plunge over mid-to-late November. 1845 Writeup
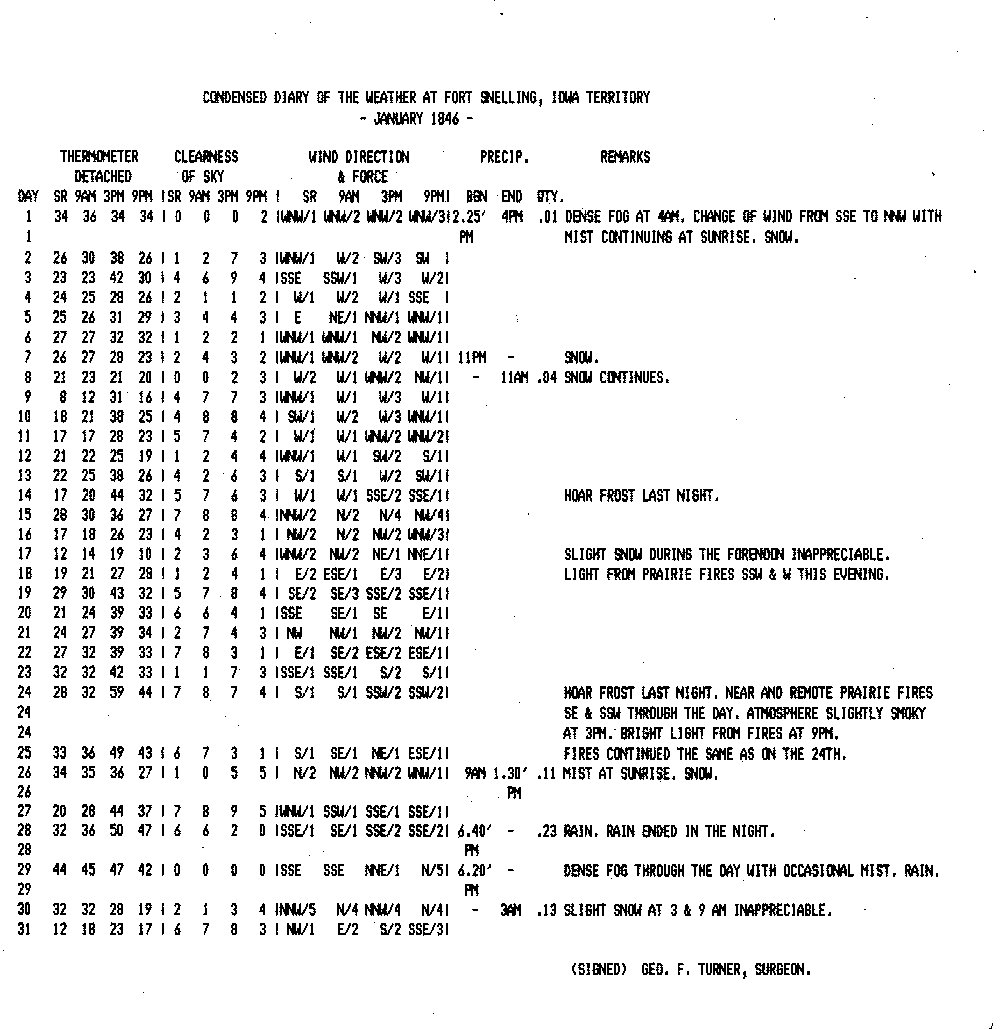
- 1846Warmest year of pre-statehood era. Mildest January in all history down to the present JAN 1846 . 1846 Writeup
- JAN 18461846 – Warmest year of pre-statehood era. Mildest January in all history down to the present JAN 1846 . 1846 Writeup
- 1846 Writeup1846 – Warmest year of pre-statehood era. Mildest January in all history down to the present JAN 1846 . 1846 Writeup
- 1849December 34 F colder than November. 1849 Writeup
- 1849 Writeup1849 – December 34 F colder than November. 1849 Writeup
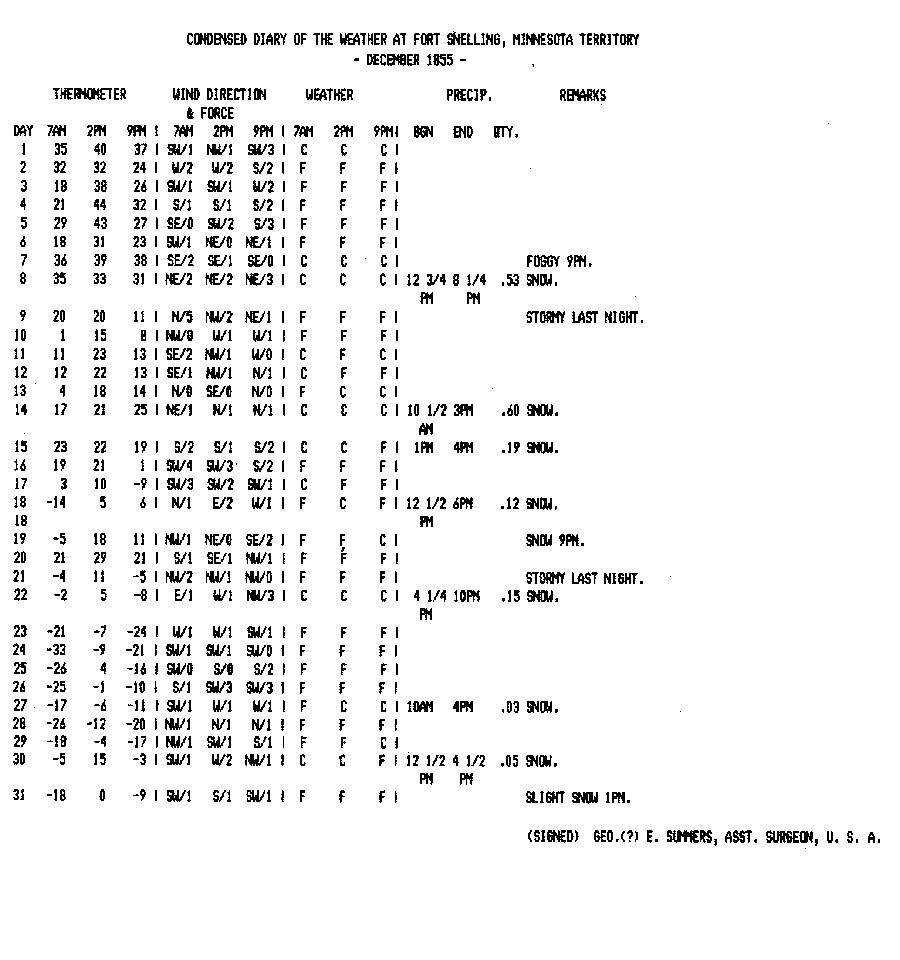
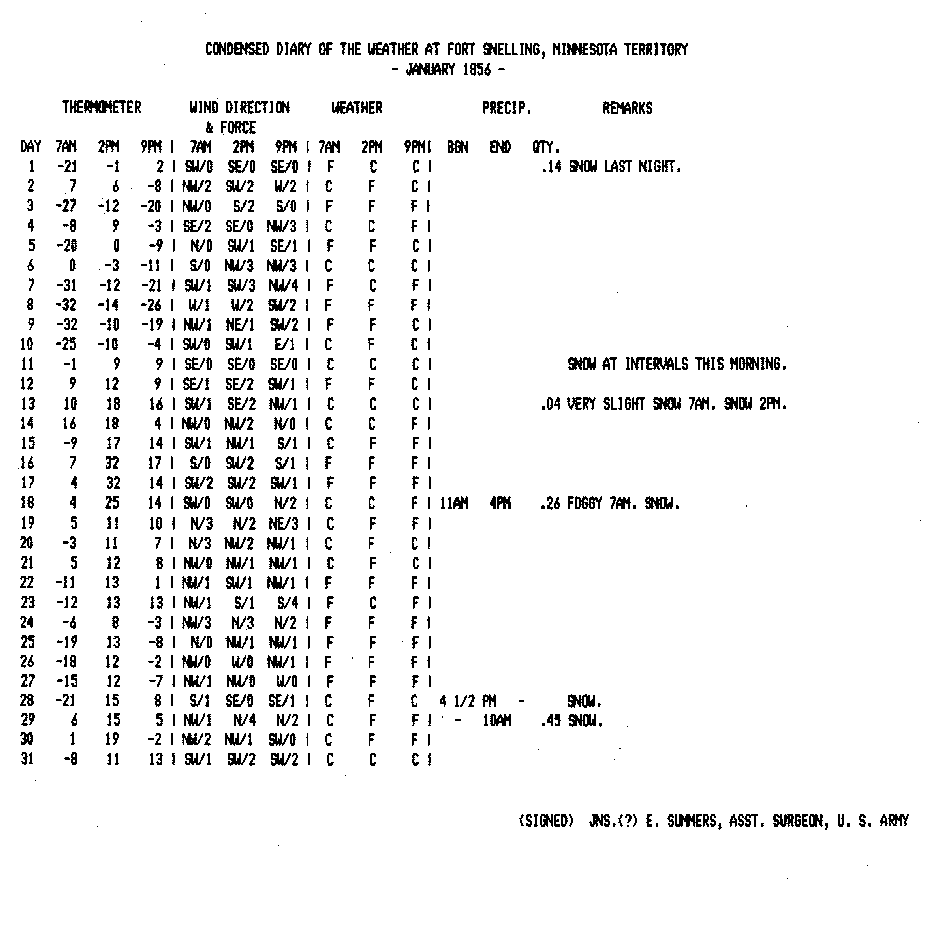
- 1855-56Two successive arctic blasts, in late December DEC 1855 and early January JAN 1856 . A third in February. 1856 Writeup
- DEC 18551855-56 – Two successive arctic blasts, in late December DEC 1855 and early January JAN 1856 . A third in February. 1856 Writeup
- JAN 18561855-56 – Two successive arctic blasts, in late December DEC 1855 and early January JAN 1856 . A third in February. 1856 Writeup
- 1856 Writeup1855-56 – Two successive arctic blasts, in late December DEC 1855 and early January JAN 1856 . A third in February. 1856 Writeup
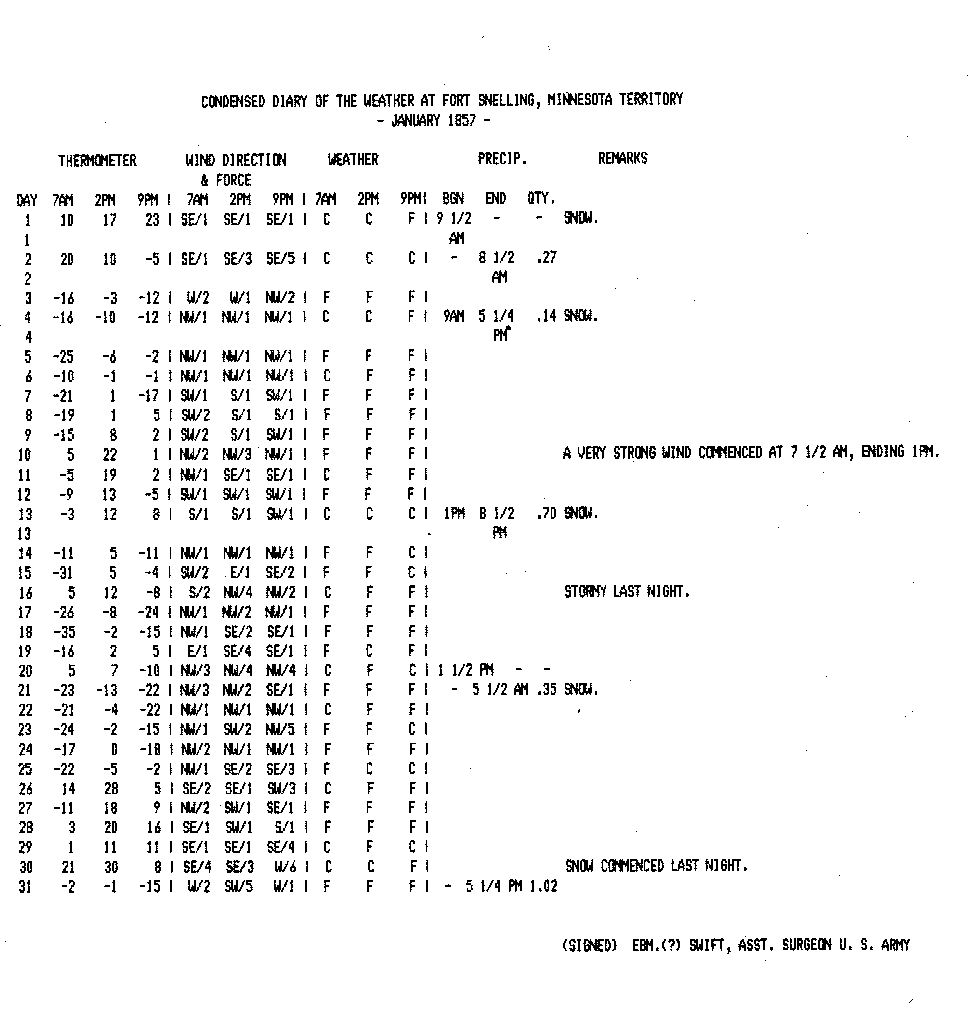
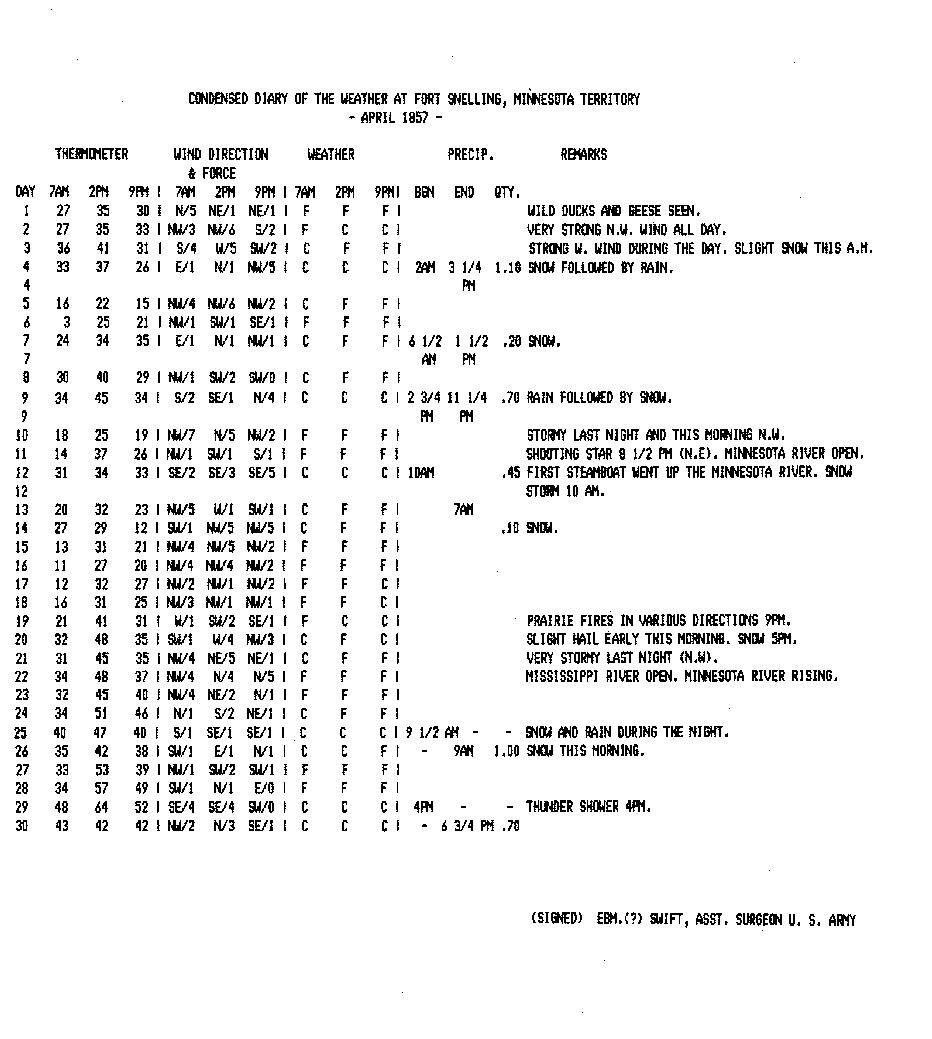
- 1857Second successive bitter winter. Coldest January JAN 1857 and April APR 1857 in history. 1857 Writeup
- JAN 18571857 – Second successive bitter winter. Coldest January JAN 1857 and April APR 1857 in history. 1857 Writeup
- APR 18571857 – Second successive bitter winter. Coldest January JAN 1857 and April APR 1857 in history. 1857 Writeup
- 1857 Writeup1857 – Second successive bitter winter. Coldest January JAN 1857 and April APR 1857 in history. 1857 Writeup
- 1863The “Strange” weather year. Extremes in temperatures, and worst growing season drought to date – no measurable rain in June (St. Paul). Killing frosts in July and August across settled areas. 1863 Writeup
- 1863 Writeup1863 – The “Strange” weather year. Extremes in temperatures, and worst growing season drought to date – no measurable rain in June (St. Paul). Killing frosts in July and August across settled areas. 1863 Writeup
- 1864 NewContinued drought during the year. Frigid New Years’ Day – Maximum: -24 F, Minimum: –38 F in St. Paul. 1864 Writeup
- 1864 Writeup New1864 – Continued drought during the year. Frigid New Years’ Day – Maximum: -24 F, Minimum: –38 F in St. Paul. 1864 Writeup
- 1865Heavy summer rains break drought; 38” recorded for year in St. Paul, more than ’63 and ’64 combined. Very cool summer, July 1 F cooler than September. 1865 Writeup
- 1865 Writeup1865 – Heavy summer rains break drought; 38” recorded for year in St. Paul, more than ’63 and ’64 combined. Very cool summer, July 1 F cooler than September. 1865 Writeup
- 1867Very backward spring. March 1867 5 F colder than any March since, but still 8 F milder than 1843. More than 10” rain in June in St. Paul. 1867 Writeup
- 1867 Writeup1867 – Very backward spring. March 1867 5 F colder than any March since, but still 8 F milder than 1843. More than 10” rain in June in St. Paul. 1867 Writeup
- 1869More than 18” rain over August and September. 1869 Writeup
- 1869 Writeup1869 – More than 18” rain over August and September. 1869 Writeup
- 1875Second coldest year in history. January and February both AVERAGE below zero.
- 1877-78“Year Without a Winter”. El Nino-induced extraordinarily mild winter. Mildest December in history. Warmest February until 1931 and warmest March until 1910.
- 1879“Second Edition of Summer” brings unseasonable October warmth. Very cold Christmas Day, minus 39 recorded in St. Paul.
- 1885Great temperature variability over January to March.
- 1888Severe winter (including –41 F in January). Persistent spells of unseasonable coolness into spring and summer.
- 1895Abrupt May cold turn temporarily derails an otherwise forward Spring.
- 1899Great February cold wave.
- 1907Persistent abnormal cold through April and May; 13” snowstorm over Apr 27-28.
- 1910Driest year (11.54”) in local climatic history down to present. Also warmest March in history until 2012.
- 1911Great adjacent-year reversal in annual precipitation – Wettest year (40.15”) in all history down to present.
- 1915Very forward April, but May 4 F colder; very cool summer ensues.
- 1917Coldest year of 20th Century. Deep Snows – 31” depth on 16 March.
- 1921Warmest year since 1878.
- 1923Very cold March, very mild November-December.
- 1930Sharp temperature gyrations over latter part of year.
- 1931Warmest year in history down to the present; 104 F recorded in September.
- 1933Warmest June in history. 77 F on 1 November
- 1934In midst of Dust Bowl era. Warmest May in history, including 106 F on the 31st. June has a 104 F day, three days in July reach 105 F.
- 1936Great temperature contrasts between winter and summer. Thirty-six consecutive days with subzero minima over January and February (including –34 F in January). Hottest July on record; 108 F recorded on 14th for highest in history. Also recorded in July: 106 F three times, 105 F and 104 F once day each.
- 1940Great Armistice-Day Blizzard leaves nearly 17 inches’ snow over 11th-12th.
- 1942Very irregular temperature anomaly pattern over course of year.
- 1945Very forward early spring, then very cool through early summer.
- 1947Warmest August AND October in all history down to the present.
- 1948March temperature range –27 F to 70 F (97 F spread highest ever for a single calendar month locally).
- 195140” snowfall in March.
- 1953-54Quasi-periodic much above normal spells over late-August through February. February ‘54 warmest since 1878.
- 1958Driest year (16.20”) since 1910.
- 1959December 5 F warmer than November.
- 1962Deep snows in late February and early March; minus 32 F on 1 March.
- 1965Coldest March since 1899; coldest September since 1868.
- 196735.3” snowfall in January; 30” snow depth on 19 February.
- 1972Coldest year since 1917.
- 1976-77Twentieth century approximate version of 1838-39. Abnormally cold October-January, unusually warm February-May.
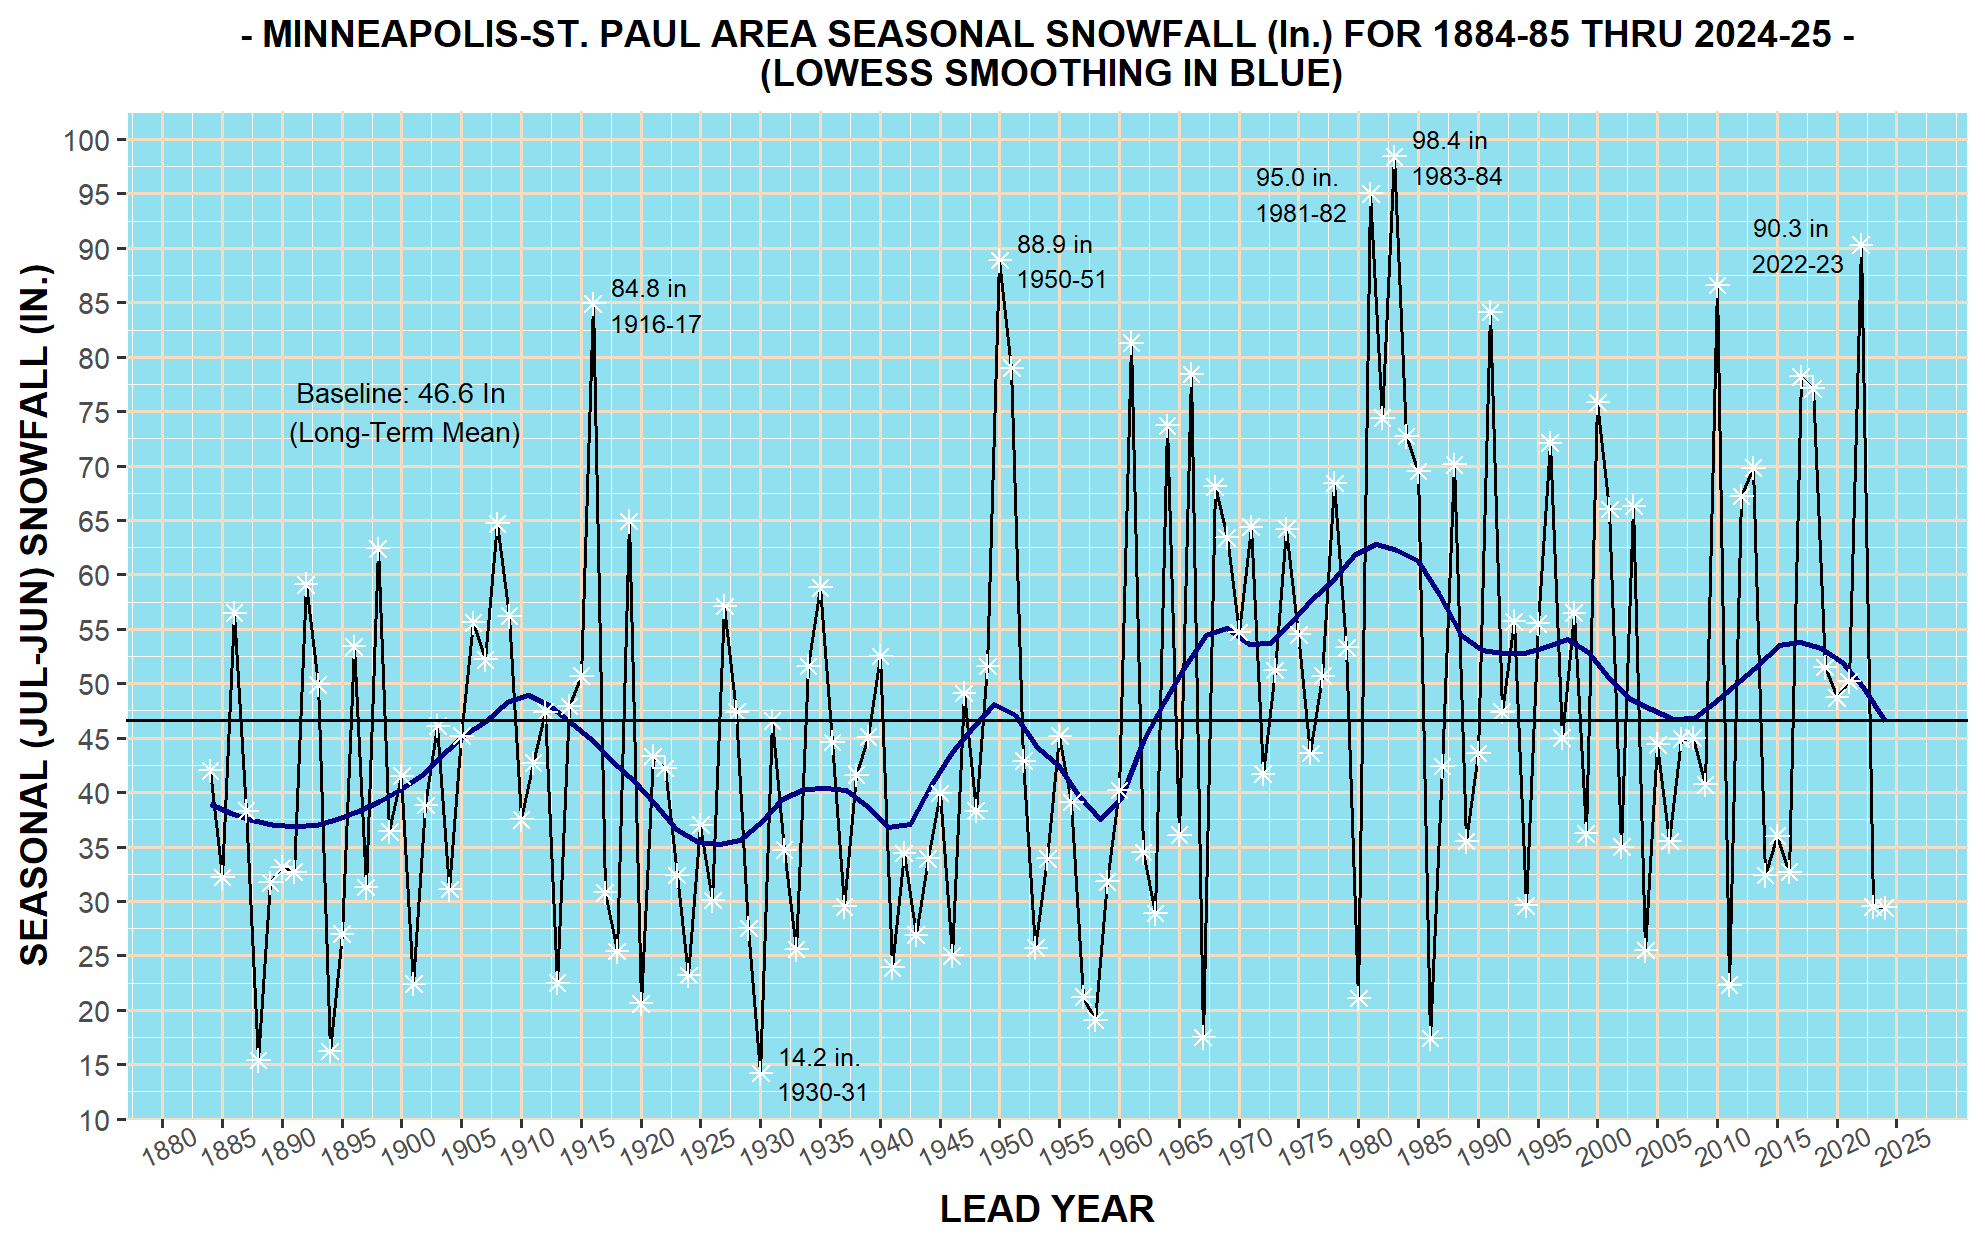
- 1982 New46.4” snowfall in January, 38” snow depth on 23 January. 1981-82 season sets new snowfall record (95.0”) – only to last two seasons, however.
- 1983 NewGreat El Nino year. Wettest year (39.07”) since 1911. Very mild January to early March, a warm summer, but coldest December since 1831. 21.8” snowfall in April – a new high mark for that month.
- 1983-84Snowiest winter in official recorded history (98.4”).
- 1985Unusually mild March and April, cold November-December.
- 1987Second warmest year in history. Steady above average warmth throughout virtually the whole year. July wettest calendar month in local history (17.90”).
- 1988Drought year. Very hot summer, 105 F in July.
- 1991Great early snowstorm drops 27” over 31 Oct and 1 Nov followed by unseasonably early arctic outbreak; 46.9” total snowfall for November, snowiest calendar month in recorded history.
- 1992Very mild winter. Very cool summer (possibly induced by Mt. Pinatubo eruption); Coolest July since 1865.
- 1996Great arctic outbreak in late-January/early February.
- 1997-98El Nino-induced, very mild ‘97-‘98 winter.
- 2000Very mild March, very cold December.
- 2001Wettest April on record (7.00”). Warmest November in history by more than 4 F. Fifty-seven consecutive above normal temperature days from late October to late December.
- 2001-02Mildest November-February period in all history by nearly 2 F.
- 2006Third warmest year in all history. Warmest January since 1846; warmest July since 1936.
- 2010Warmest August since 1947 and second warmest in history.
- 2012Warmest March in history by more than 3 F.
*Member, American Meteorological Society
Data Collection 09Analytics
Sample Regimes, PCA Modes, PDFs & Extremes+
Temperature+
Regimes+
Sample analysis: group years by recurring temperature patterns for Minneapolis–St. Paul, then compare transitions between common, unusual and persistent regimes. This is sample Analytics content for layout and workflow testing. Replace it with the station’s verified analysis when the final material is ready.
Extremes+
Sample analysis: review the upper and lower tails of the cold and heat record for Minneapolis–St. Paul and identify years that merit detailed chart interpretation. This is sample Analytics content for layout and workflow testing. Replace it with the station’s verified analysis when the final material is ready.
Snow+
PCA Modes+
Sample analysis: demonstrate how leading modes can separate broad snow-season variability variability from shorter-lived anomalies at Minneapolis–St. Paul. This is sample Analytics content for layout and workflow testing. Replace it with the station’s verified analysis when the final material is ready.
Extremes+
Sample analysis: review the upper and lower tails of the snowfall record for Minneapolis–St. Paul and identify years that merit detailed chart interpretation. This is sample Analytics content for layout and workflow testing. Replace it with the station’s verified analysis when the final material is ready.
Continue Exploring
Compare Climate History Across Every Station
Browse domestic and international climate archives, long-term trends and original statistical visualizations.