
Station Overview
Graphical Climatology of Chicago Temperatures, Precipitation, and Snowfall (1871-Present)
The following is a graphical climatology of Chicago, Illinois temperatures, precipitation, and snowfall, from the 1870’s at the earliest (temperature and precipitation) into 2026. The graphics consist of summary overview charts followed by year-to-year graphs that depict daily temperature, precipitation, and snowfall. The daily precipitation observations date from the start of 1871, temperatures from 10 June 1872, snowfall from the 1885-6 season, and snow depth from the beginning of 1901.
Data were obtained courtesy of the Chicago National Weather Service Office, the National Climatic Data Center, and the Chicago National Weather Service Office’s on-line site: http://www.weather.gov/climate/index.php?wfo=lot
- http://www.weather.gov/climate/index.php?wfo=lotData were obtained courtesy of the Chicago National Weather Service Office, the National Climatic Data Center, and the Chicago National Weather Service Office’s on-line site: http://www.weather.gov/climate/index.php?wfo=lot
“Official” observations from 1871 through June 1905 were taken at a number of sites in the downtown area, those from July 1905 through 1925 at the U. S. Court House, and from January 1926 through 20 June 1942 at the University of Chicago. On the latter date the official site transferred to Midway Airport, and on 16 January 1980 it moved to O’Hare International Airport, where it remains today (several within-site moves have been made at O’Hare).
Explore the Climate Data
Use these shortcuts to move directly to the principal charts, analyses and historical records.
Climate Overview Graphs — RECENT YEARS
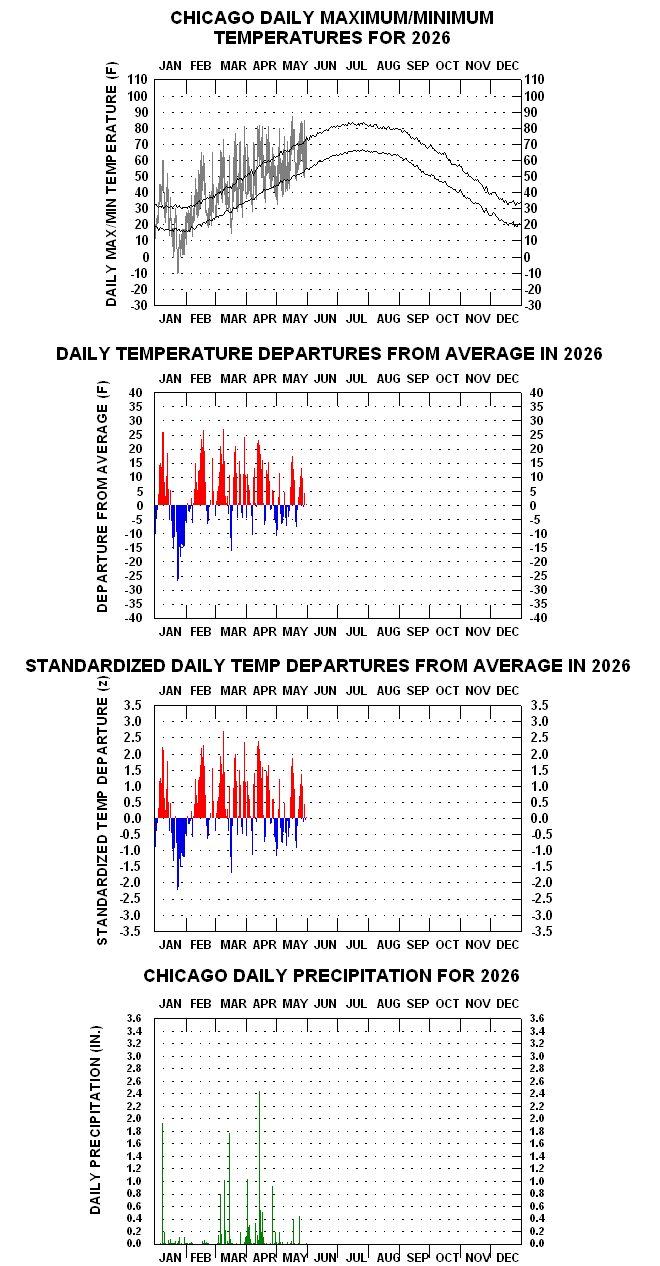
- 2026 Daily Temperature and Precipitation for Chicago - NewNew (5/31/26)
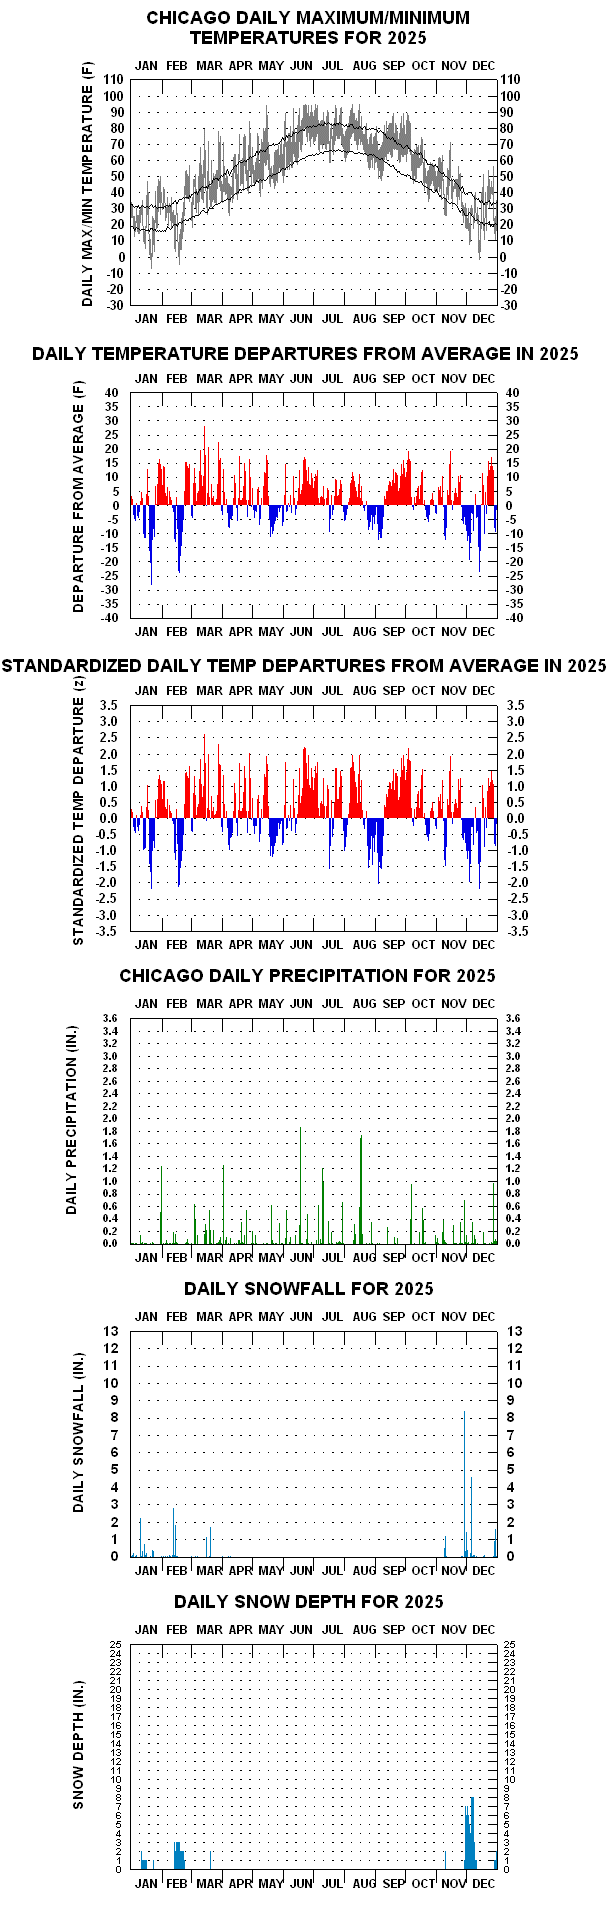
- 2025 Daily Temperature and Precipitation for Chicago
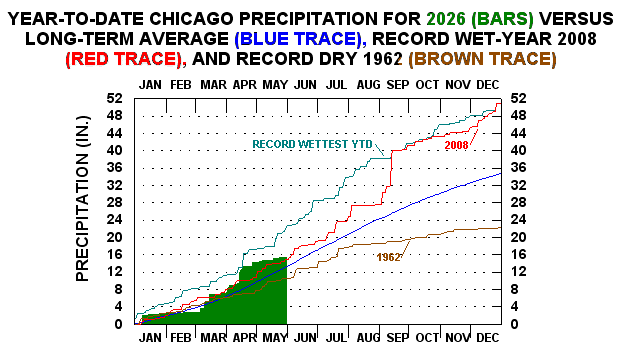
- Chicago 2026 Cumulative Daily Precipitation vs. Normals and Record Wettest & Driest YTD NewNew (5/31/26)
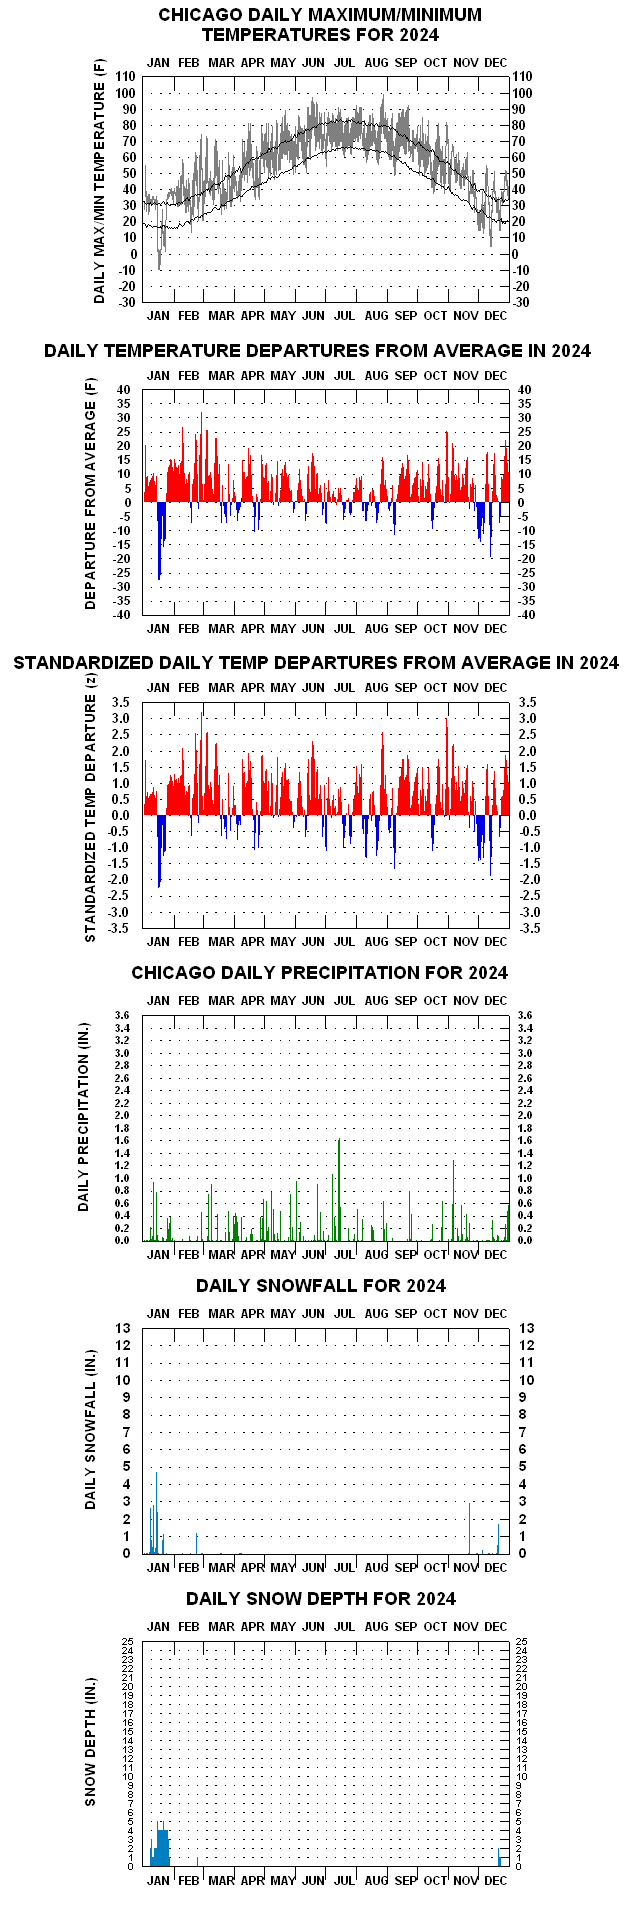
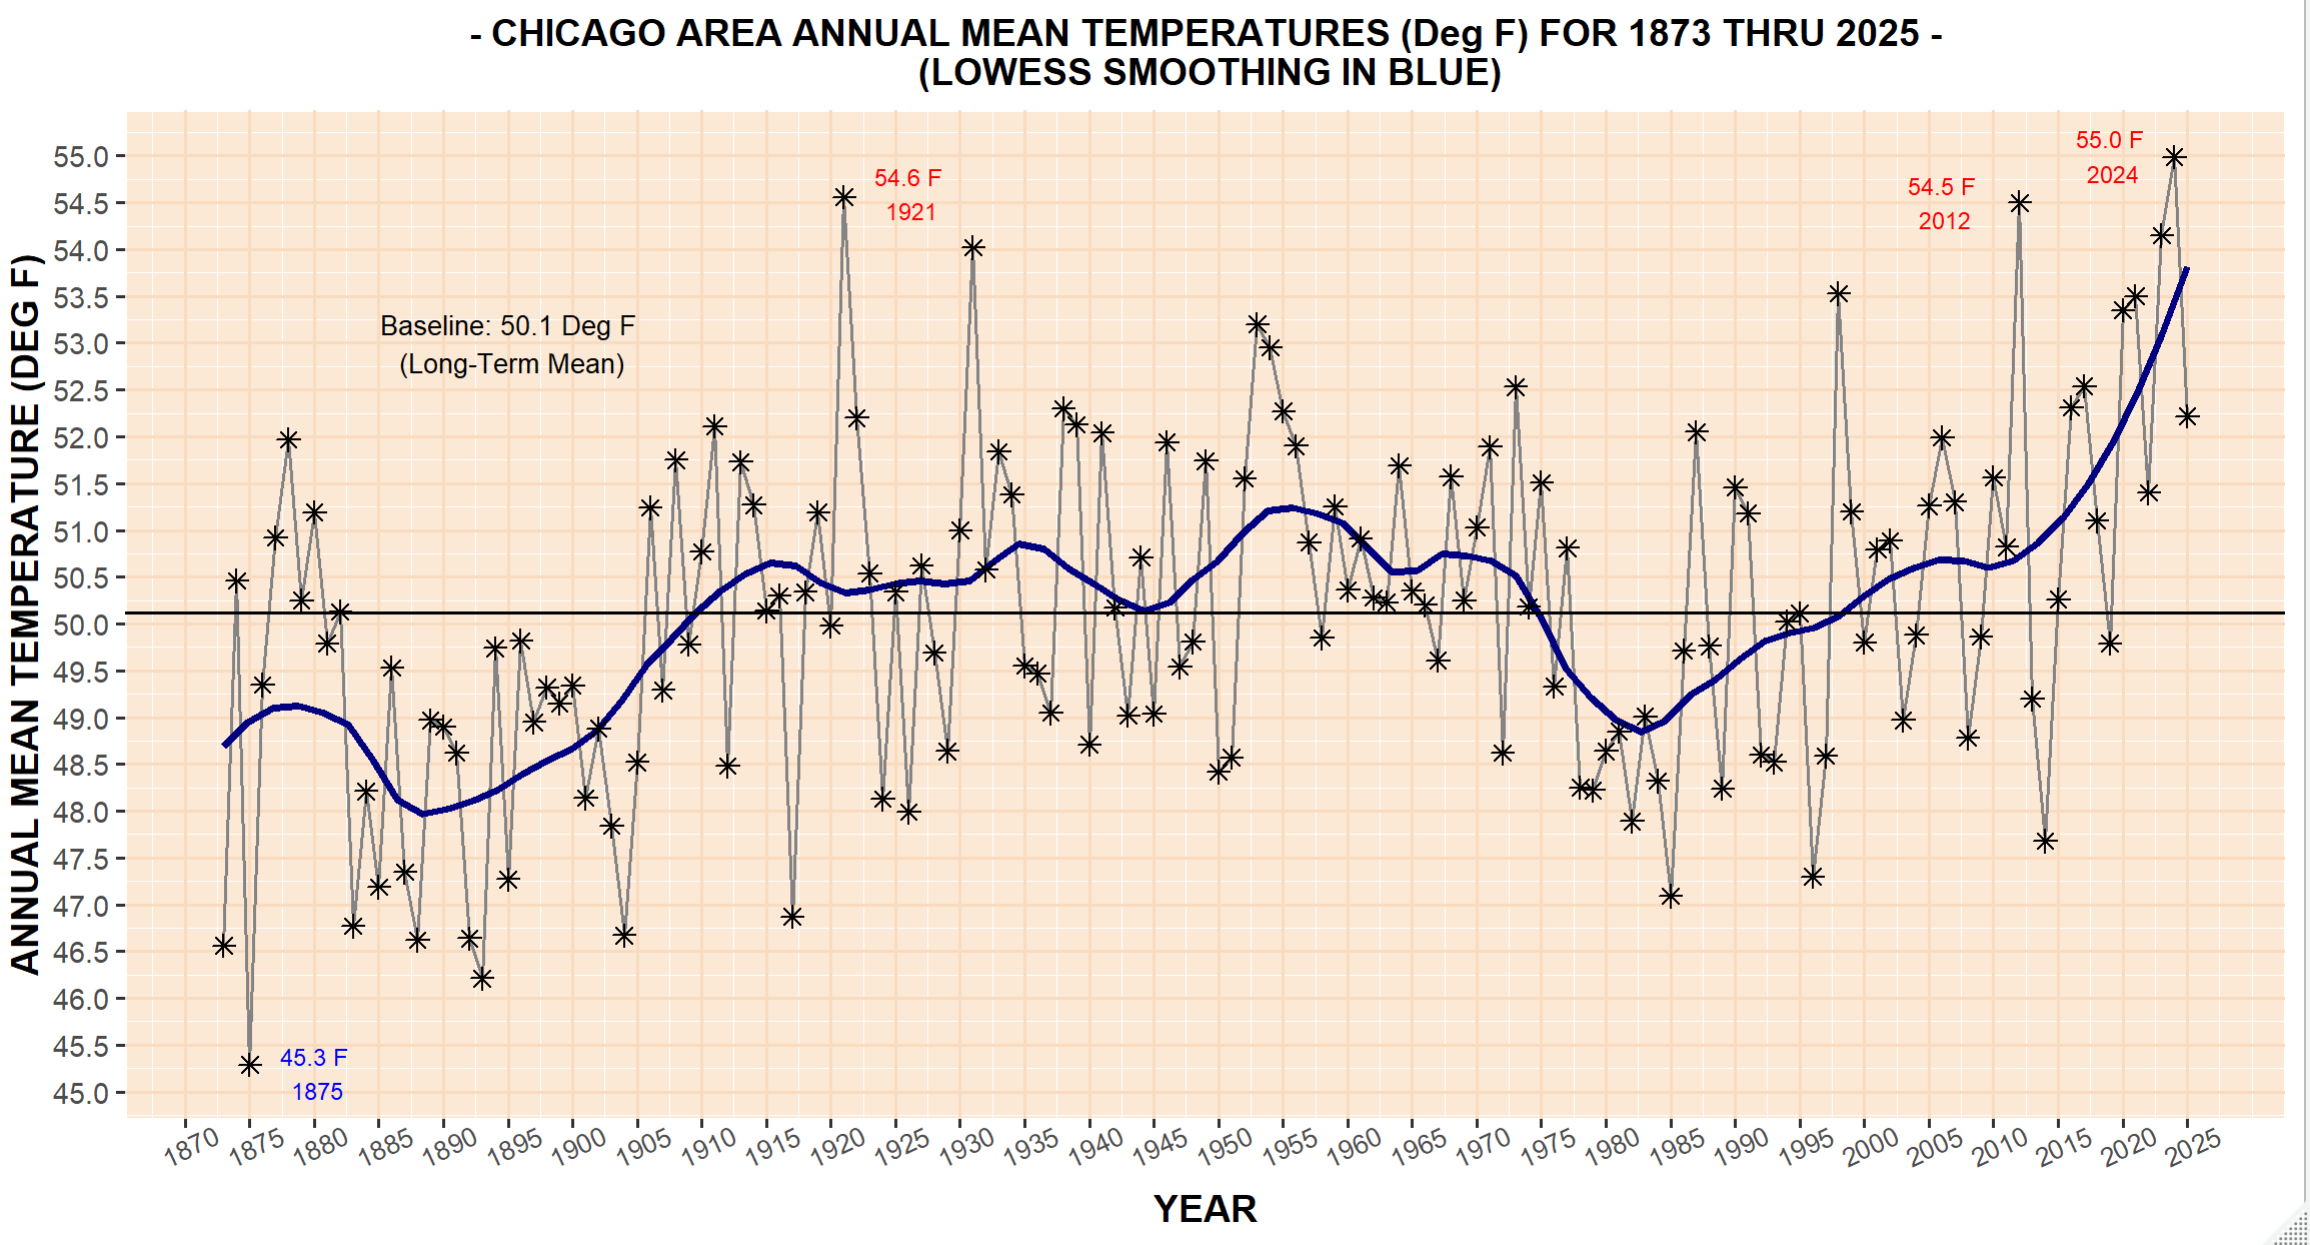
- 2024 Daily Temperatures and Precipitation for ChicagoWarmest Year in History (55.0 F)
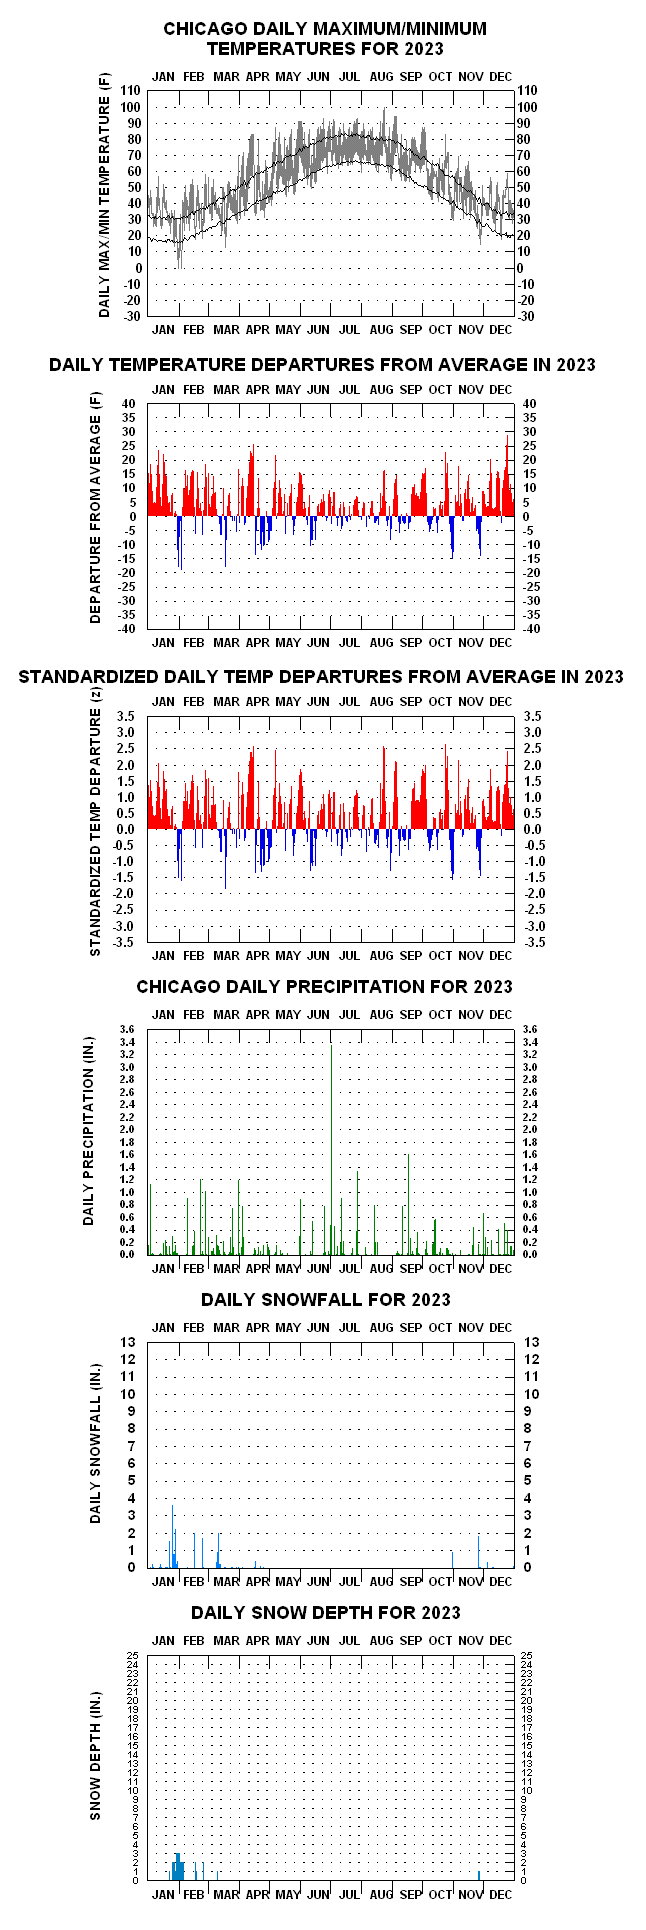
- 2023 Daily Temperatures and Precipitation for Chicago
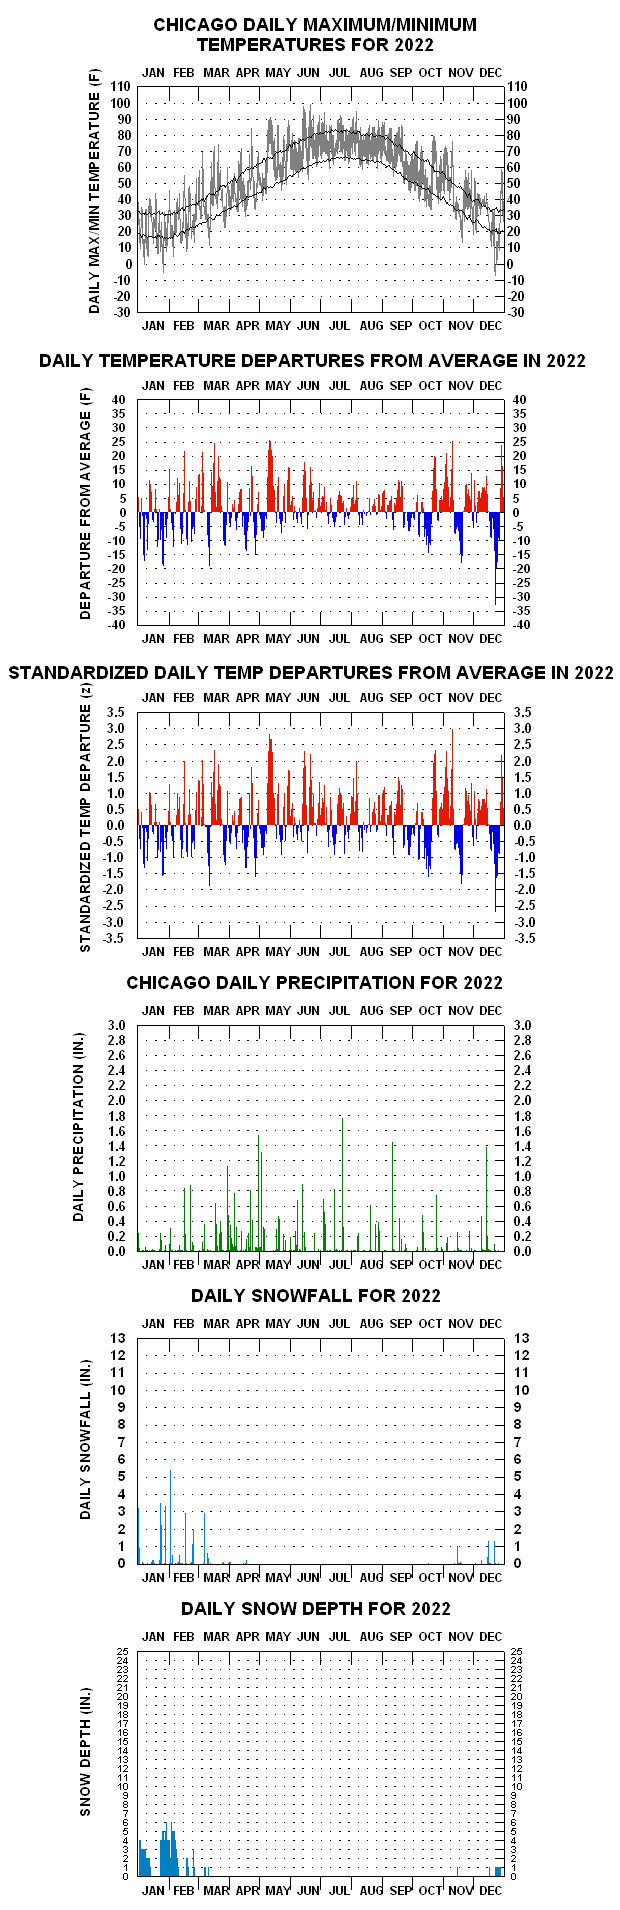
- 2022 Daily Temperatures and Precipitation for Chicago
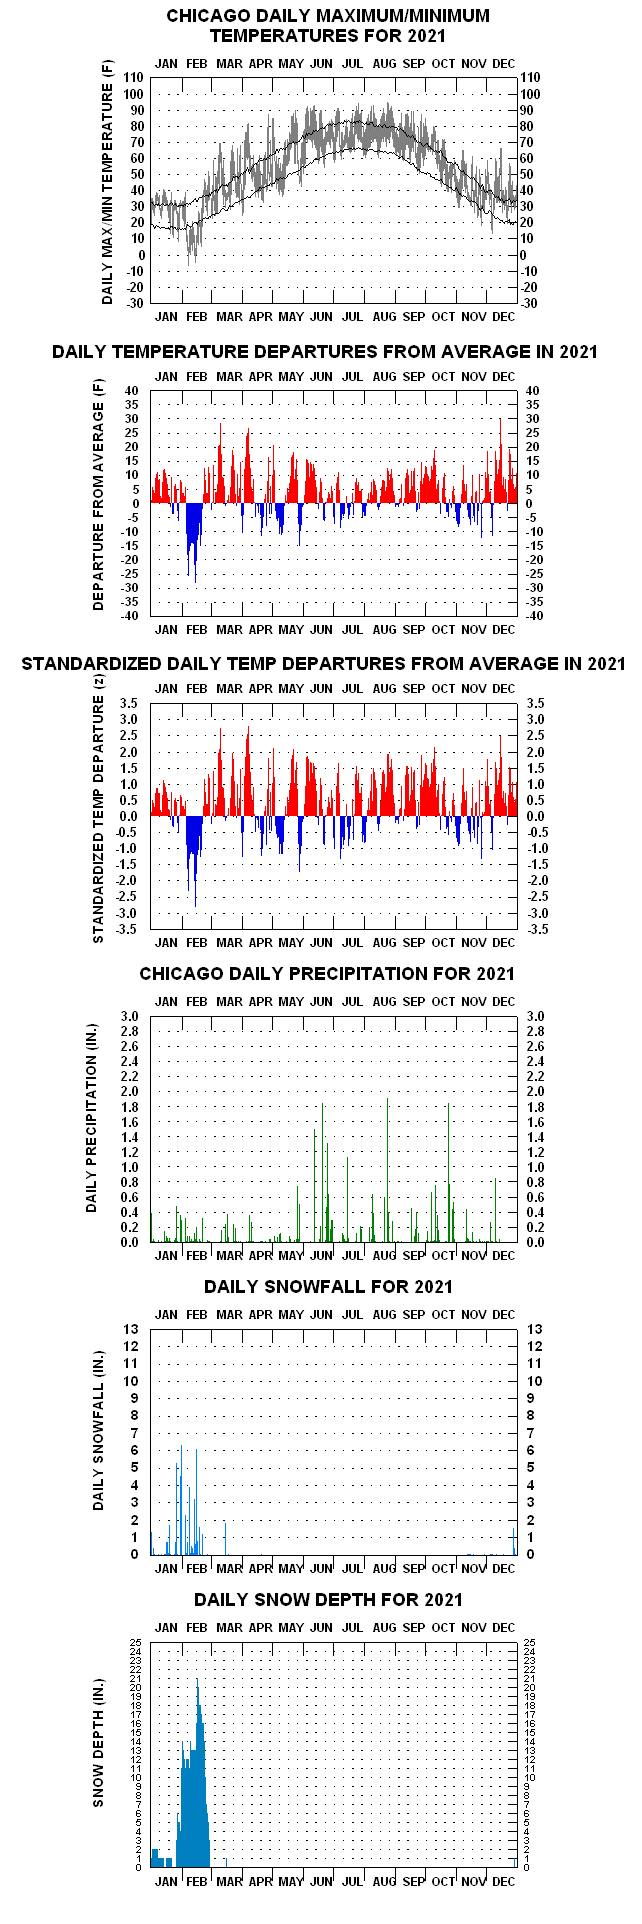
- 2021 Daily Temperatures and Precipitation for Chicago
- 2020 Daily Temperatures and Precipitation for Chicago
- 2019 Daily Temperatures and Precipitation for Chicago
- 2018 Daily Temperatures and Precipitation for Chicago
Daily Temperature Stats
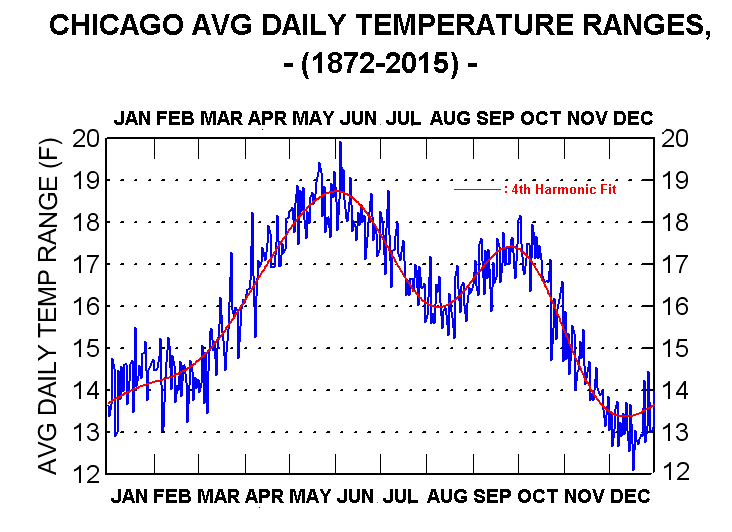
- Chicago Average Daily Temperature Ranges, by Calendar Day
- Chicago Annual Mean Temperature History (1873-2025) New(New 1/3/26)
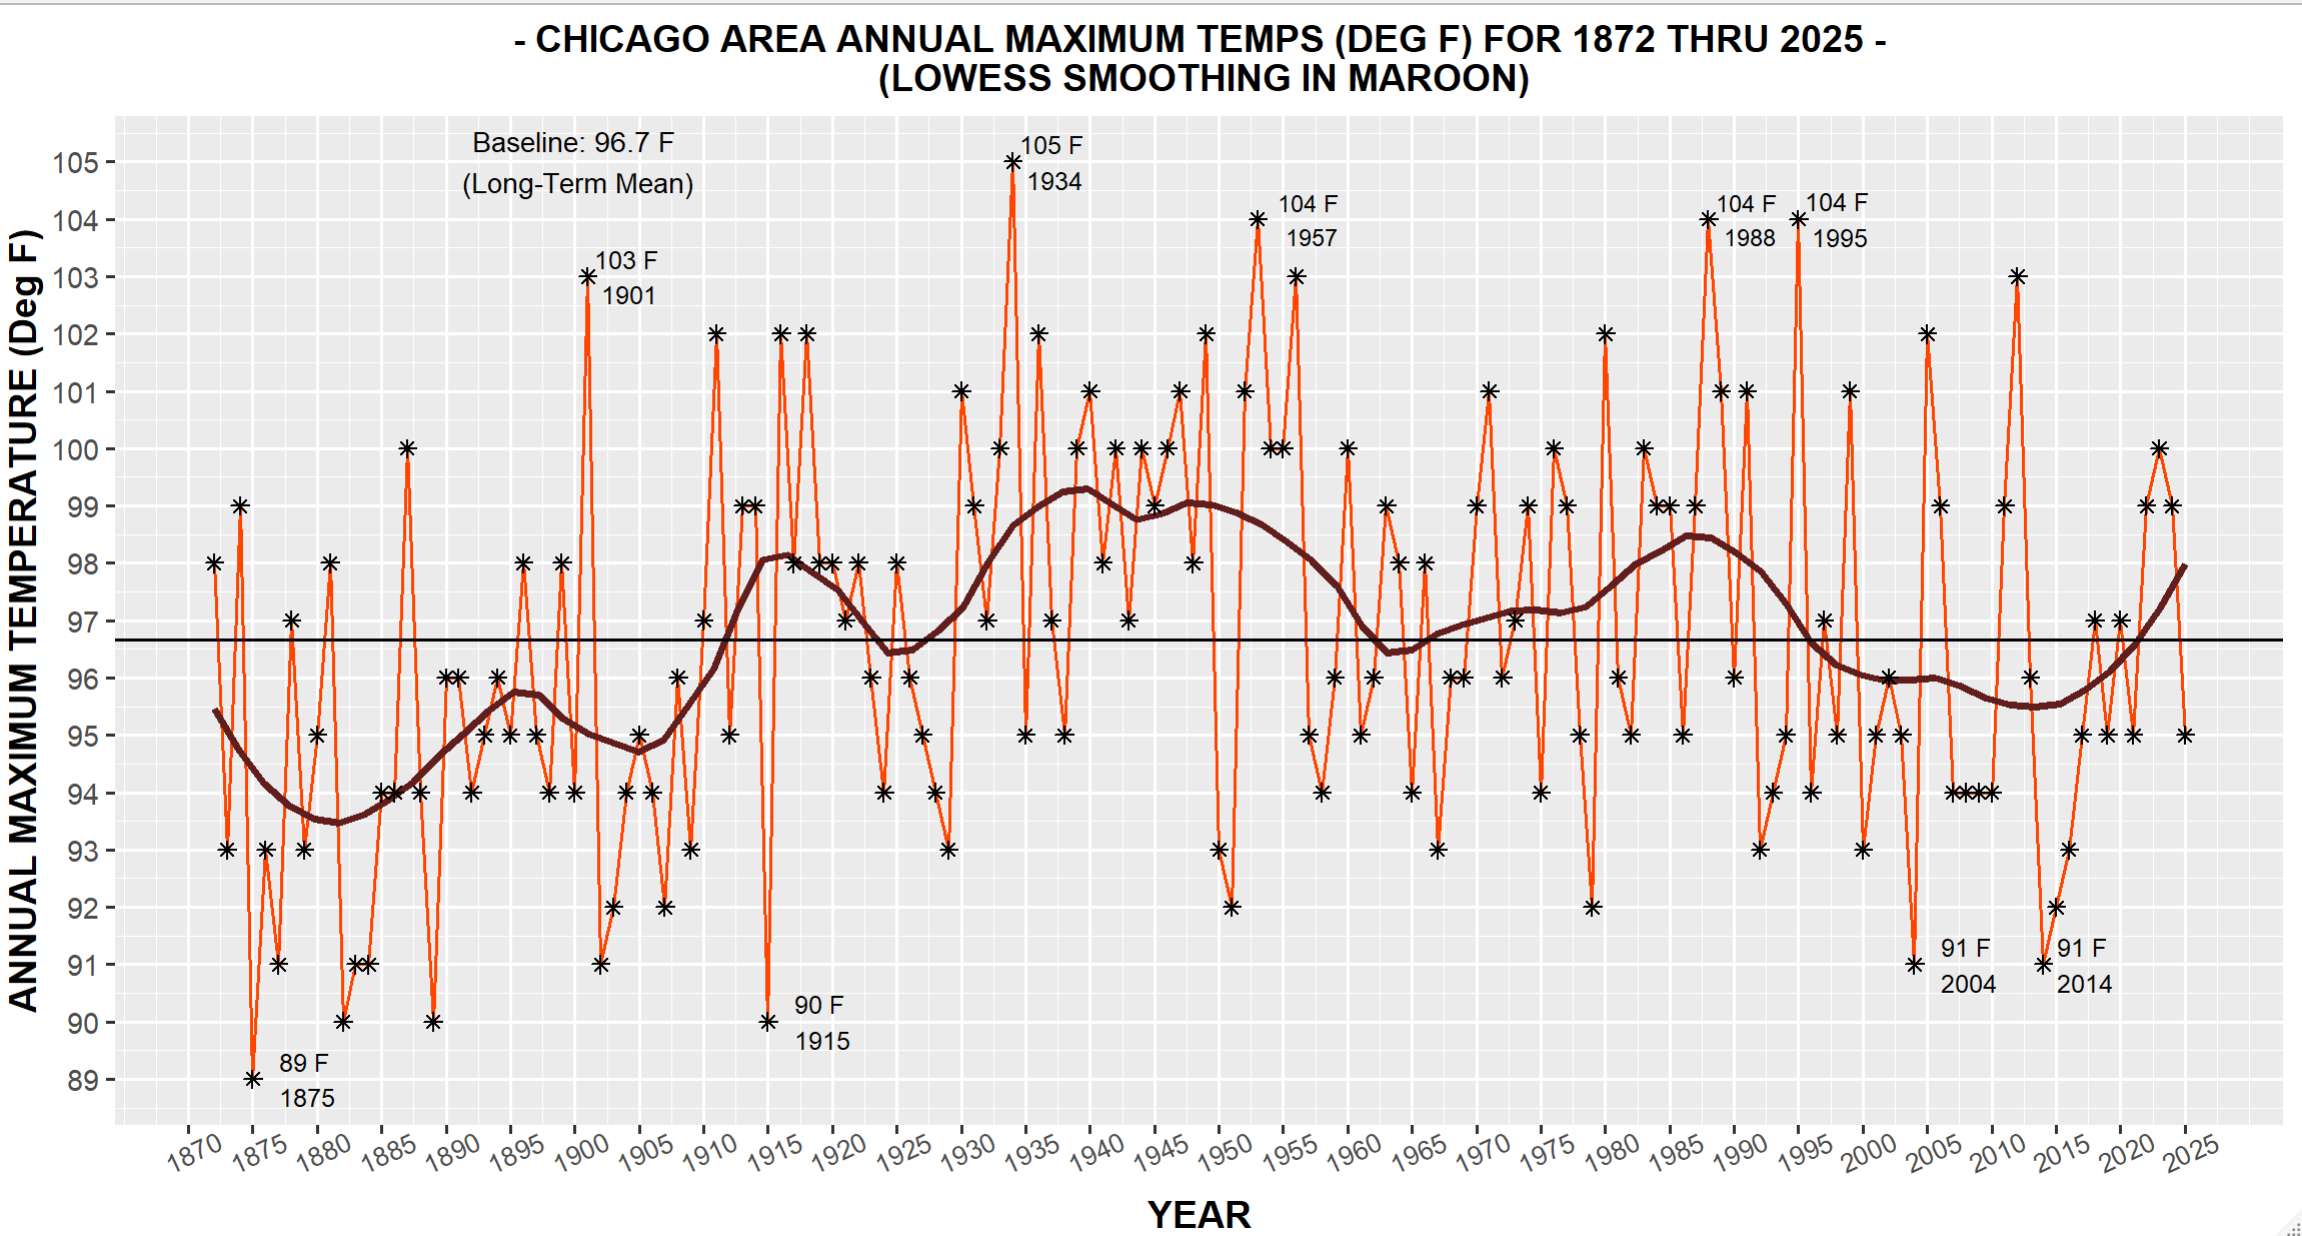
- Chicago Annual Maximum Temperatures (1872-2025) New(New 1/4/26)
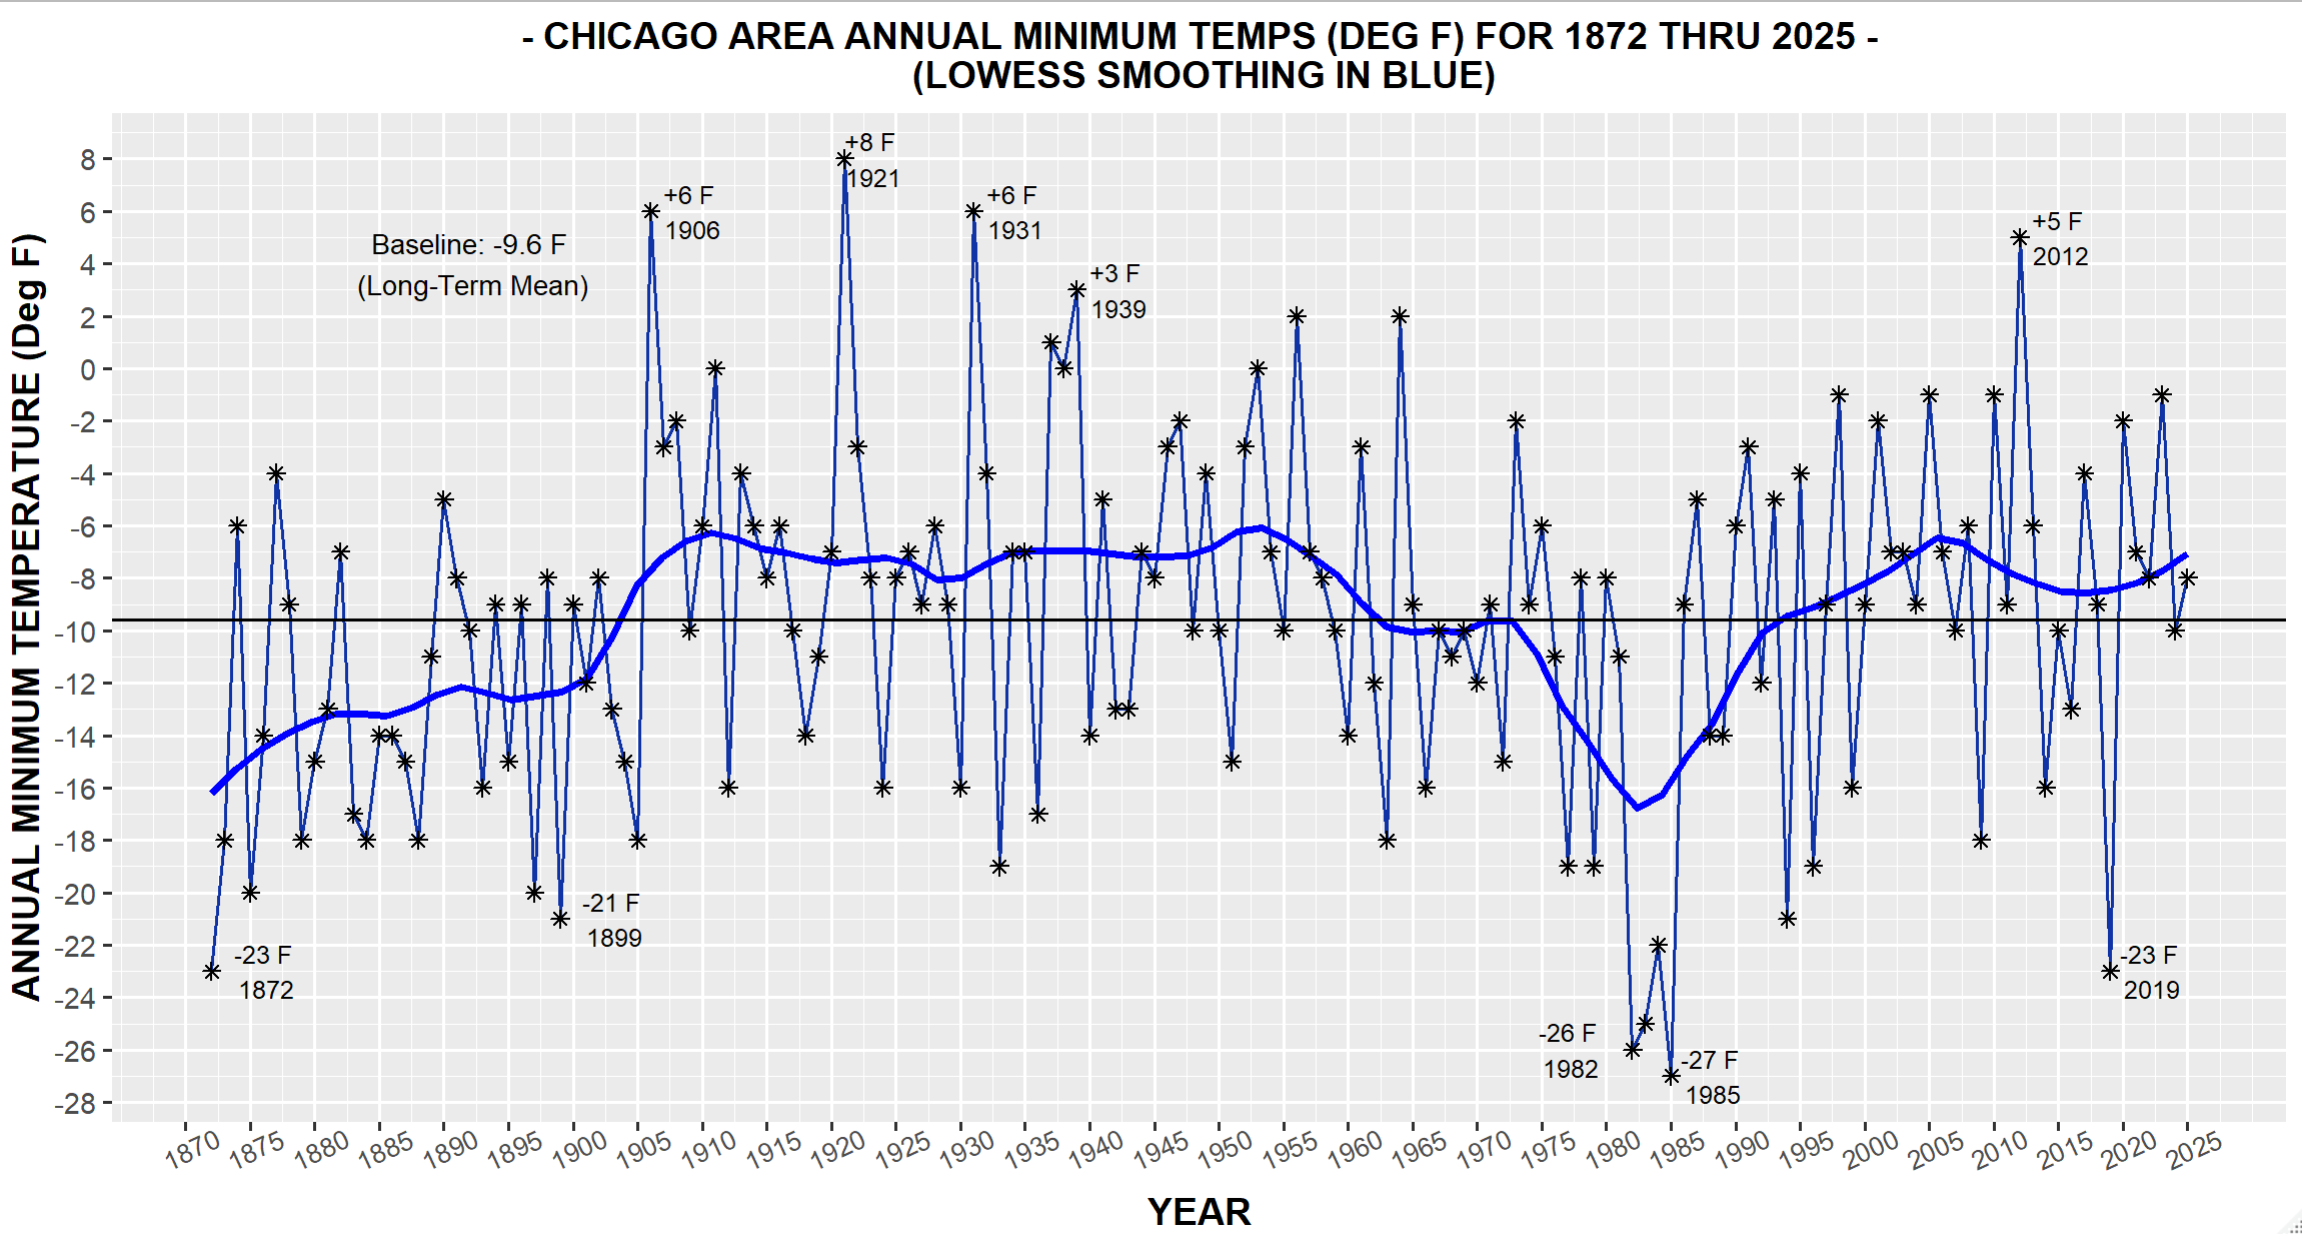
- Chicago Annual Minimum Temperatures (1872-2025) New(New 1/4/26)
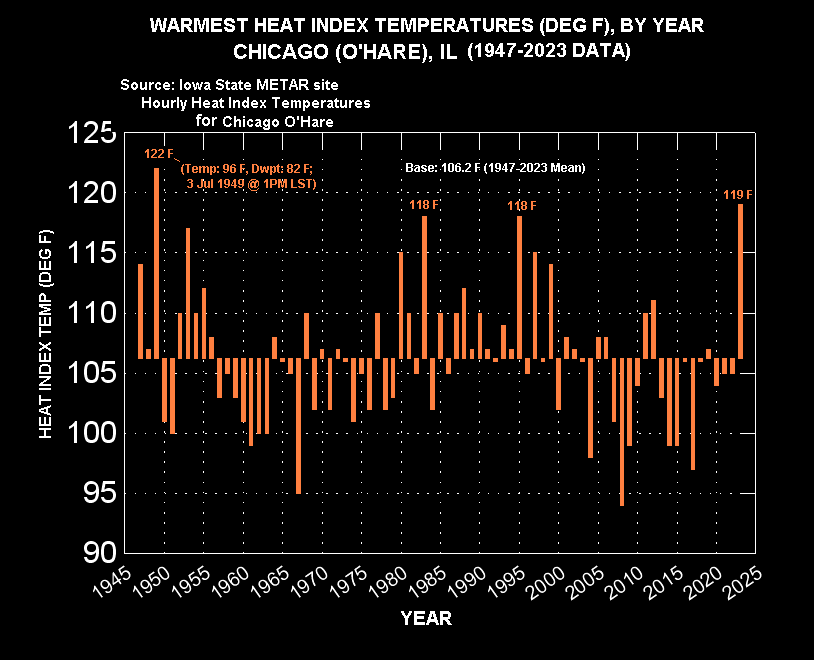
- Chicago Warmest Heat-Index Temperatures by Calendar Year (1947-2023)
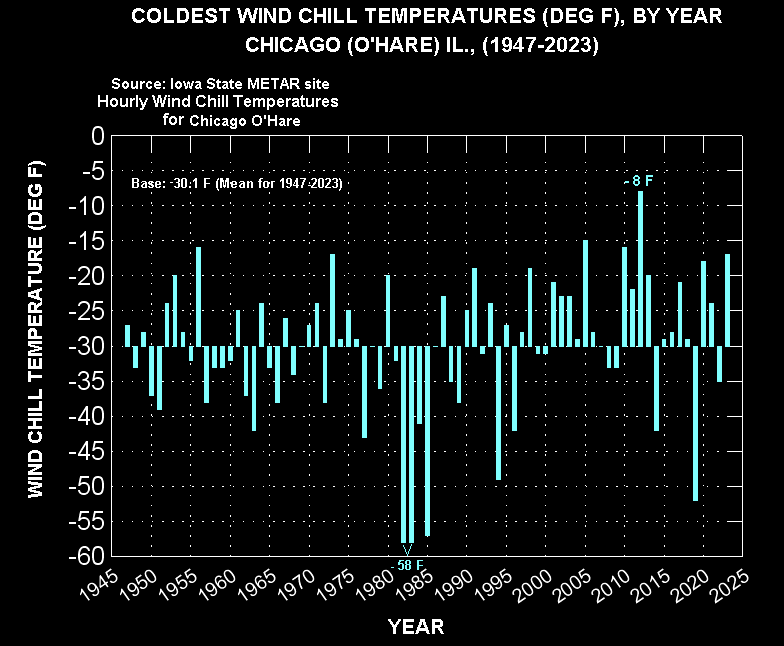
- Chicago Coldest Wind Chill Temperatures by Calendar Year (1947-2023)
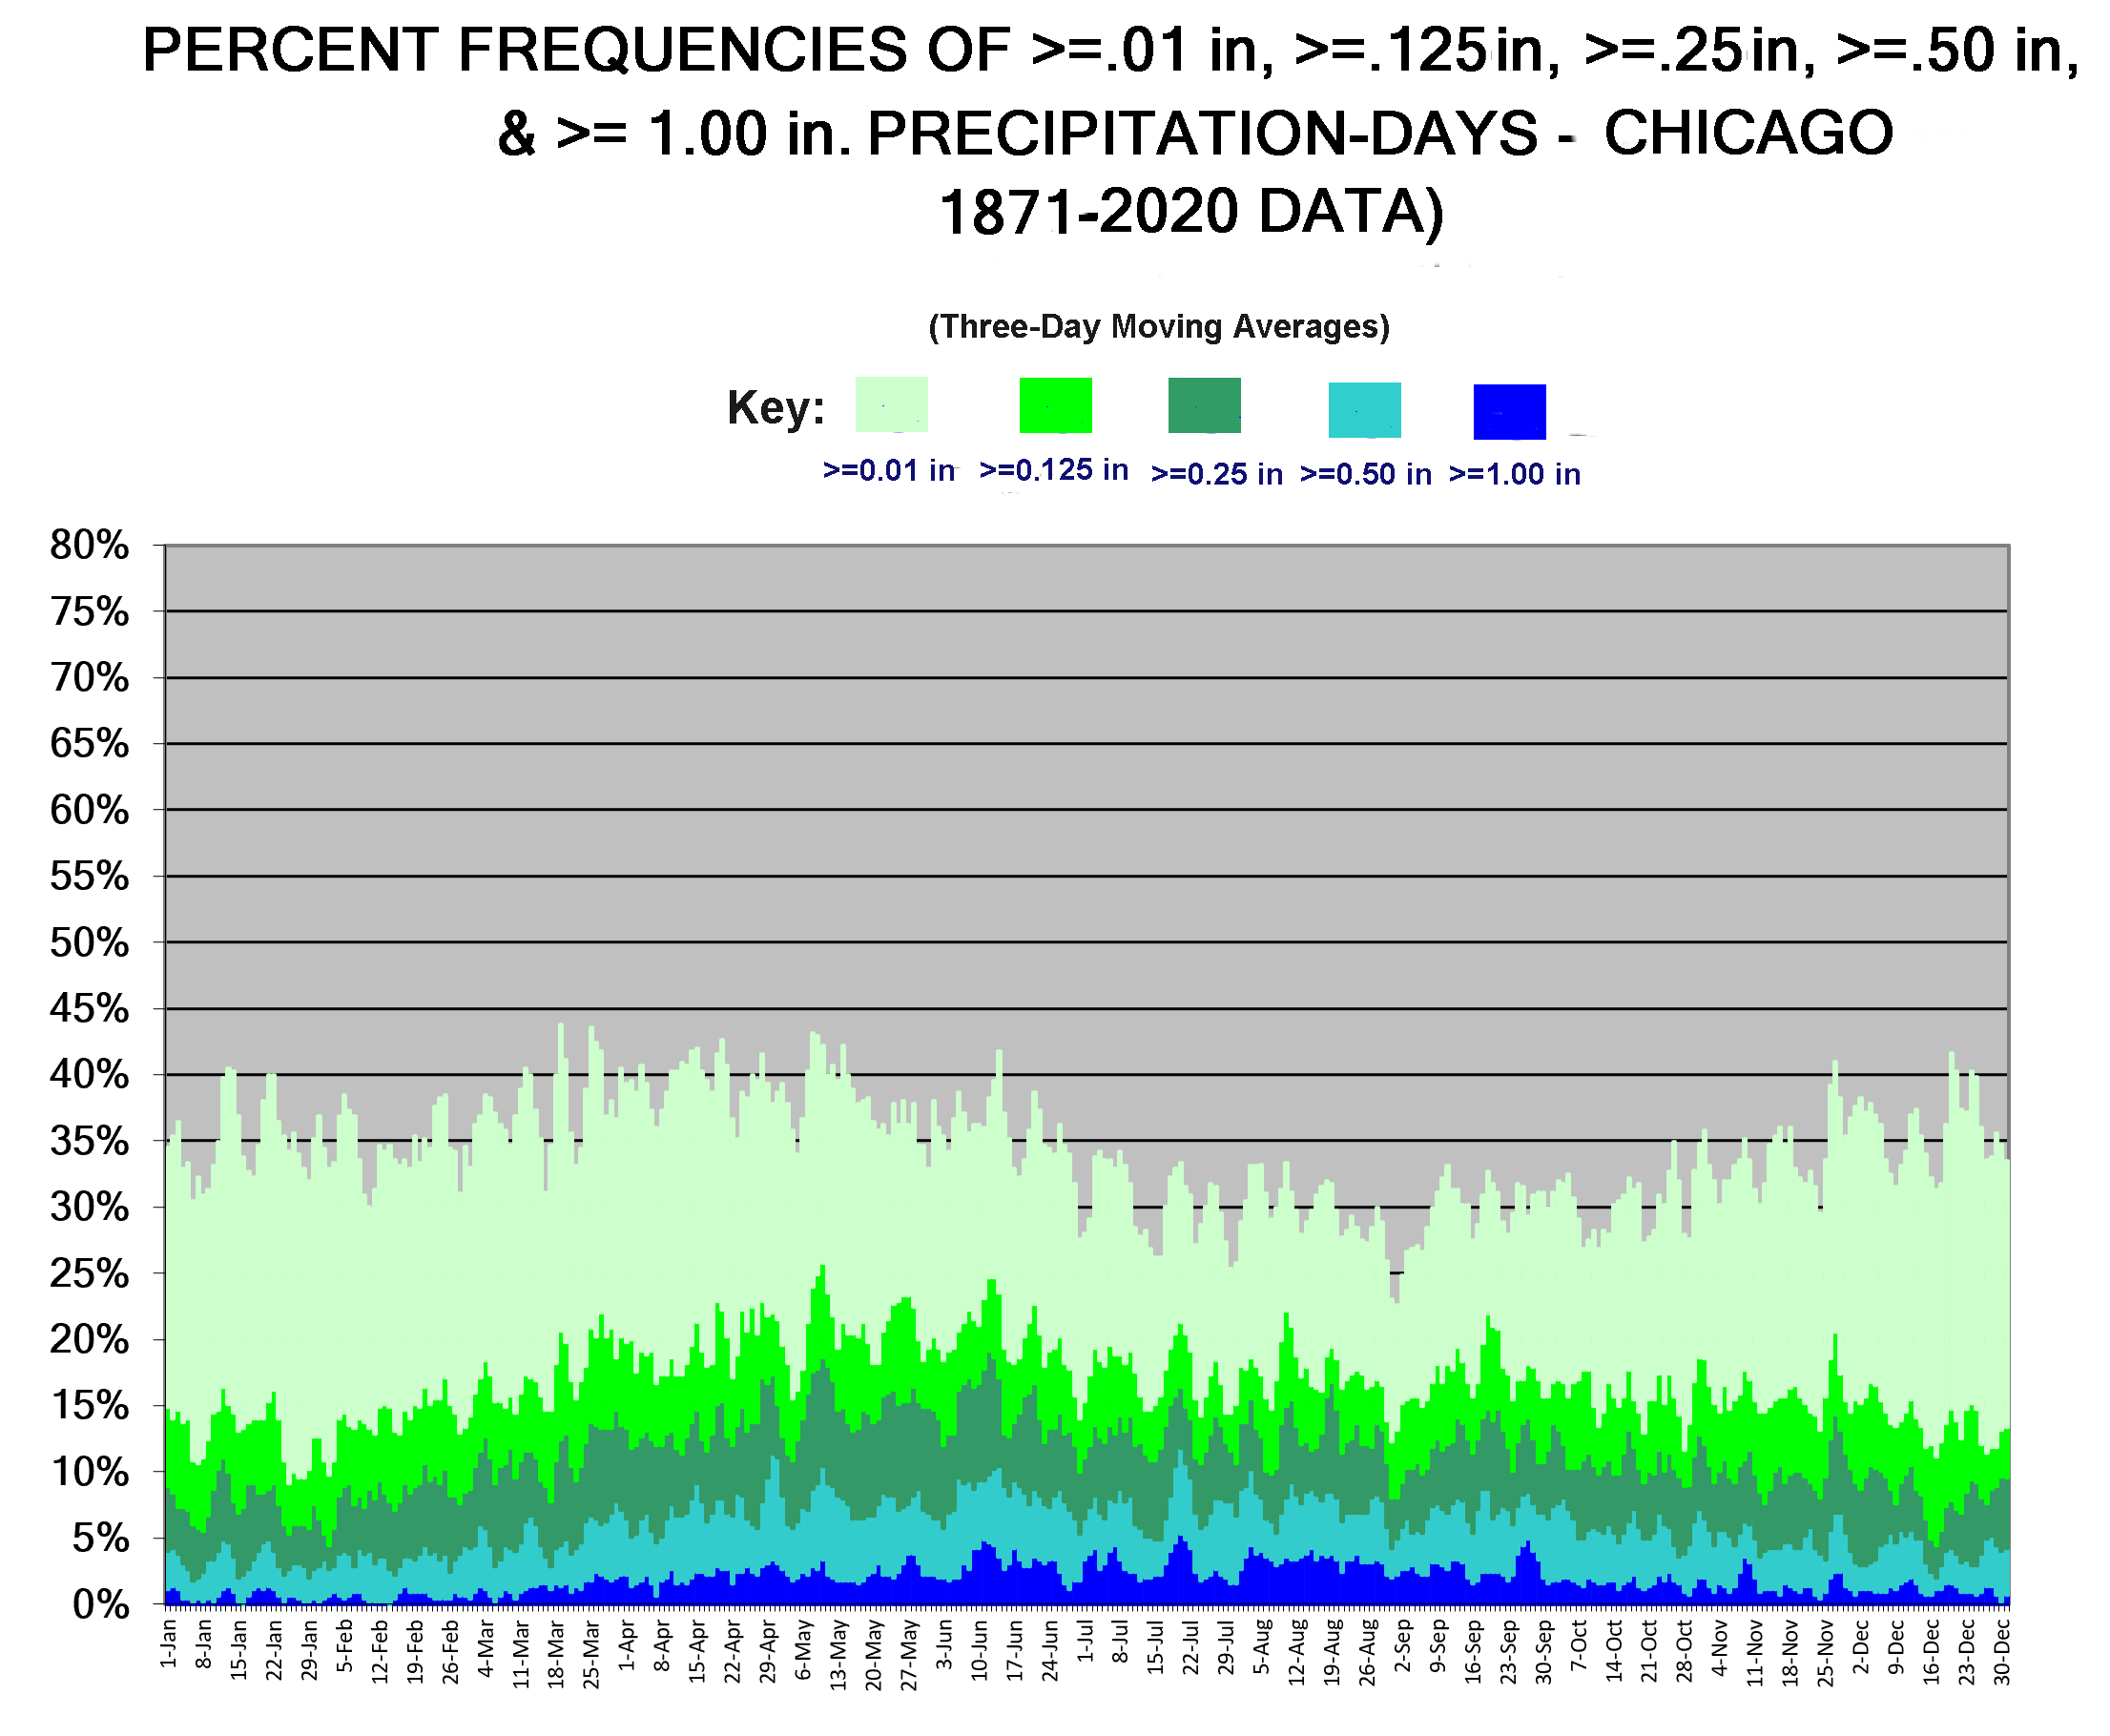
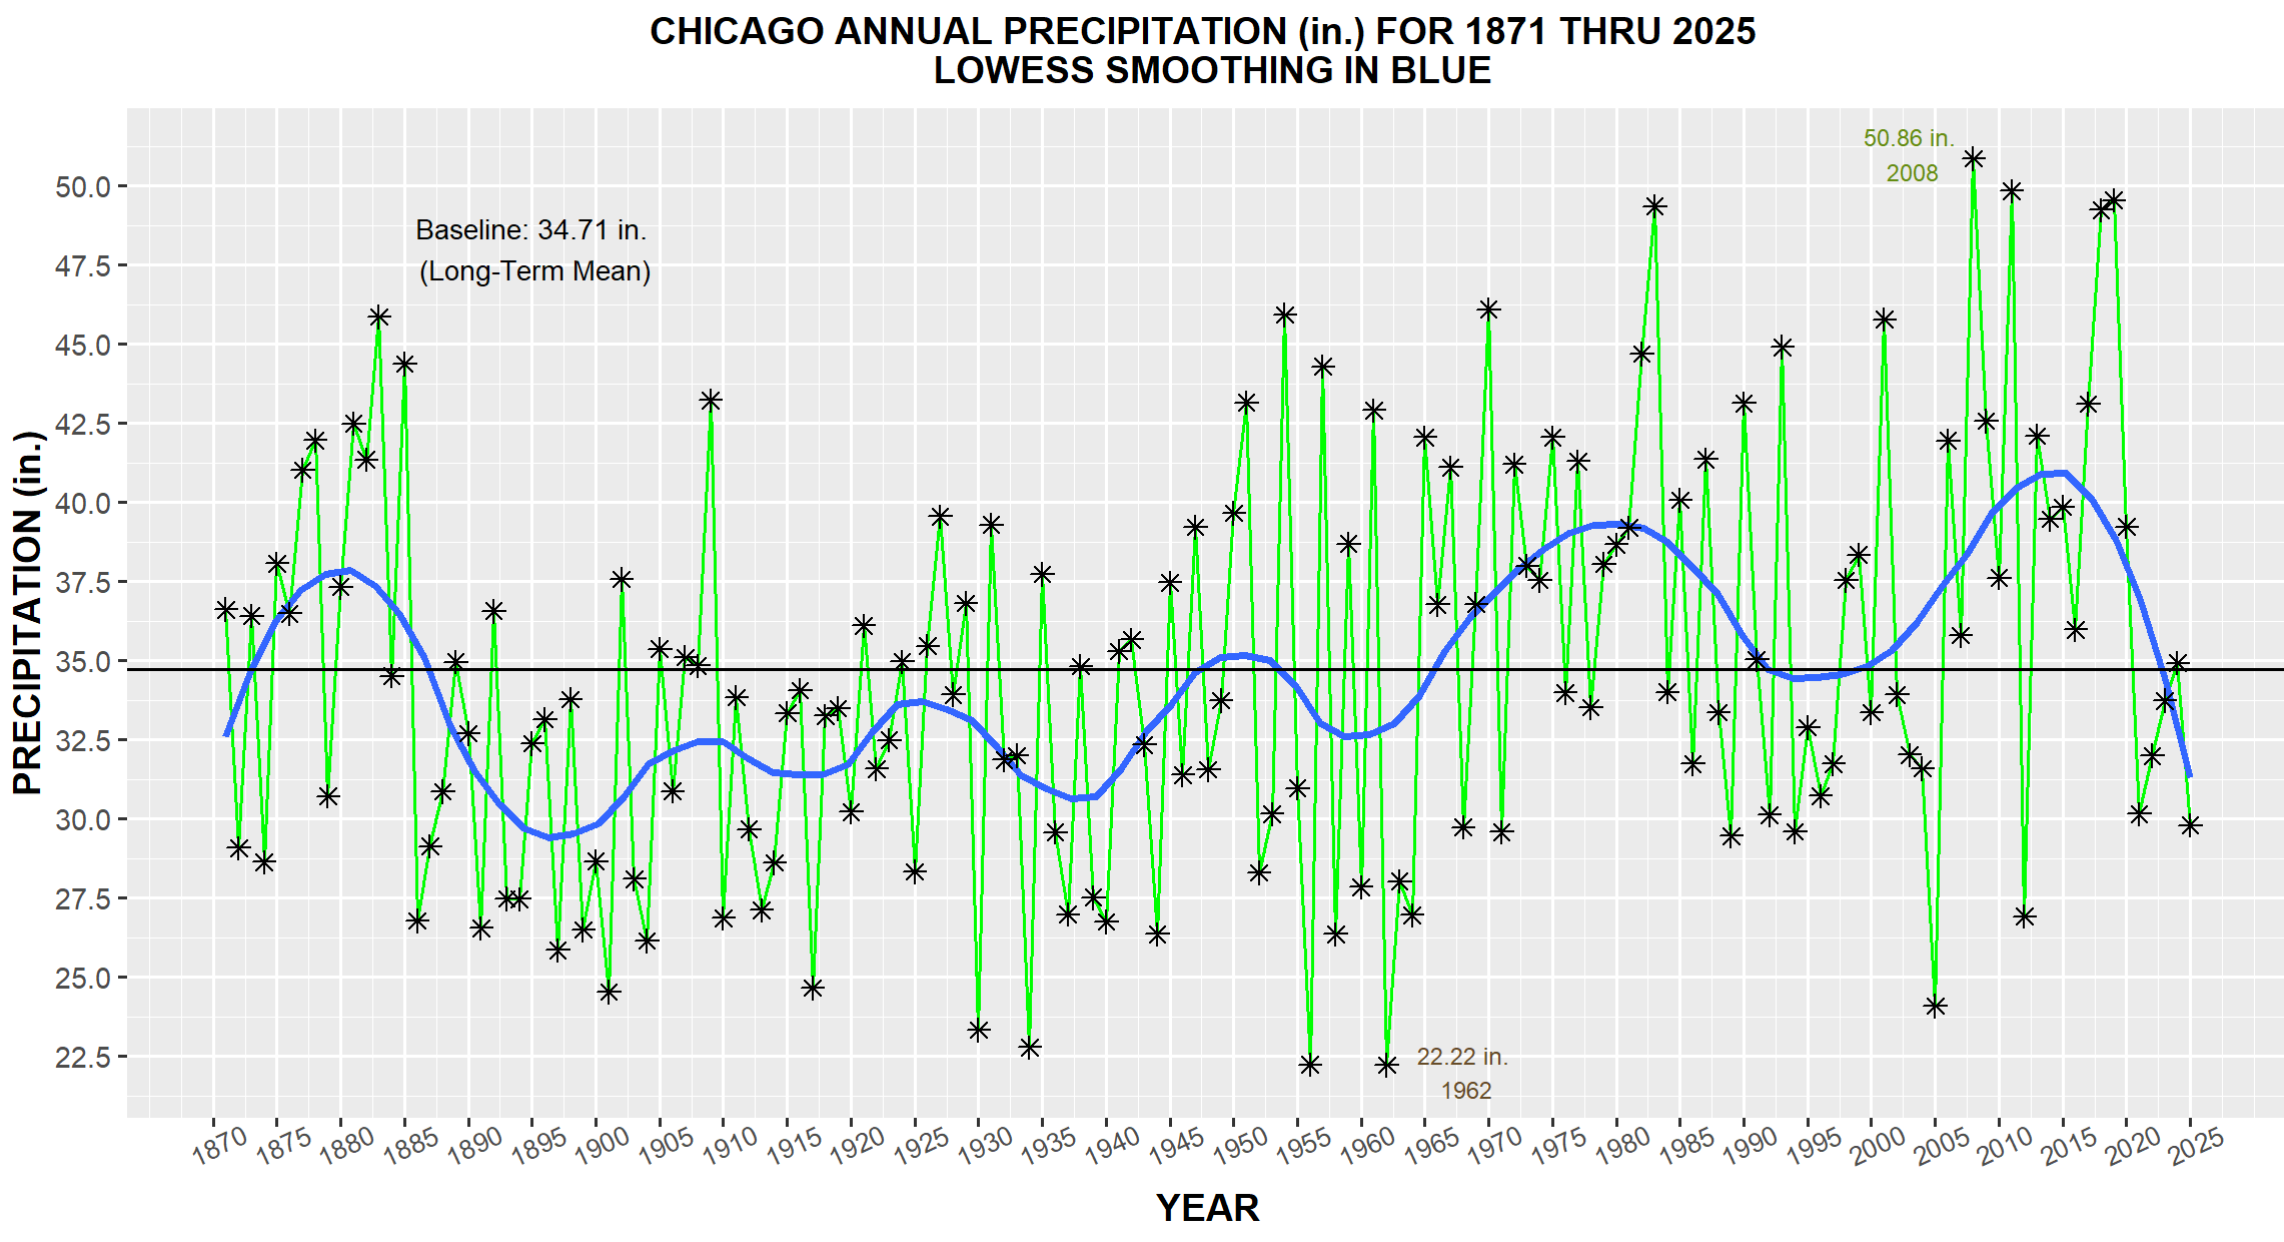
Precipitation:
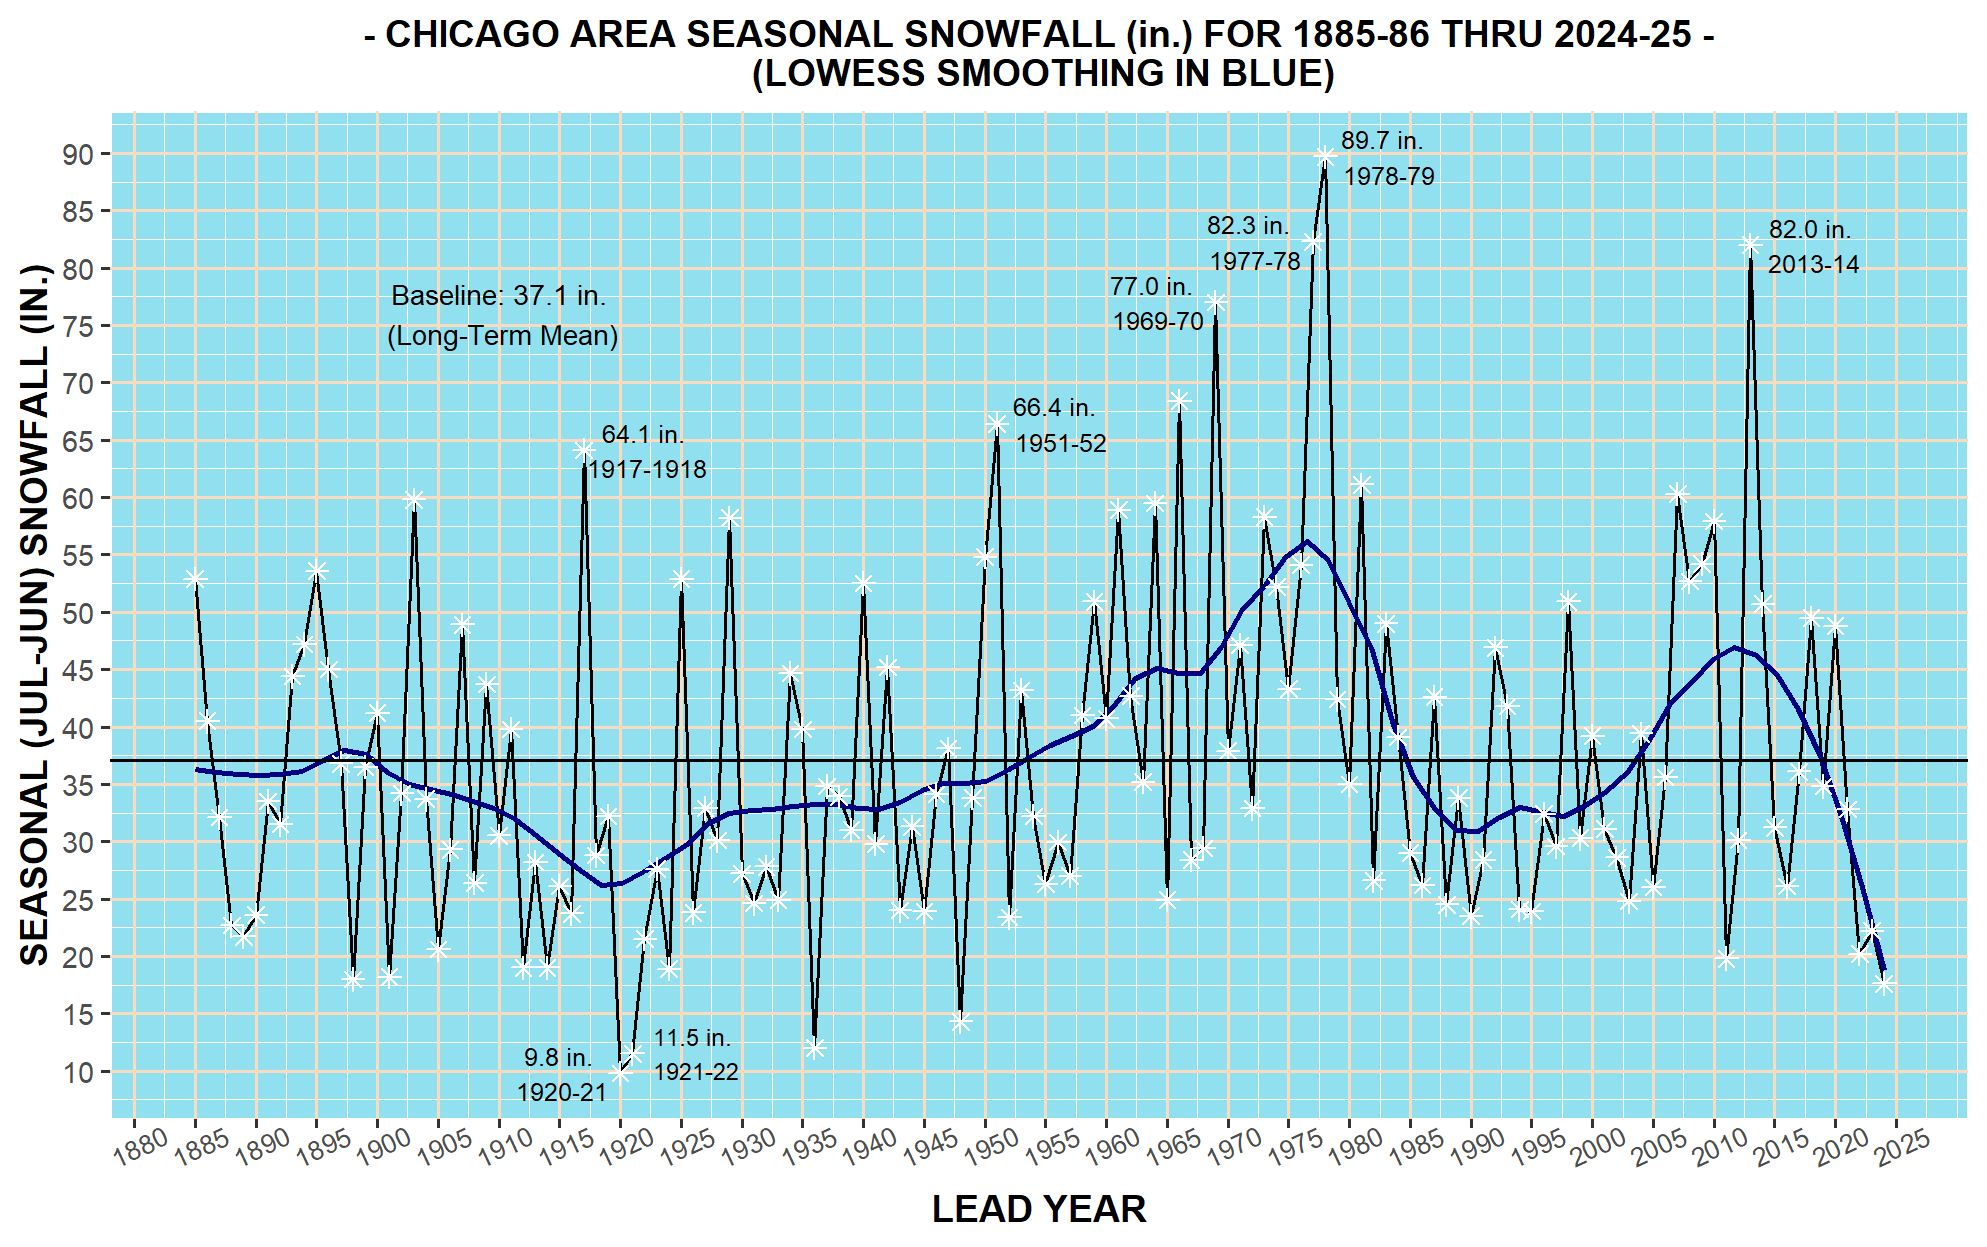
Month/Hour Climograms and Other:
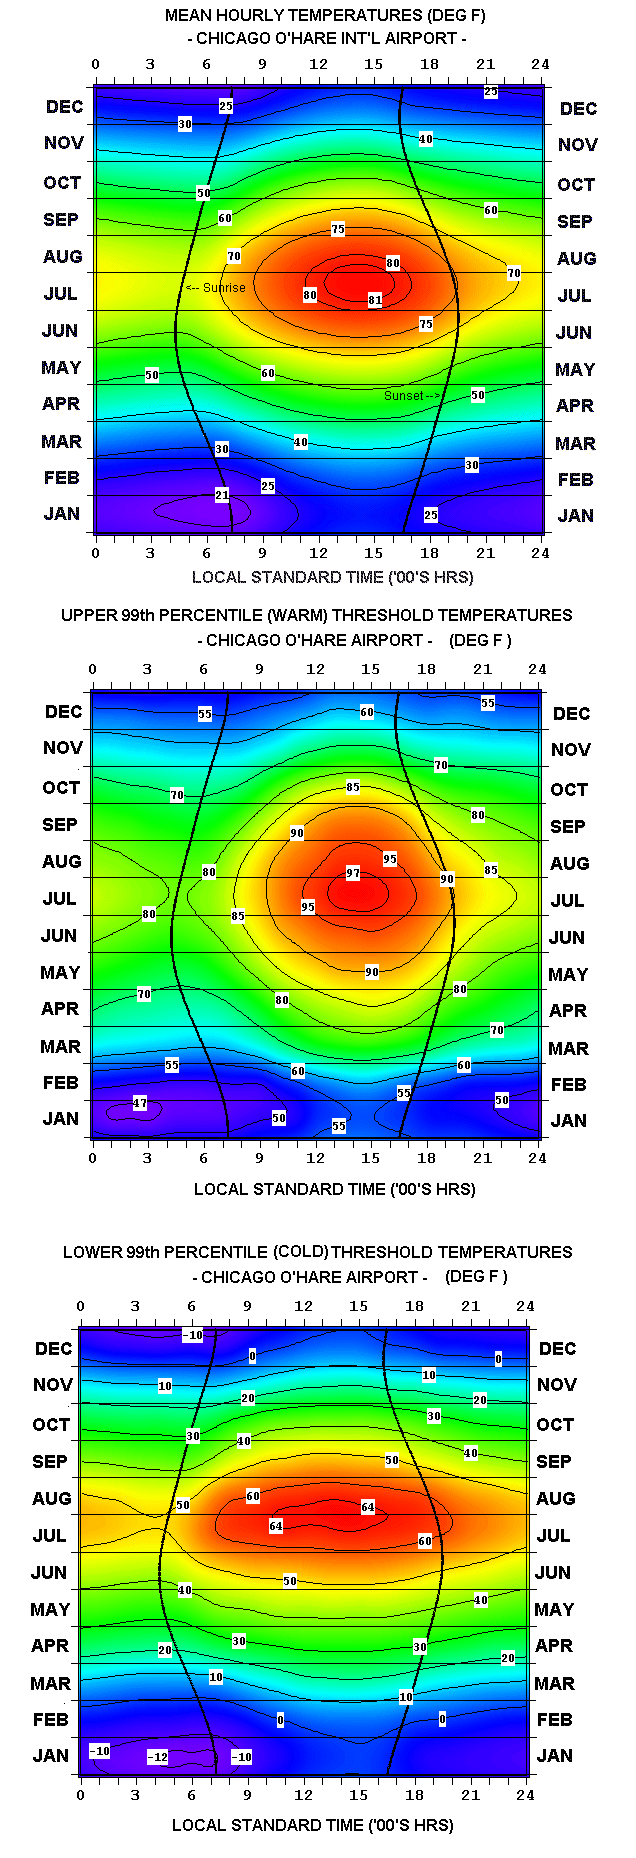
- Chicago Mean Hourly Temperatures & Upper 99th and Lower 1st Percentile Temps by Month/HourChicago Hourly Temperatures, by Hour/Month — Means, Stdv’s & Skews Chicago Coldest 99th Percentile Hour/Month Wind Chill Temps Chicago Mean and Extreme Lowest 1st Percentile Hourly Relative Humidities Chicago Thunderstorm Frequency Chicago Winds Chicago Fog/Haze Chicago Flying Weather/Ceilings
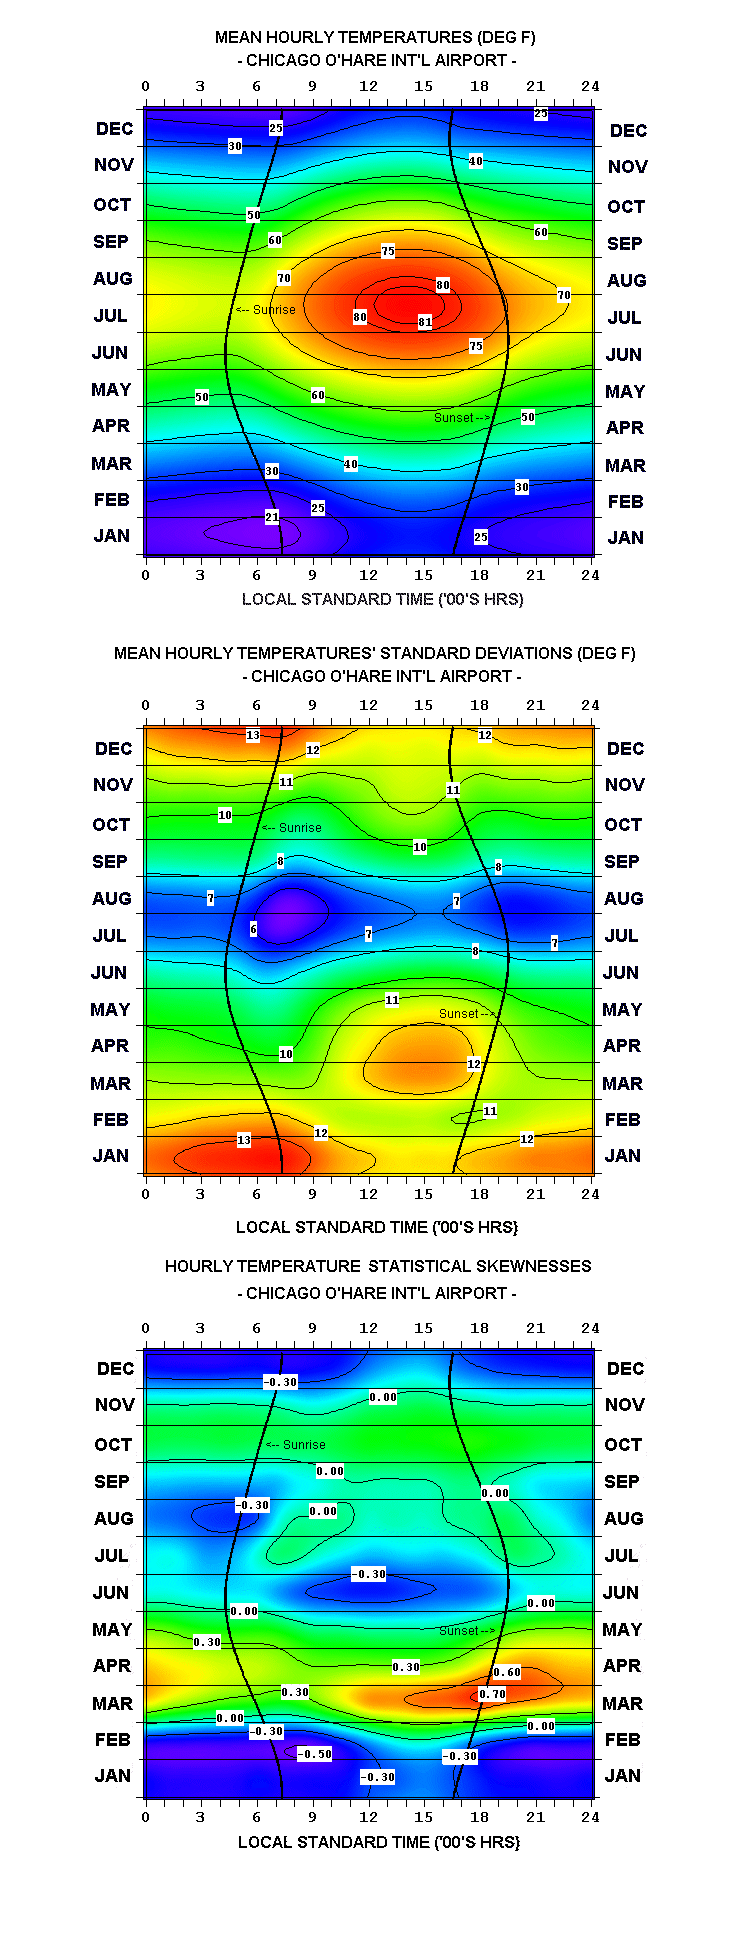
- Chicago Hourly Temperatures, by Hour/Month — Means, Stdv’s & SkewsChicago Mean Hourly Temperatures & Upper 99th and Lower 1st Percentile Temps by Month/Hour Chicago Hourly Temperatures, by Hour/Month — Means, Stdv’s & Skews Chicago Coldest 99th Percentile Hour/Month Wind Chill Temps Chicago Mean and Extreme Lowest 1st Percentile Hourly Relative Humidities Chicago Thunderstorm Frequency Chicago Winds Chicago Fog/Haze Chicago Flying Weather/Ceilings
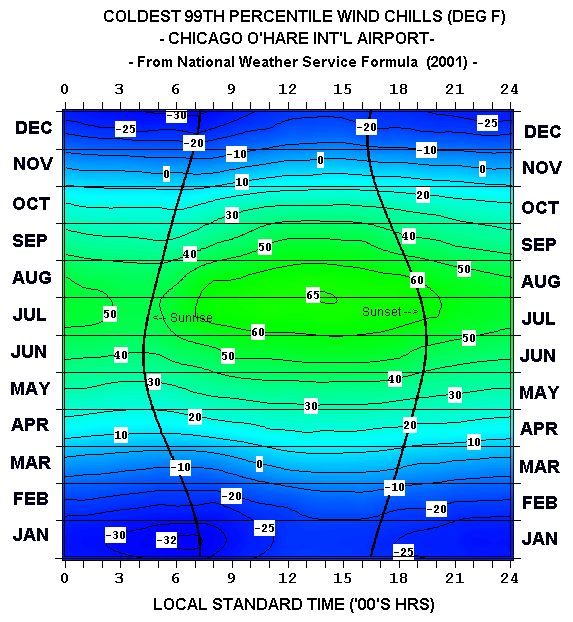
- Chicago Coldest 99th Percentile Hour/Month Wind Chill TempsChicago Mean Hourly Temperatures & Upper 99th and Lower 1st Percentile Temps by Month/Hour Chicago Hourly Temperatures, by Hour/Month — Means, Stdv’s & Skews Chicago Coldest 99th Percentile Hour/Month Wind Chill Temps Chicago Mean and Extreme Lowest 1st Percentile Hourly Relative Humidities Chicago Thunderstorm Frequency Chicago Winds Chicago Fog/Haze Chicago Flying Weather/Ceilings
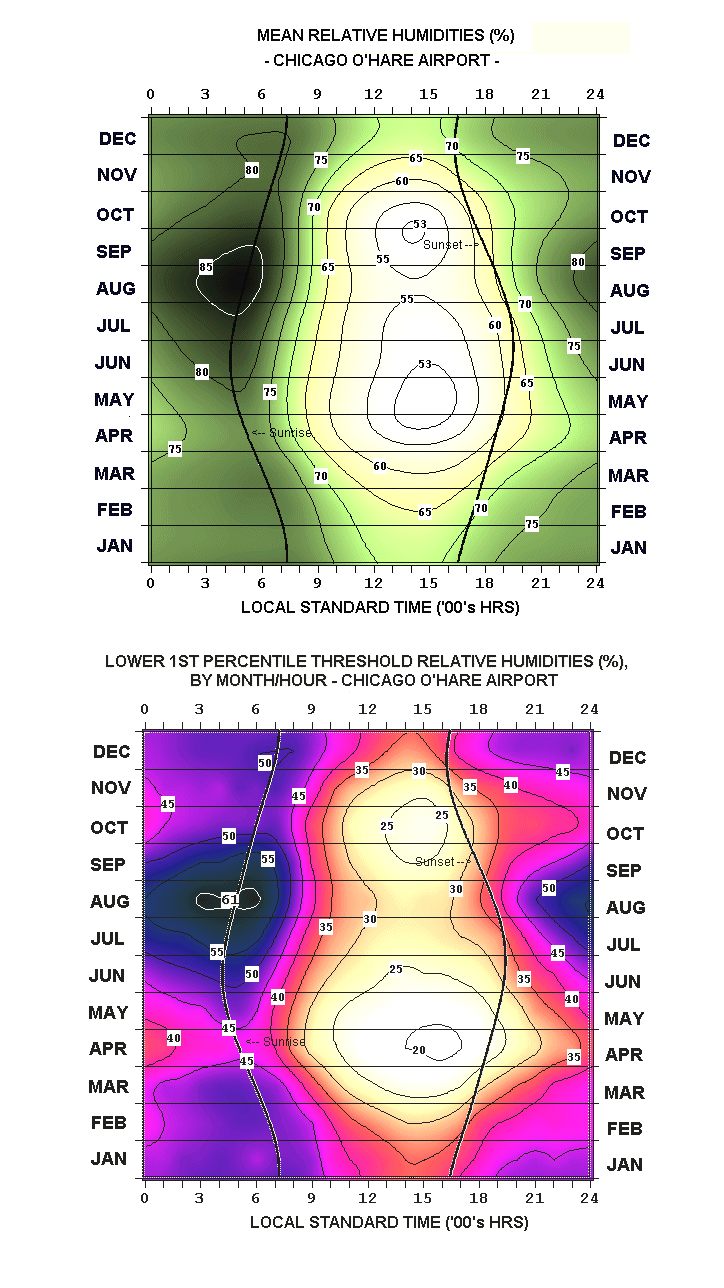
- Chicago Mean and Extreme Lowest 1st Percentile Hourly Relative HumiditiesChicago Mean Hourly Temperatures & Upper 99th and Lower 1st Percentile Temps by Month/Hour Chicago Hourly Temperatures, by Hour/Month — Means, Stdv’s & Skews Chicago Coldest 99th Percentile Hour/Month Wind Chill Temps Chicago Mean and Extreme Lowest 1st Percentile Hourly Relative Humidities Chicago Thunderstorm Frequency Chicago Winds Chicago Fog/Haze Chicago Flying Weather/Ceilings
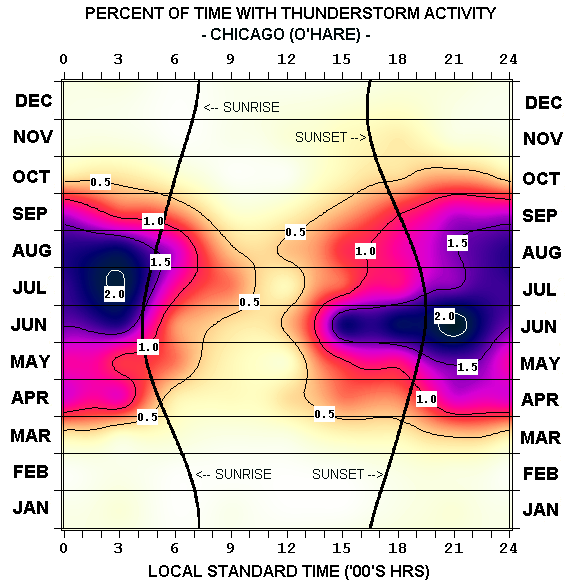
- Chicago Thunderstorm FrequencyChicago Mean Hourly Temperatures & Upper 99th and Lower 1st Percentile Temps by Month/Hour Chicago Hourly Temperatures, by Hour/Month — Means, Stdv’s & Skews Chicago Coldest 99th Percentile Hour/Month Wind Chill Temps Chicago Mean and Extreme Lowest 1st Percentile Hourly Relative Humidities Chicago Thunderstorm Frequency Chicago Winds Chicago Fog/Haze Chicago Flying Weather/Ceilings
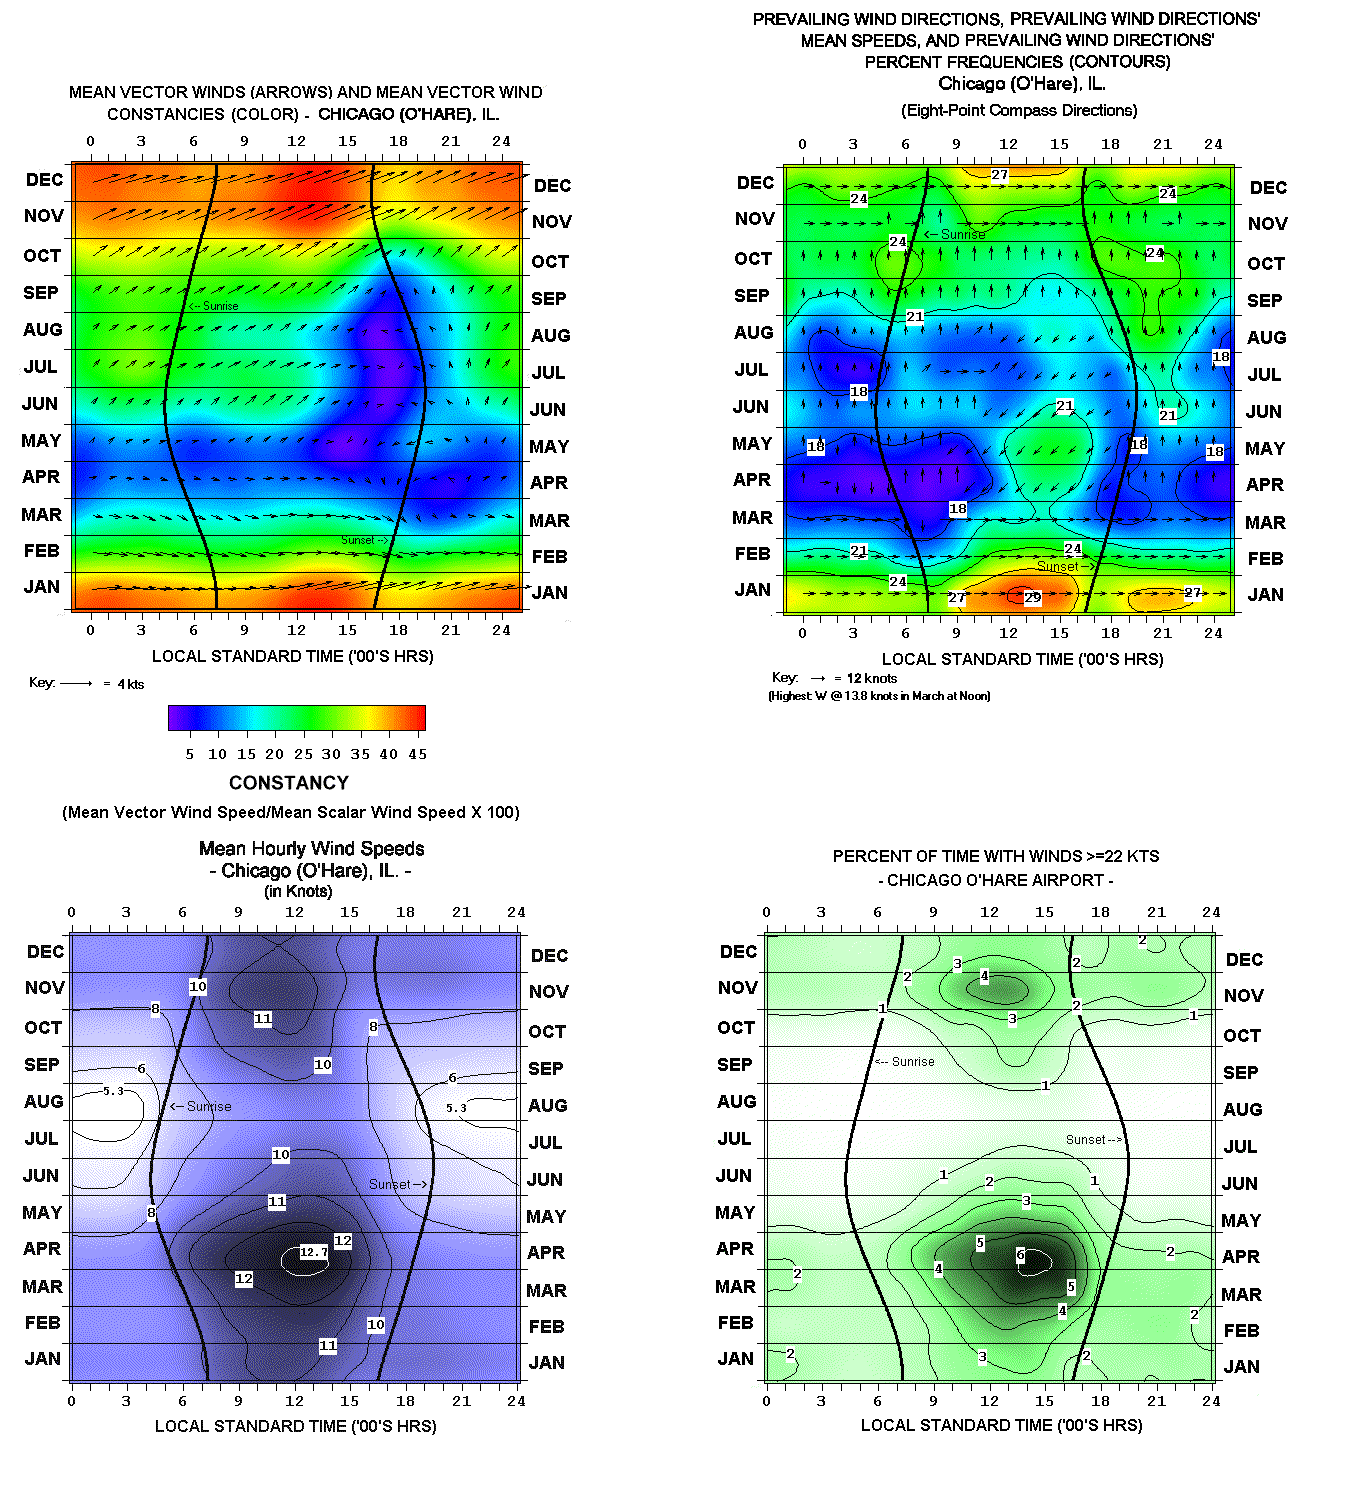
- Chicago WindsChicago Mean Hourly Temperatures & Upper 99th and Lower 1st Percentile Temps by Month/Hour Chicago Hourly Temperatures, by Hour/Month — Means, Stdv’s & Skews Chicago Coldest 99th Percentile Hour/Month Wind Chill Temps Chicago Mean and Extreme Lowest 1st Percentile Hourly Relative Humidities Chicago Thunderstorm Frequency Chicago Winds Chicago Fog/Haze Chicago Flying Weather/Ceilings
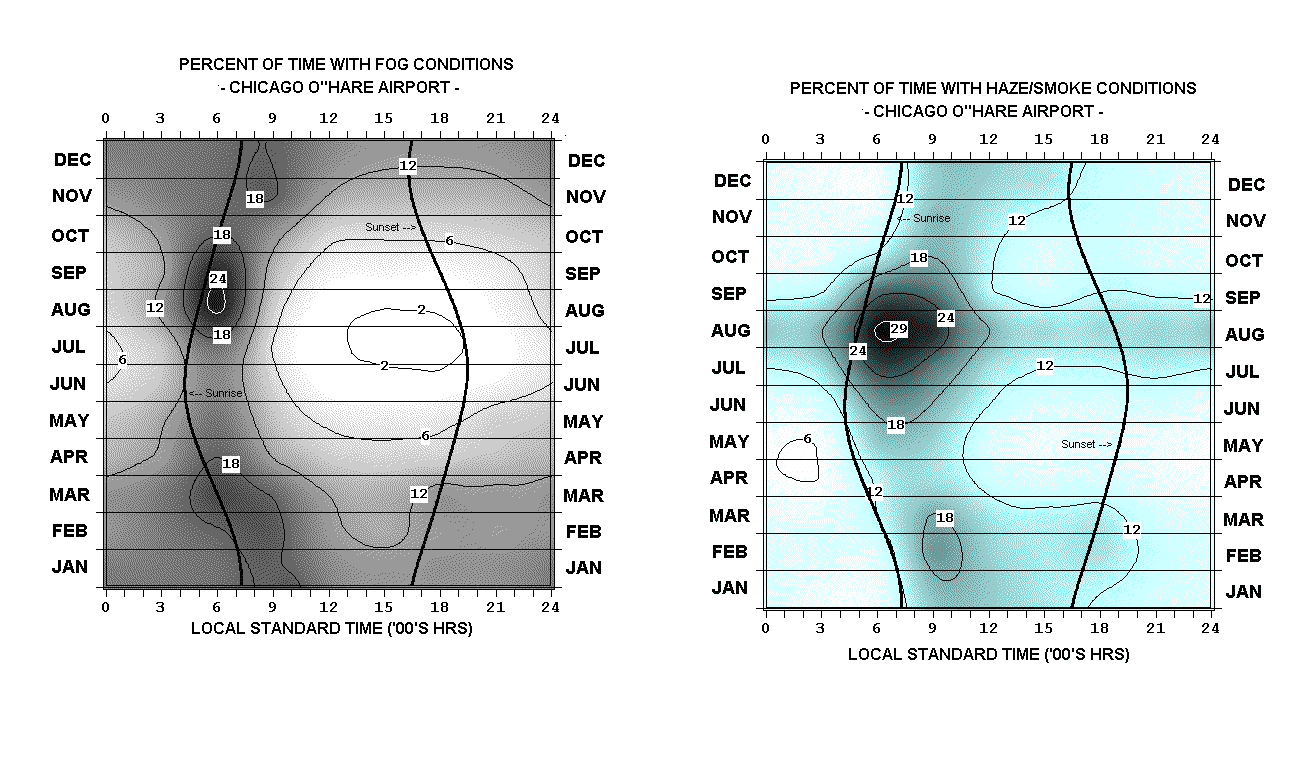
- Chicago Fog/HazeChicago Mean Hourly Temperatures & Upper 99th and Lower 1st Percentile Temps by Month/Hour Chicago Hourly Temperatures, by Hour/Month — Means, Stdv’s & Skews Chicago Coldest 99th Percentile Hour/Month Wind Chill Temps Chicago Mean and Extreme Lowest 1st Percentile Hourly Relative Humidities Chicago Thunderstorm Frequency Chicago Winds Chicago Fog/Haze Chicago Flying Weather/Ceilings
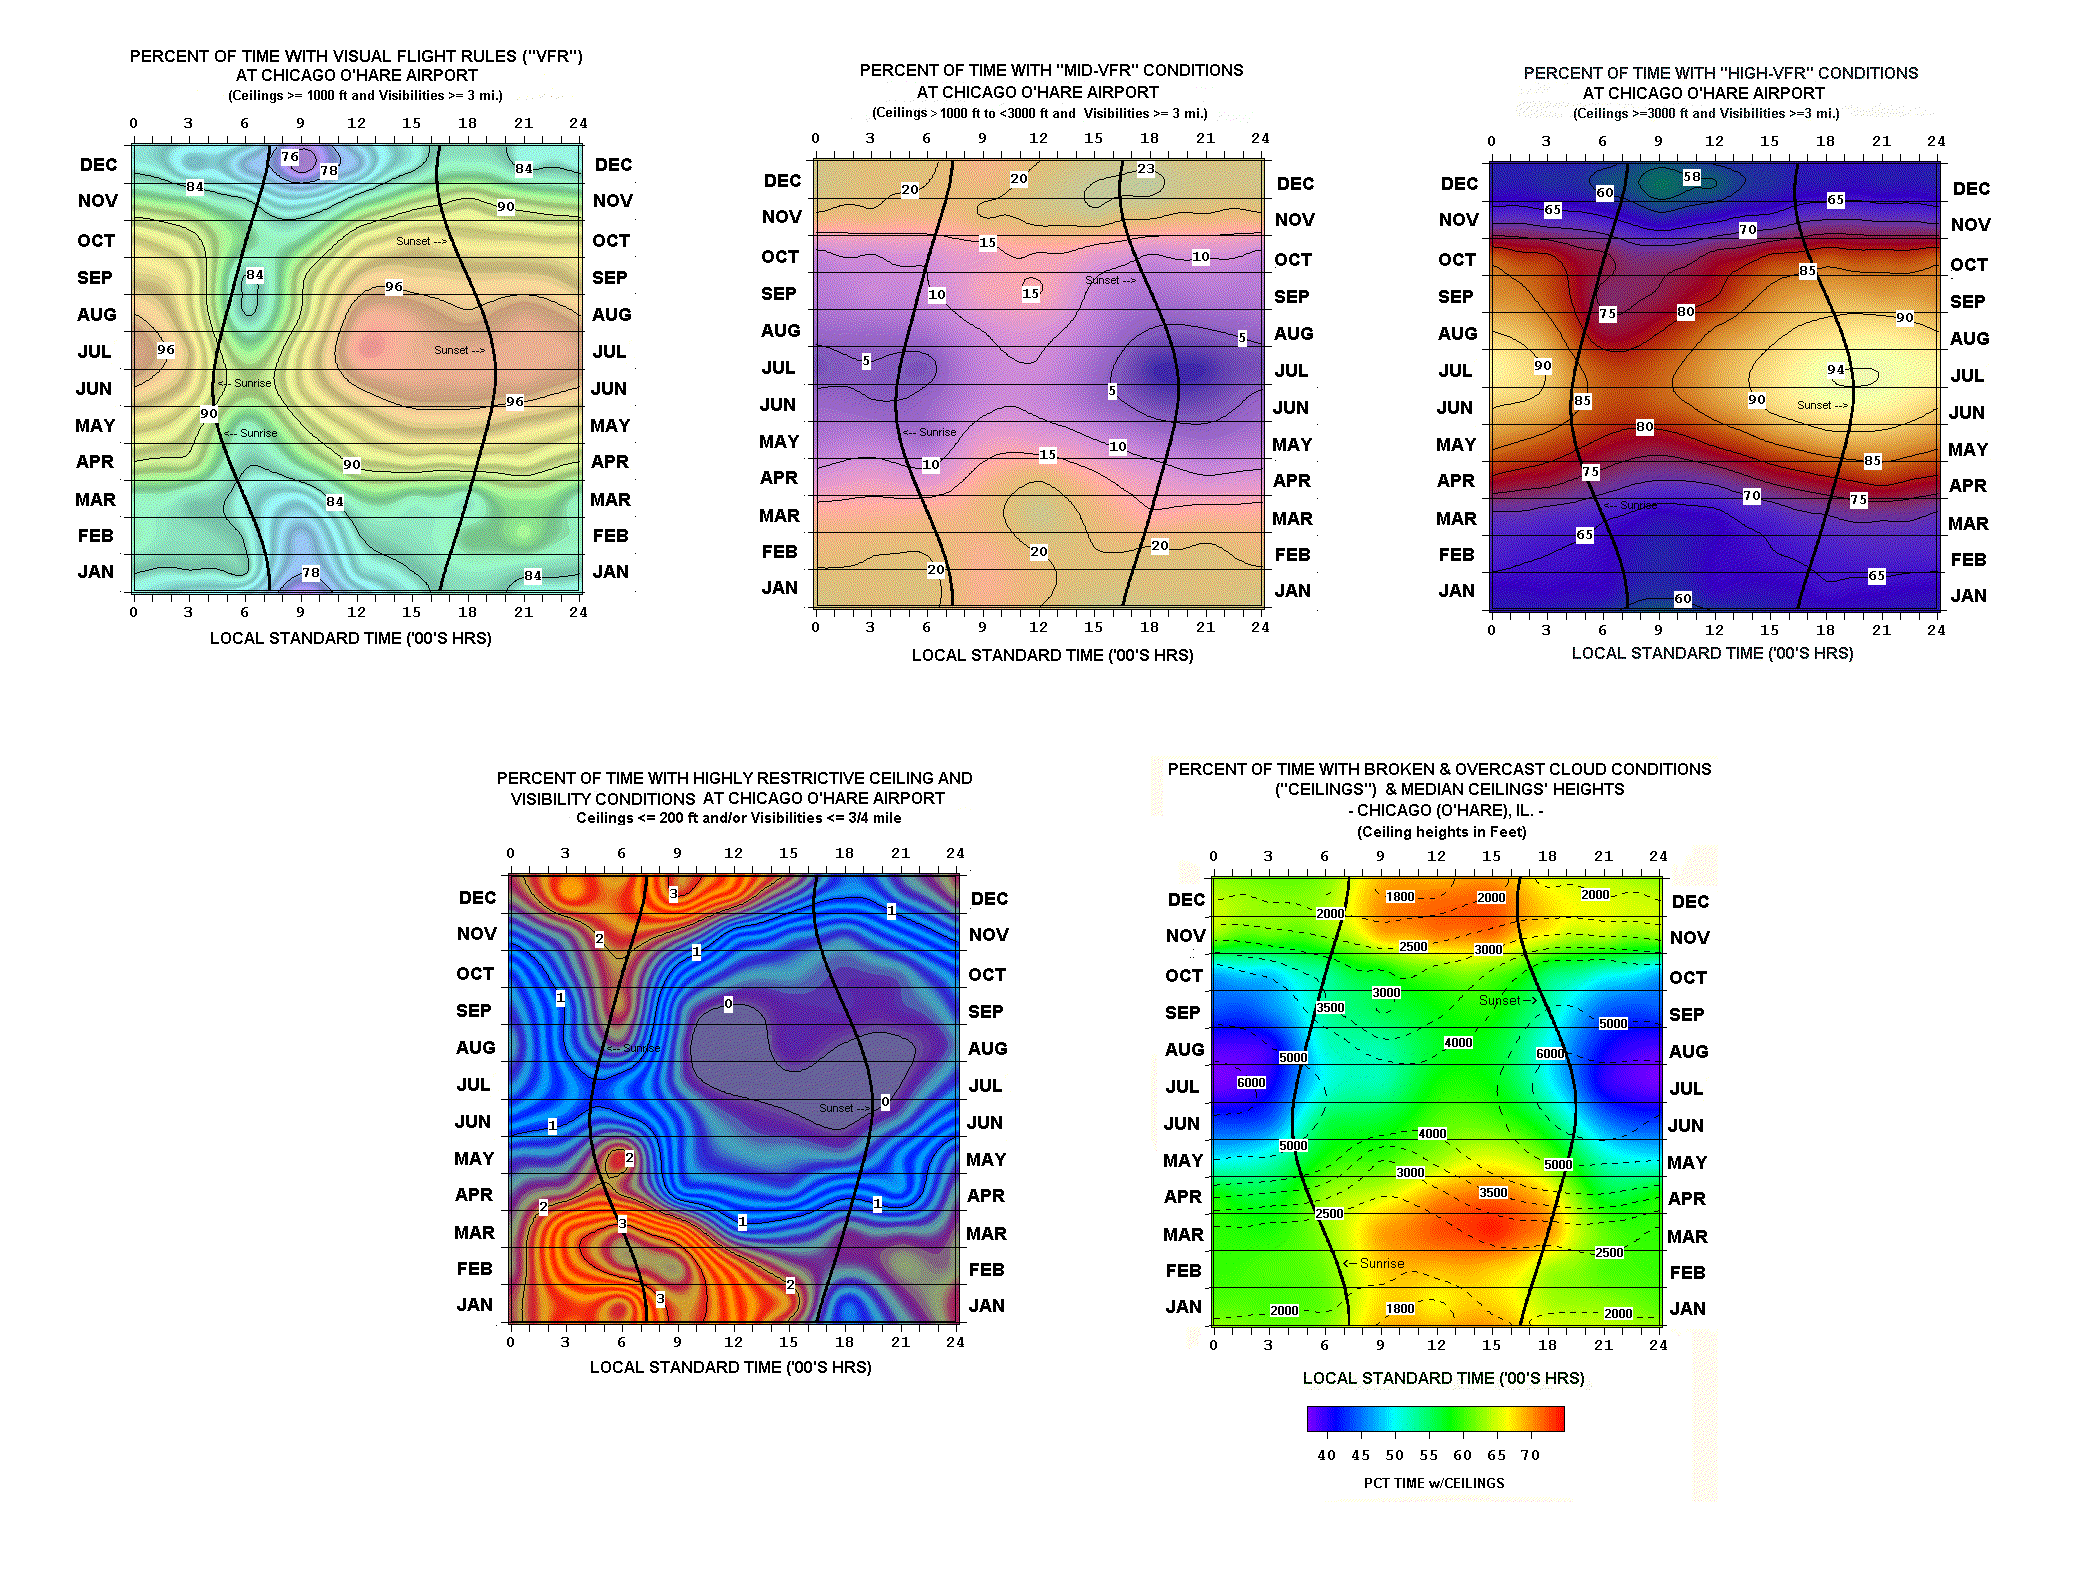
- Chicago Flying Weather/CeilingsChicago Mean Hourly Temperatures & Upper 99th and Lower 1st Percentile Temps by Month/Hour Chicago Hourly Temperatures, by Hour/Month — Means, Stdv’s & Skews Chicago Coldest 99th Percentile Hour/Month Wind Chill Temps Chicago Mean and Extreme Lowest 1st Percentile Hourly Relative Humidities Chicago Thunderstorm Frequency Chicago Winds Chicago Fog/Haze Chicago Flying Weather/Ceilings
Introduction
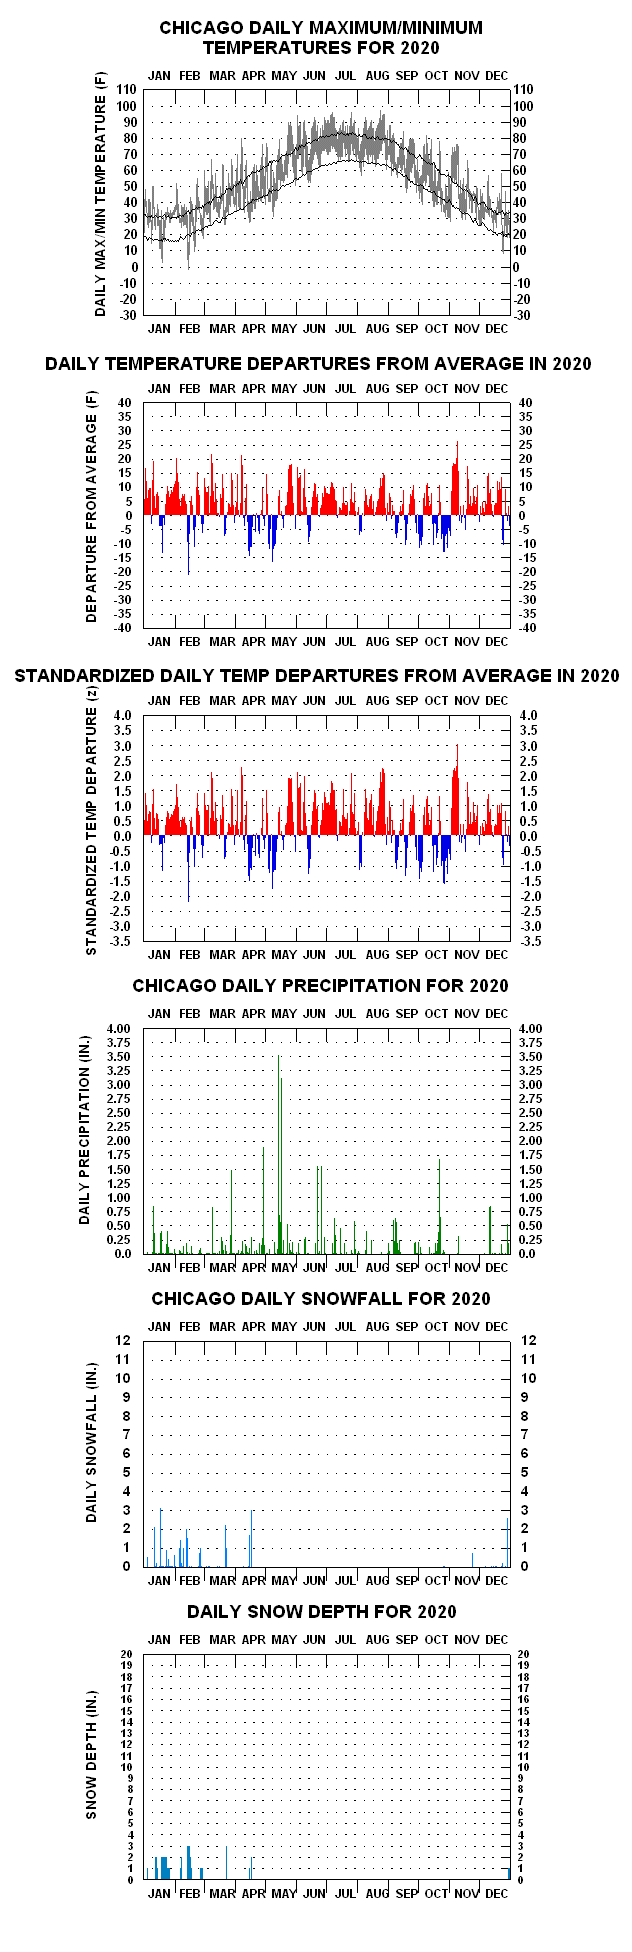
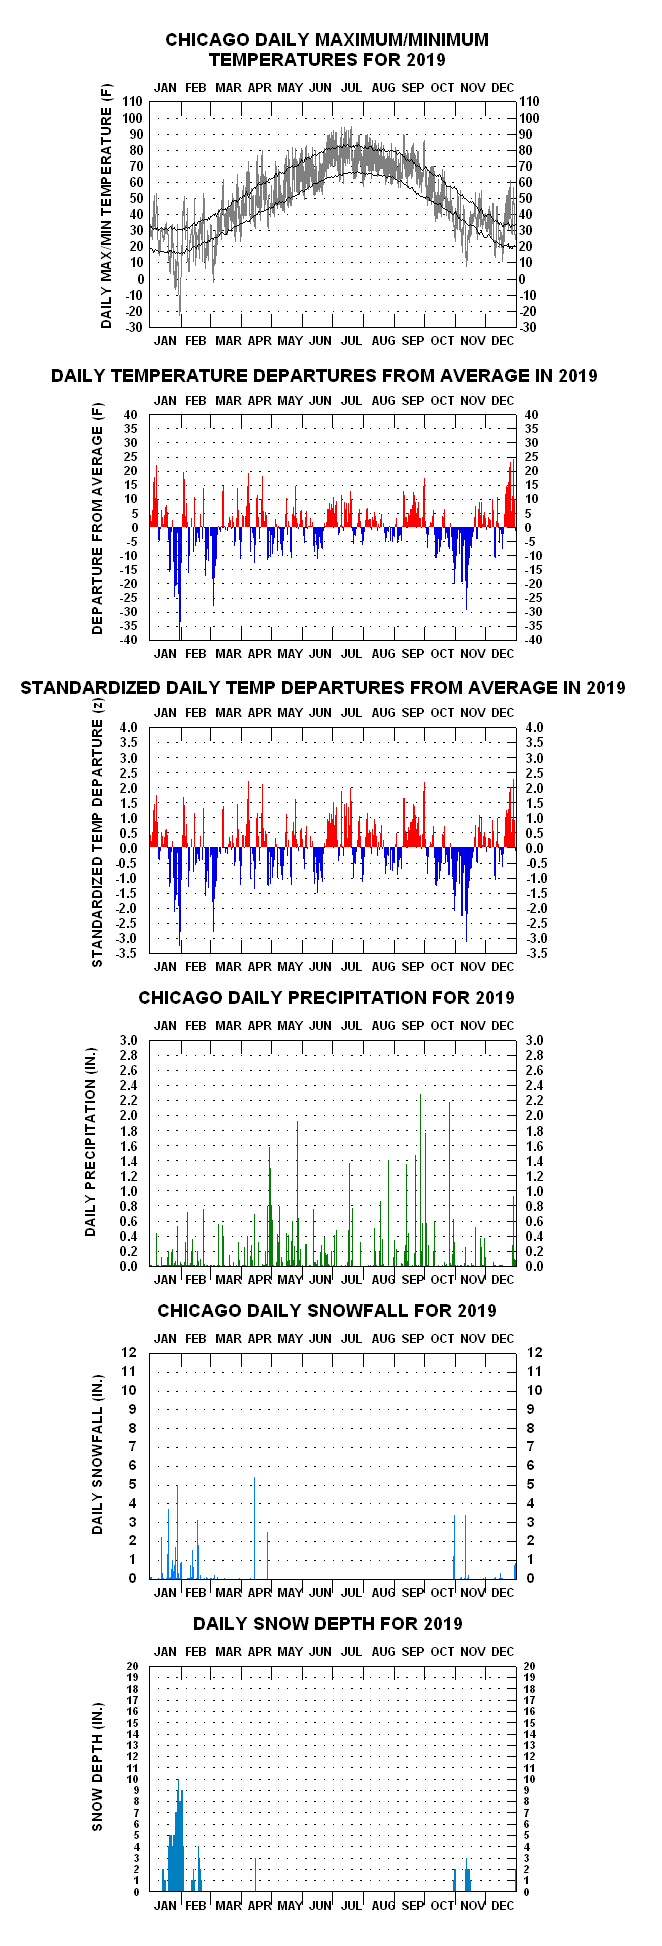
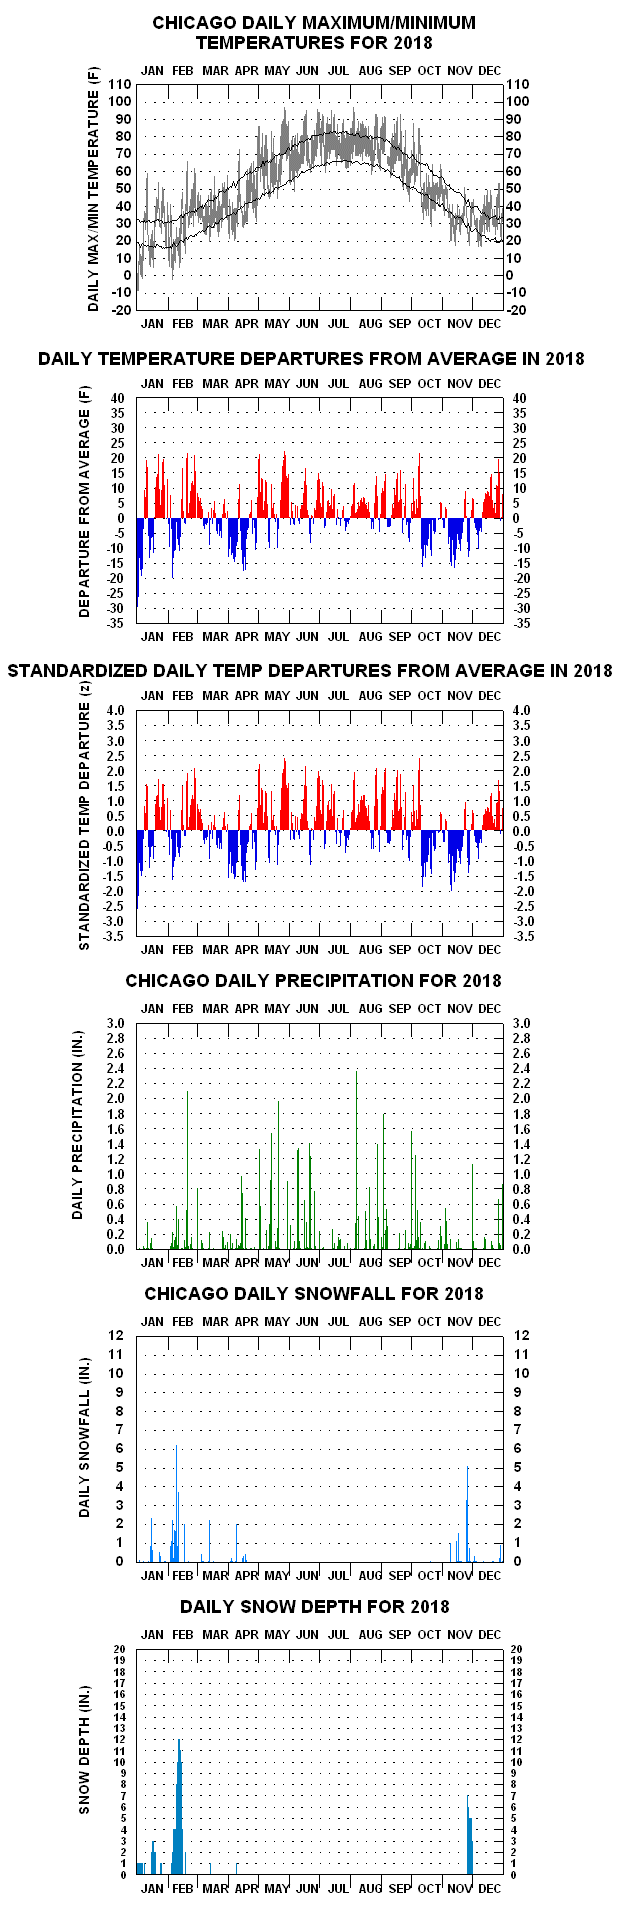
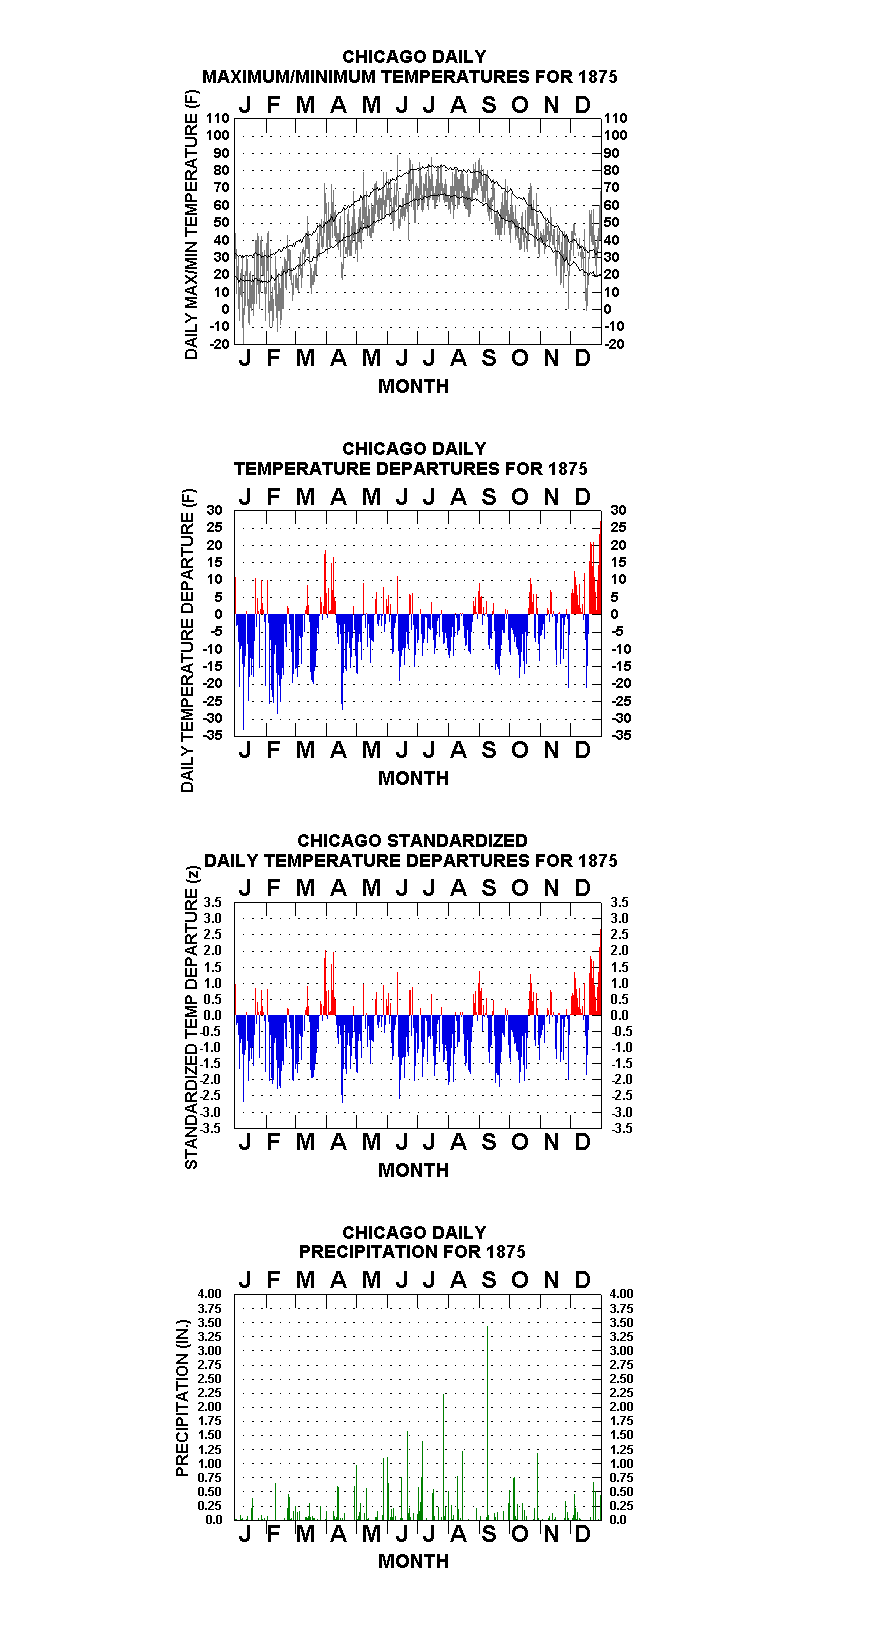
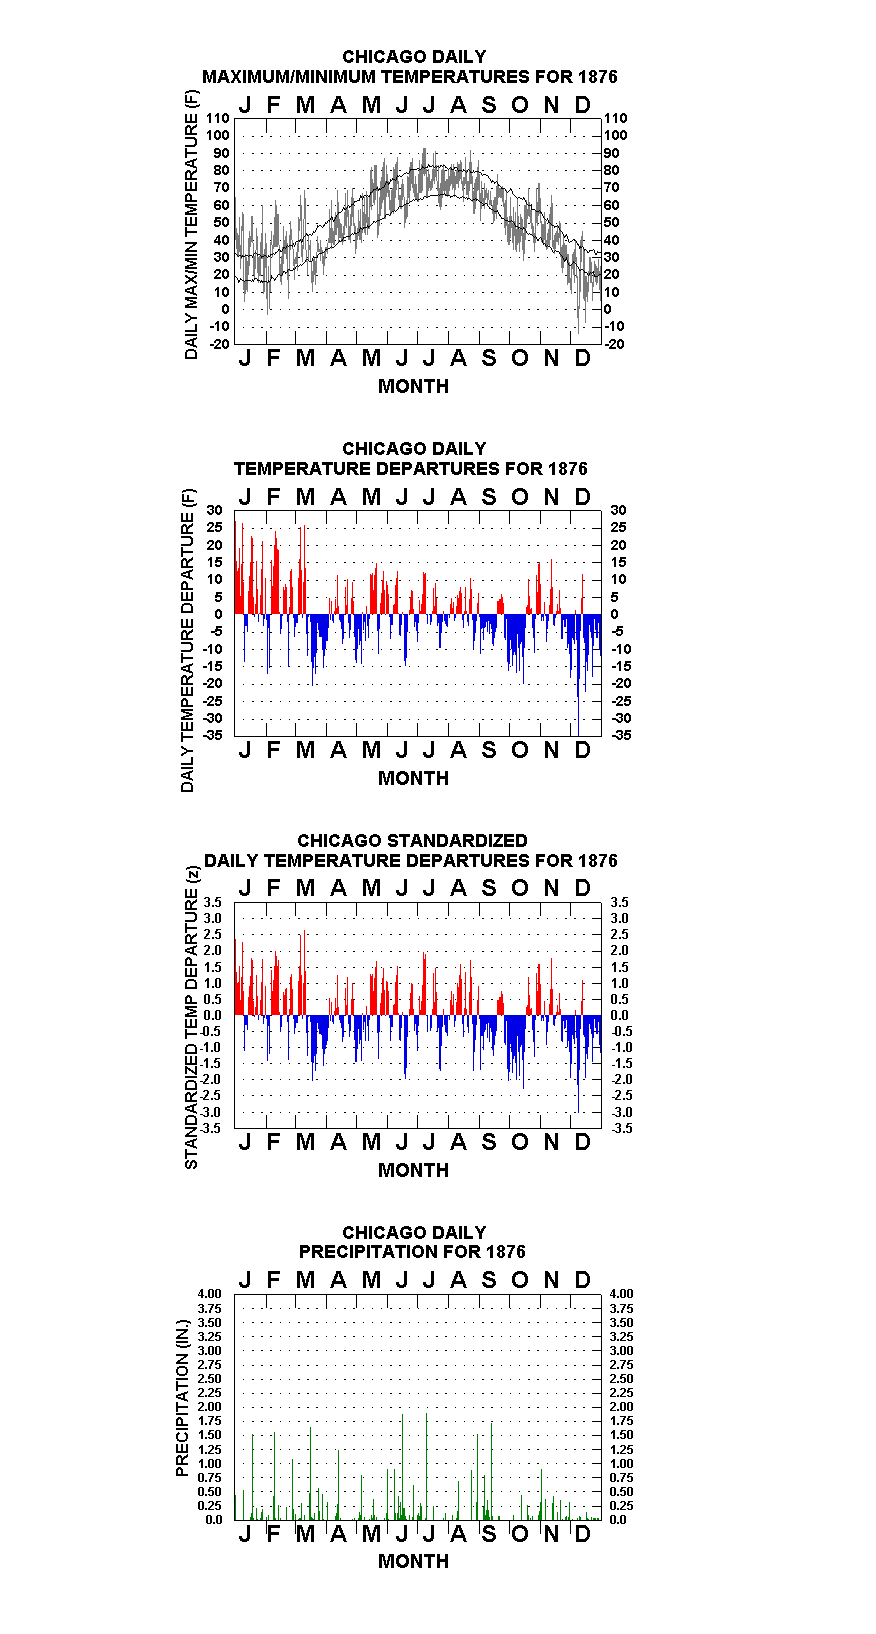
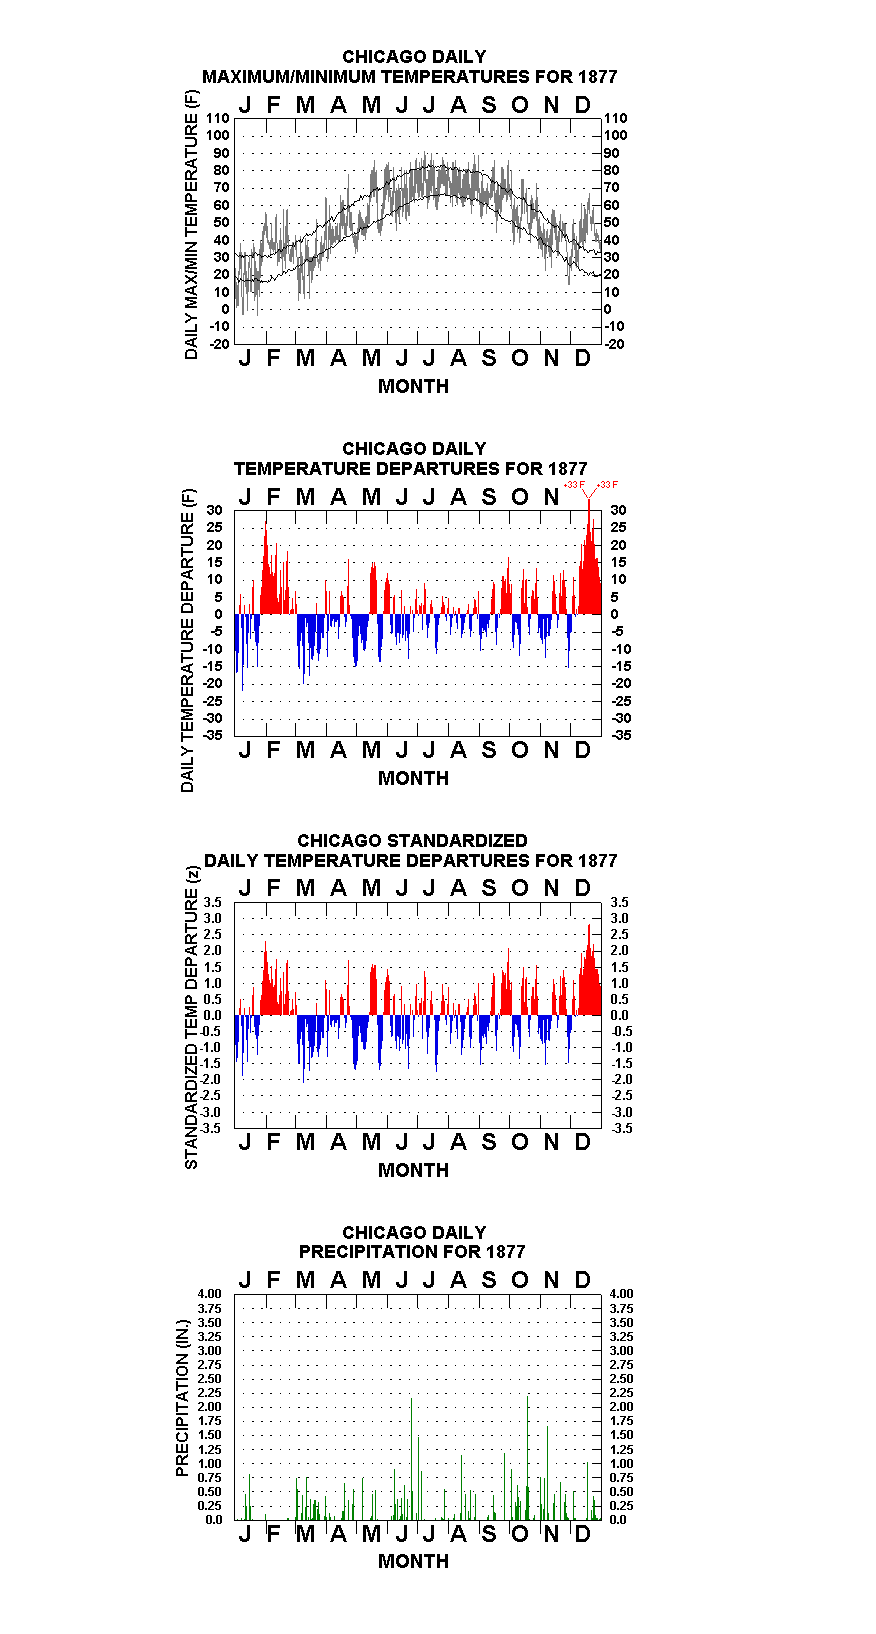
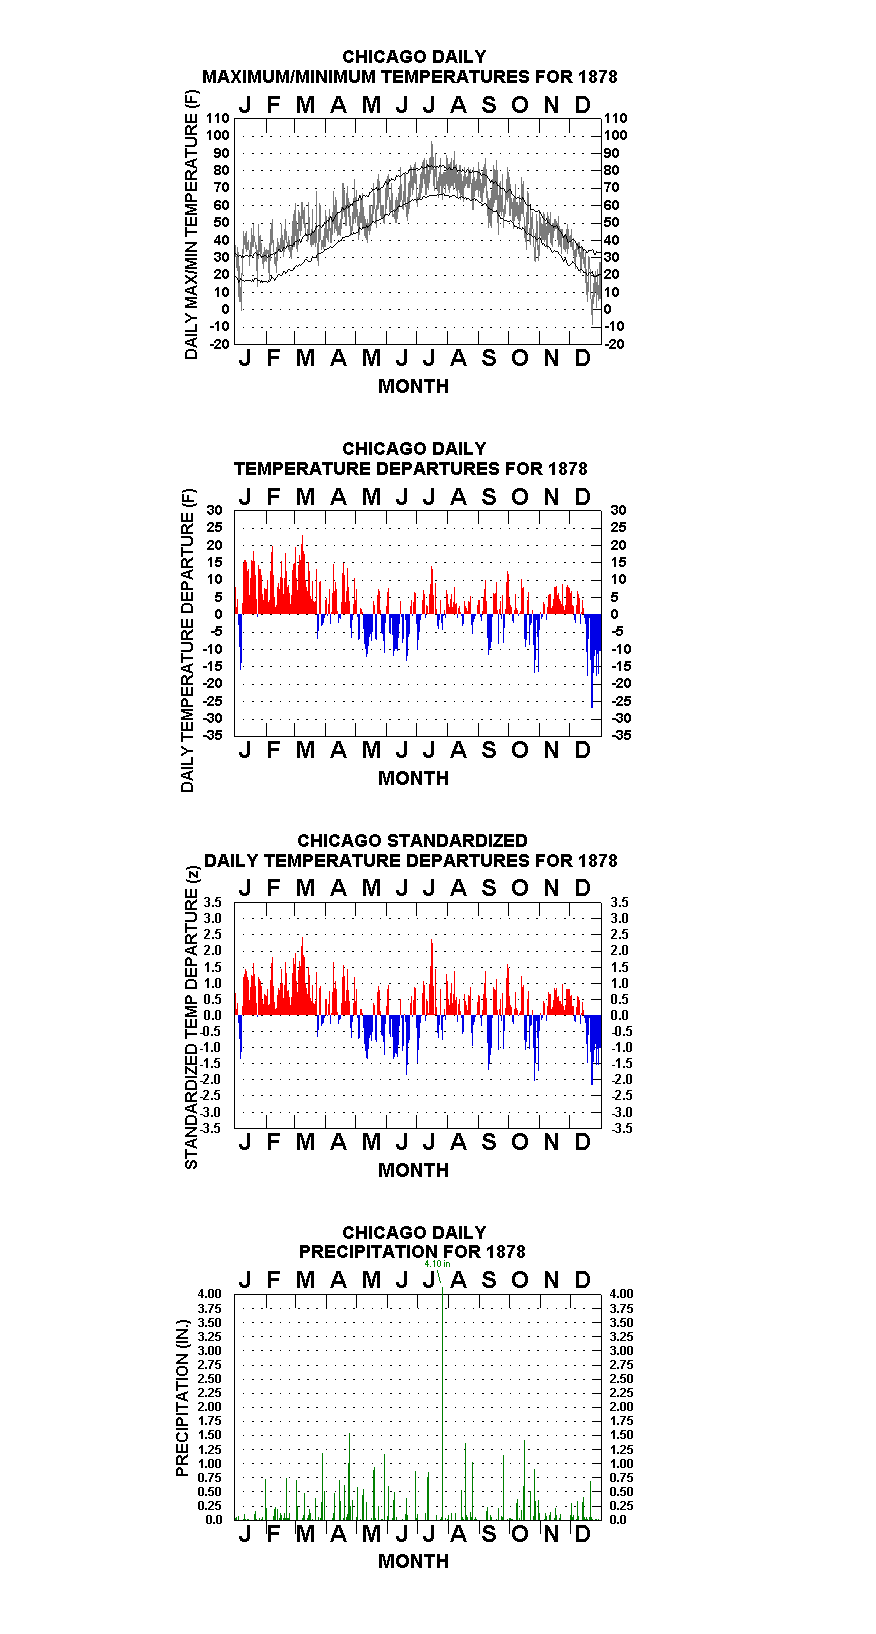
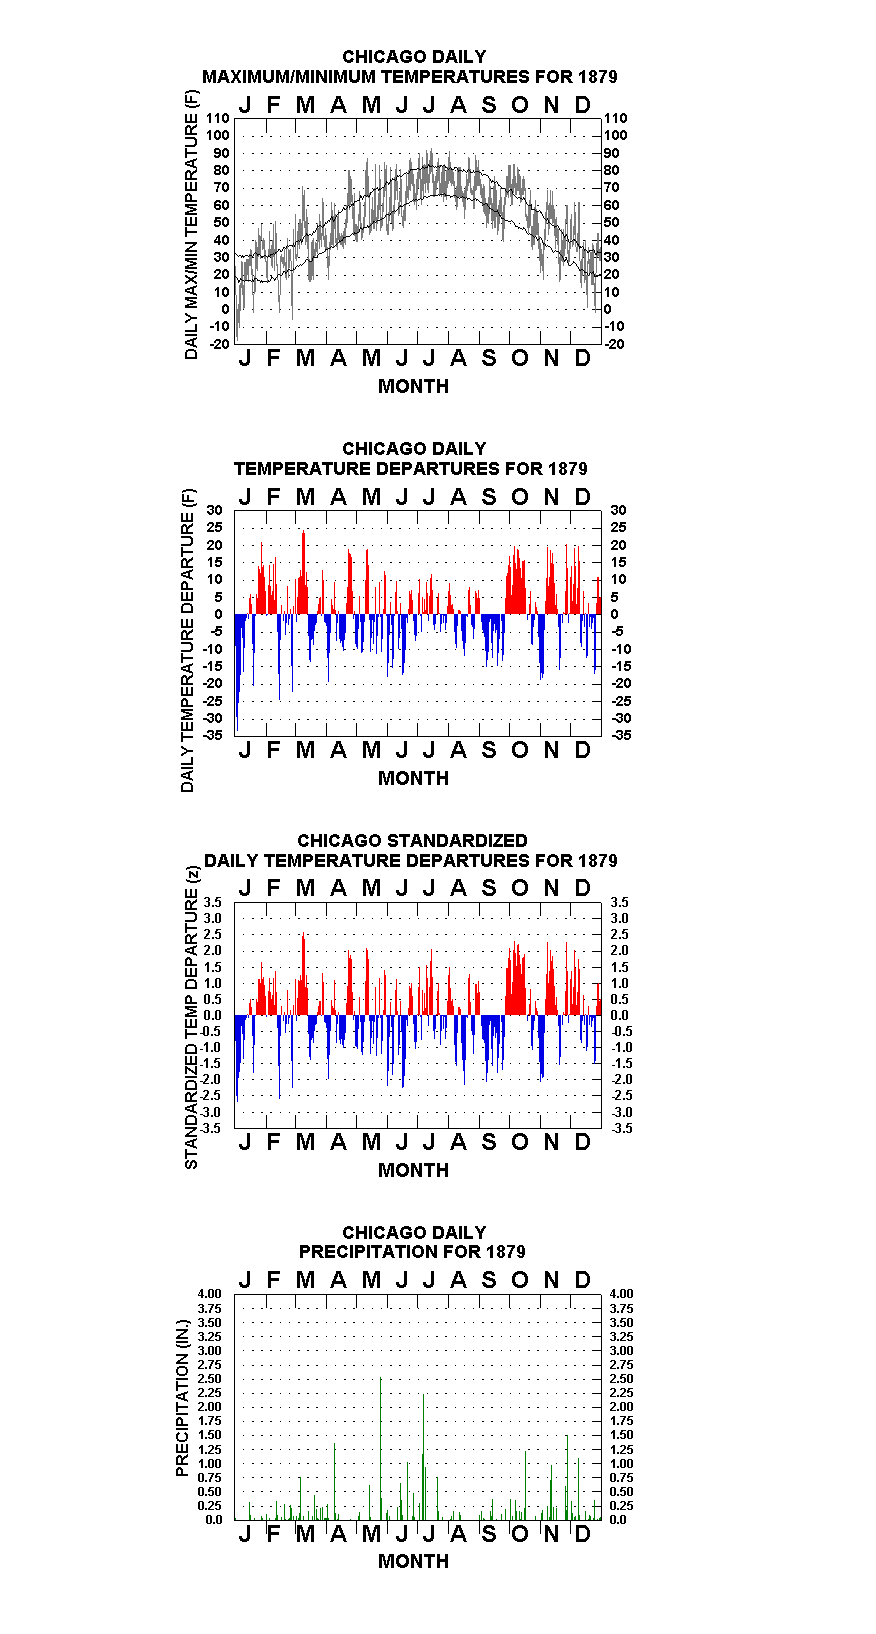
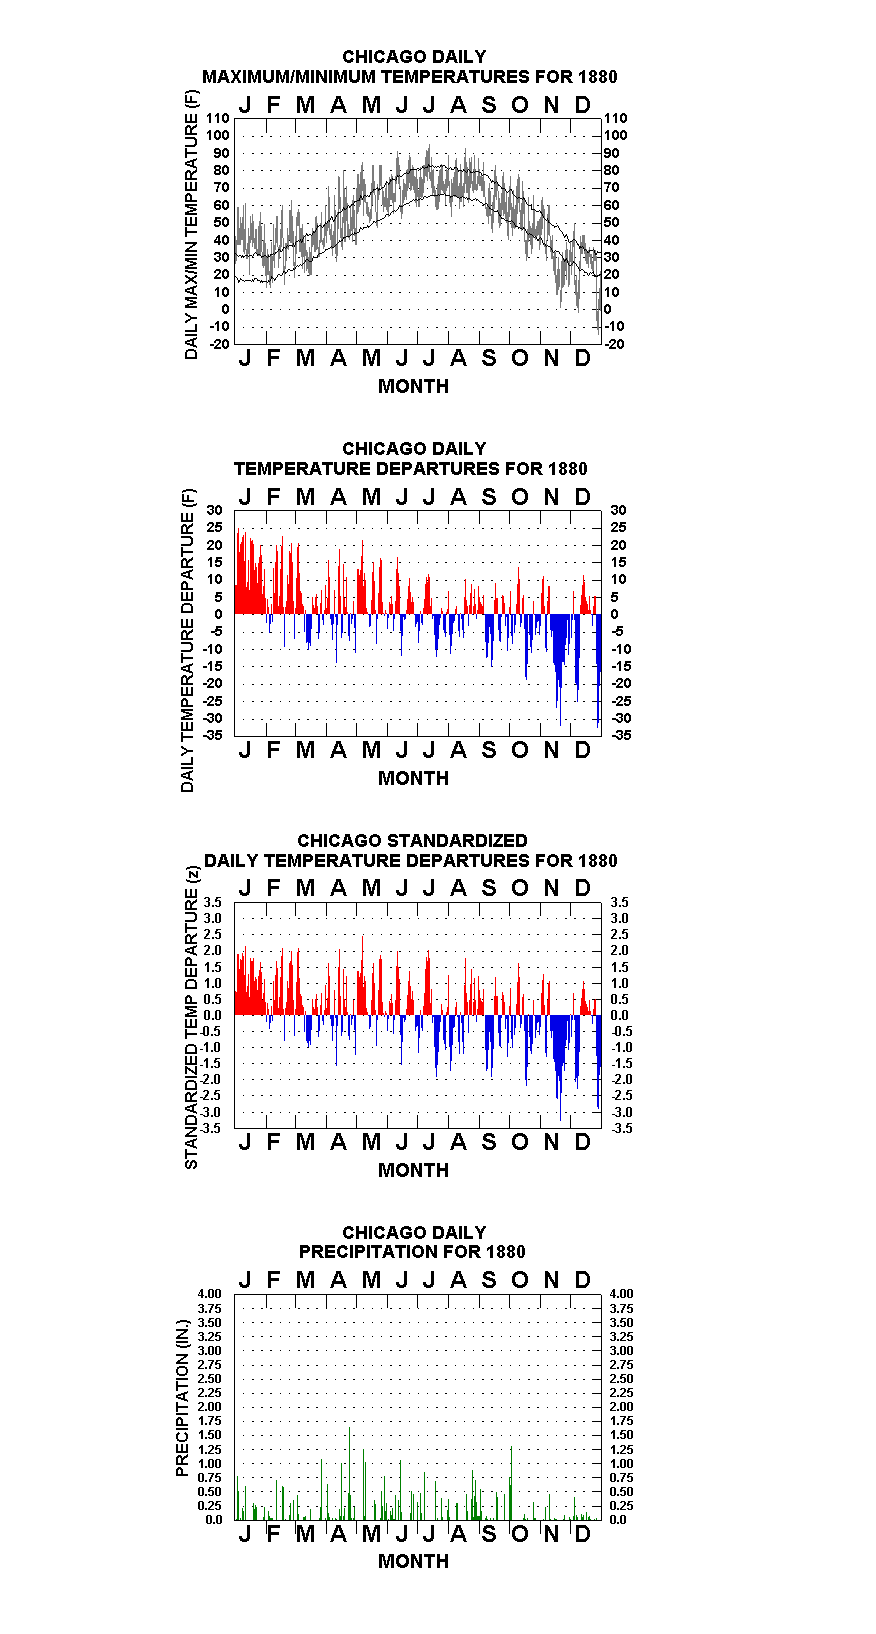
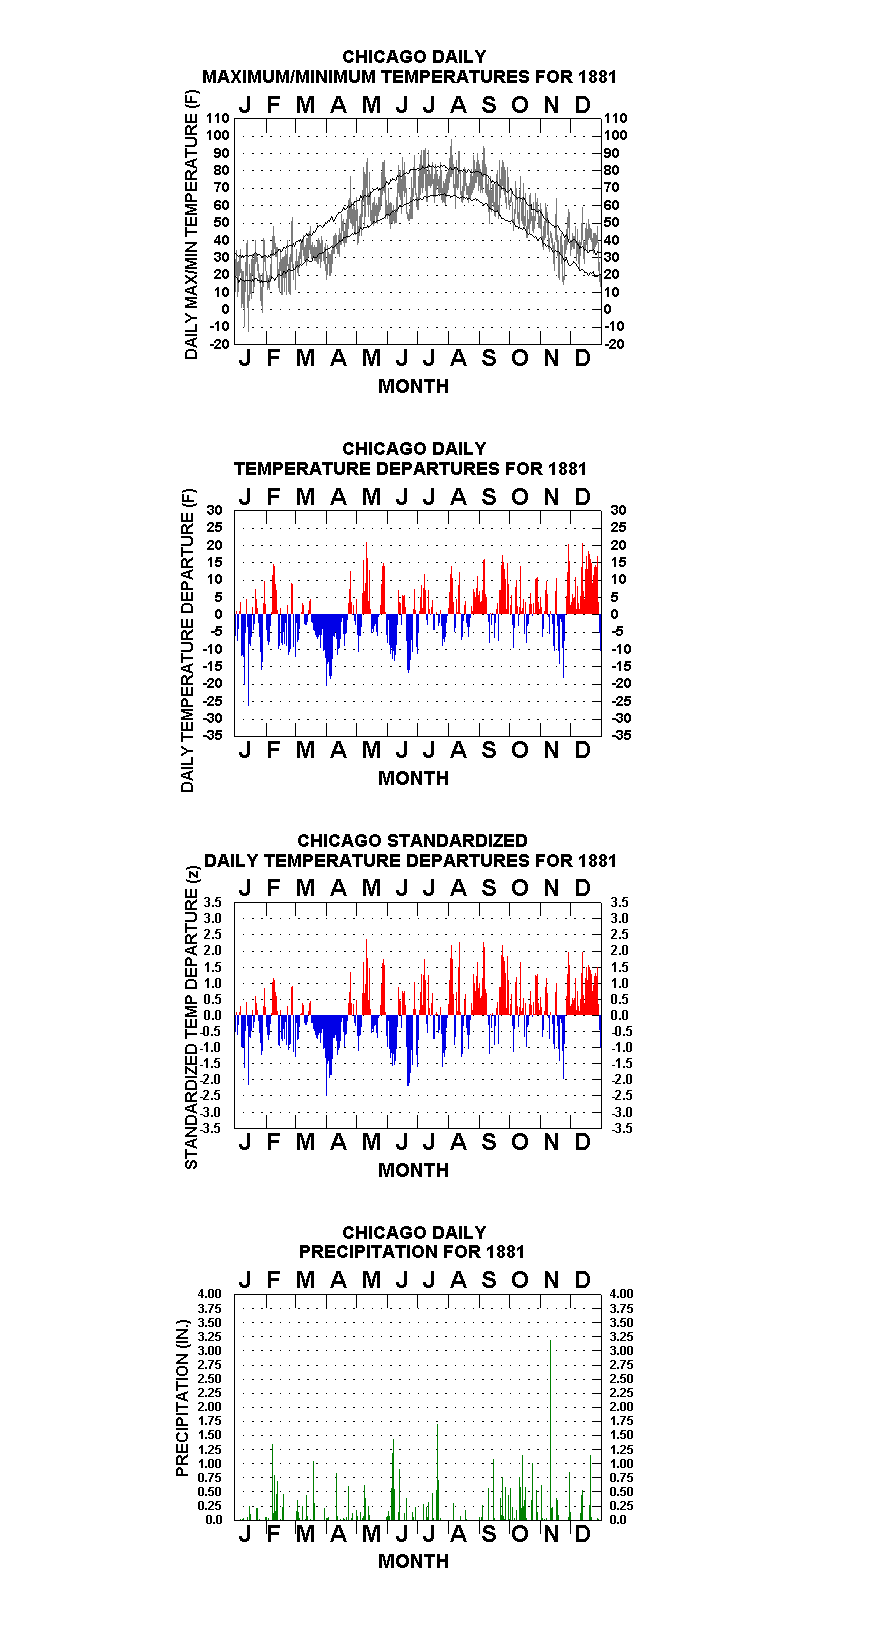
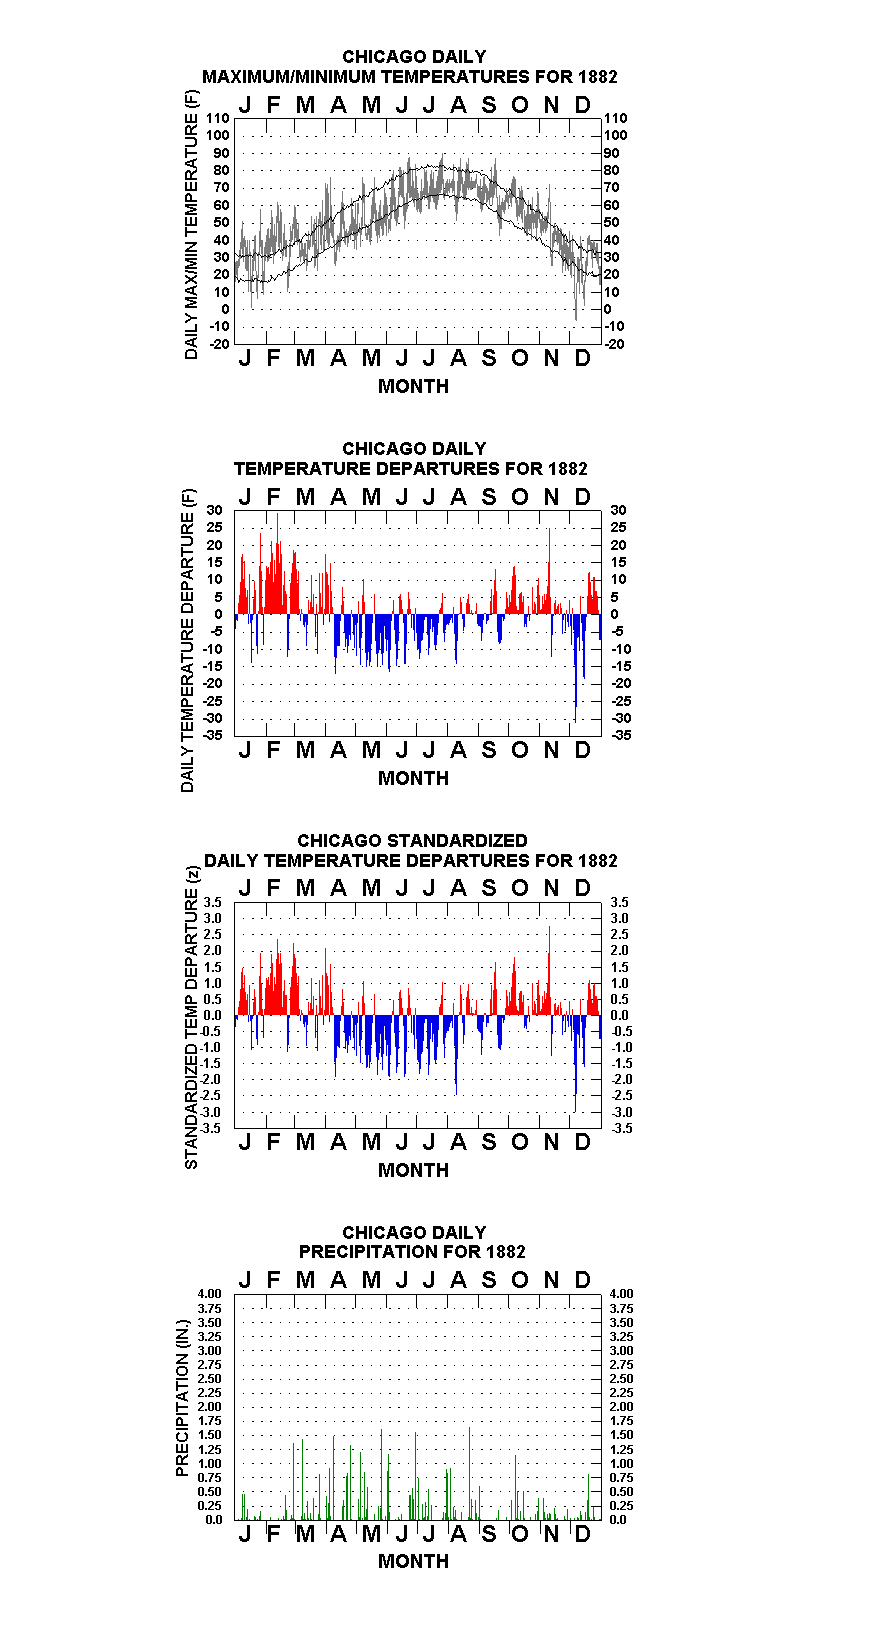
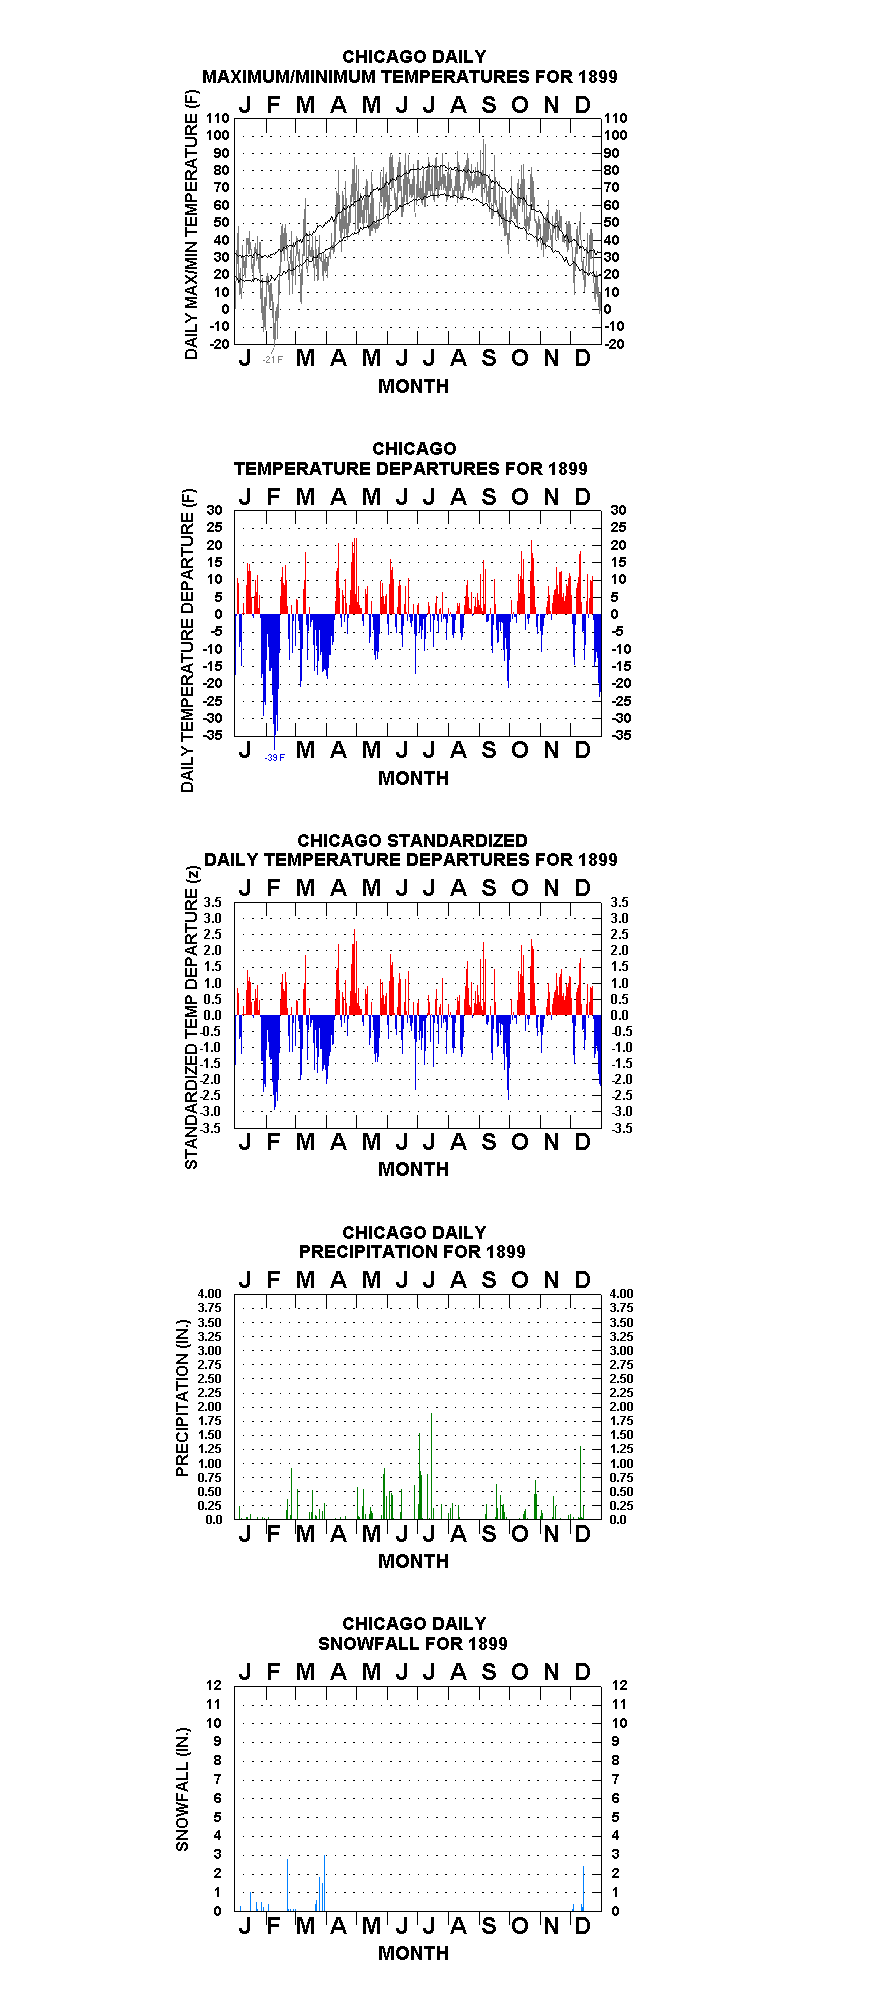
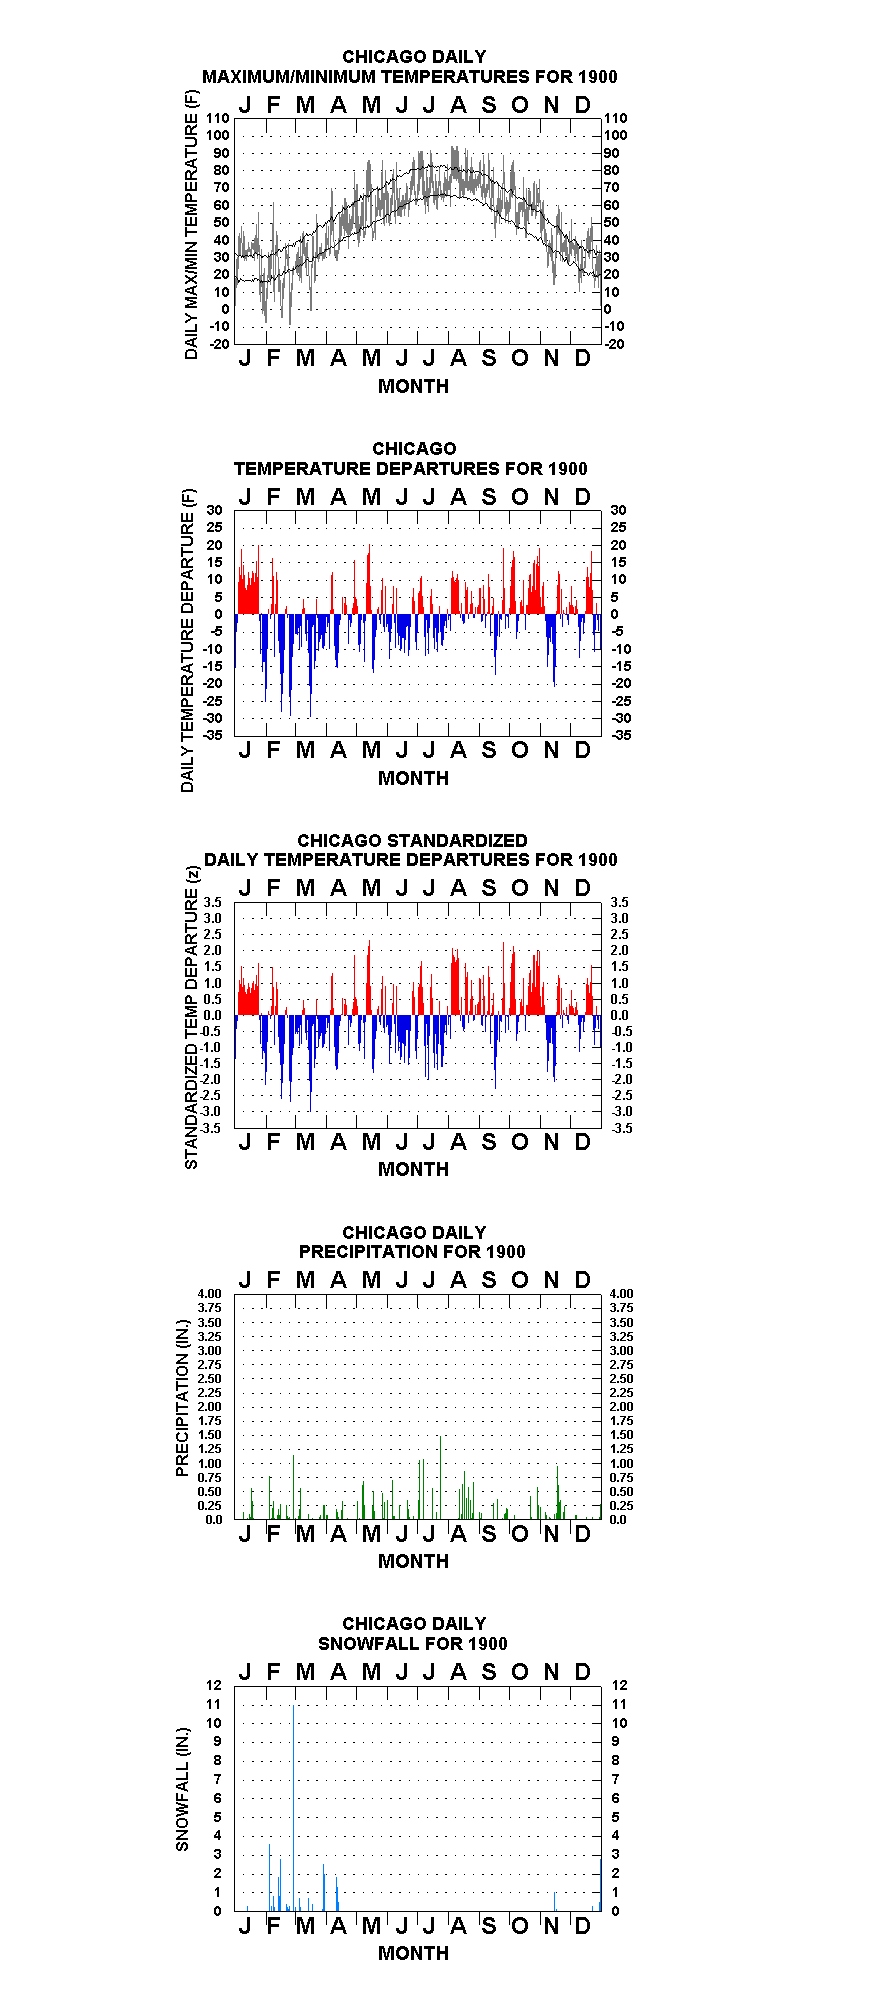
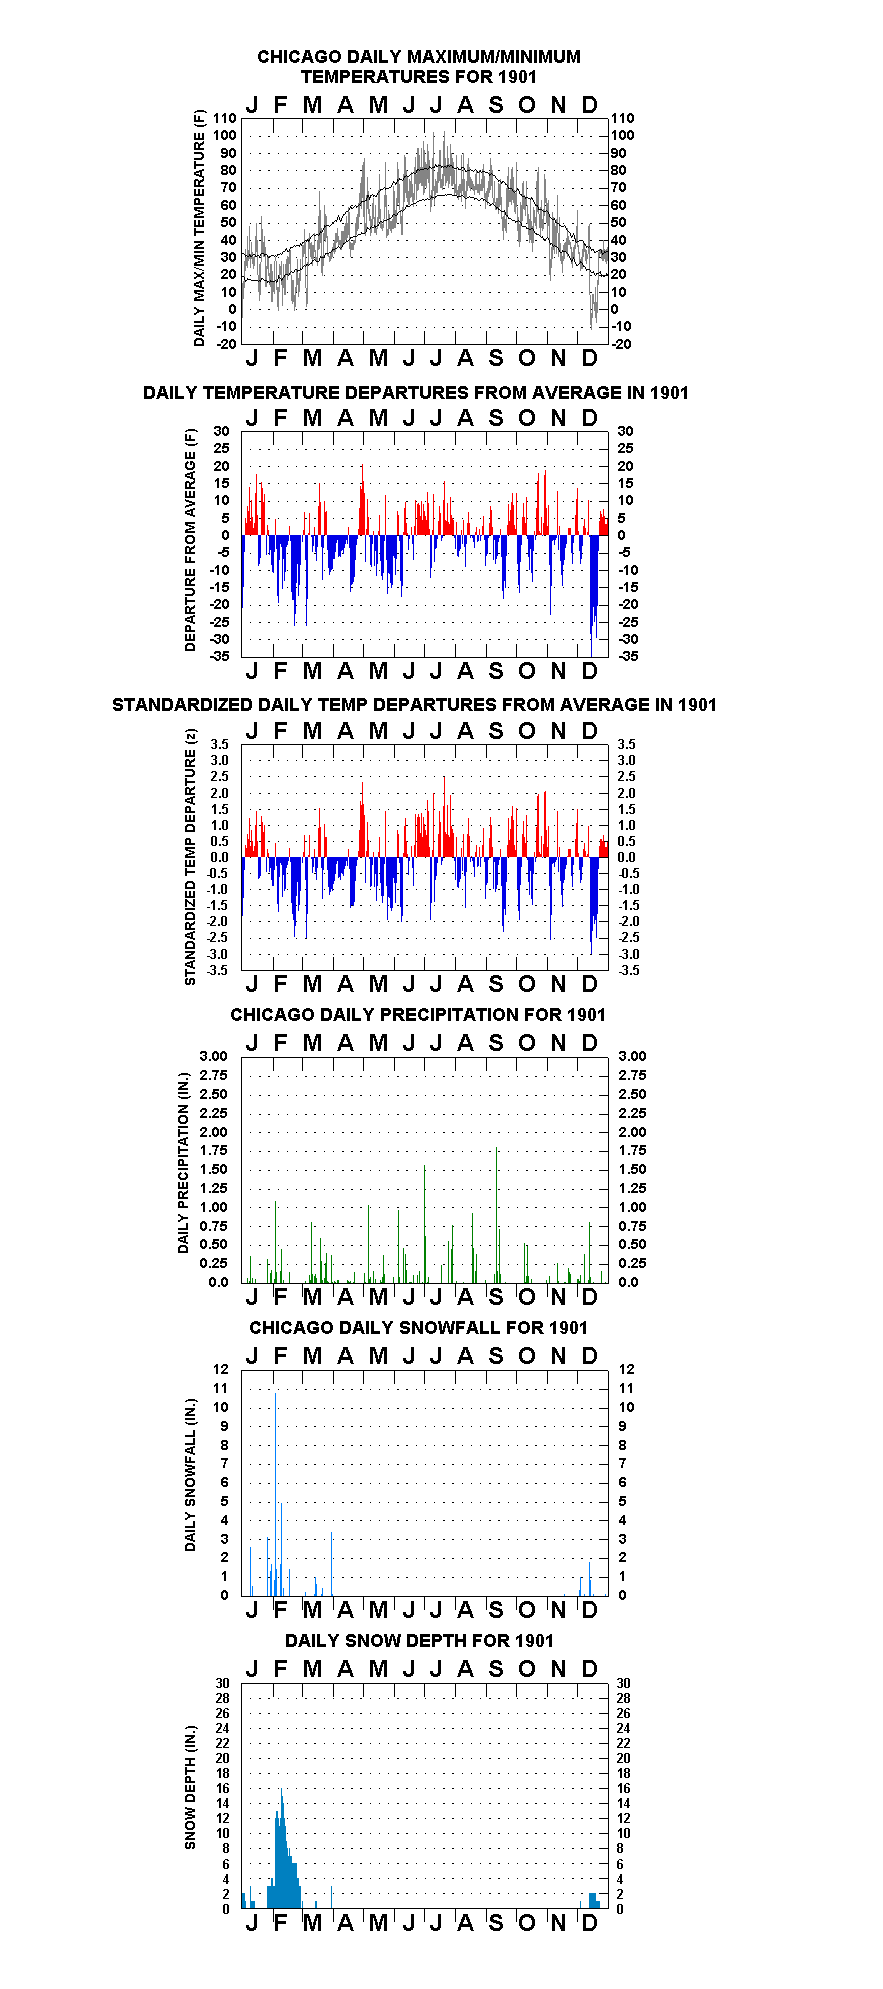
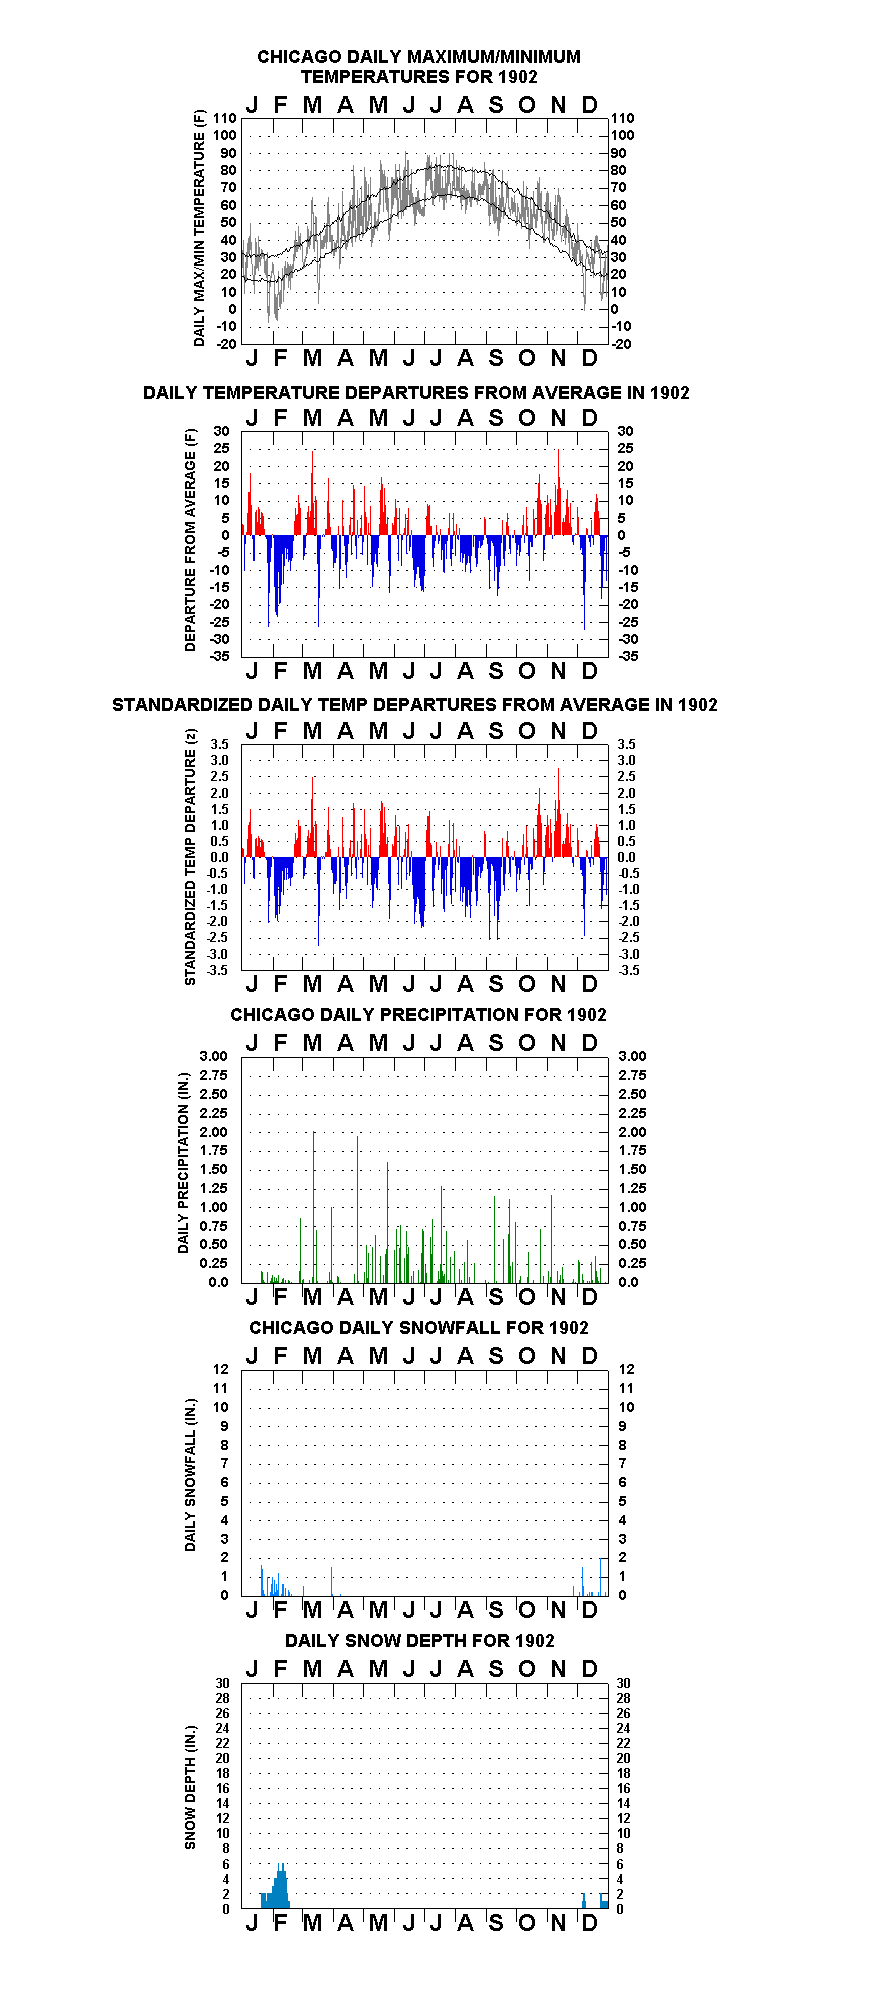
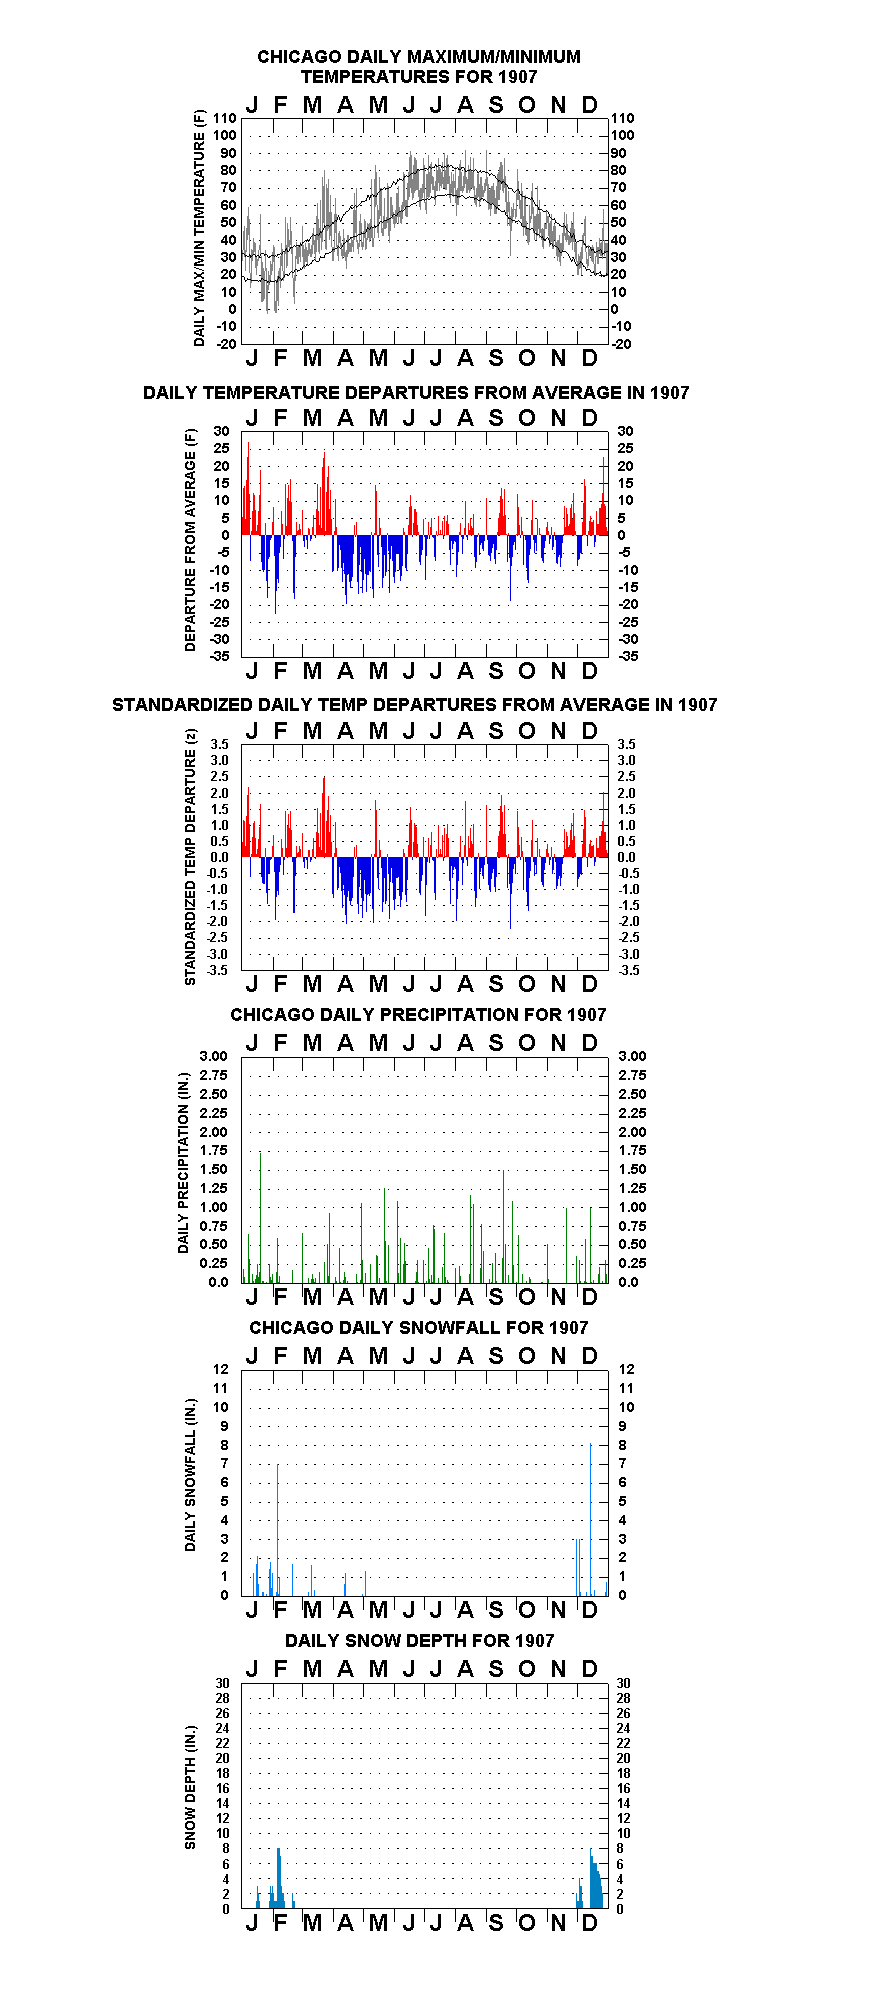
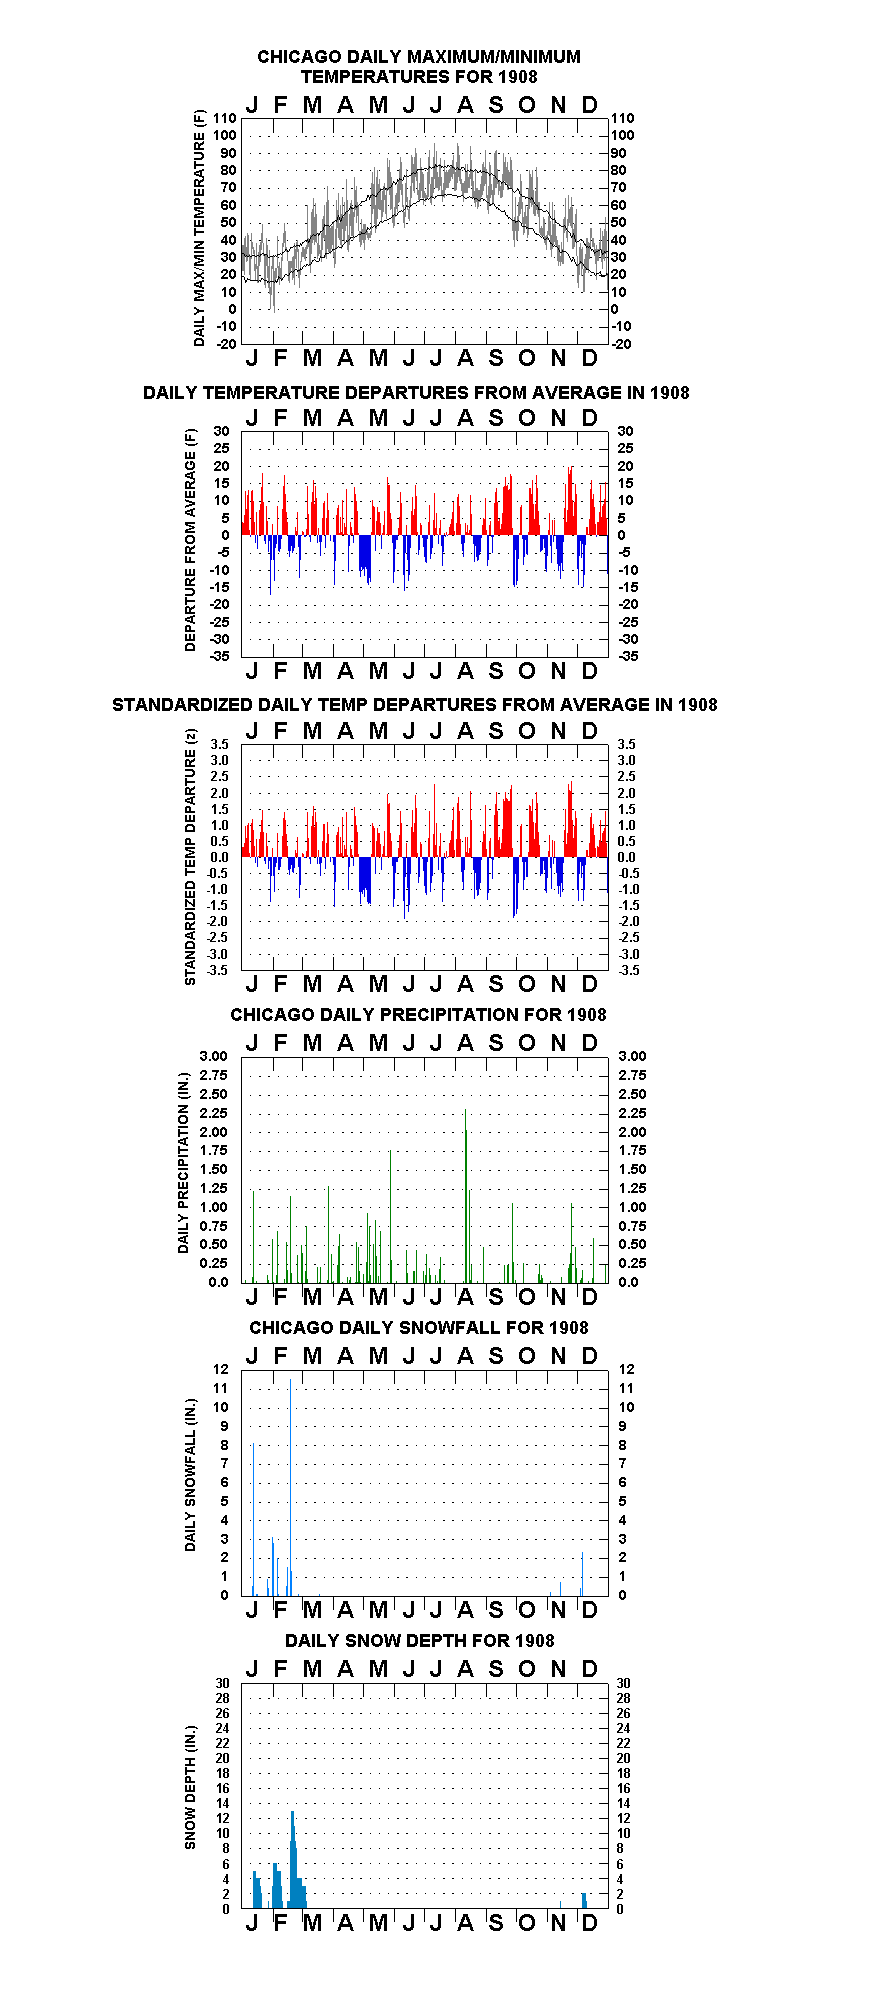
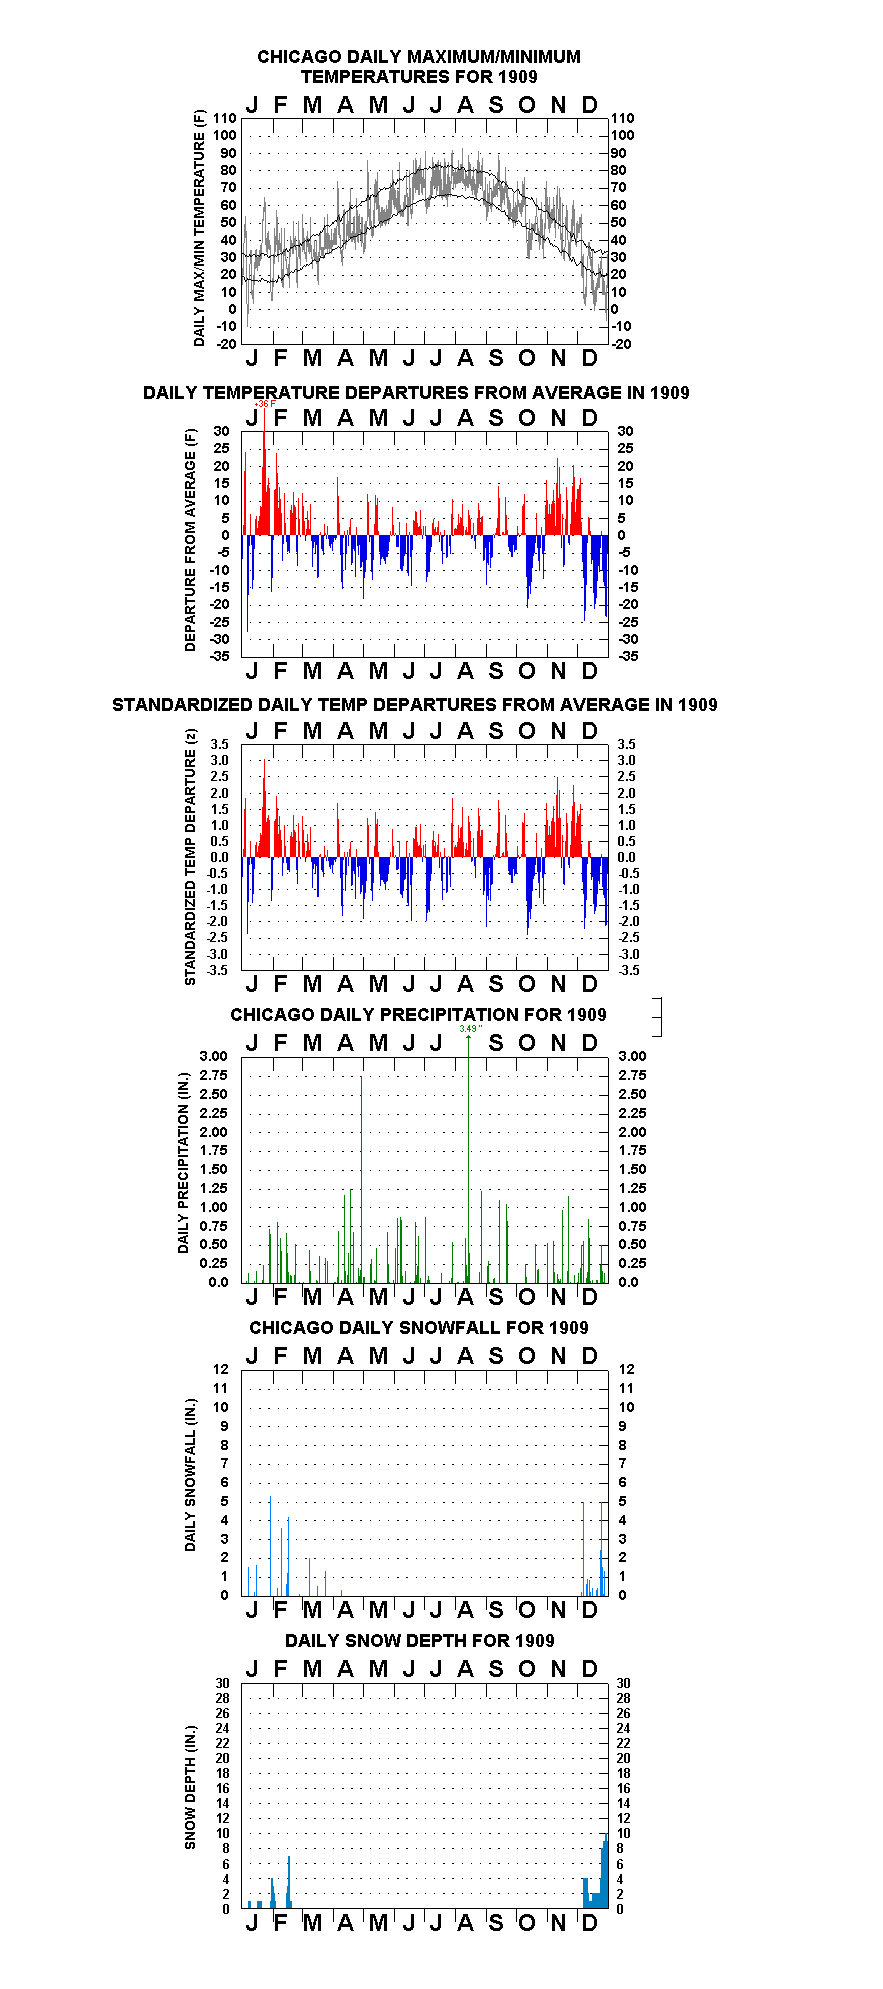
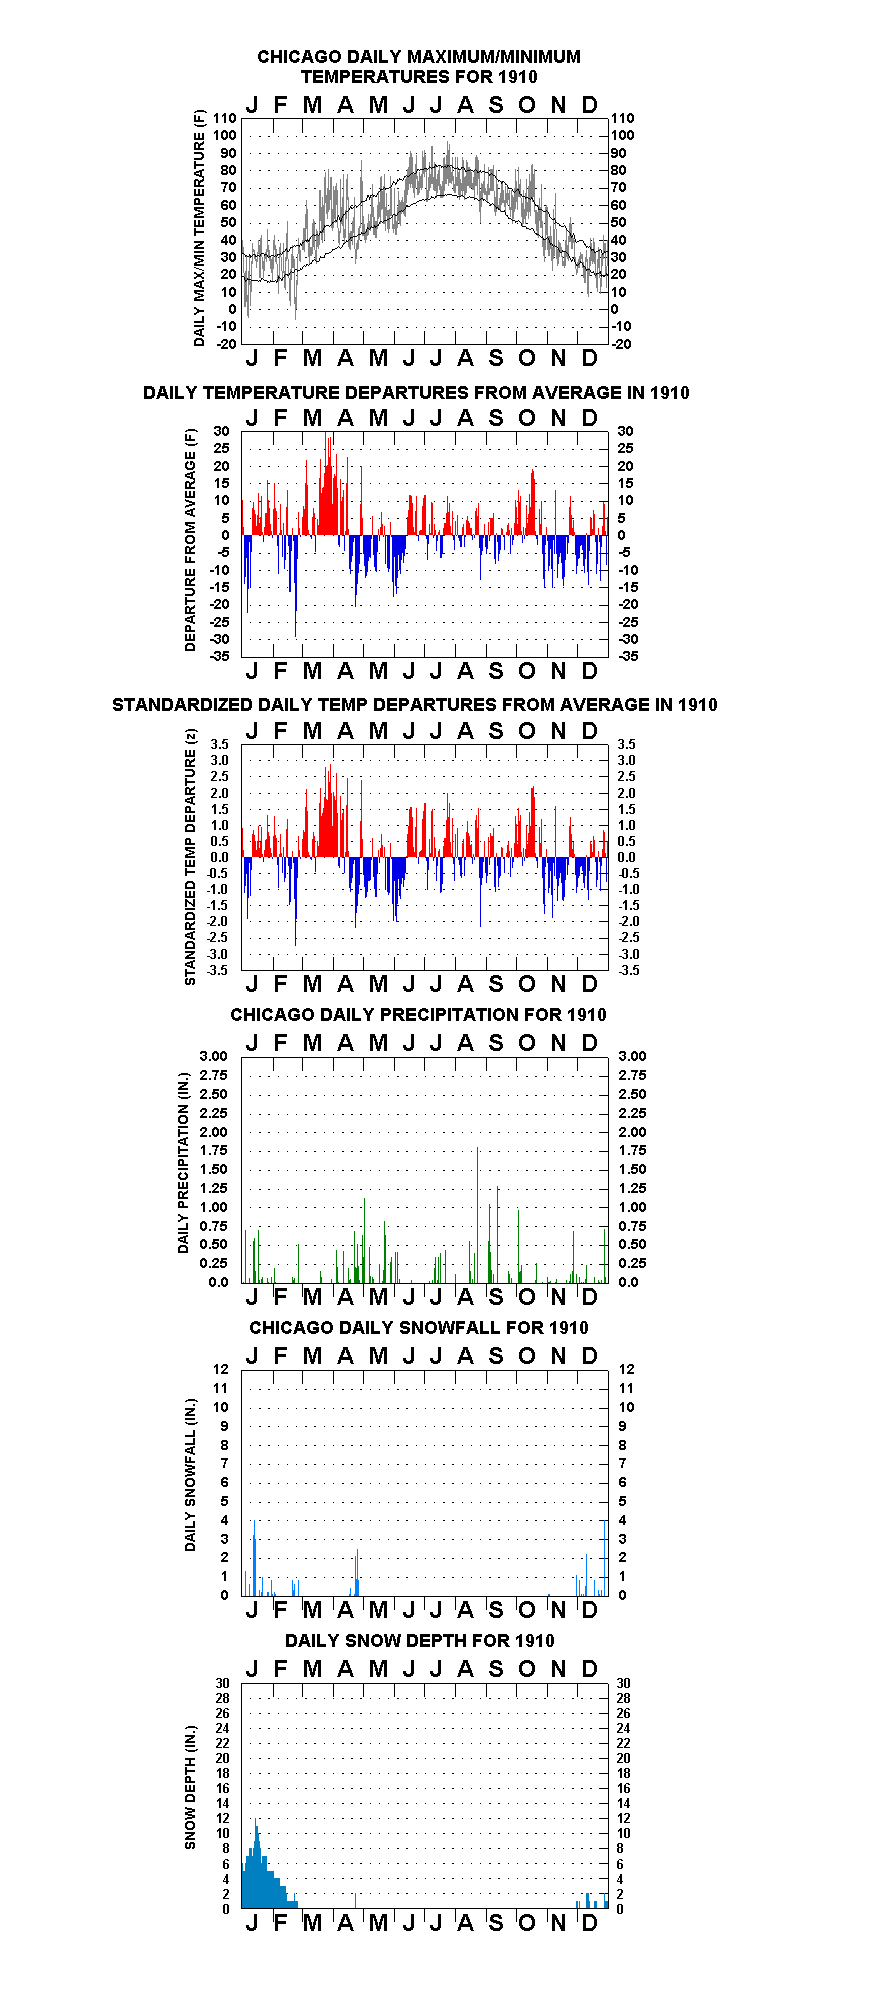
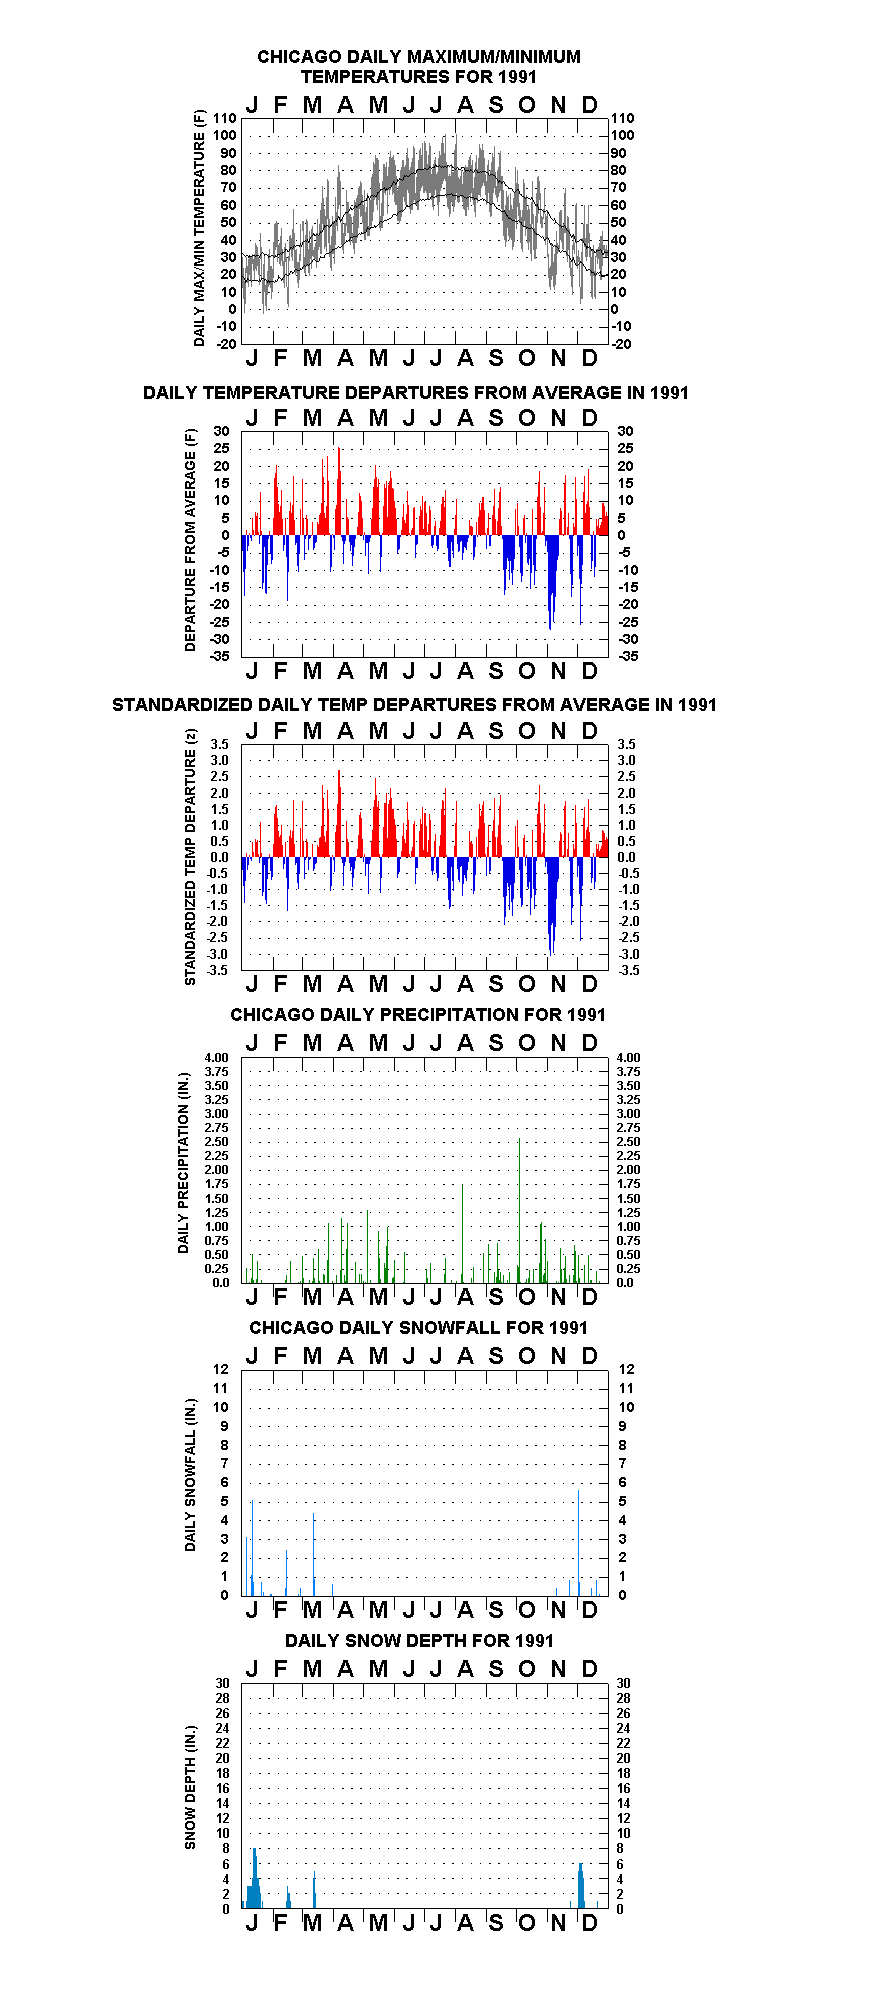
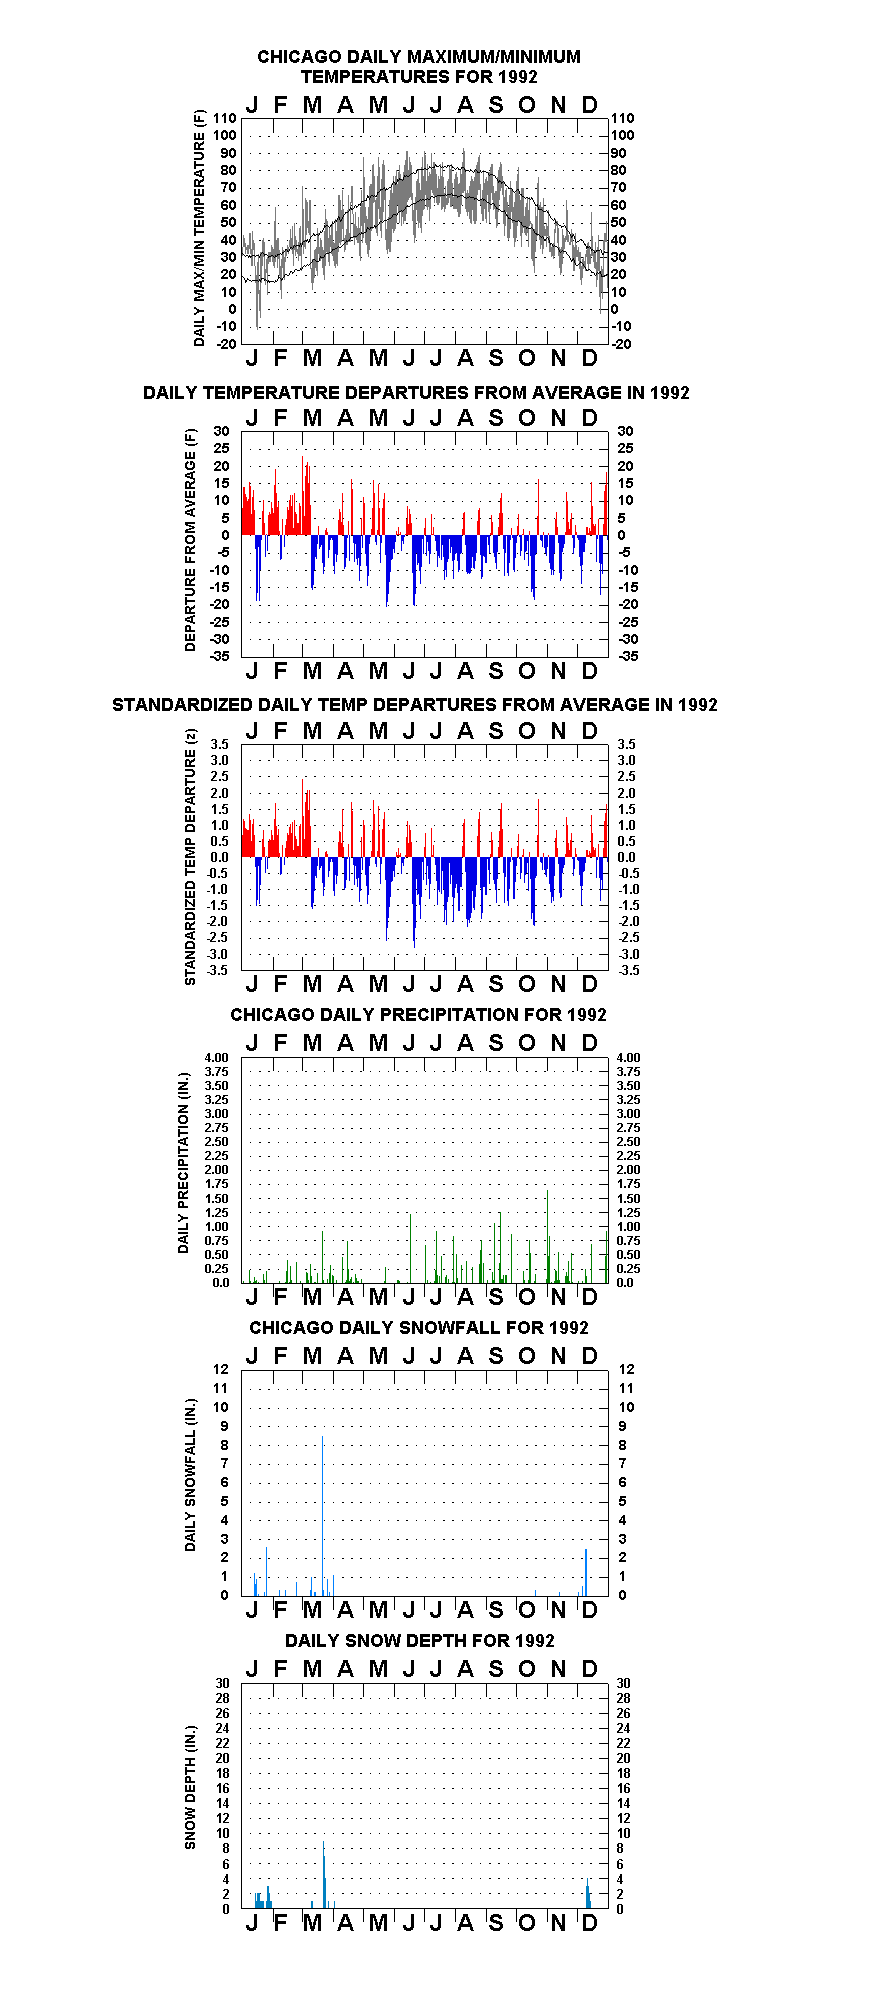
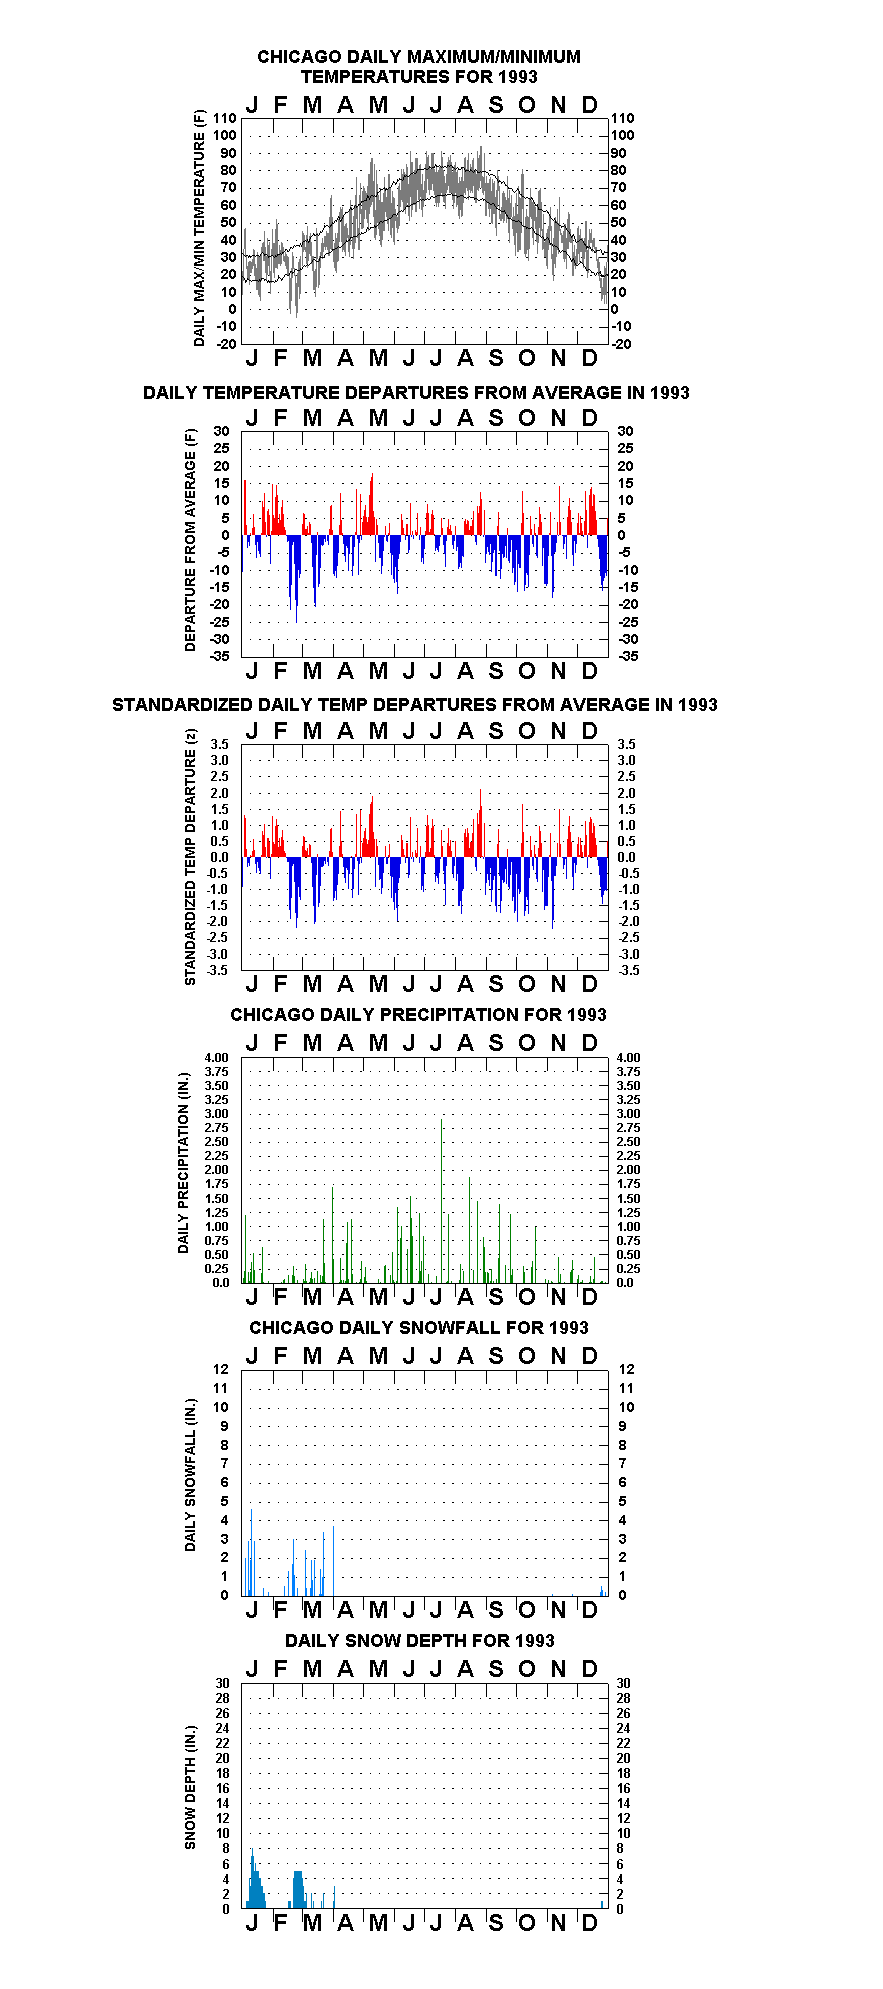
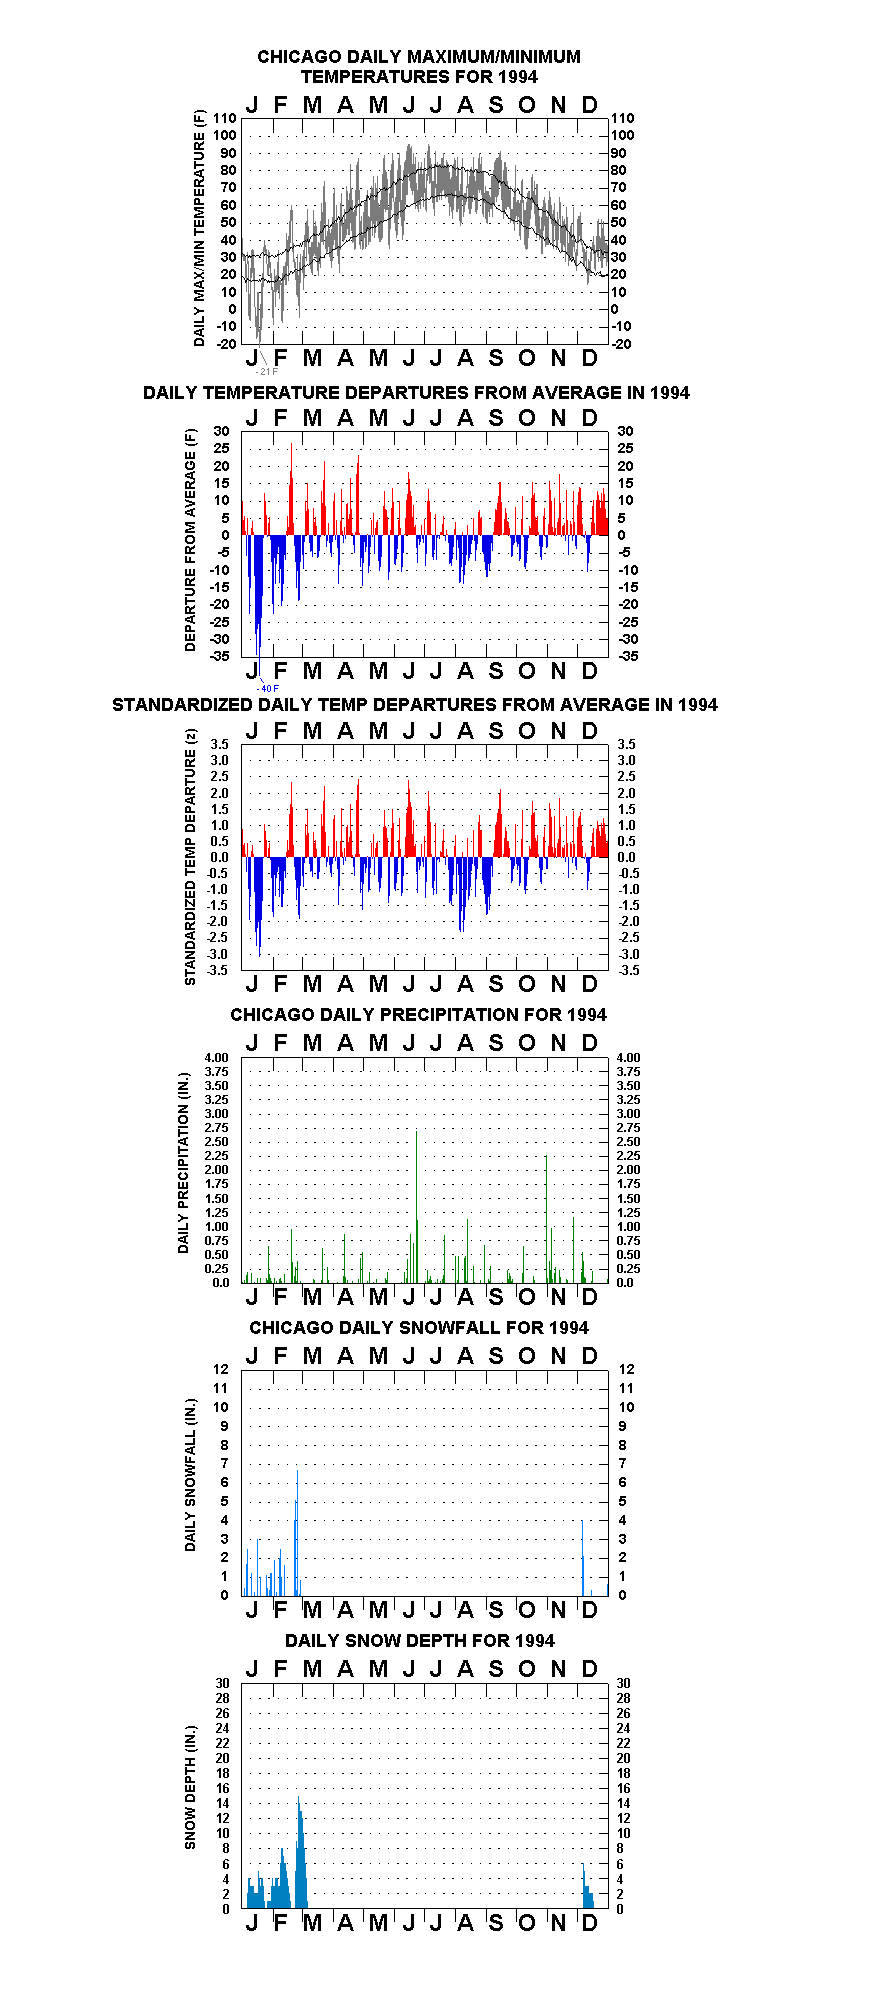
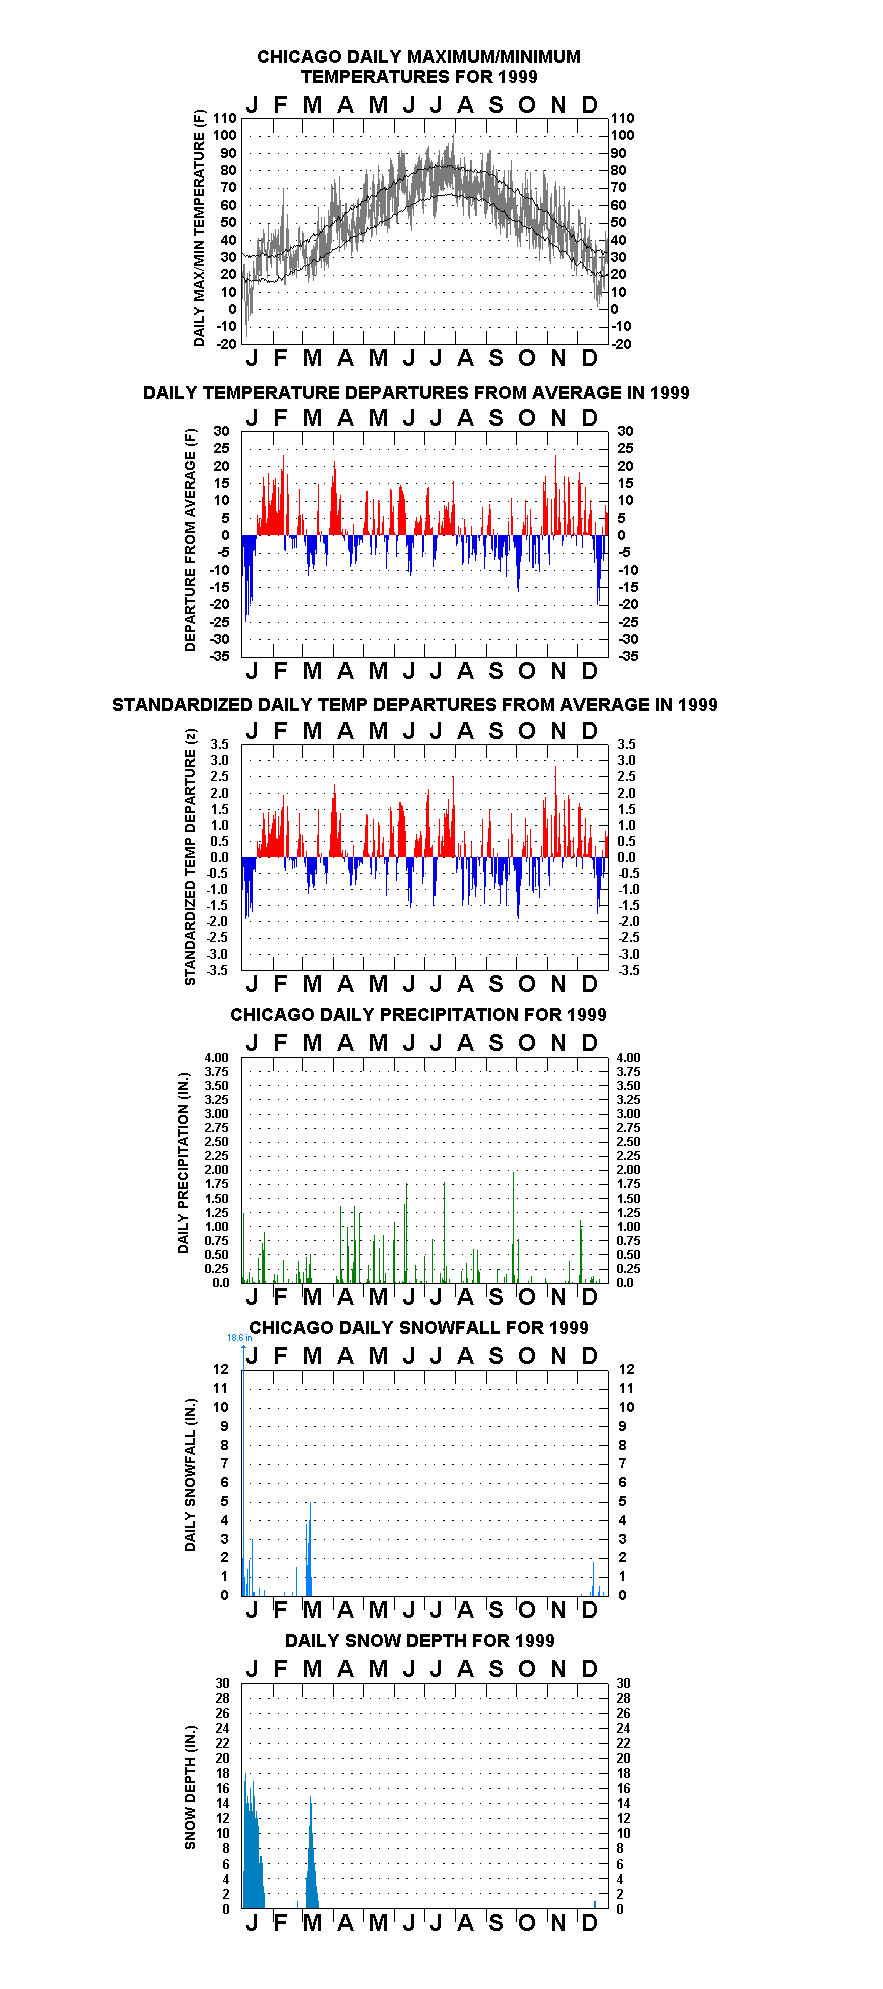
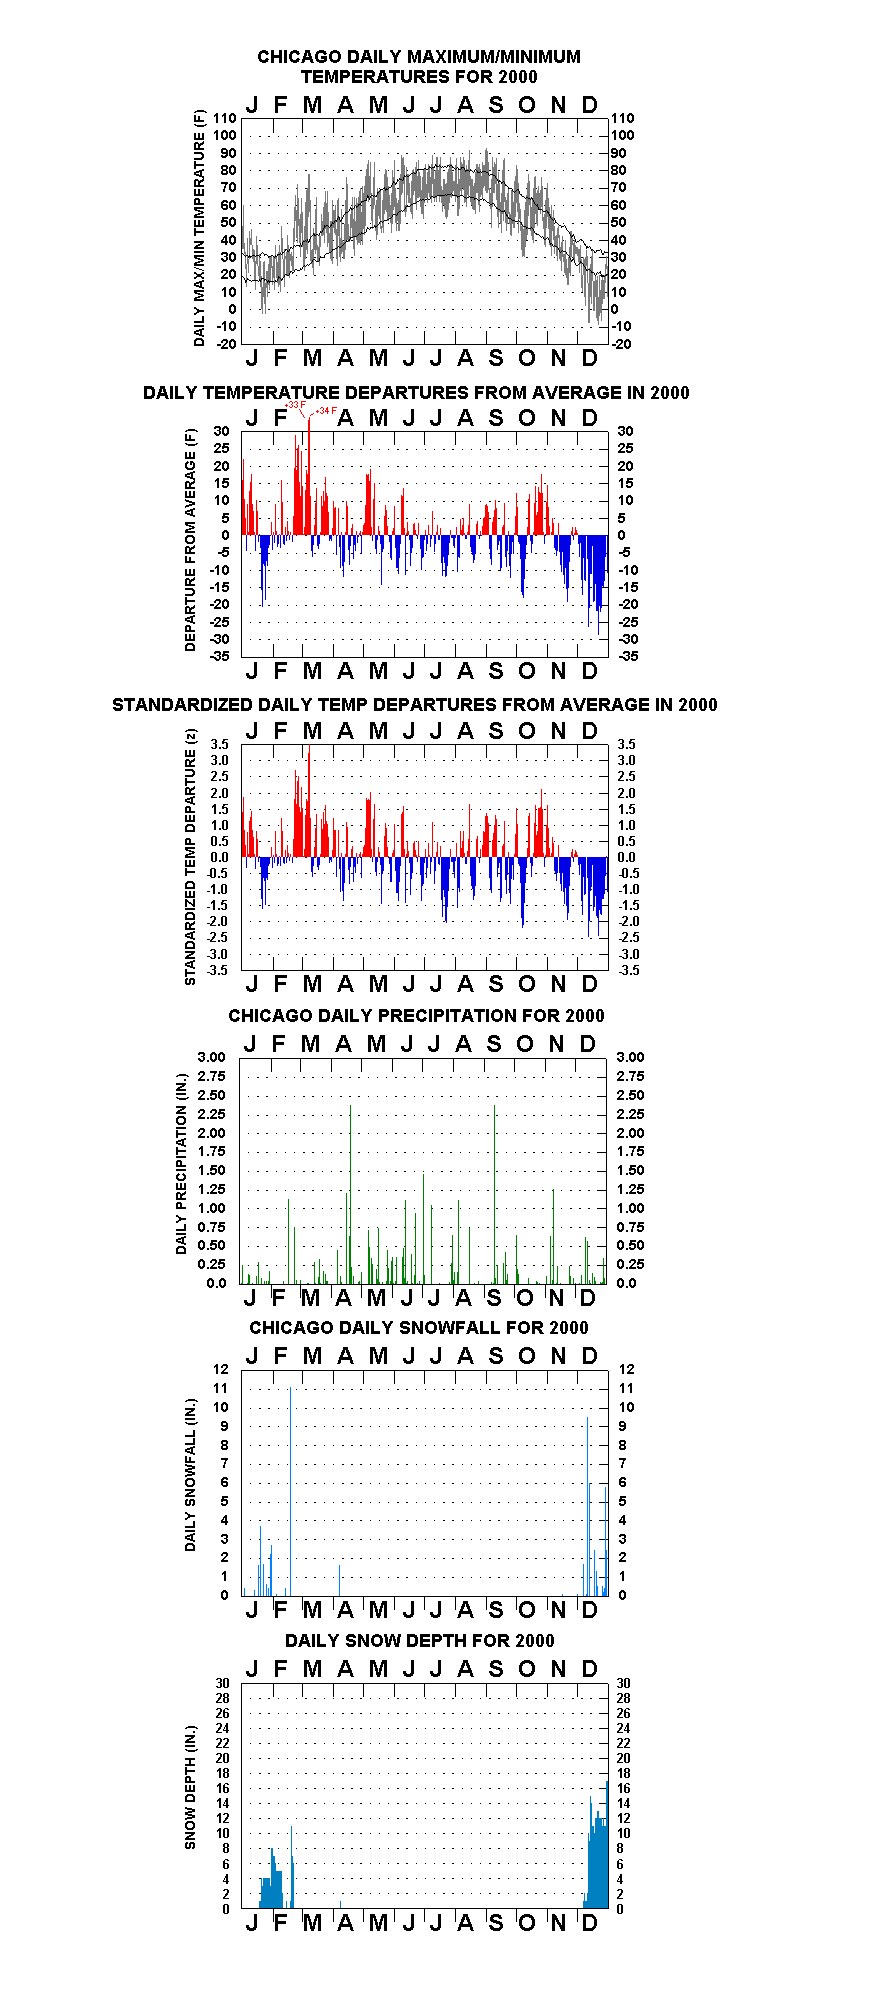
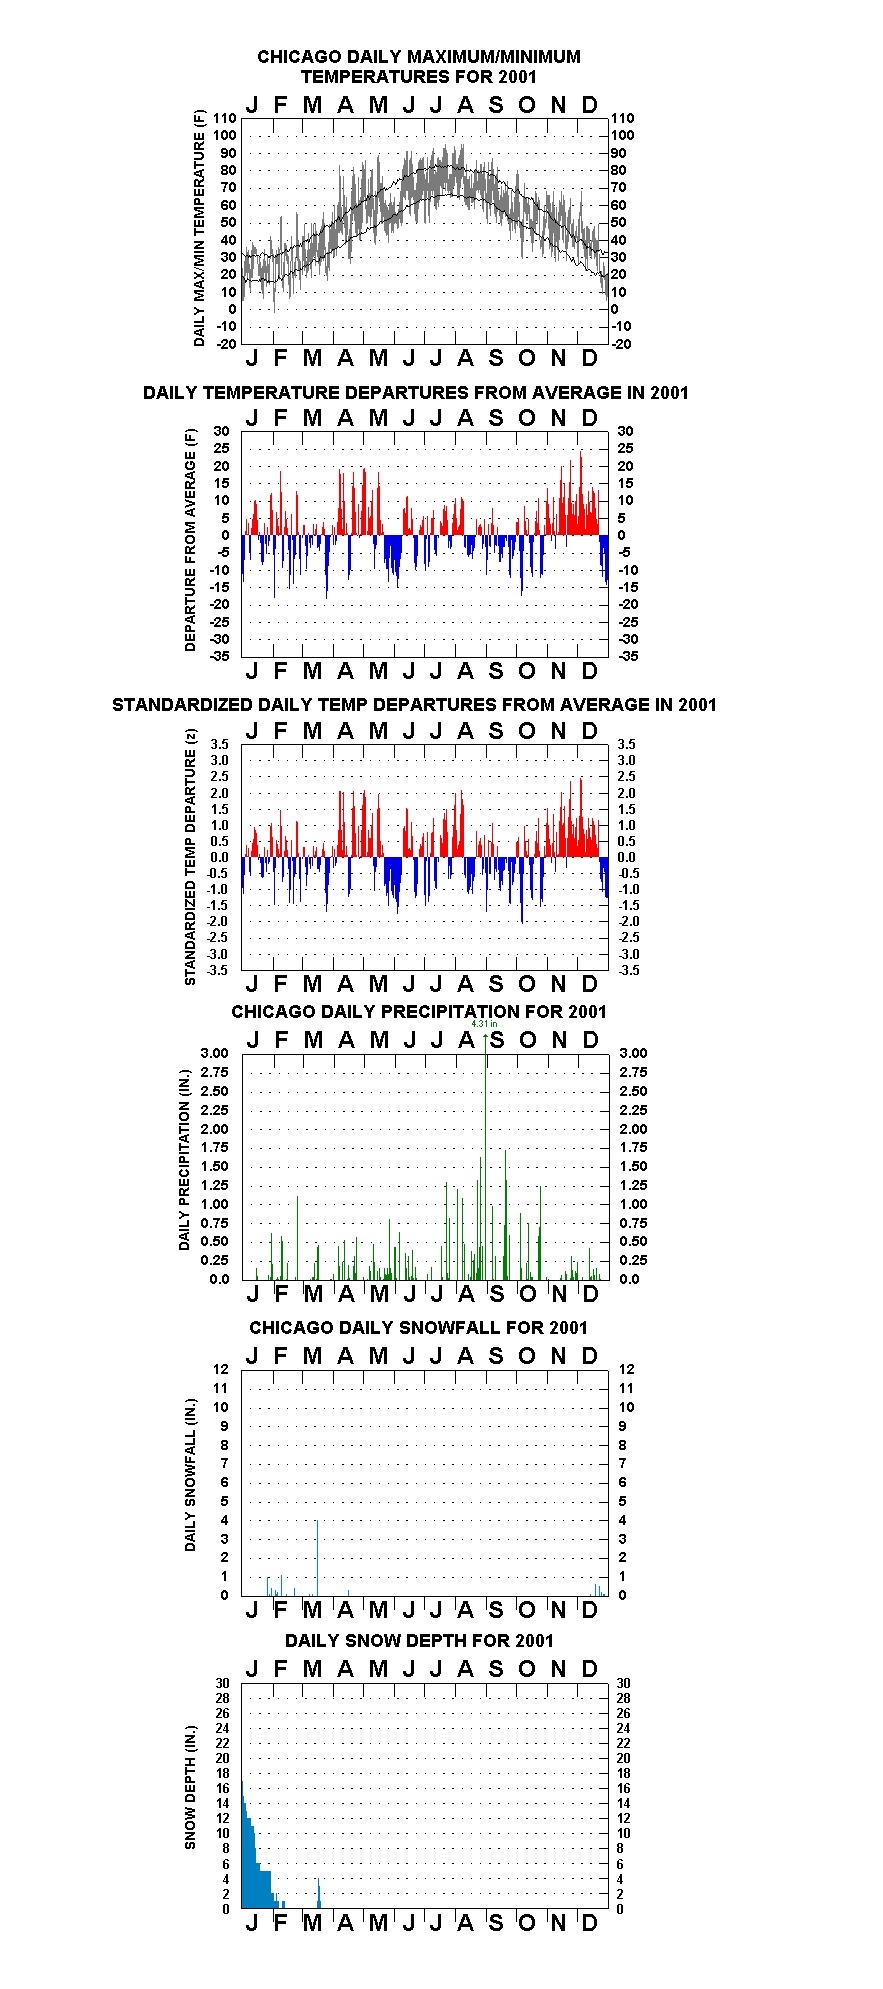
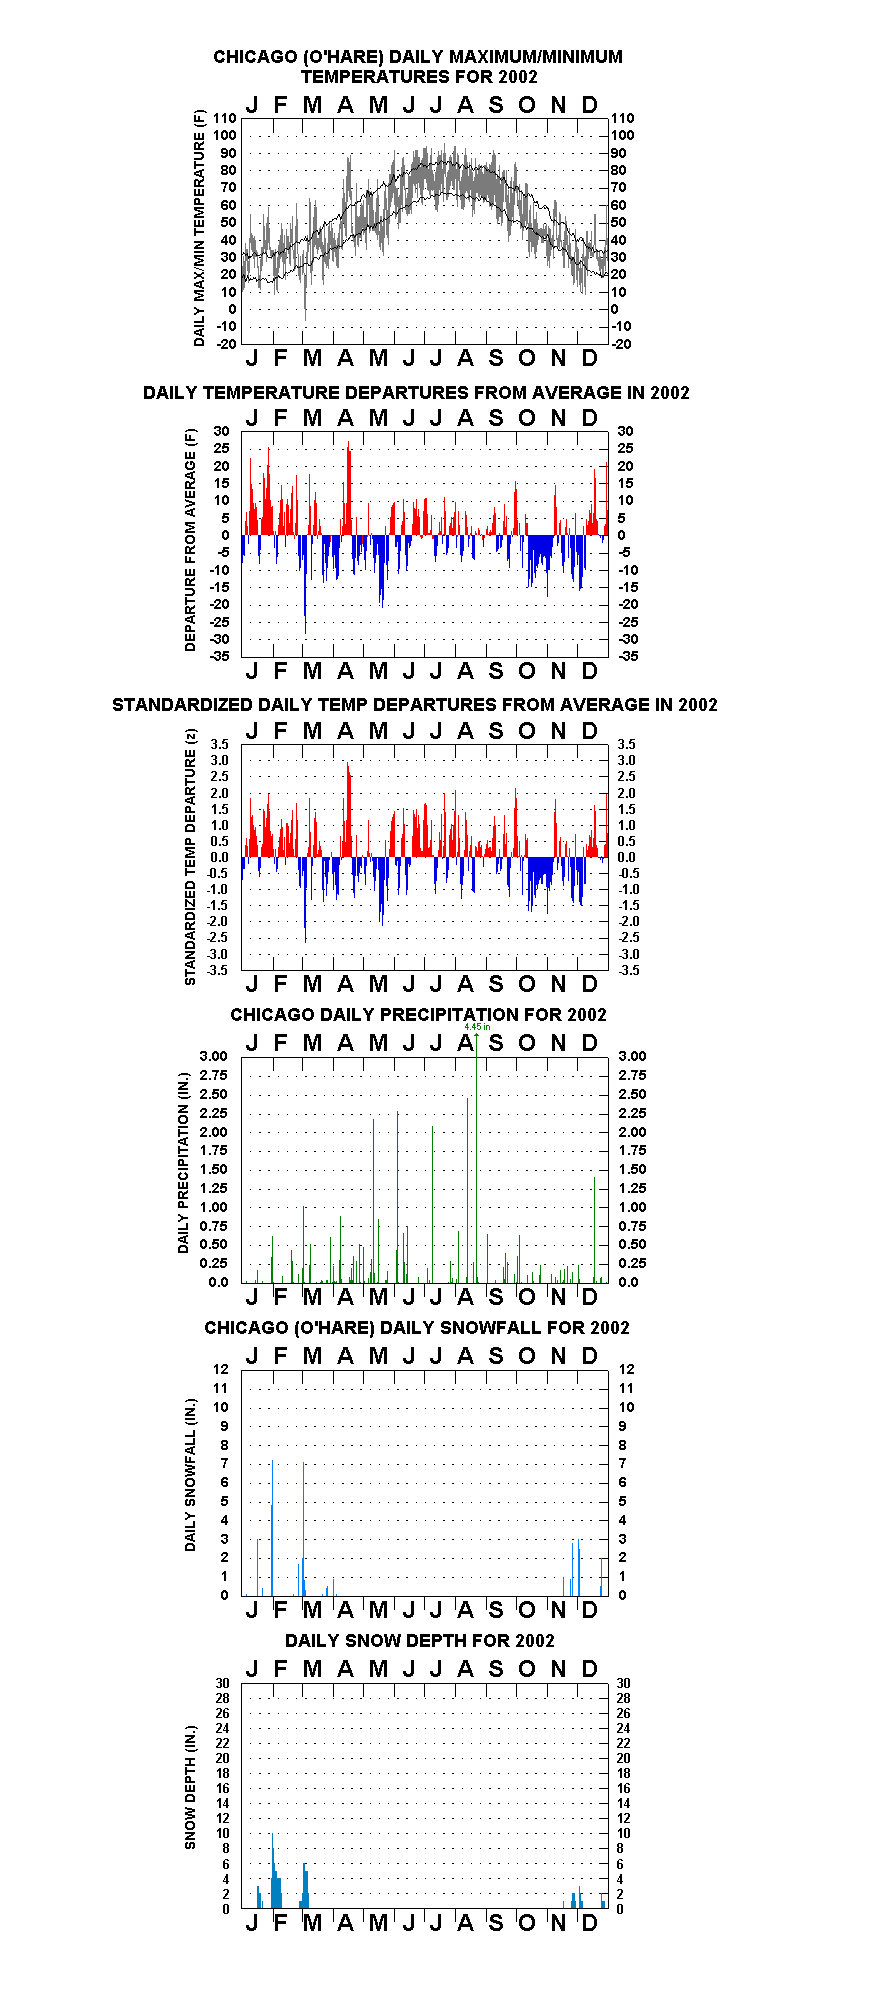
The top chart on a given yearly page (links below) displays “floating-bars” of the daily maxima and minima. Each bar represents an individual day’s temperature range. Superimposed are two line traces, the upper one connecting 1872 to present average daily maxima, the lower one 1872 to present average daily minima. The bars depict the varying diurnal, synoptic, long-wave, and seasonal influences on temperature over time
Note: Clicking on the floating-bar charts a second time after they appear on the screen will enlarge them even further).
The second chart down shows the arithmetic departures of day-to-day mean temperatures less corresponding long-term calendar-day average means. Vertical lines extending upward from the zero line indicate above average means for the day (colored red), those extending downward indicate below average daily means (colored blue). In the entire series, greatest positive departure for any given calendar day is +36 F on 23 Jan 1909 and 20 Mar 2012, the greatest negative departure -45 F on 24 December 1983..
The third chart down shows the middle chart’s departures in deseasonalized or “standardized” form. This adjusts for the fact that individual calendar days have higher or lower inherent year-to-year variability in mean temperature (and departures). Standardized anomalies are calculated by dividing the arithmetic anomaly by climatological mean temperature standard deviation for the calendar day in question, creating “z-scores”. Through 2020, the most positive z-score is +3.7 for 20 March 2012, the most negative, –3.8 for 1 Dec 1893.
The fourth chart down depicts daily rainfall, the fifth and sixth charts, respectively, daily snowfall and snow depths.
Year-To-Year Graphs — OLDER YEARS
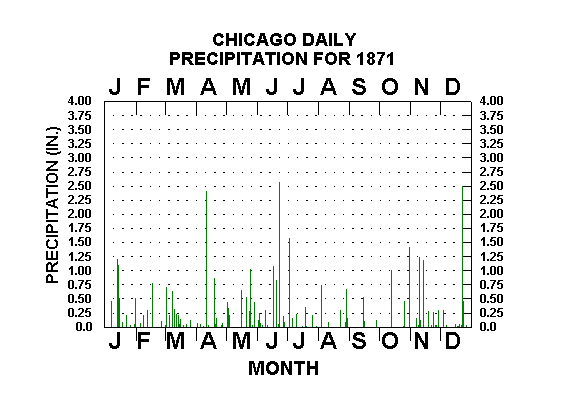
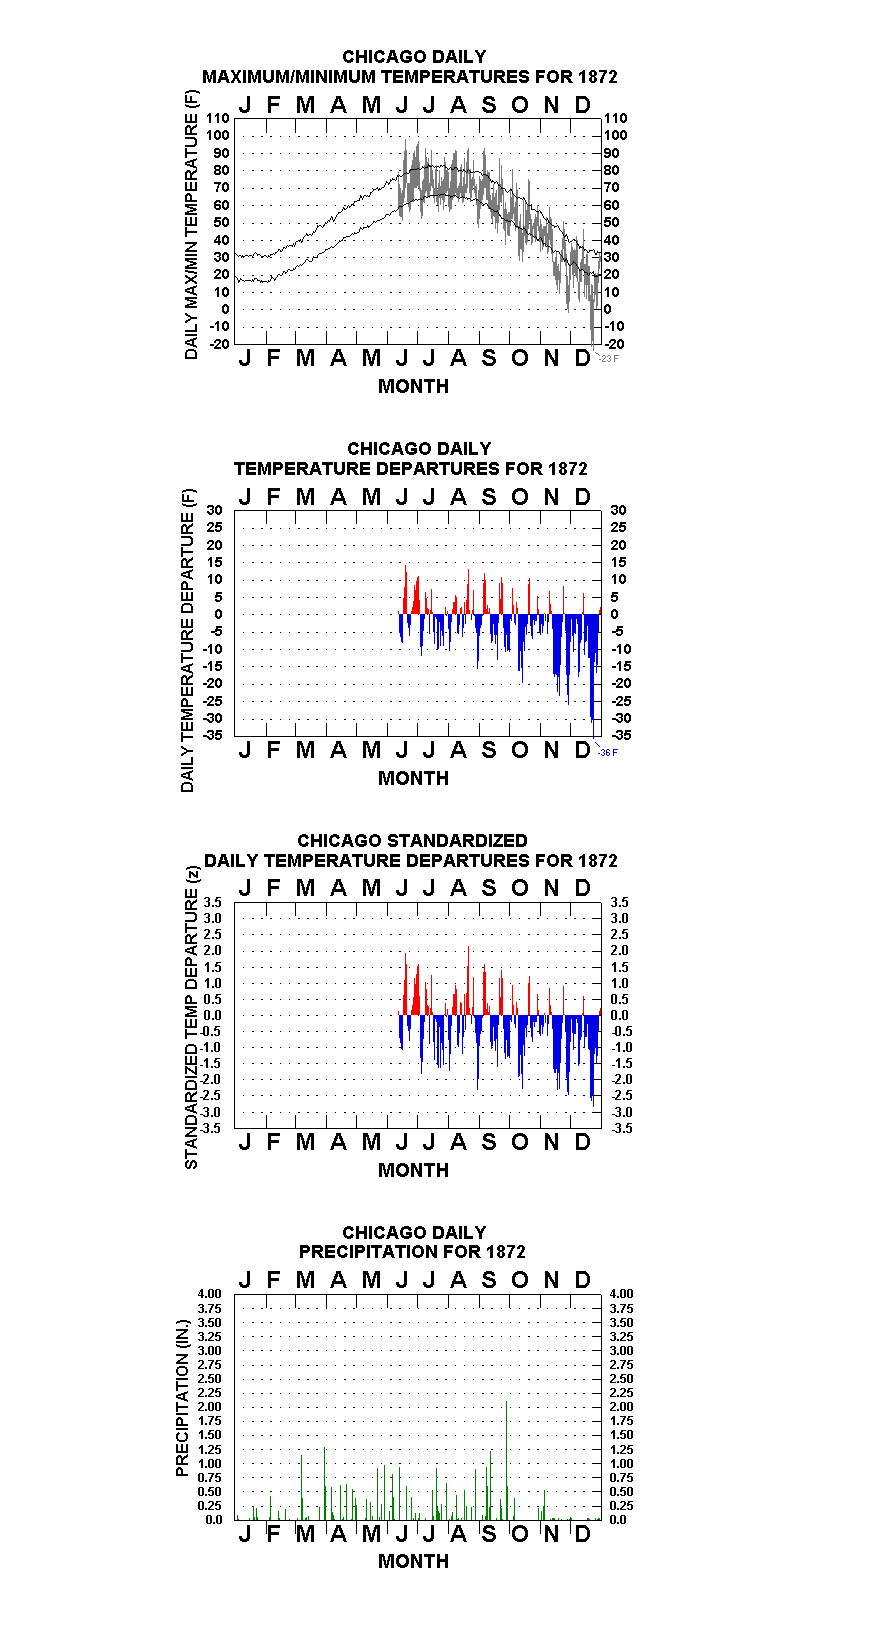
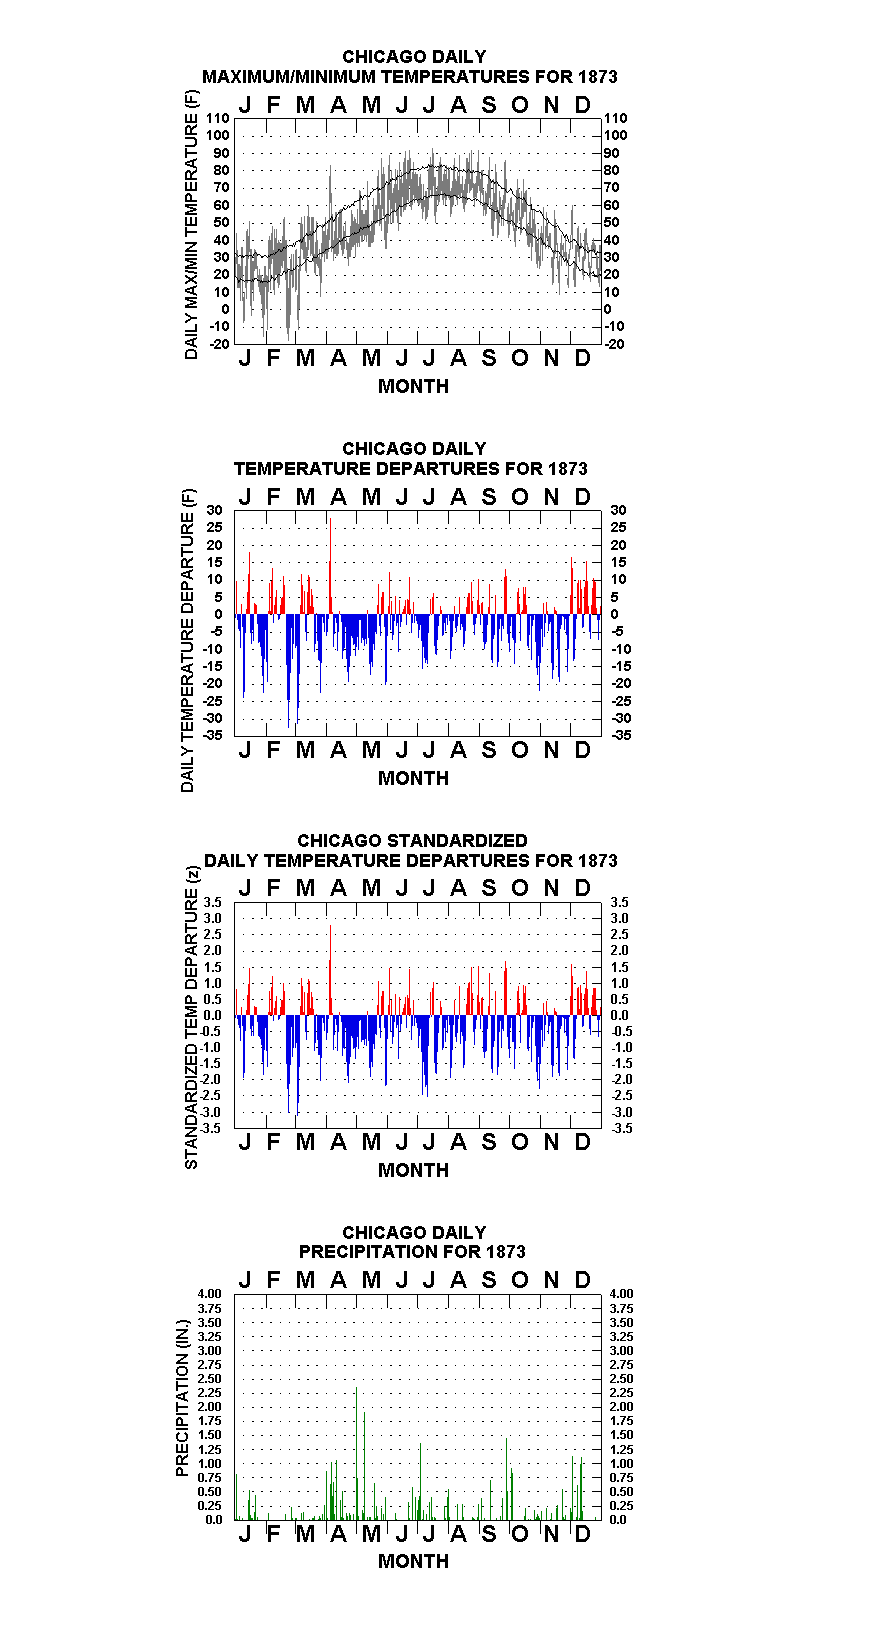
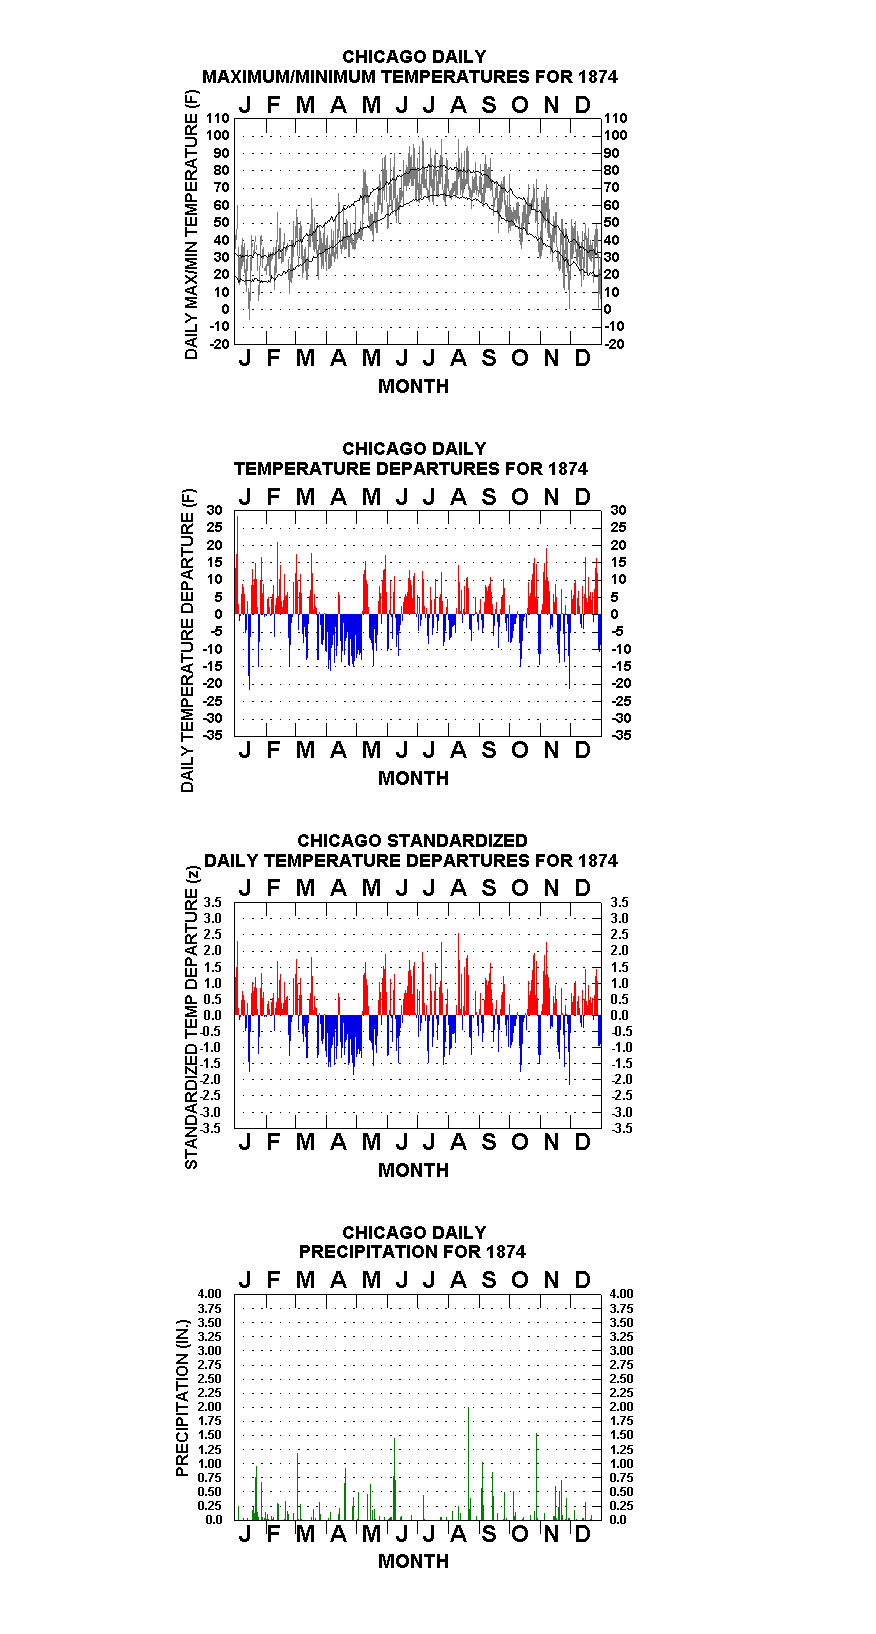
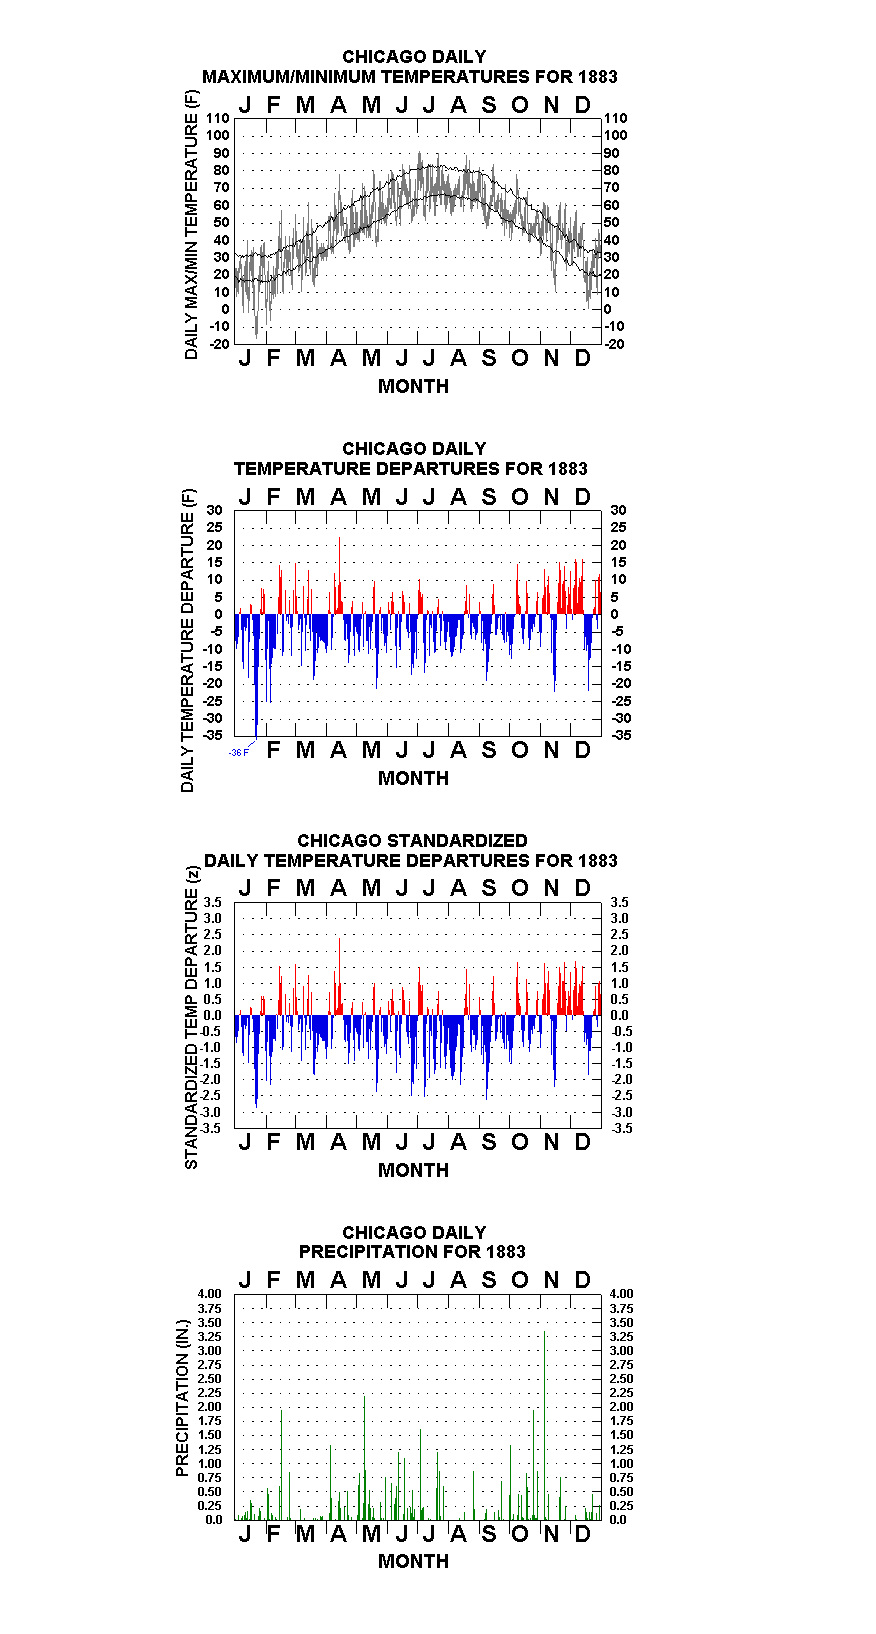
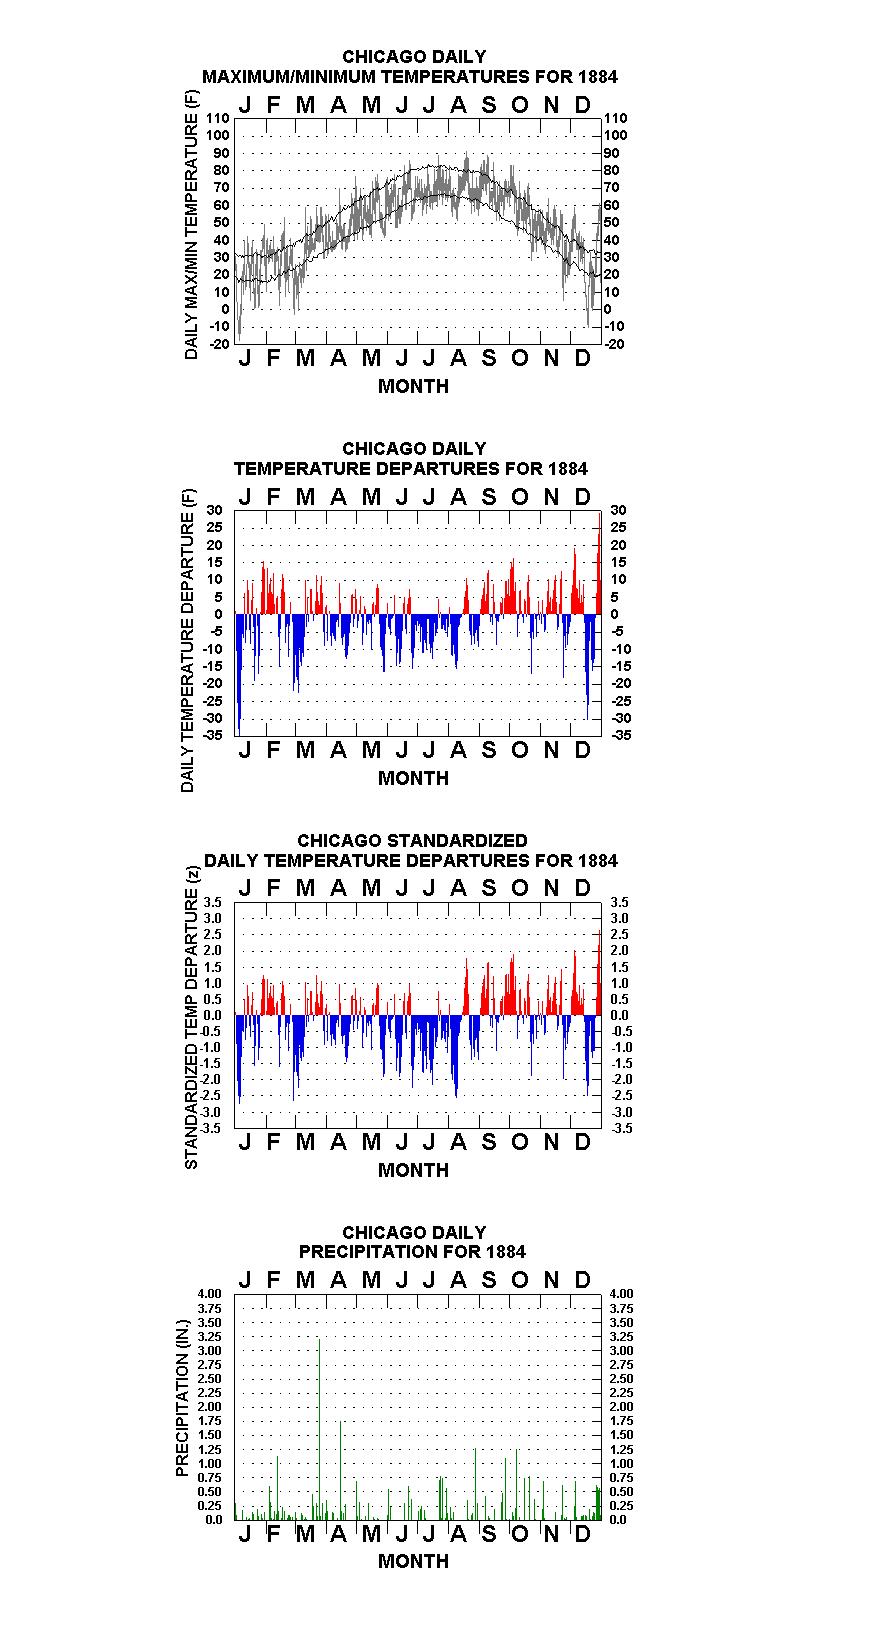
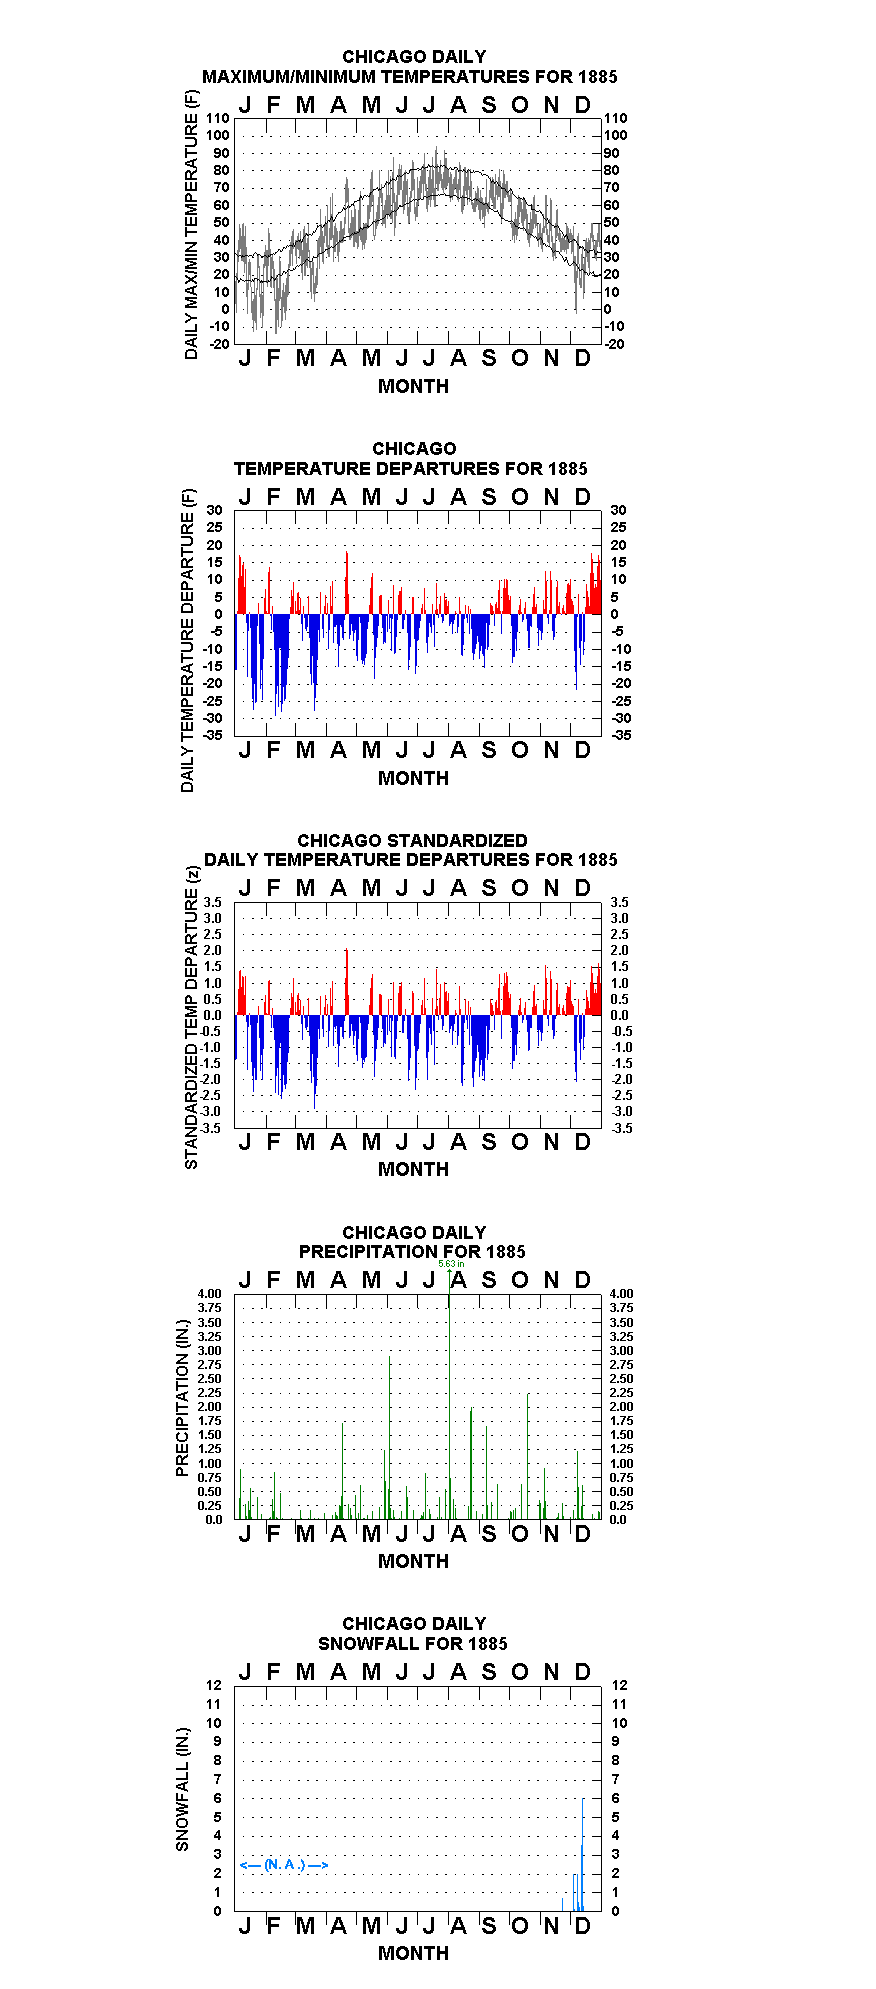
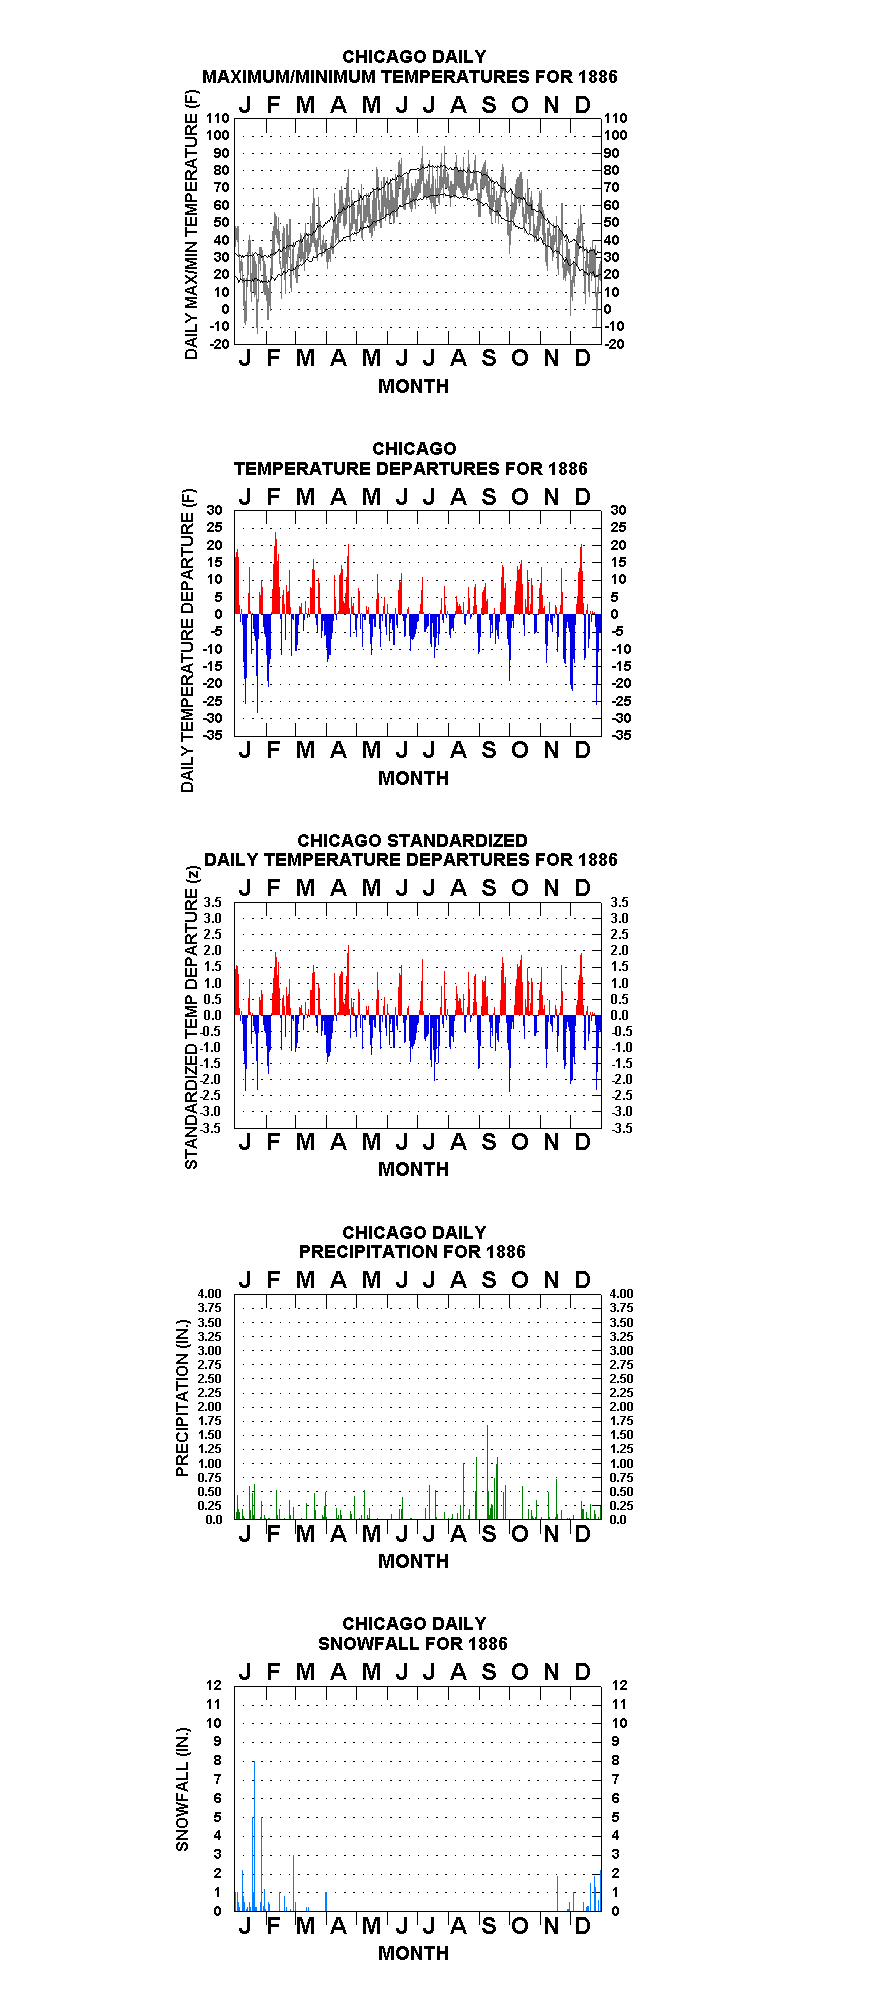
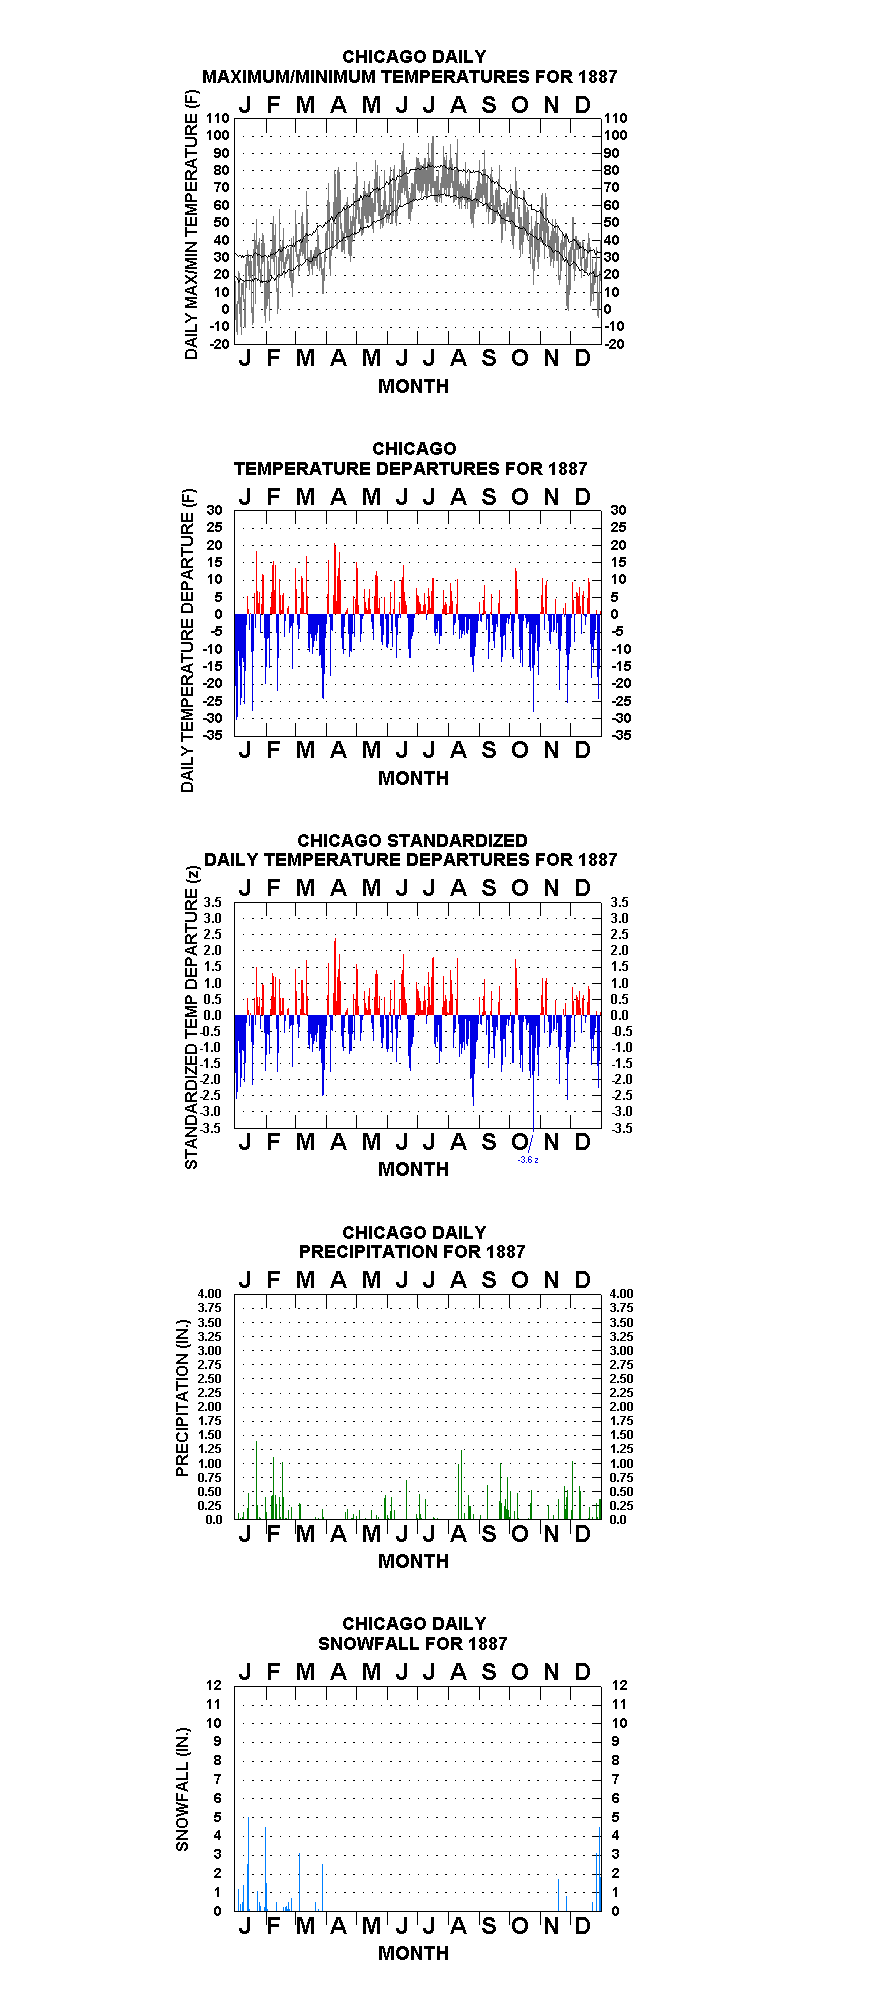
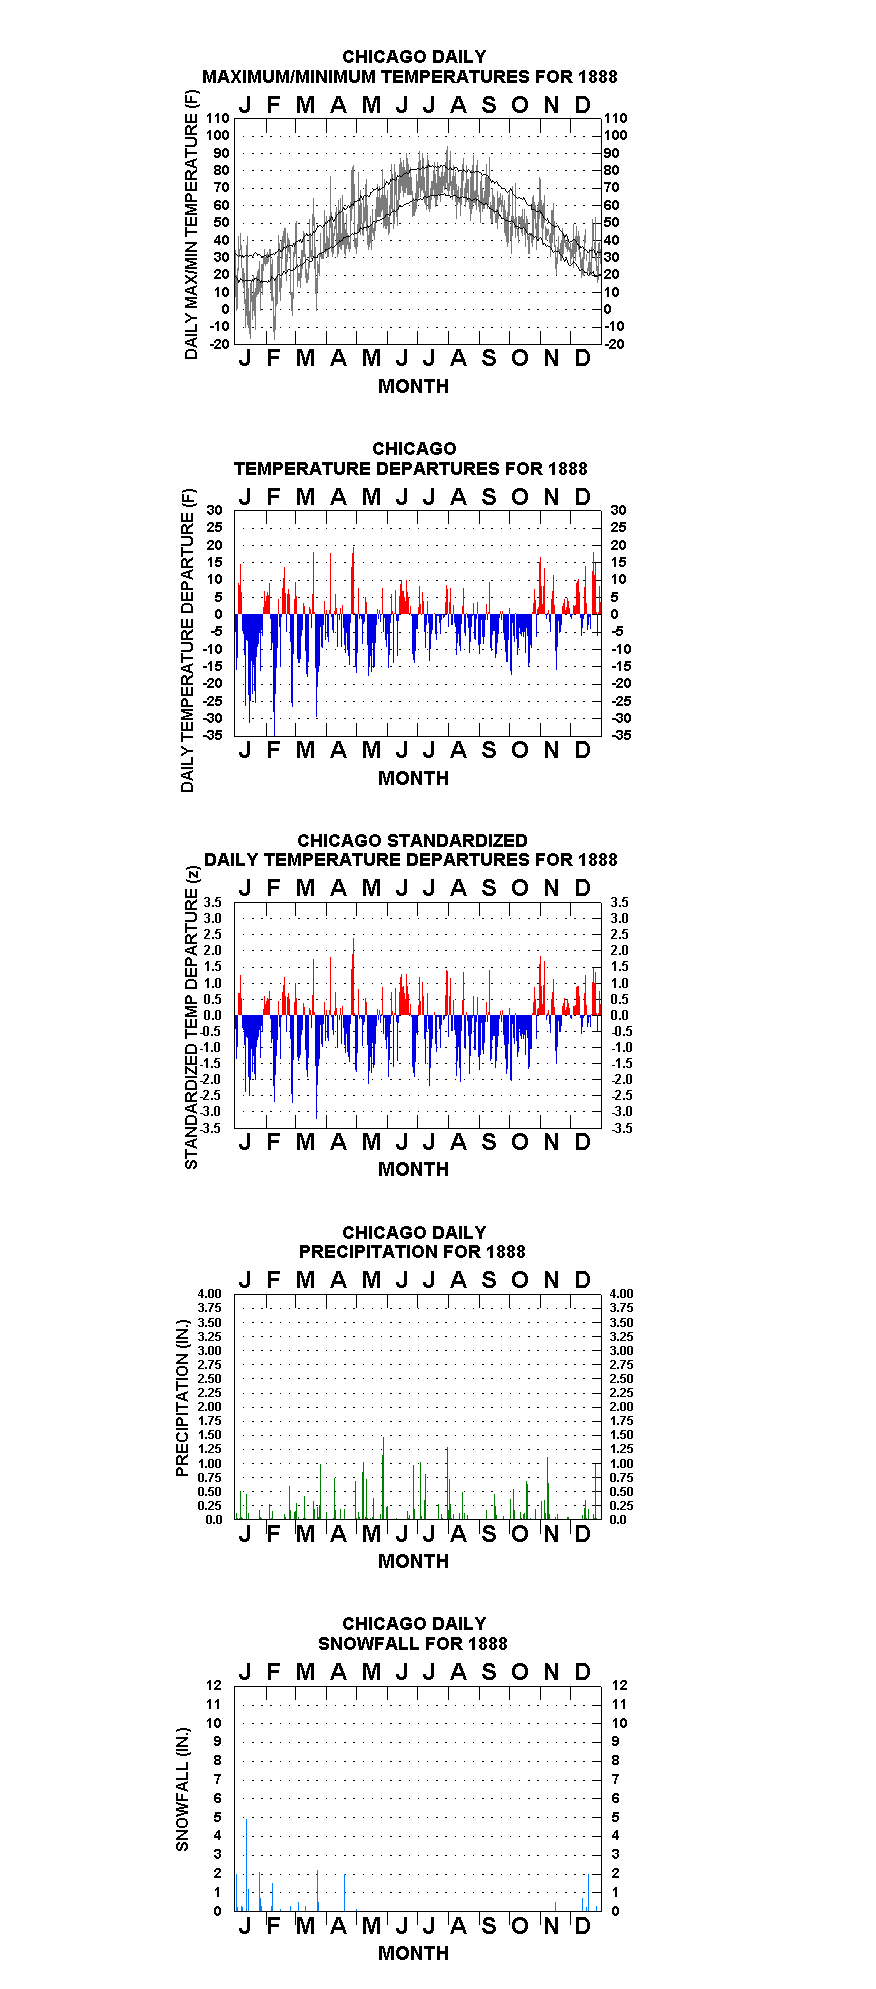
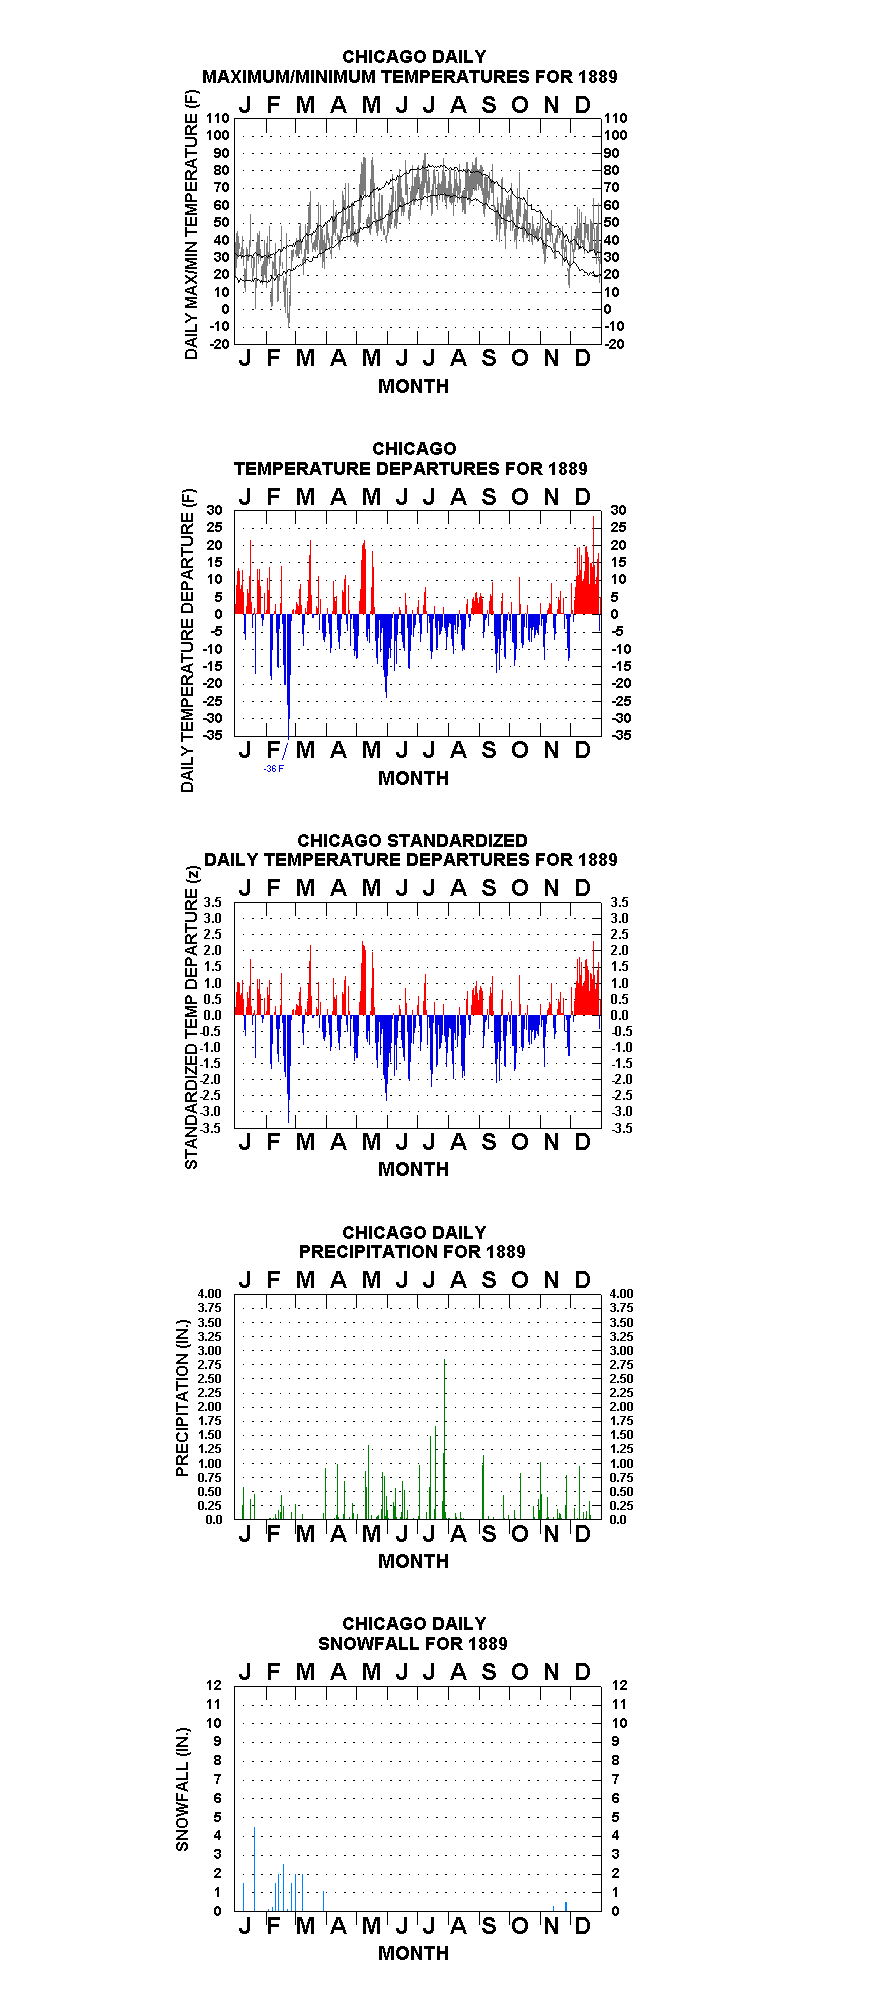
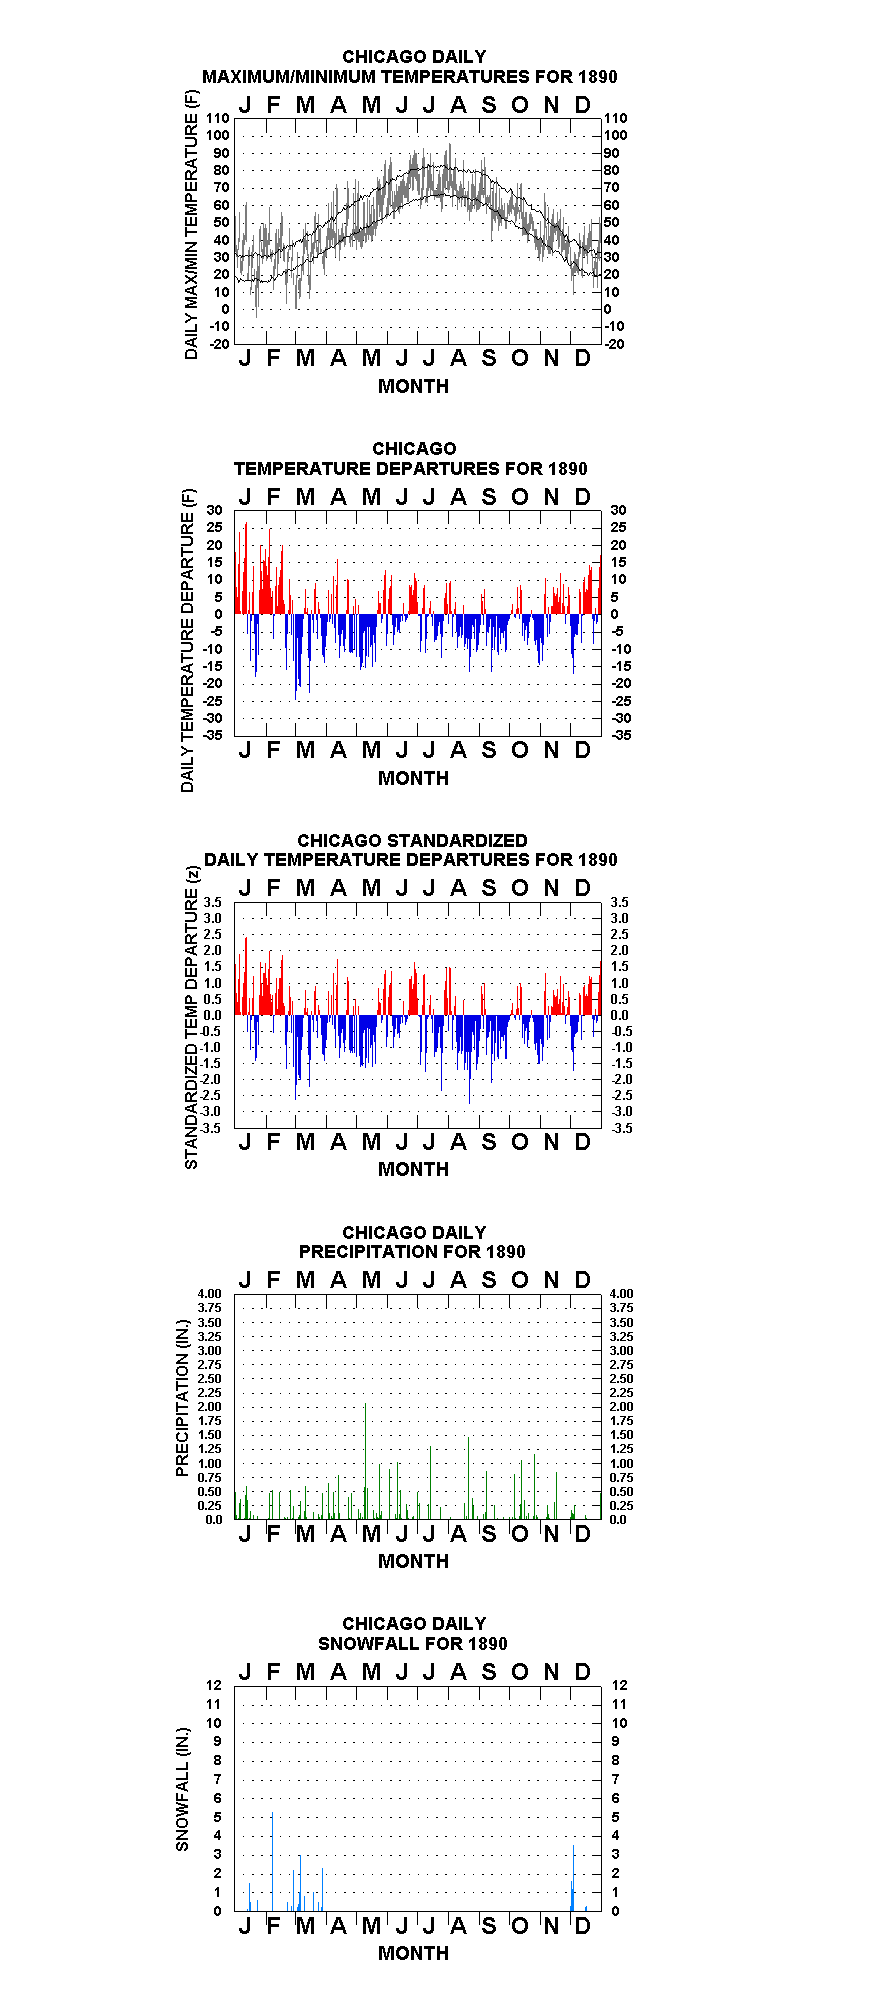
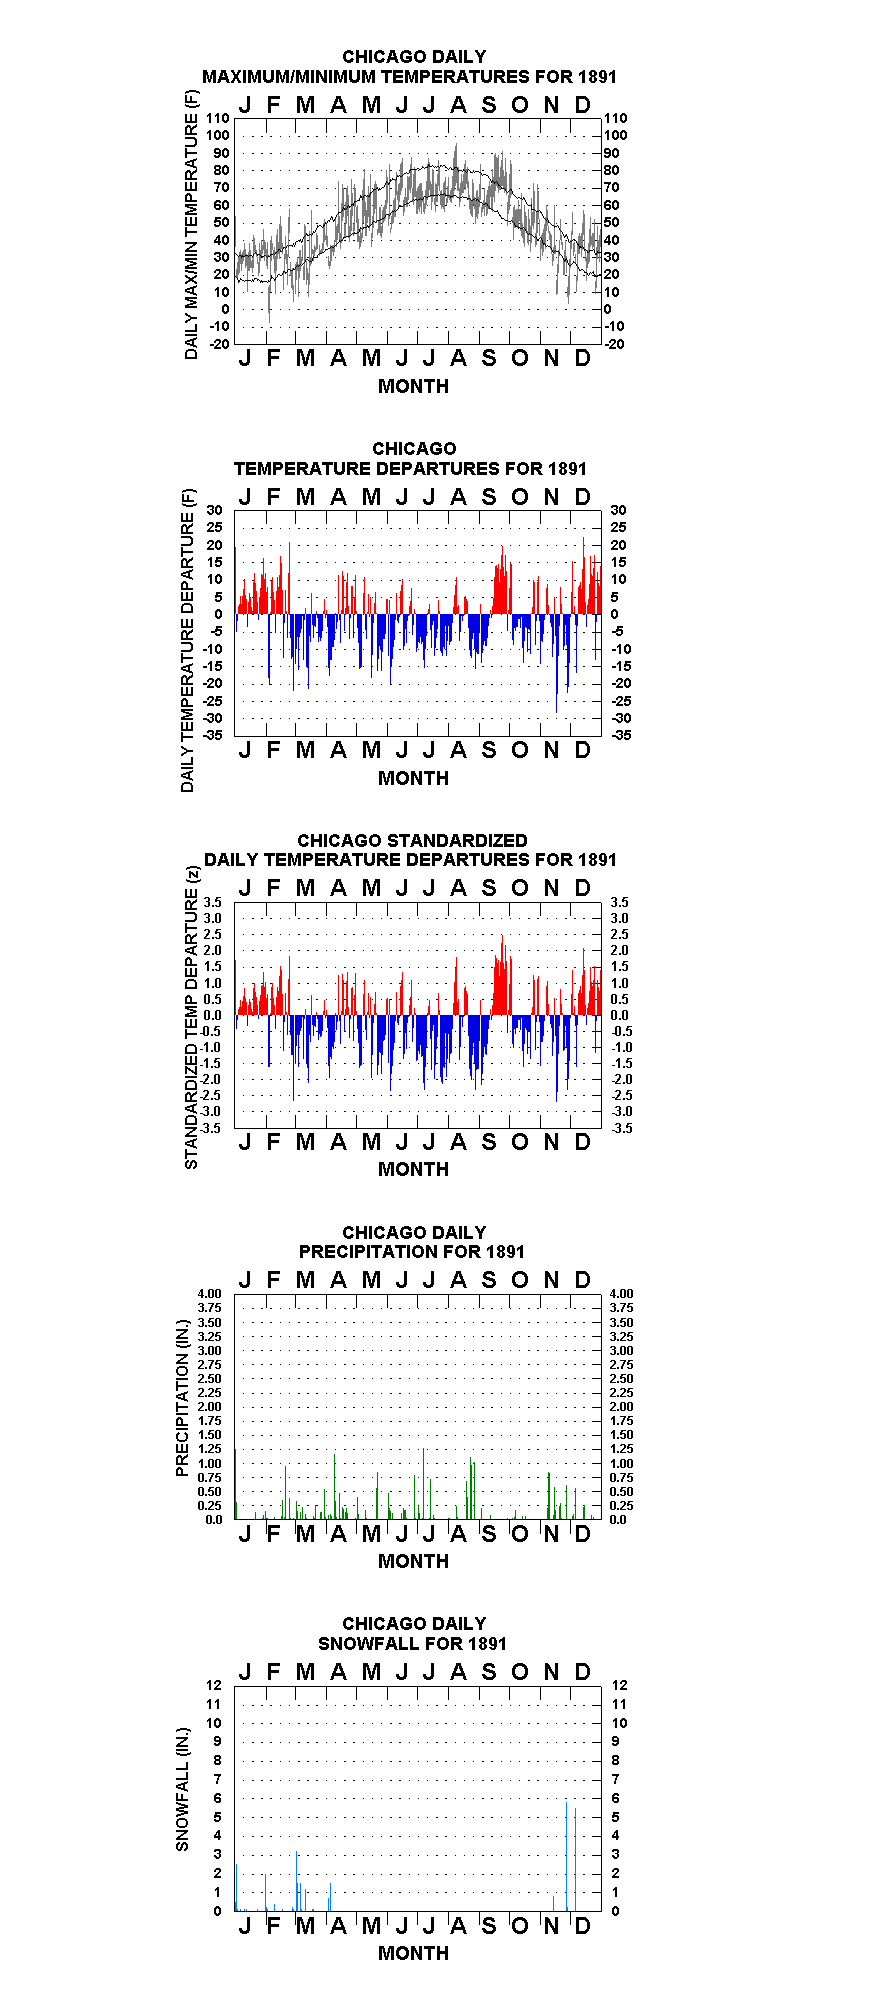
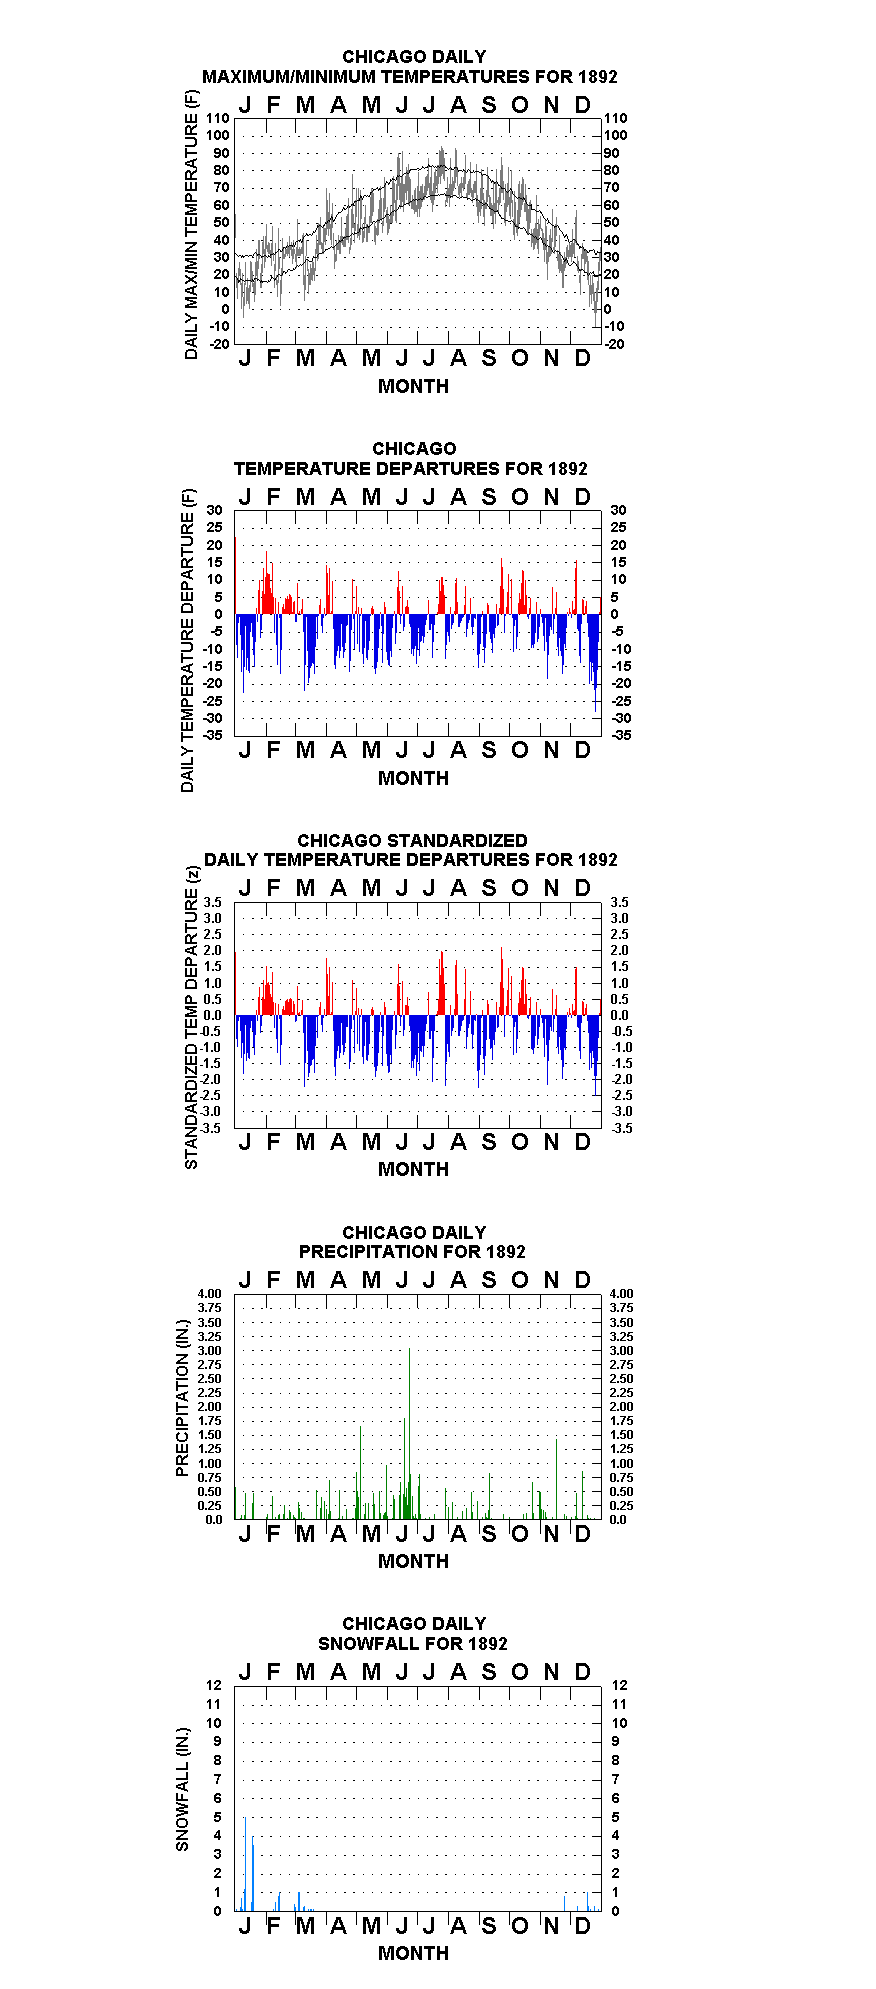
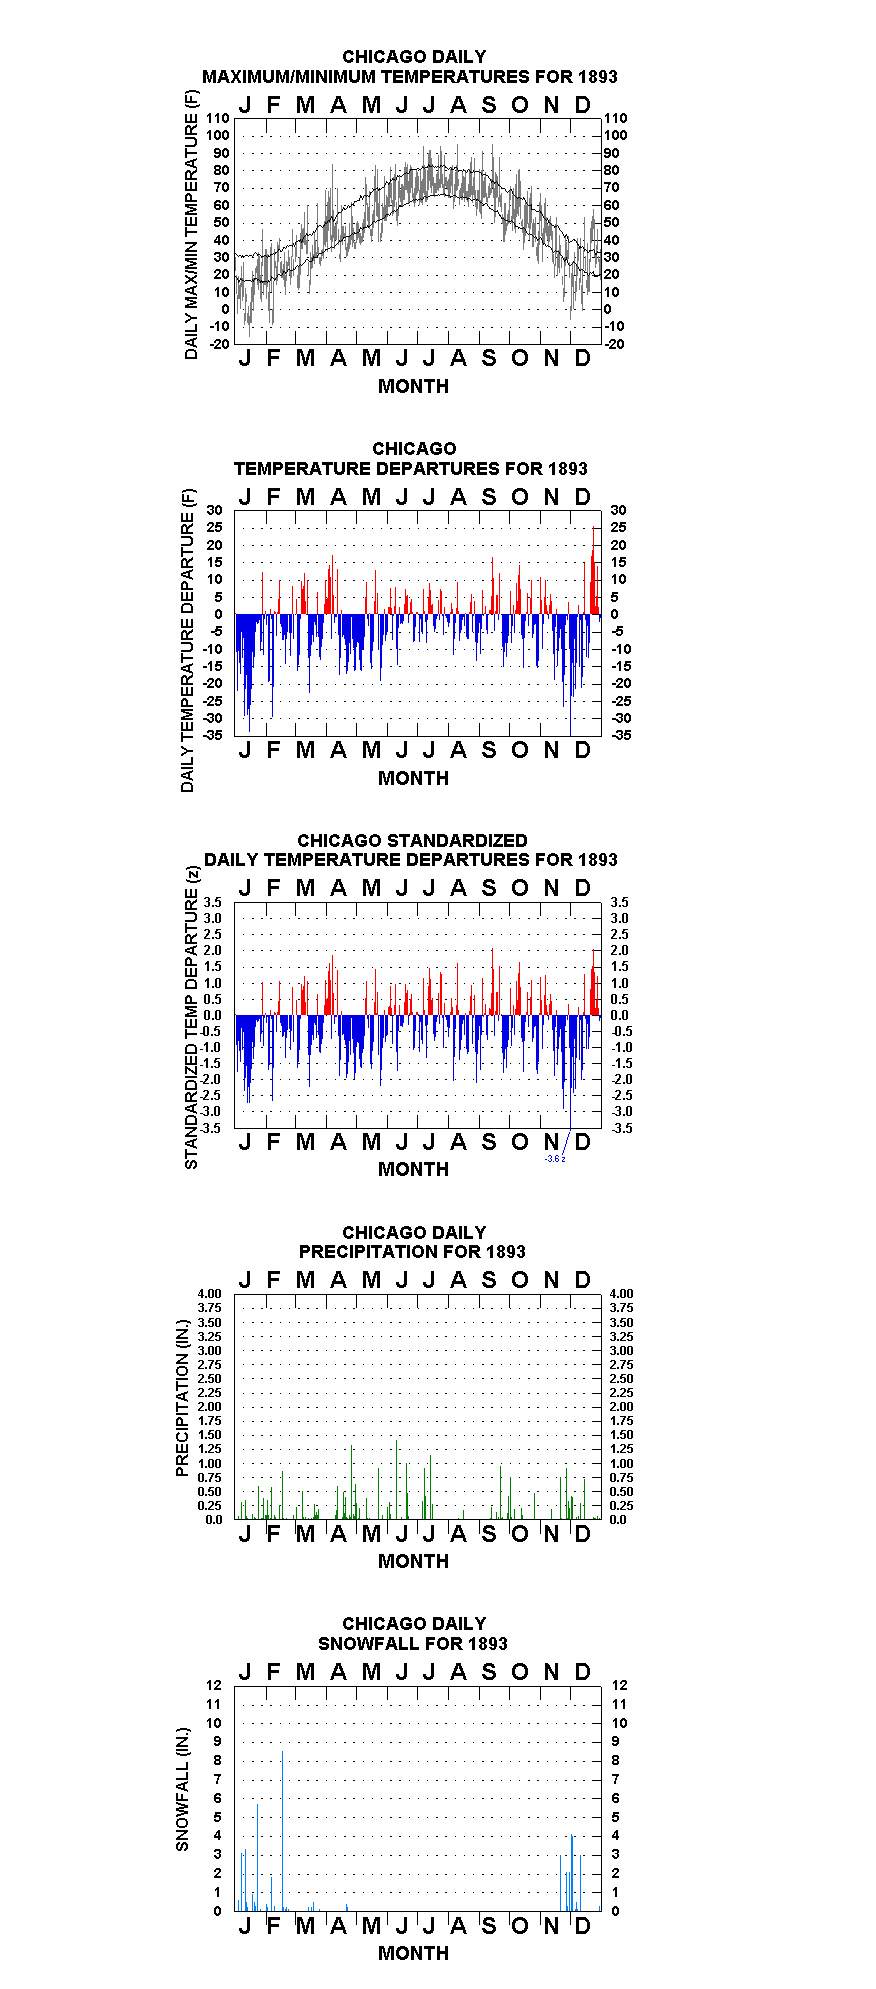
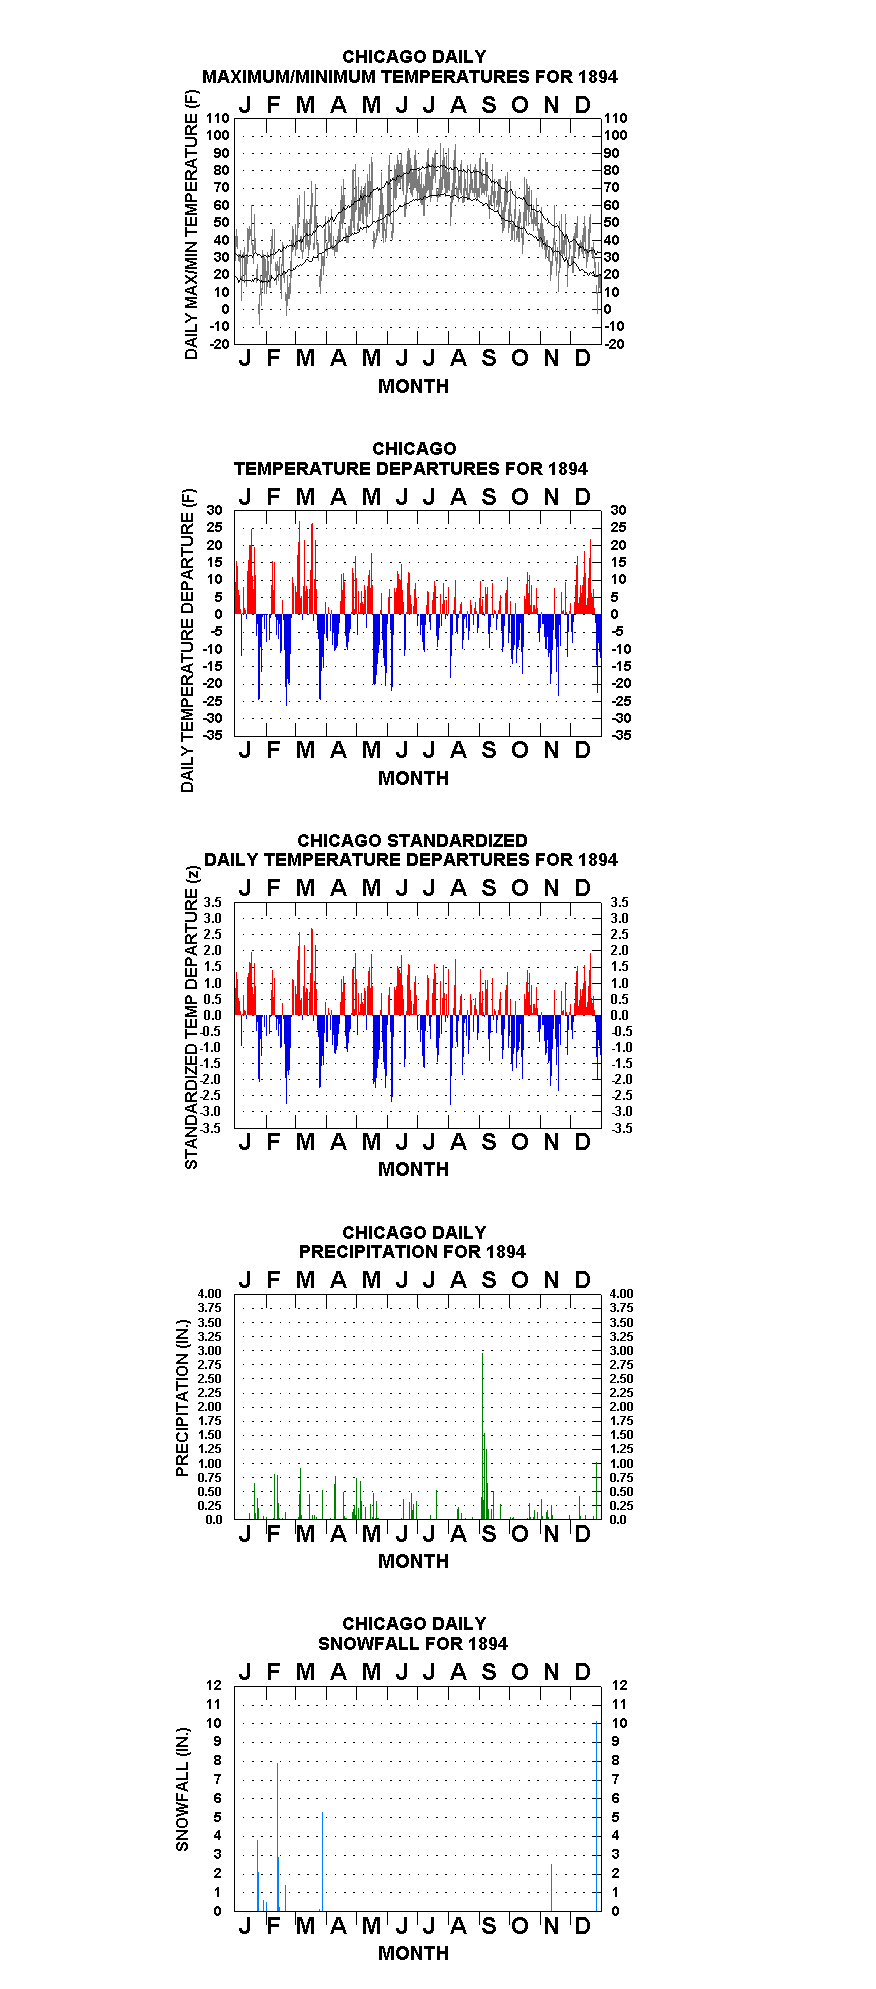
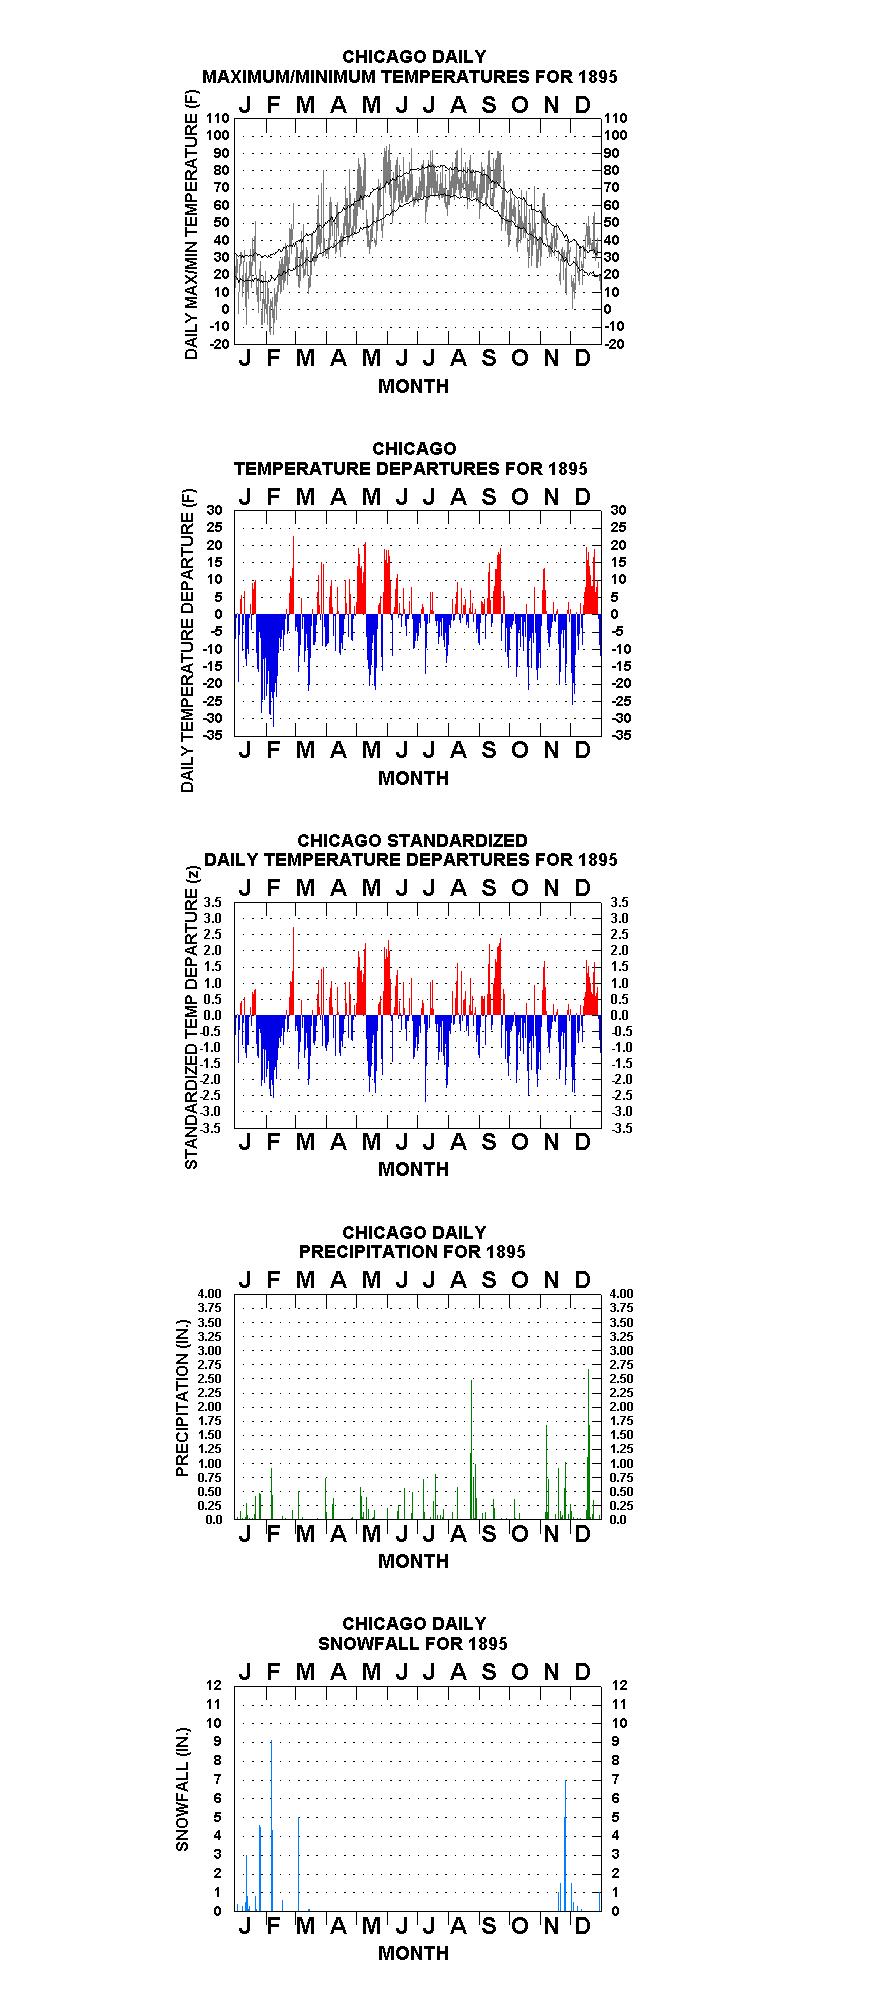
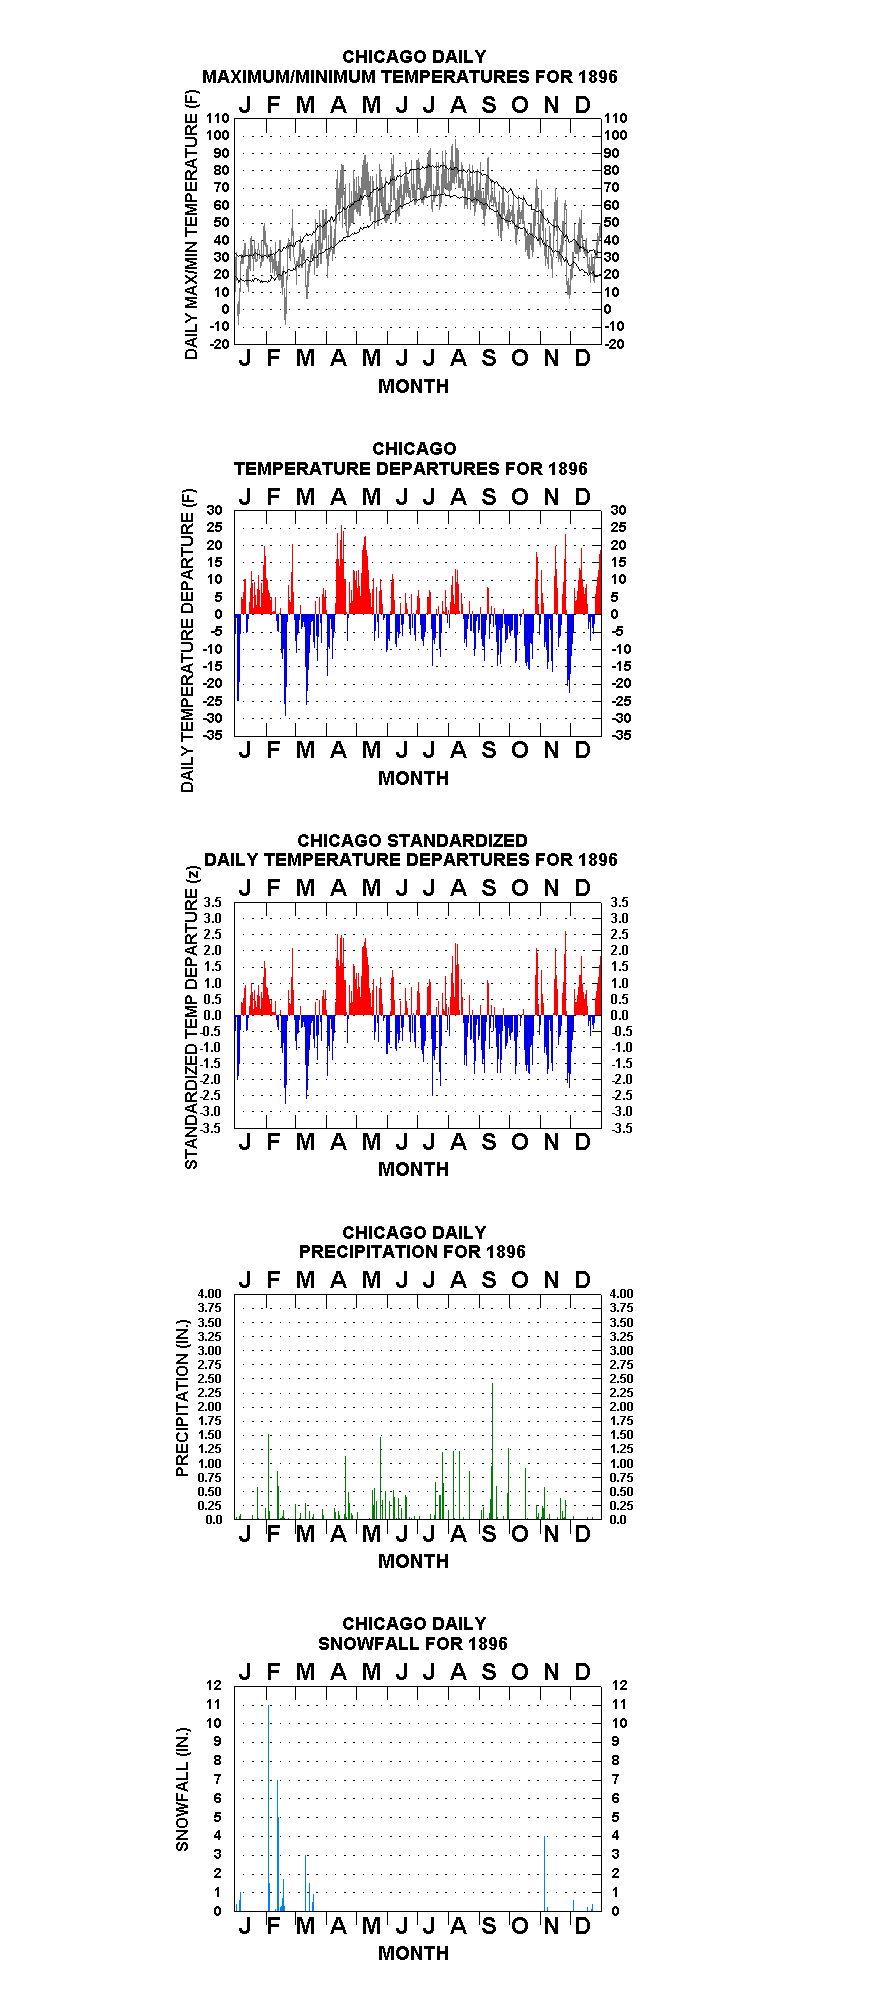
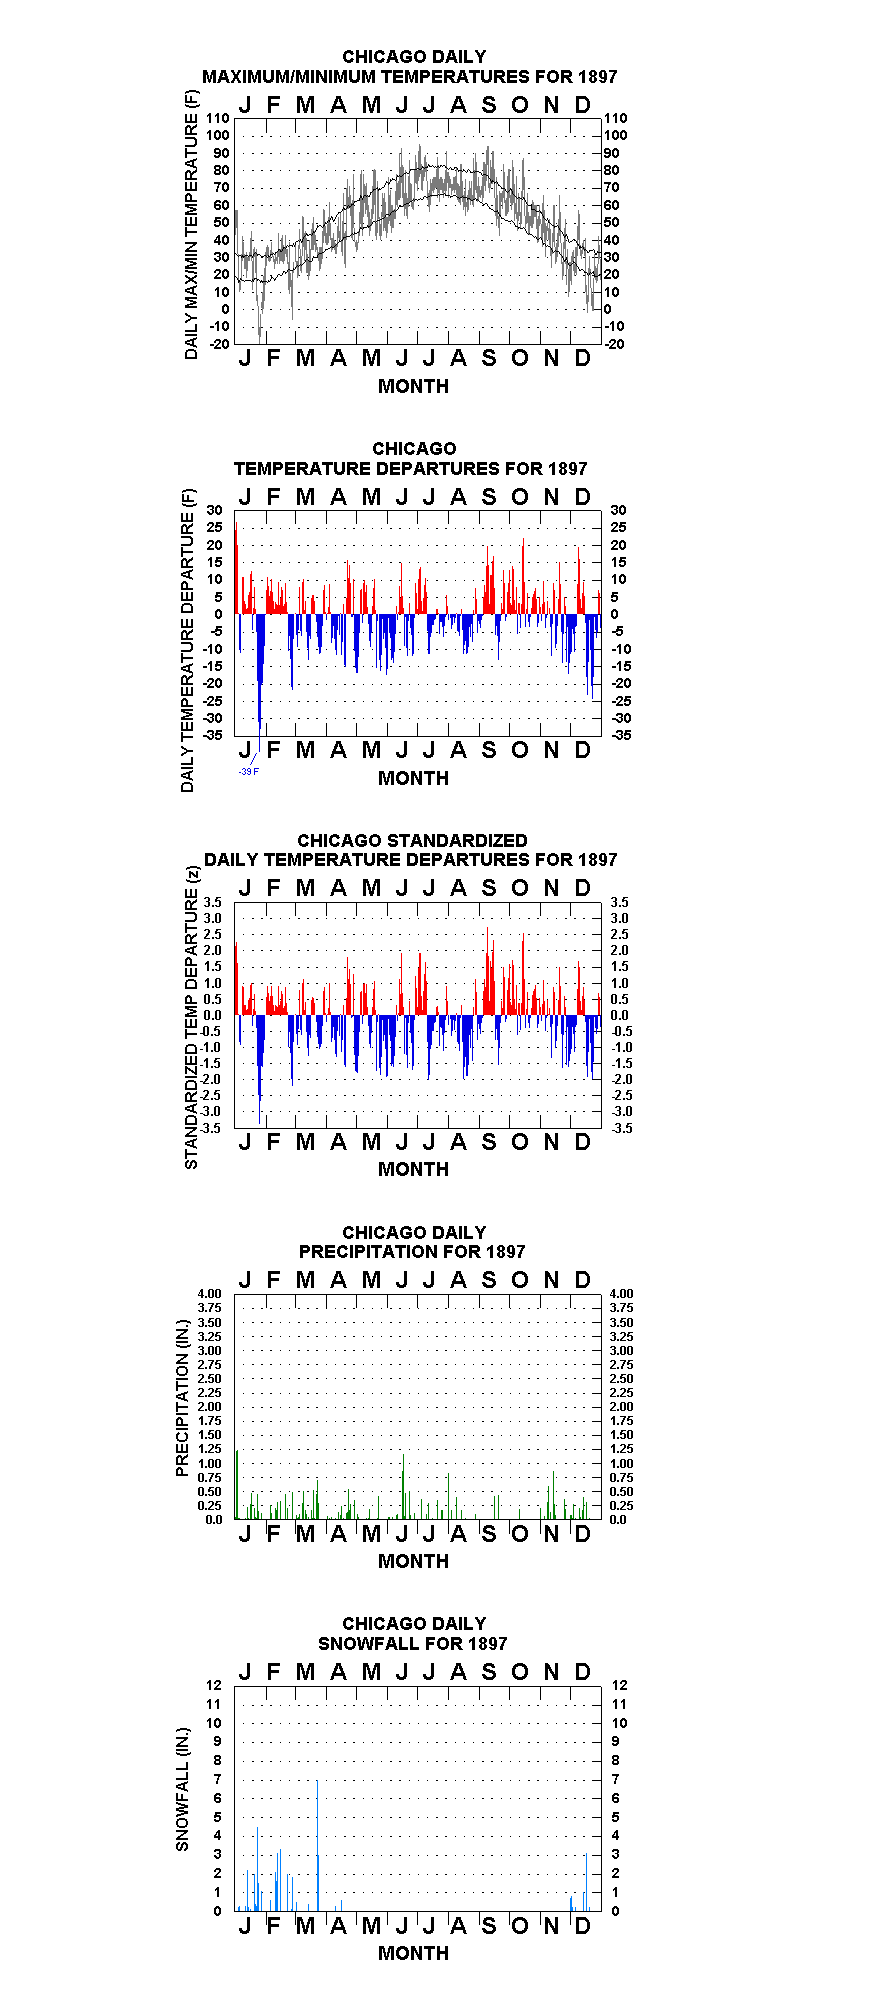
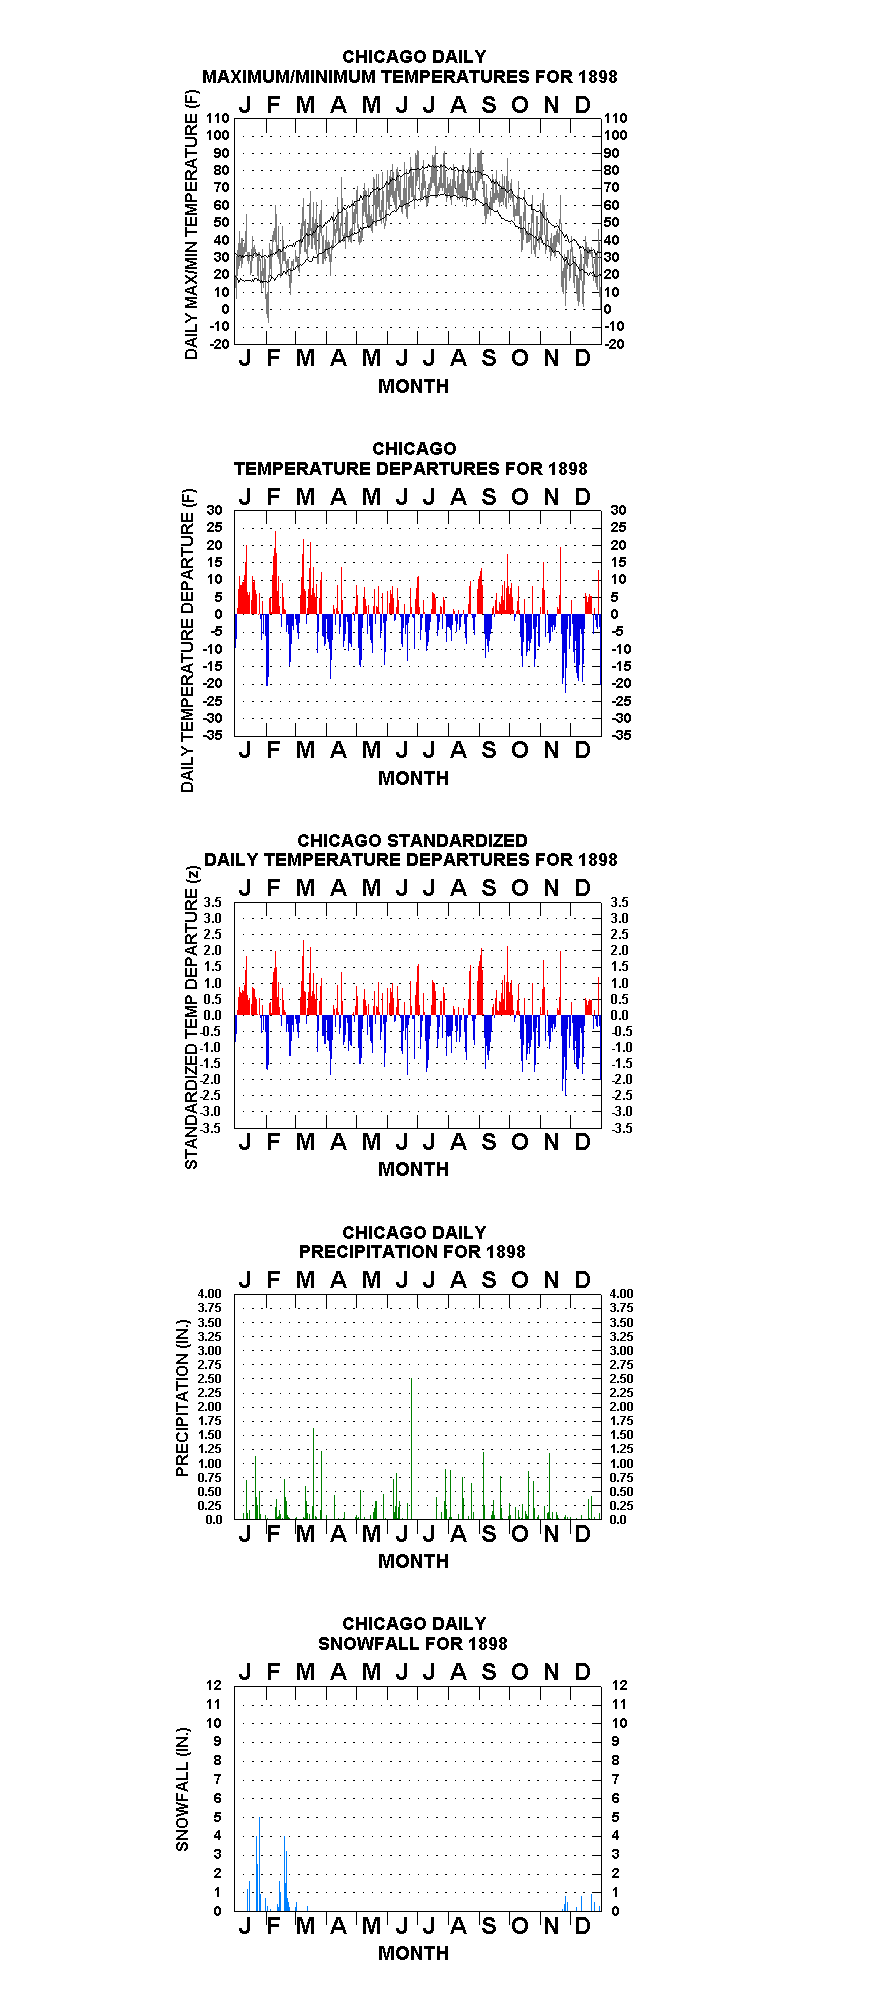
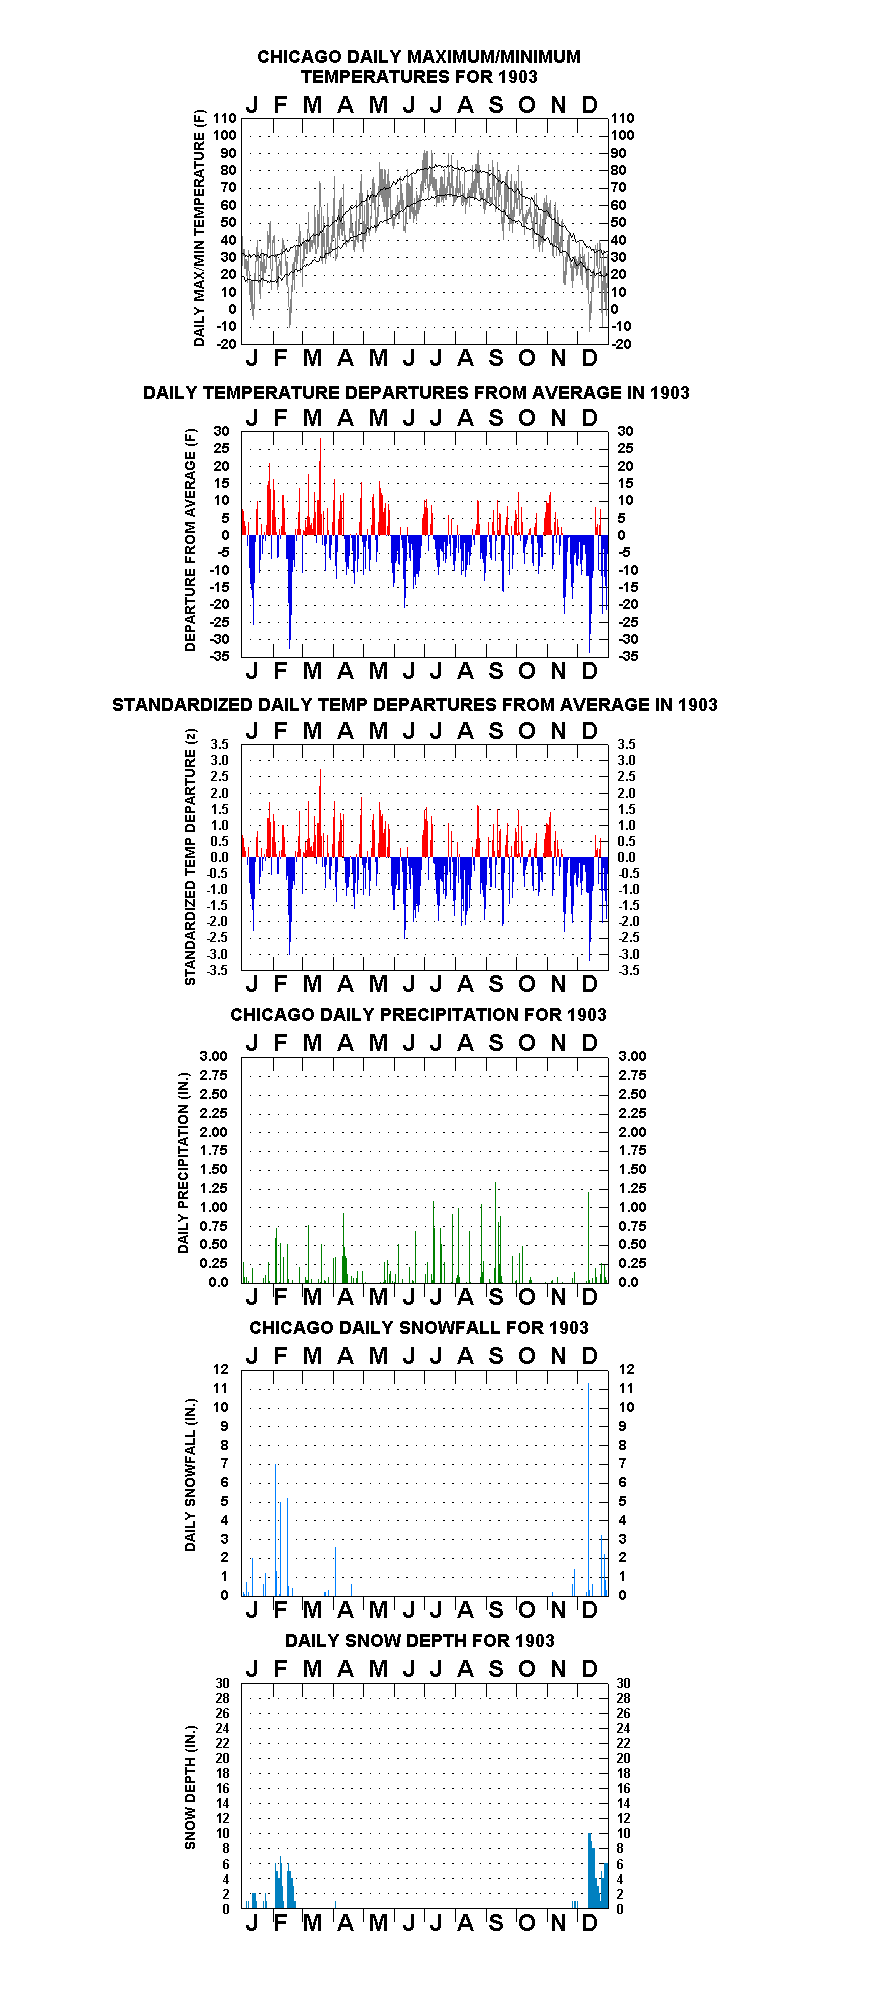
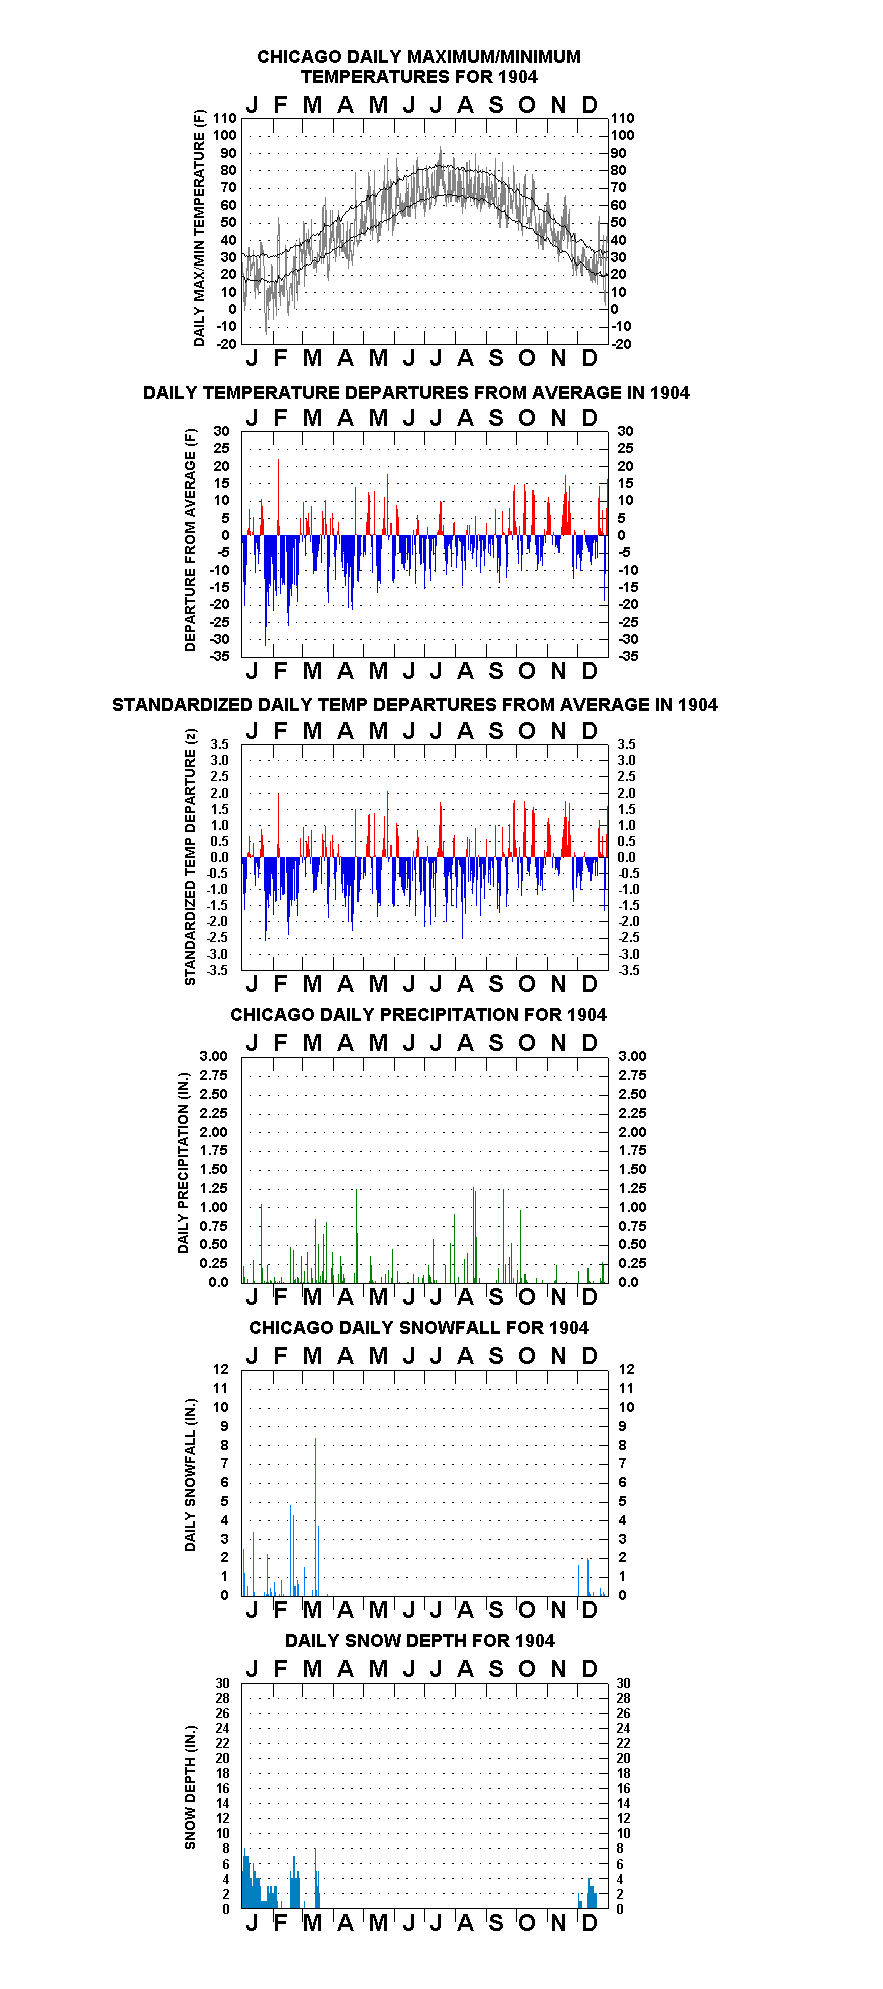
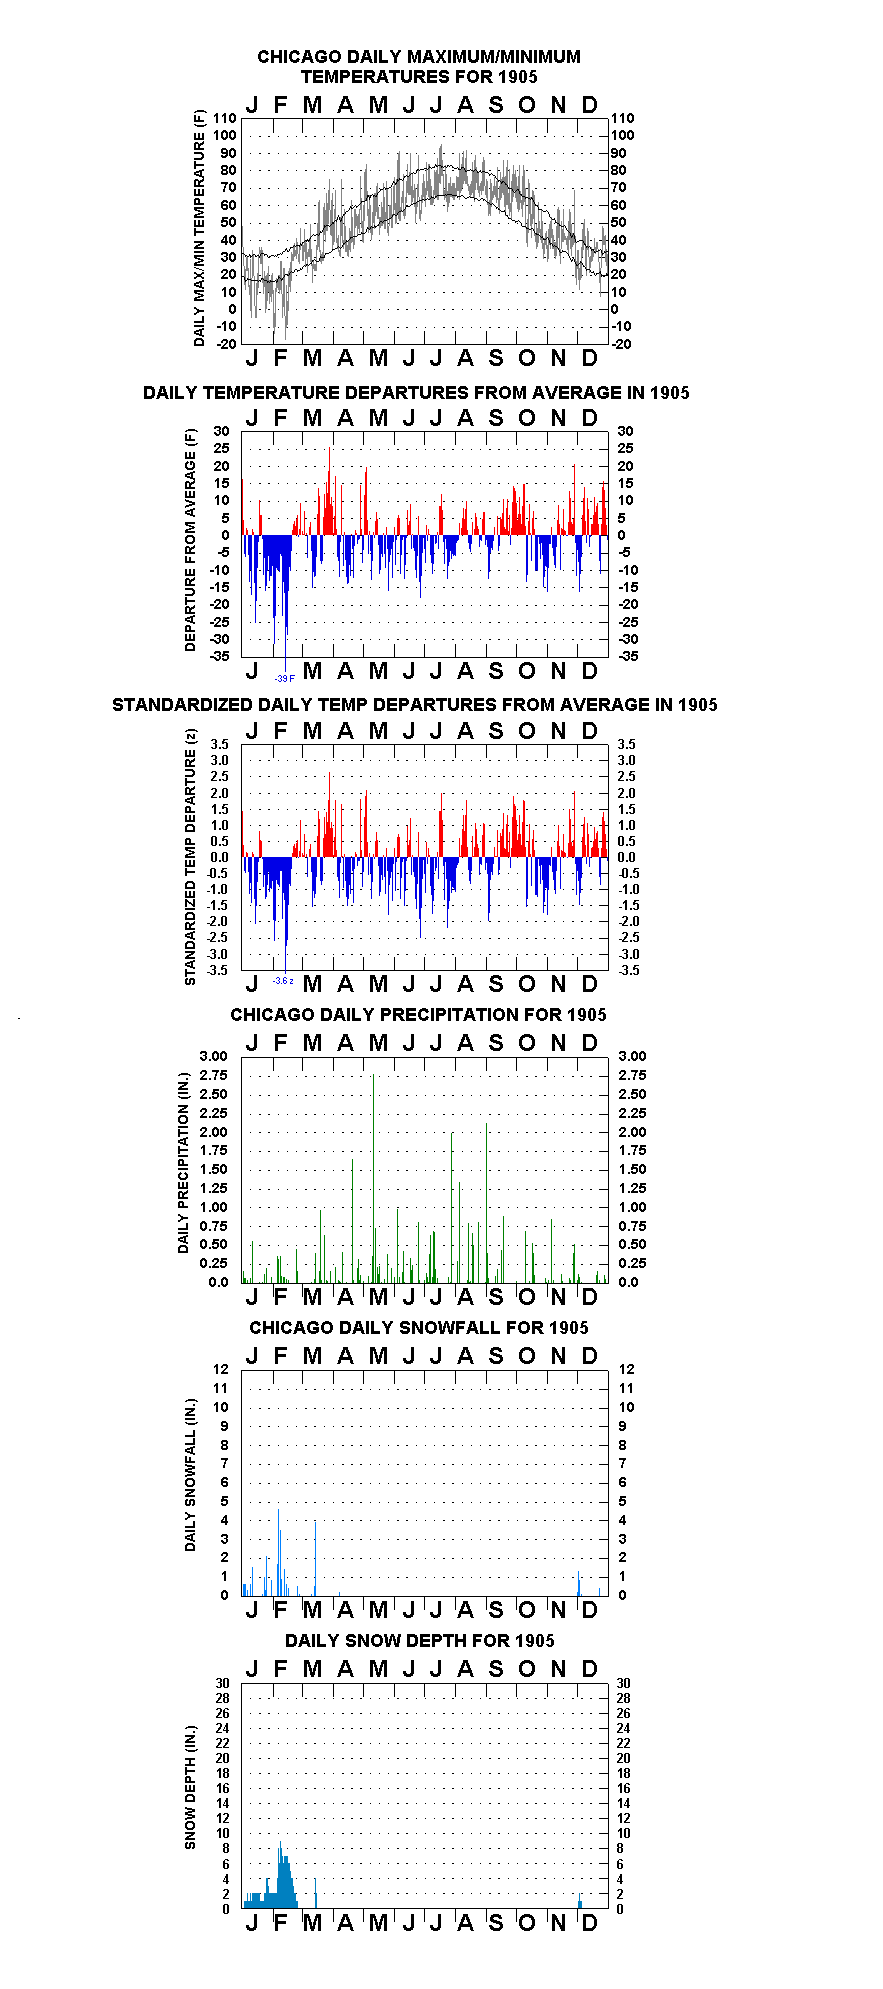
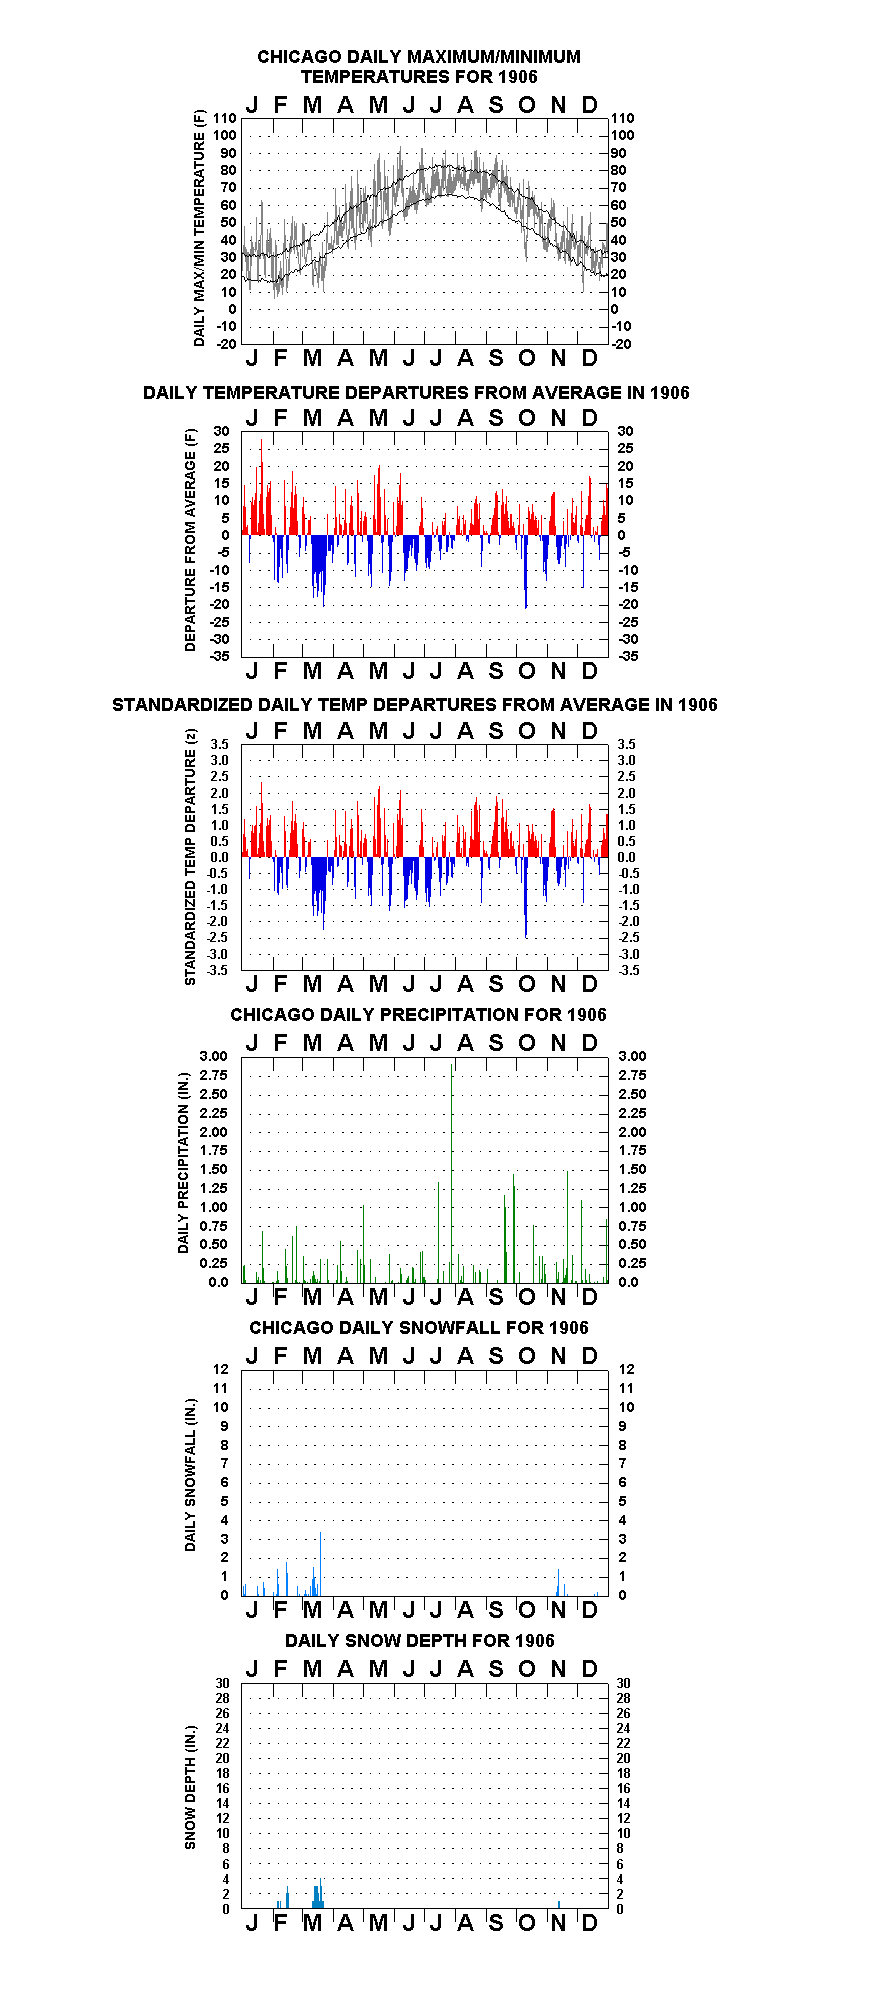
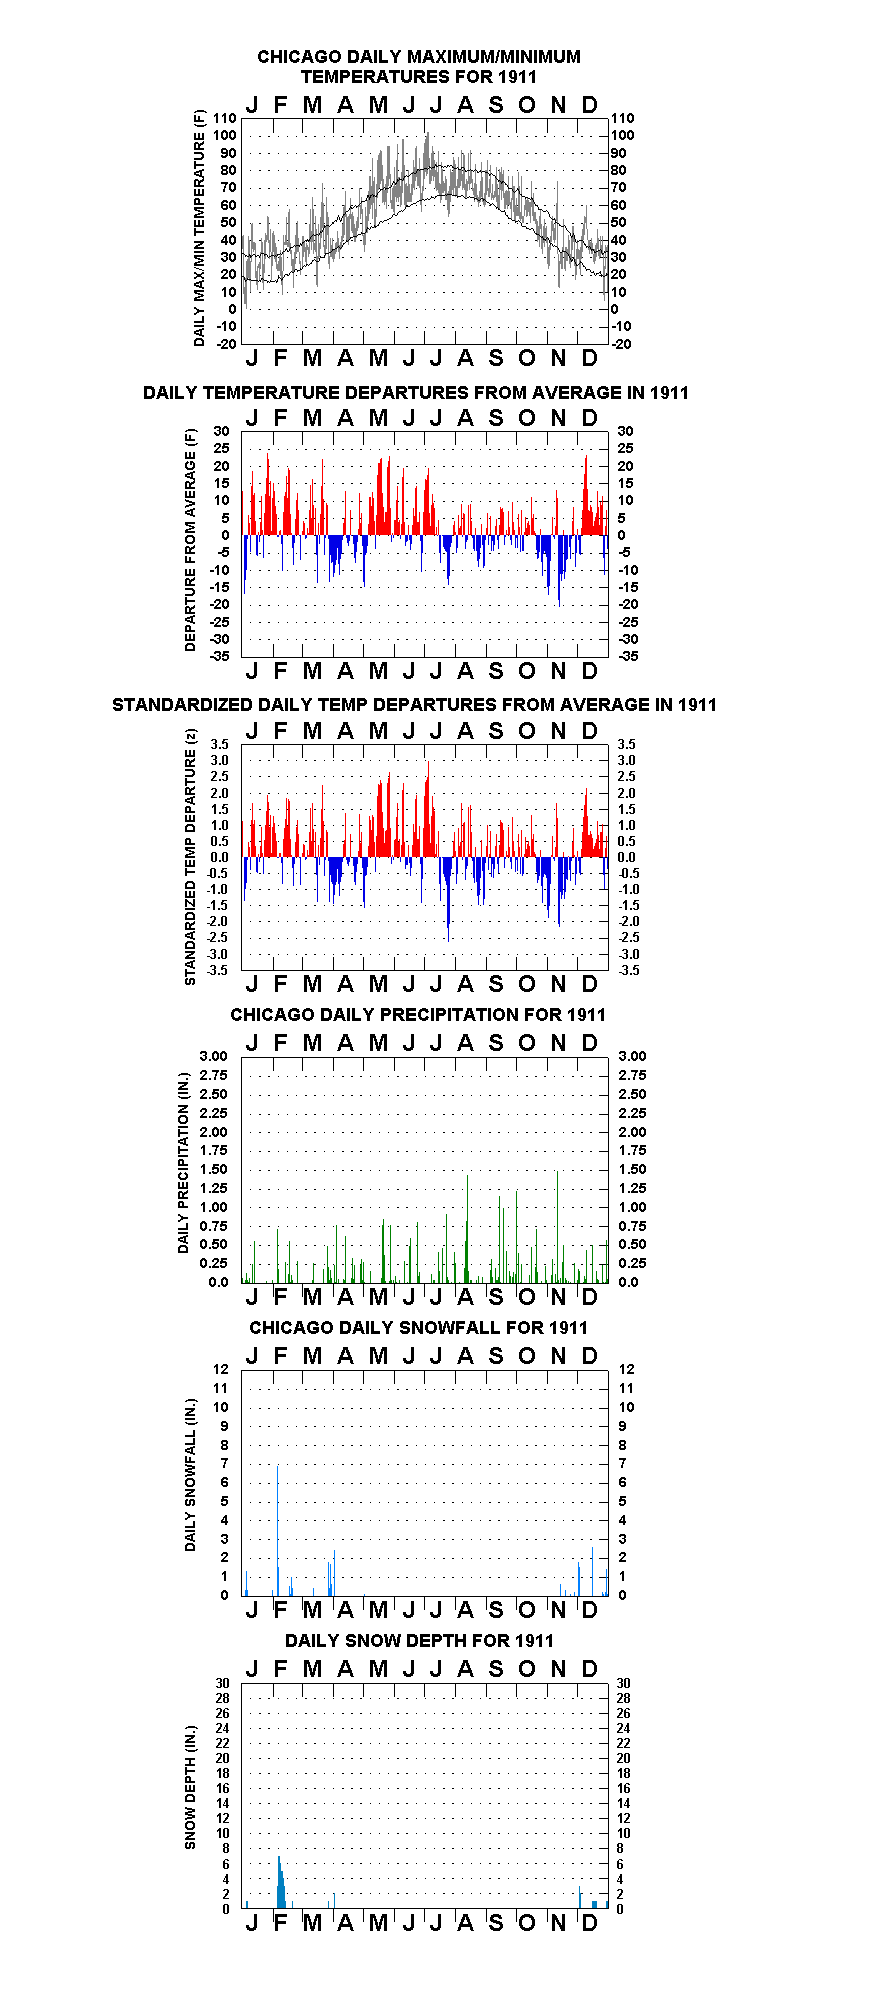
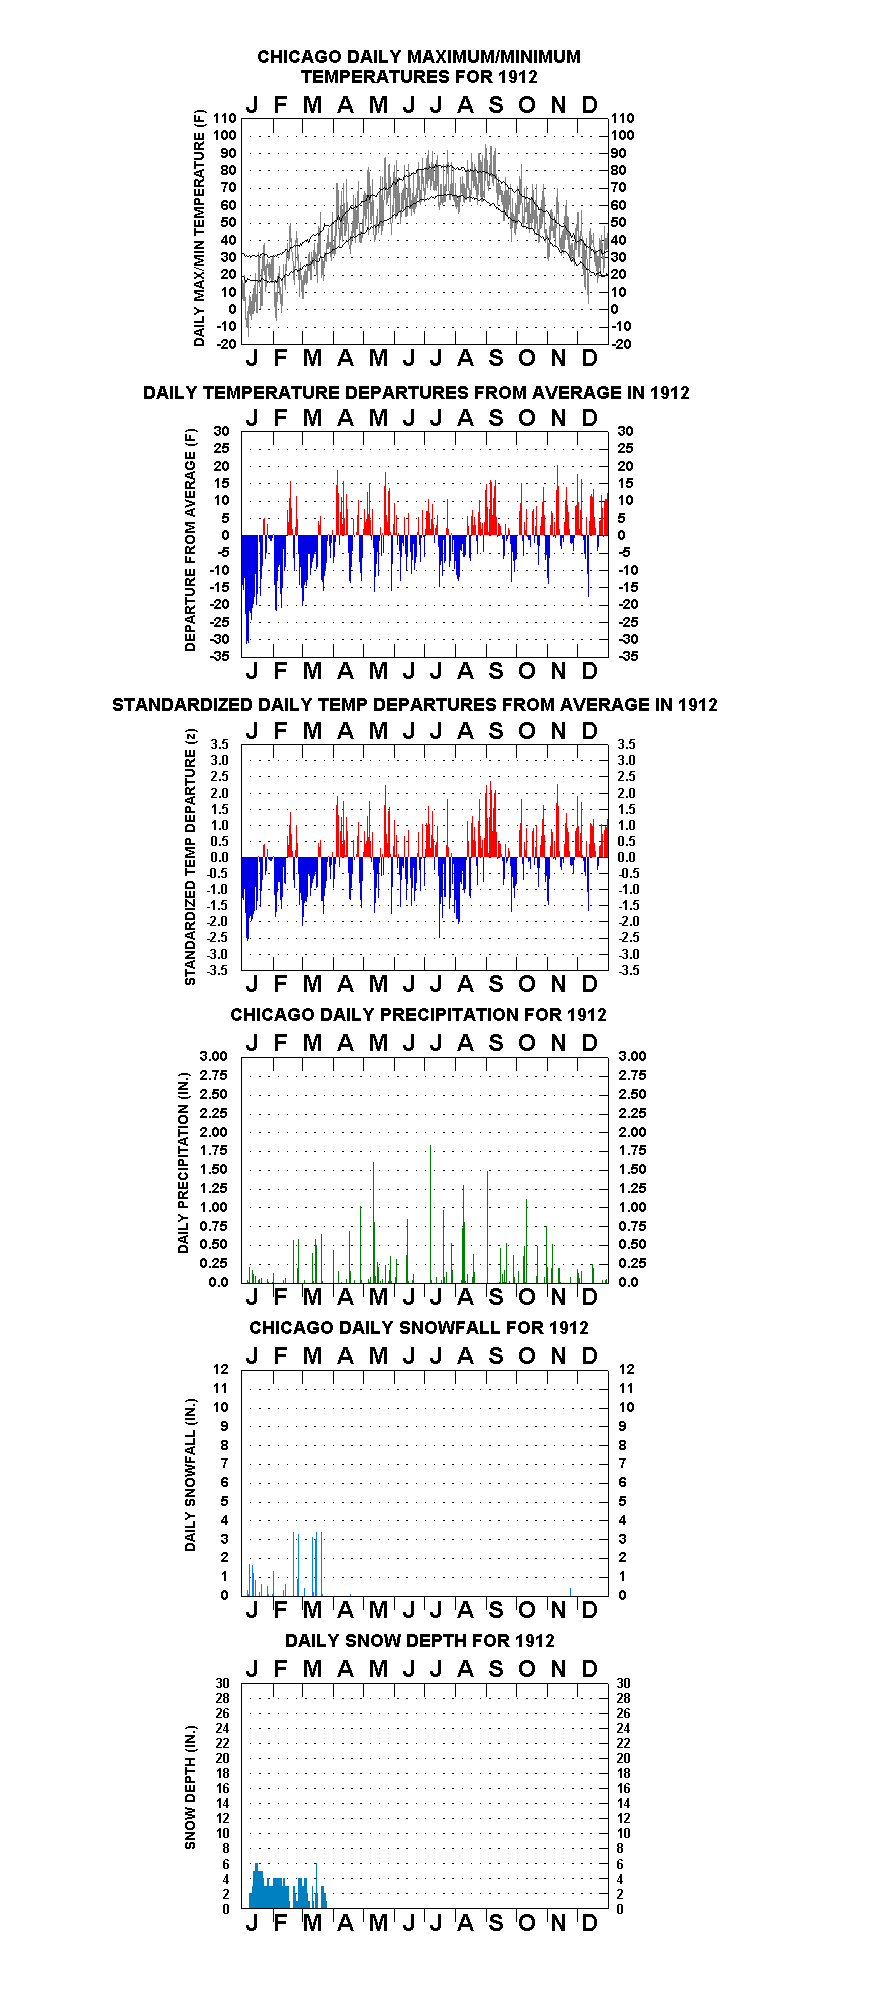
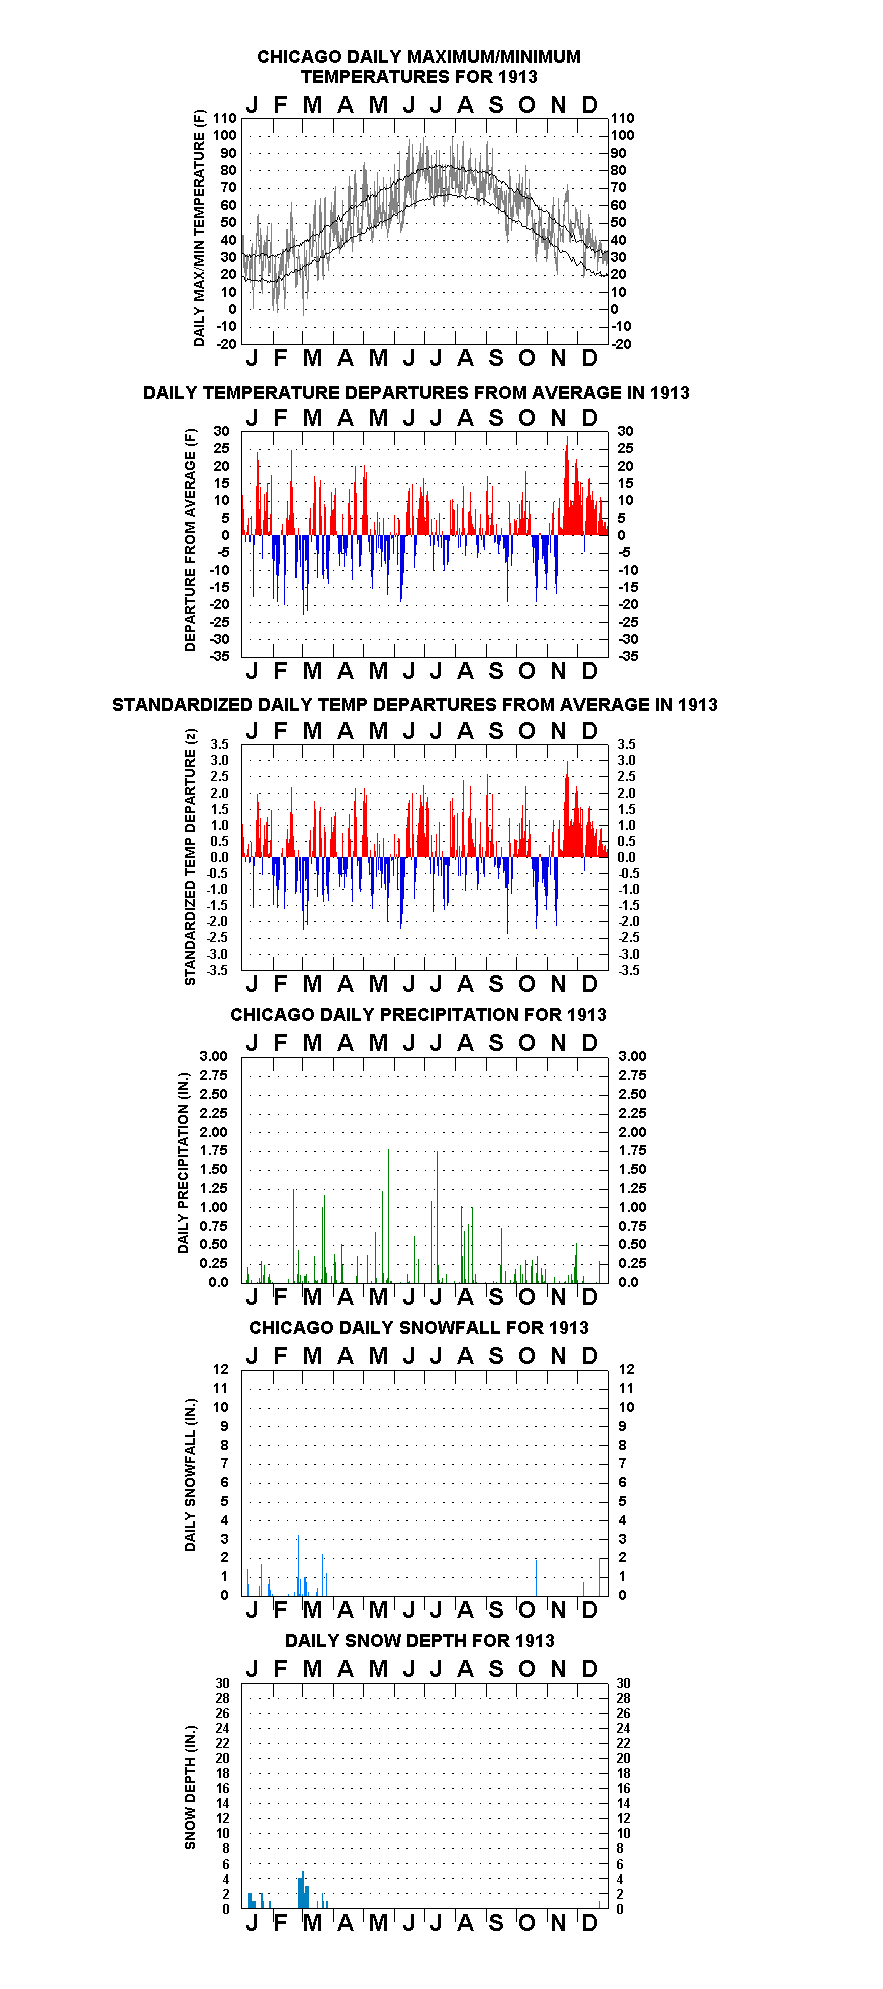
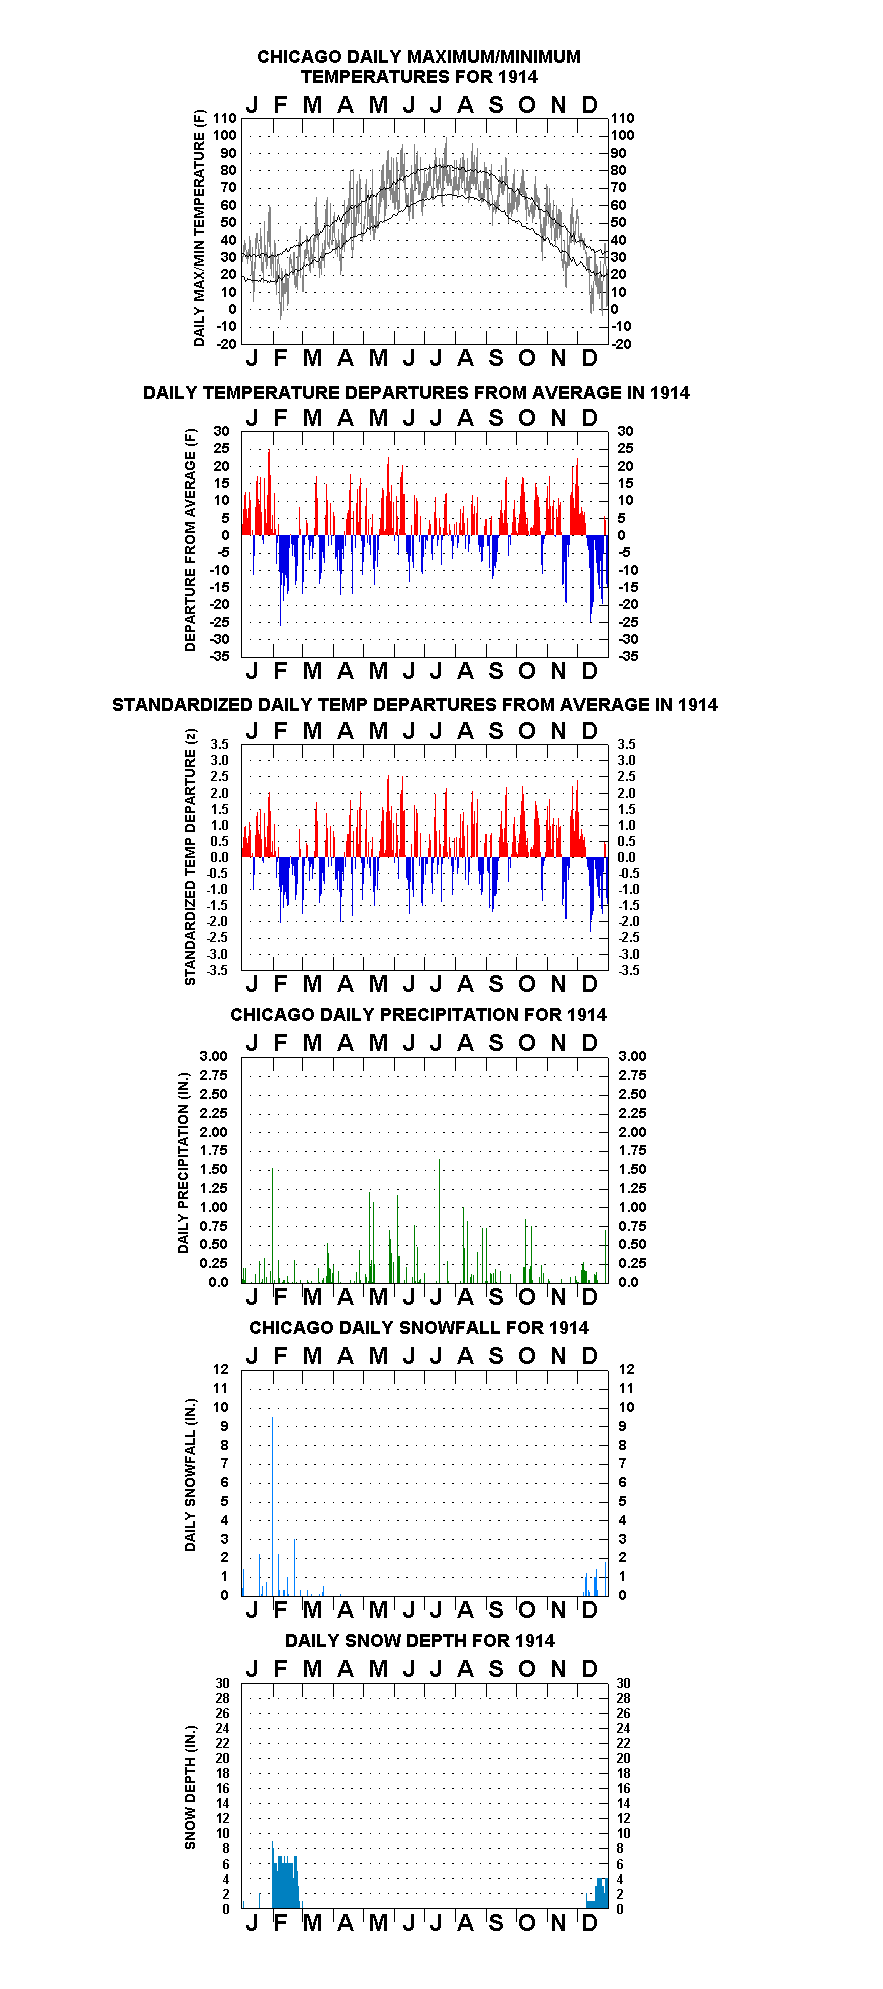
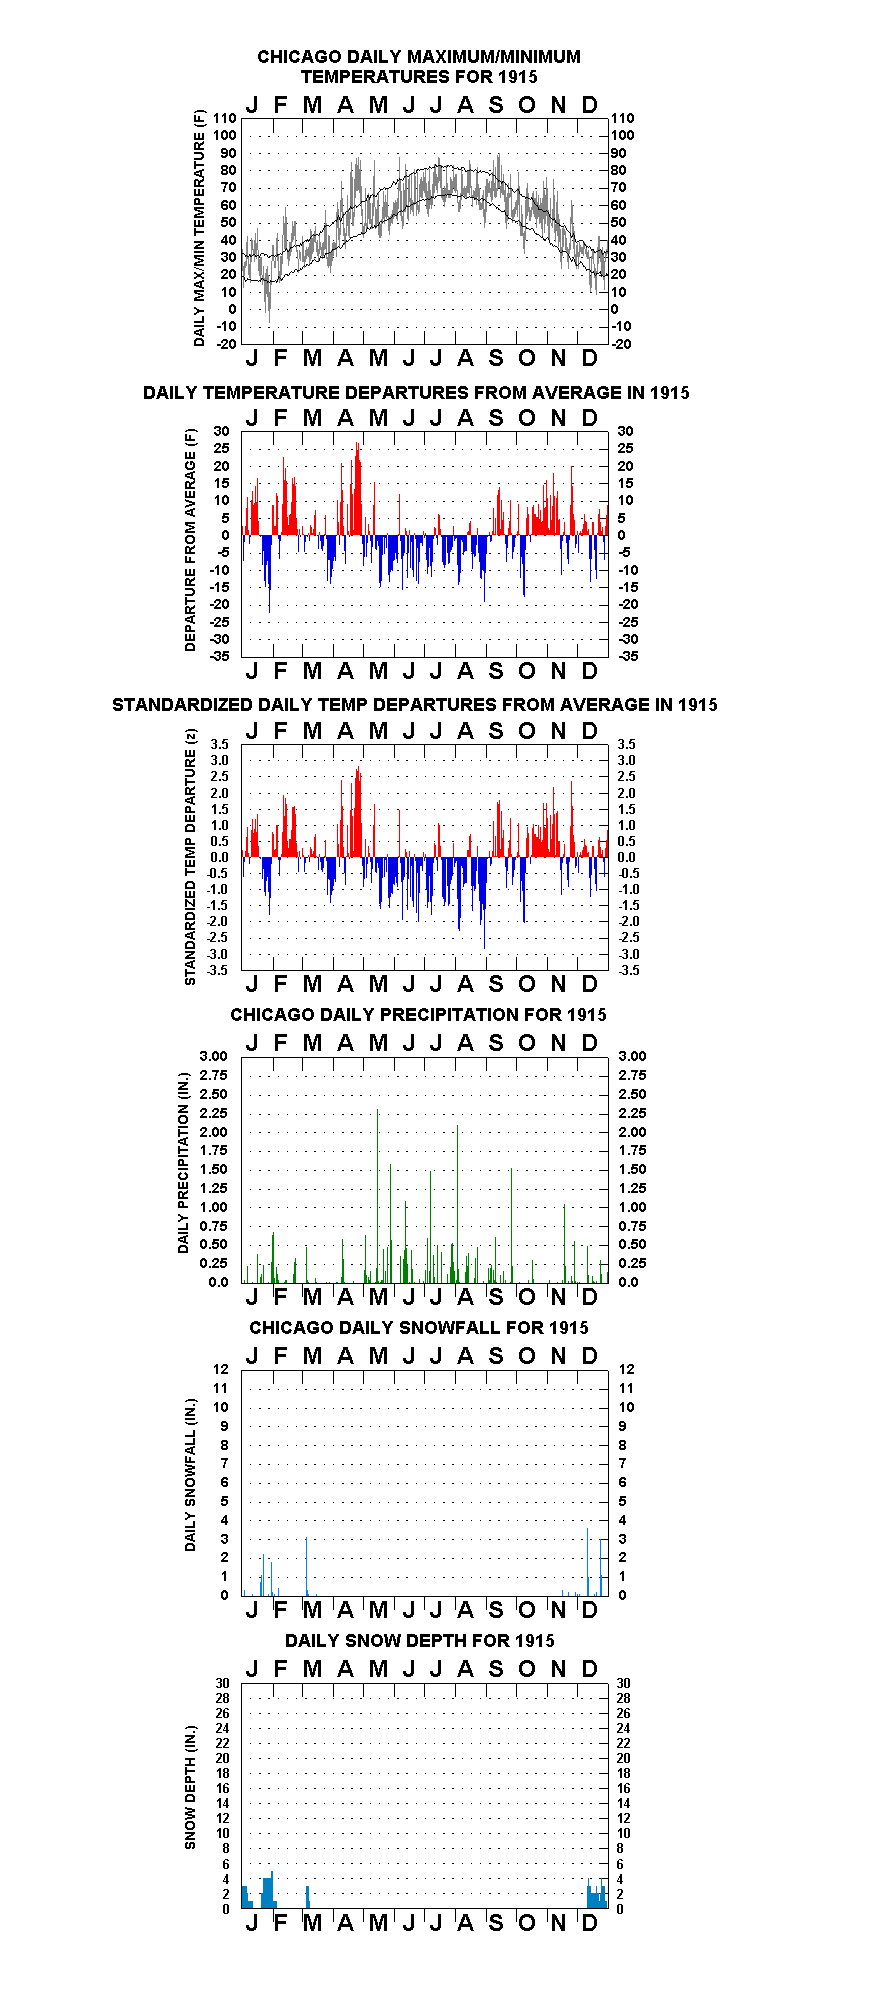
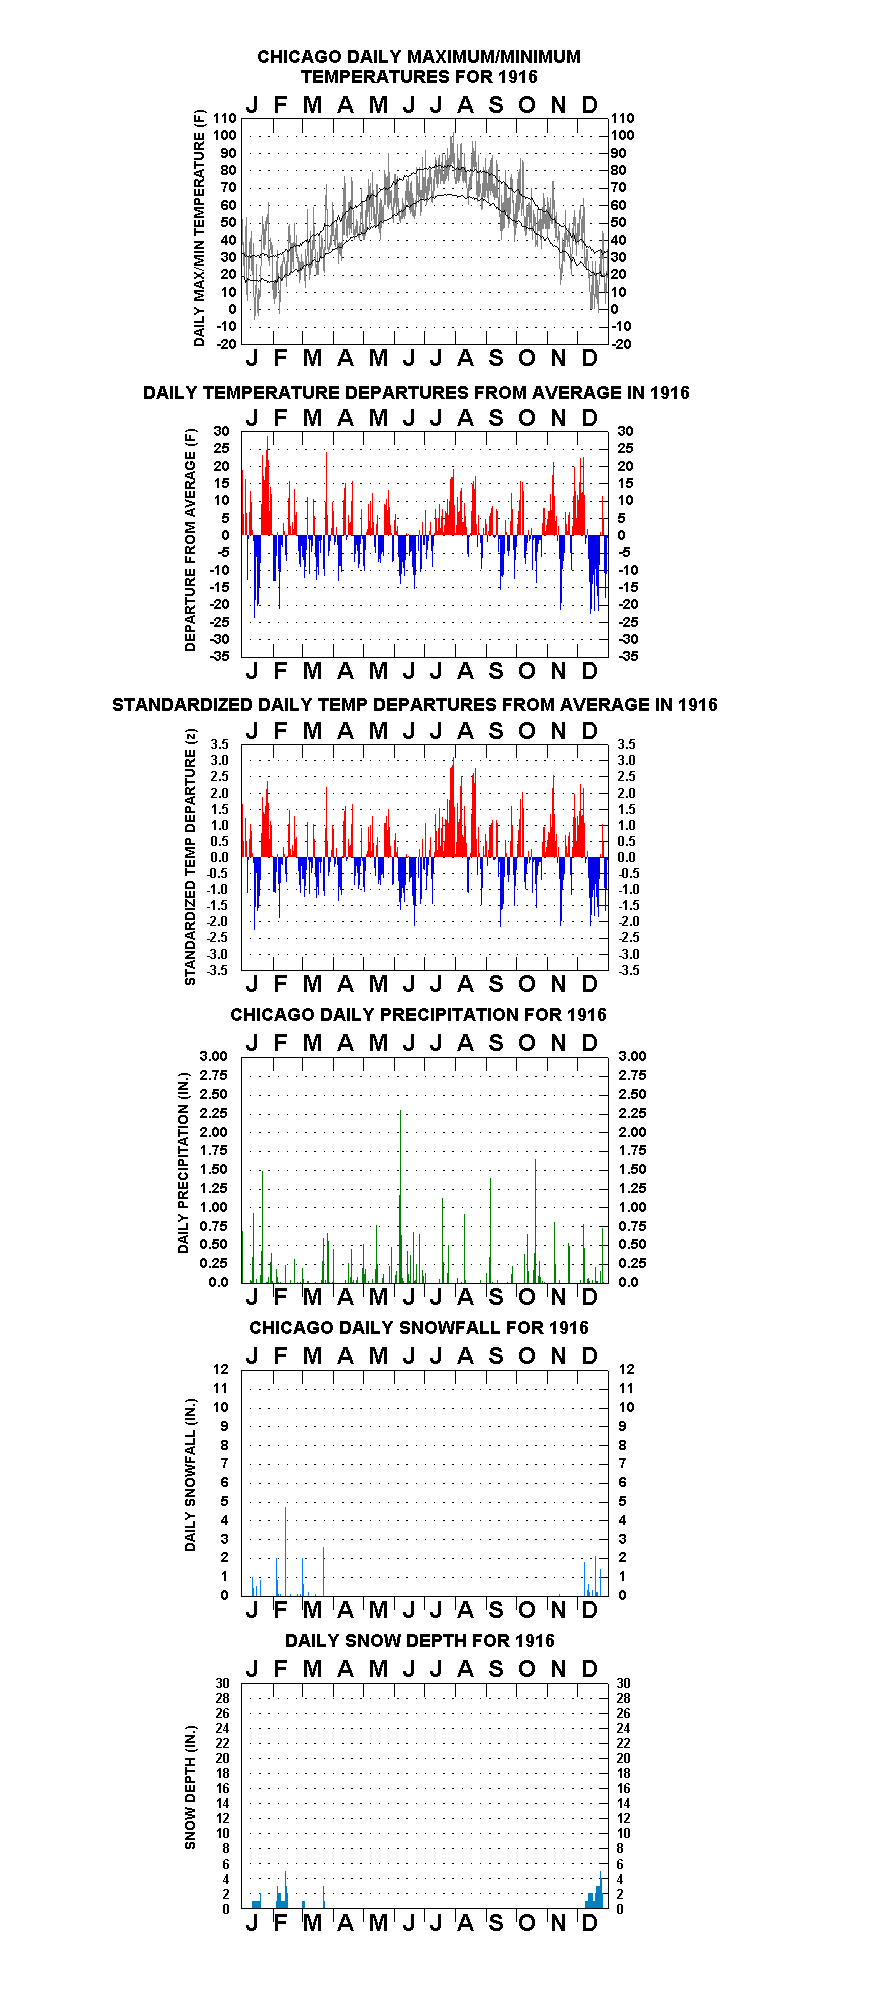
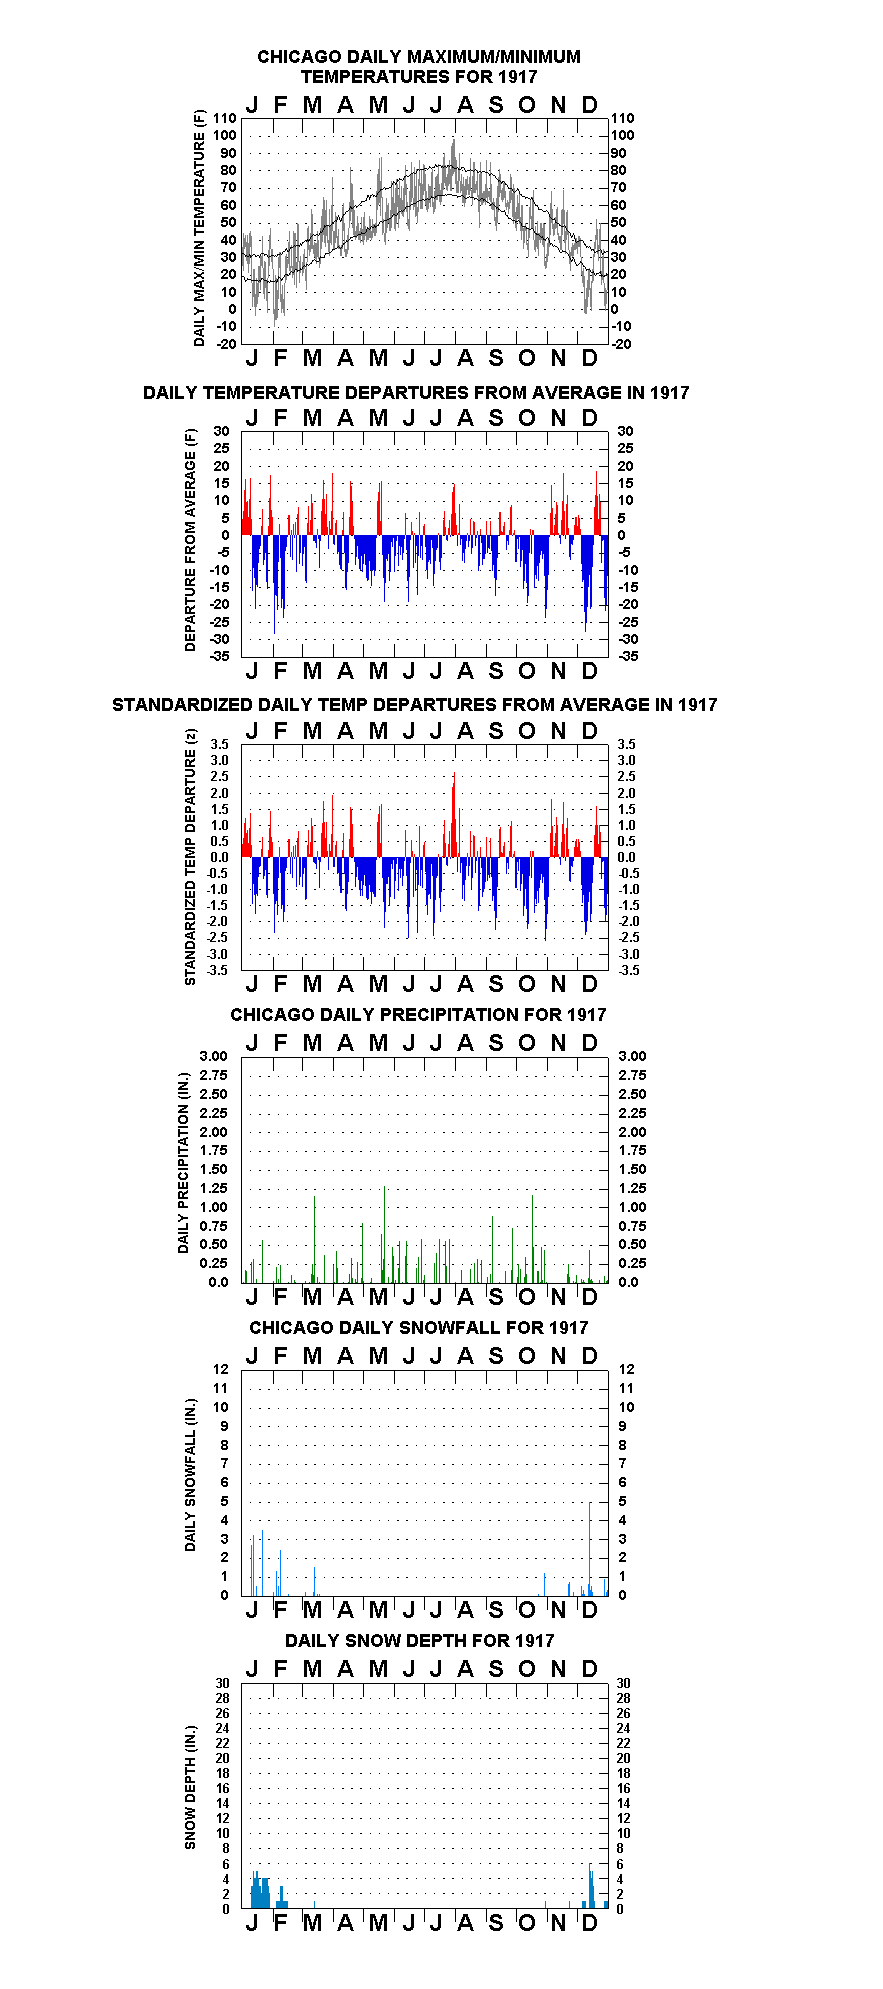
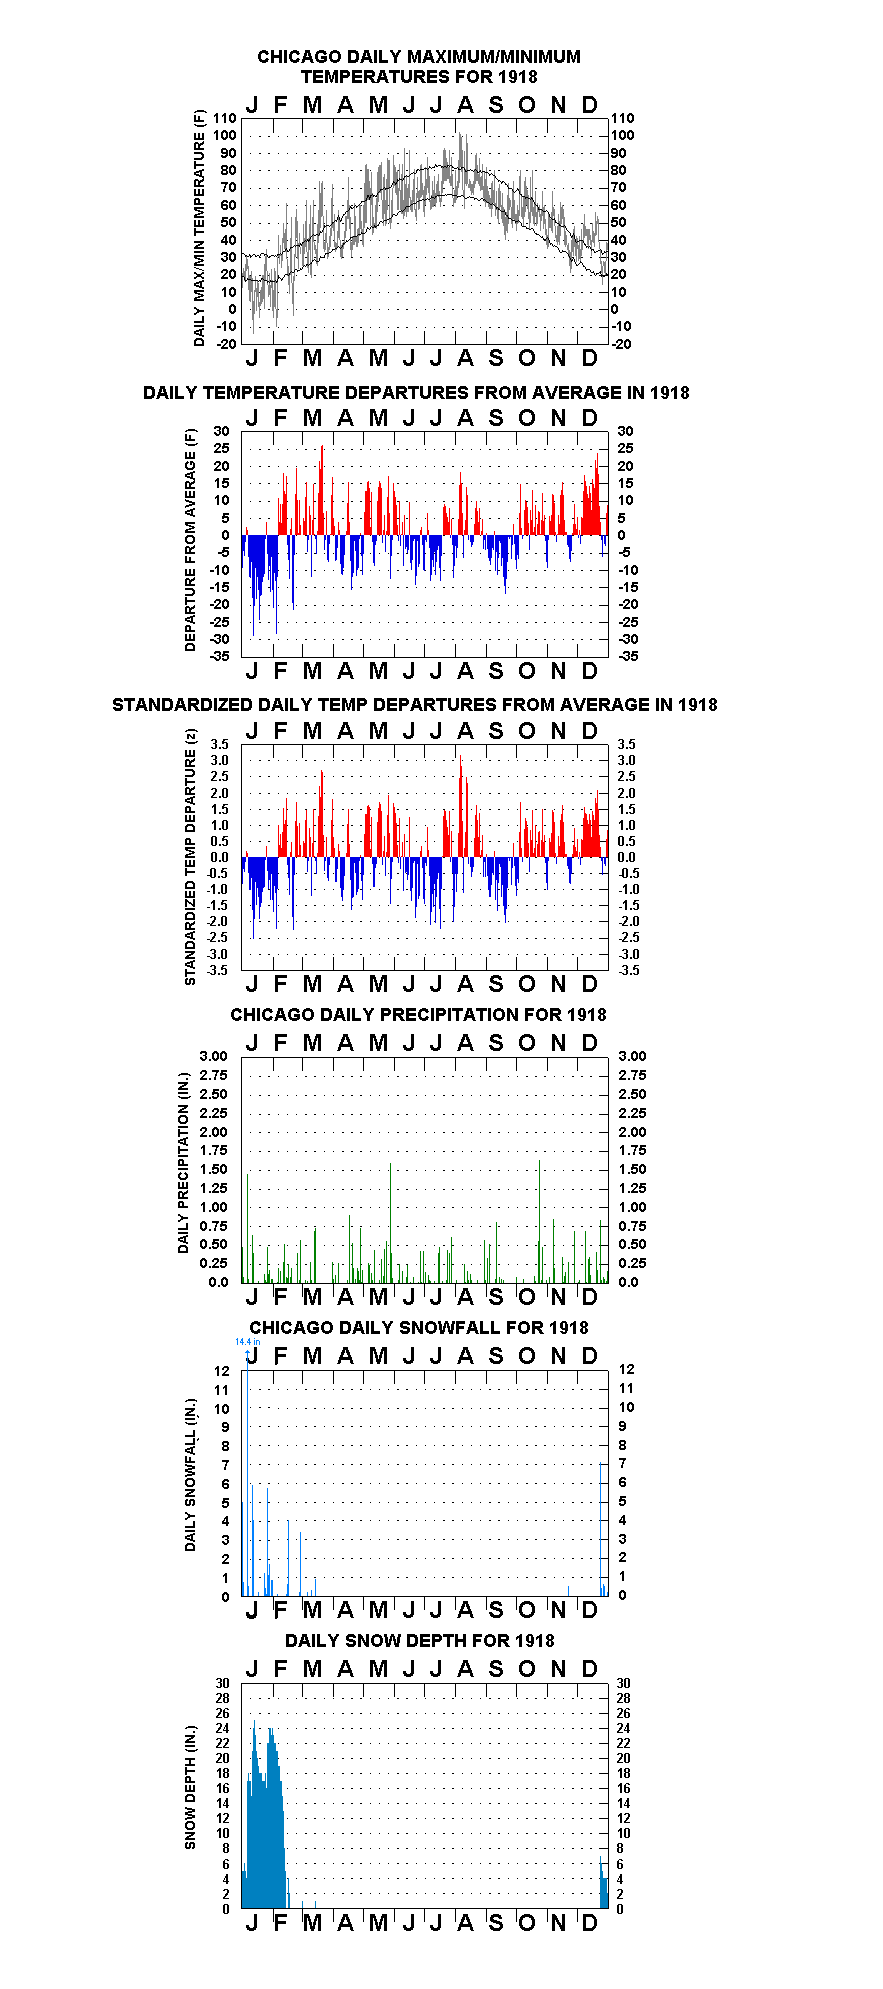
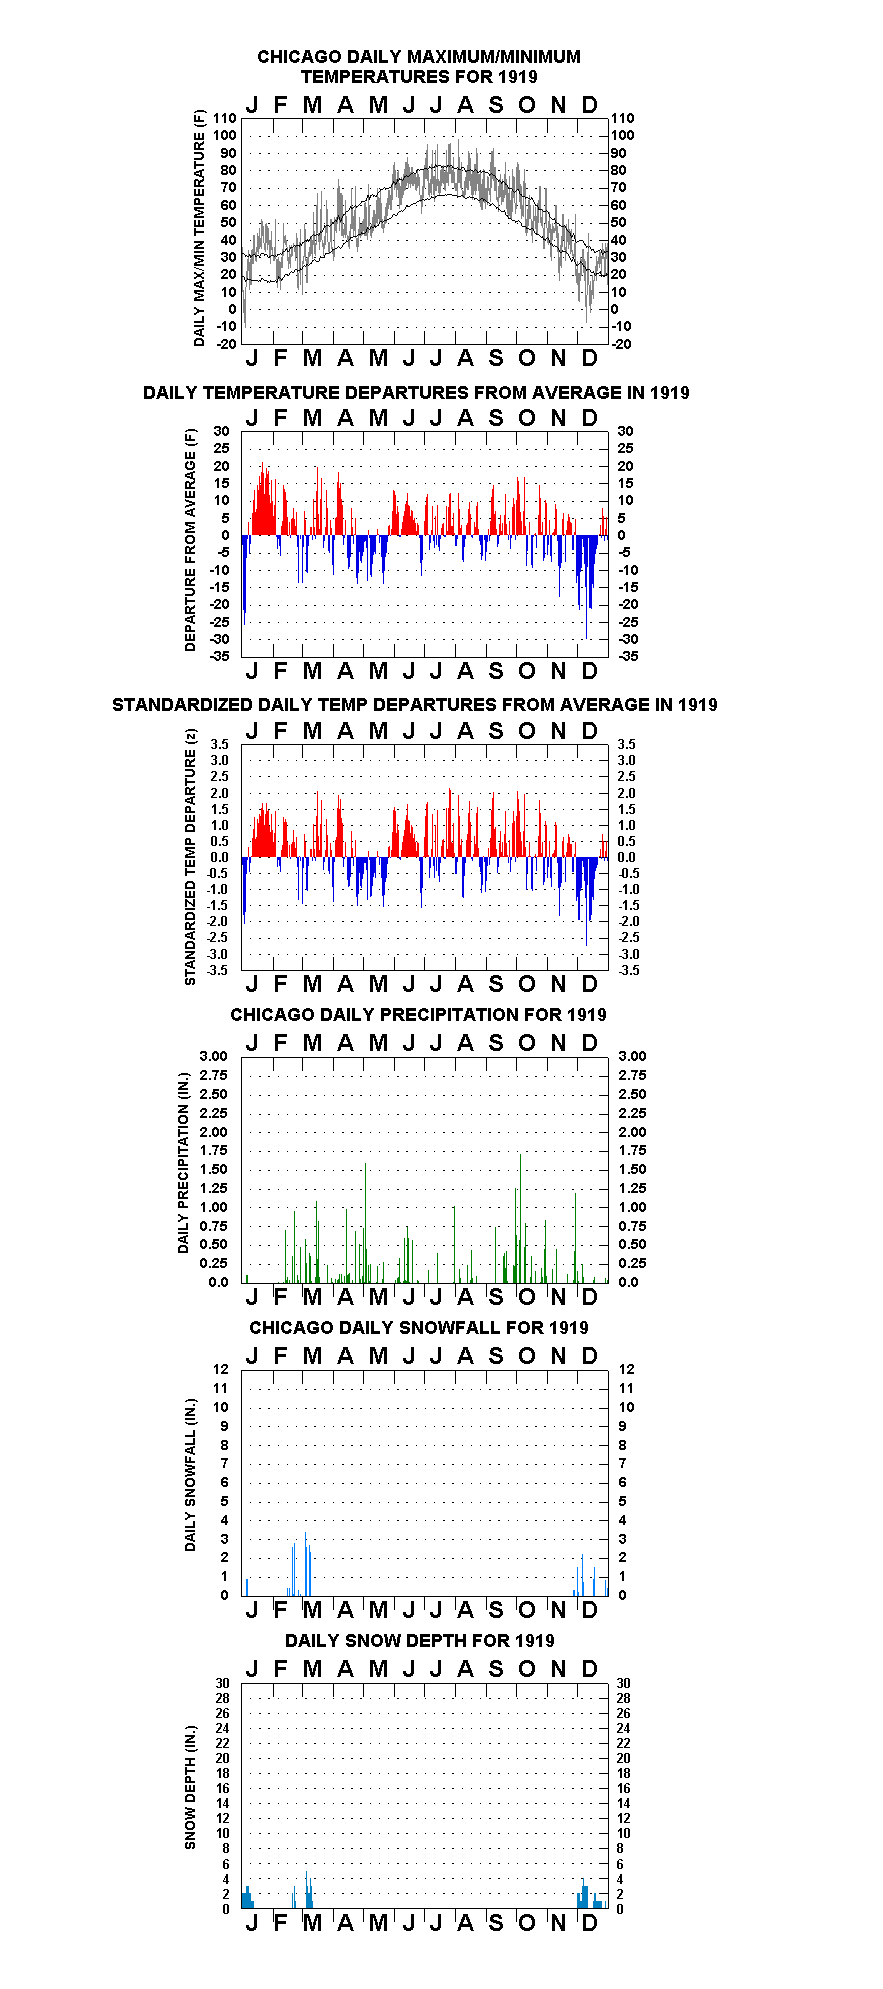
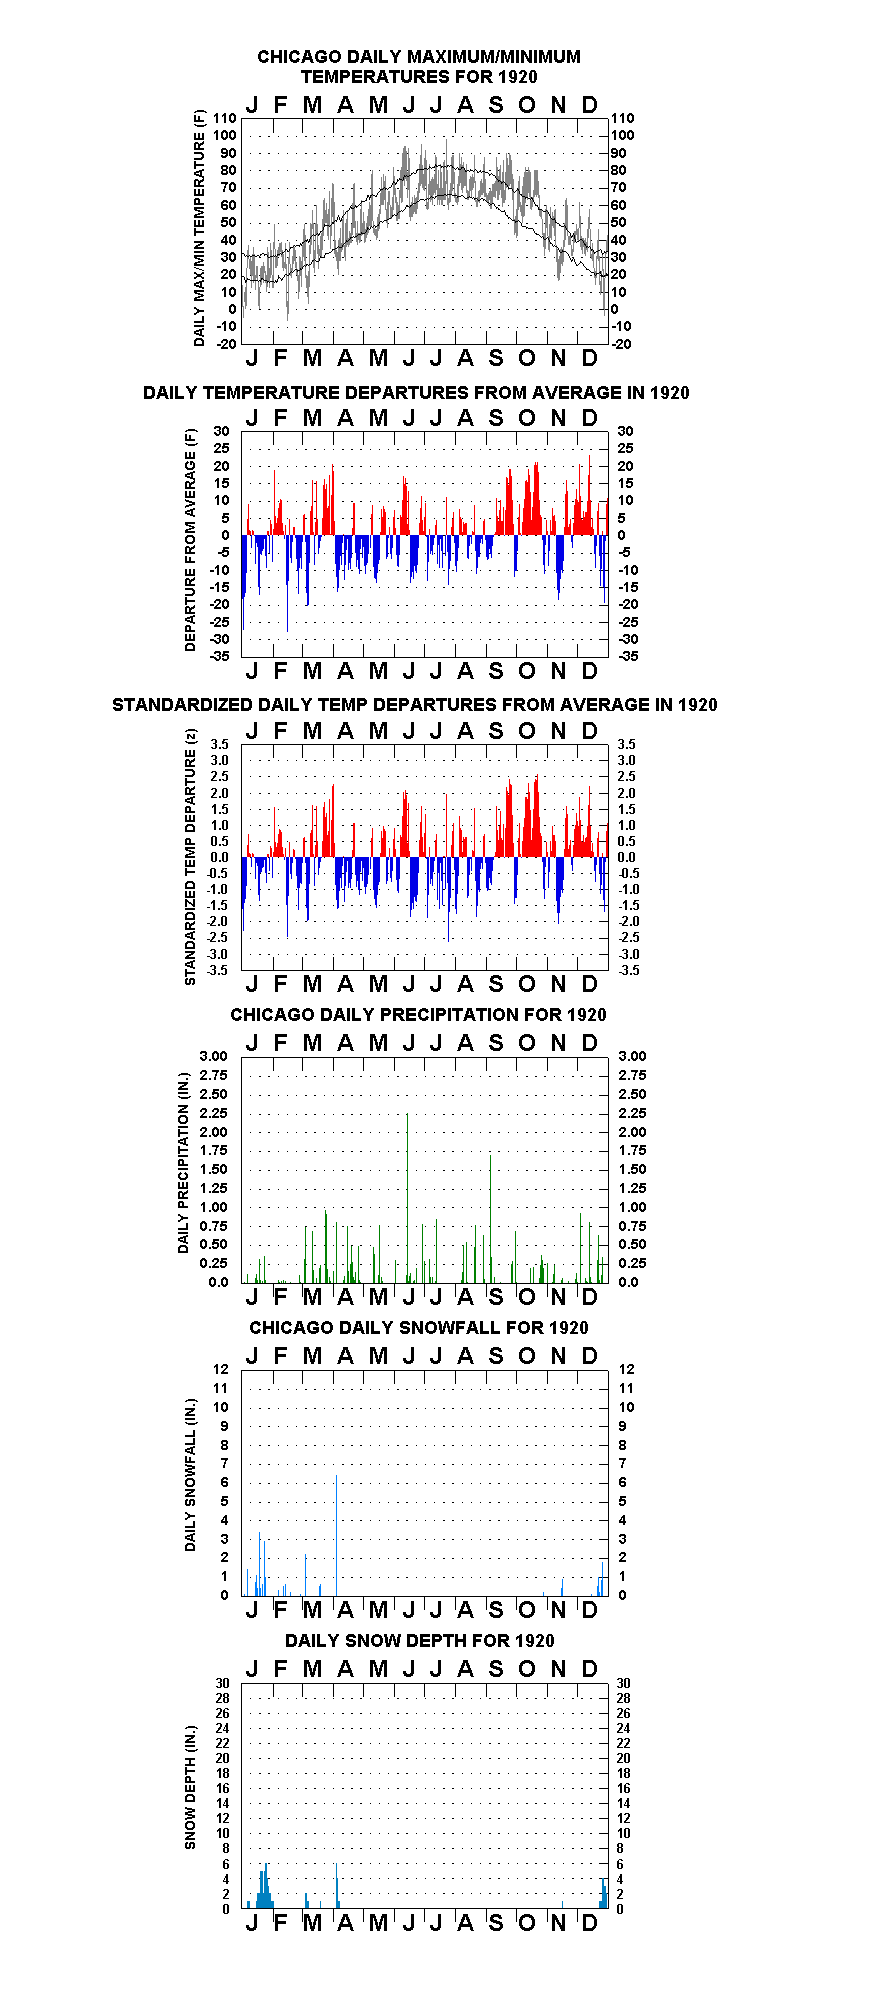
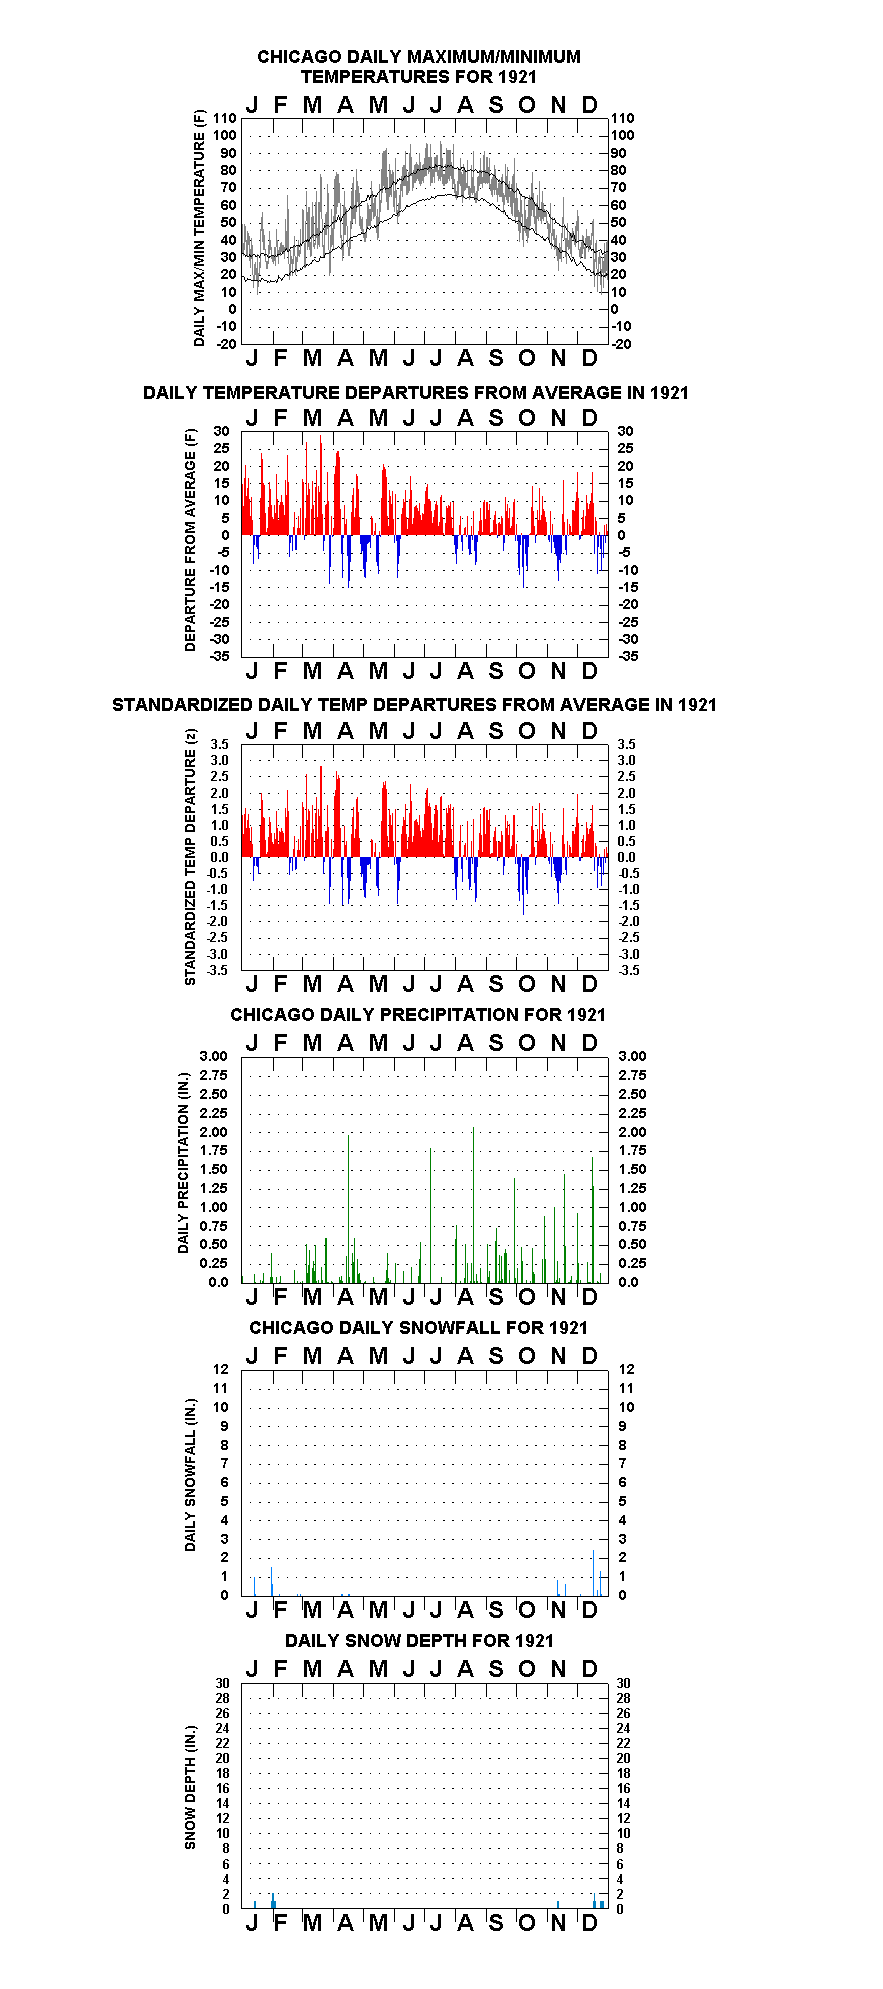
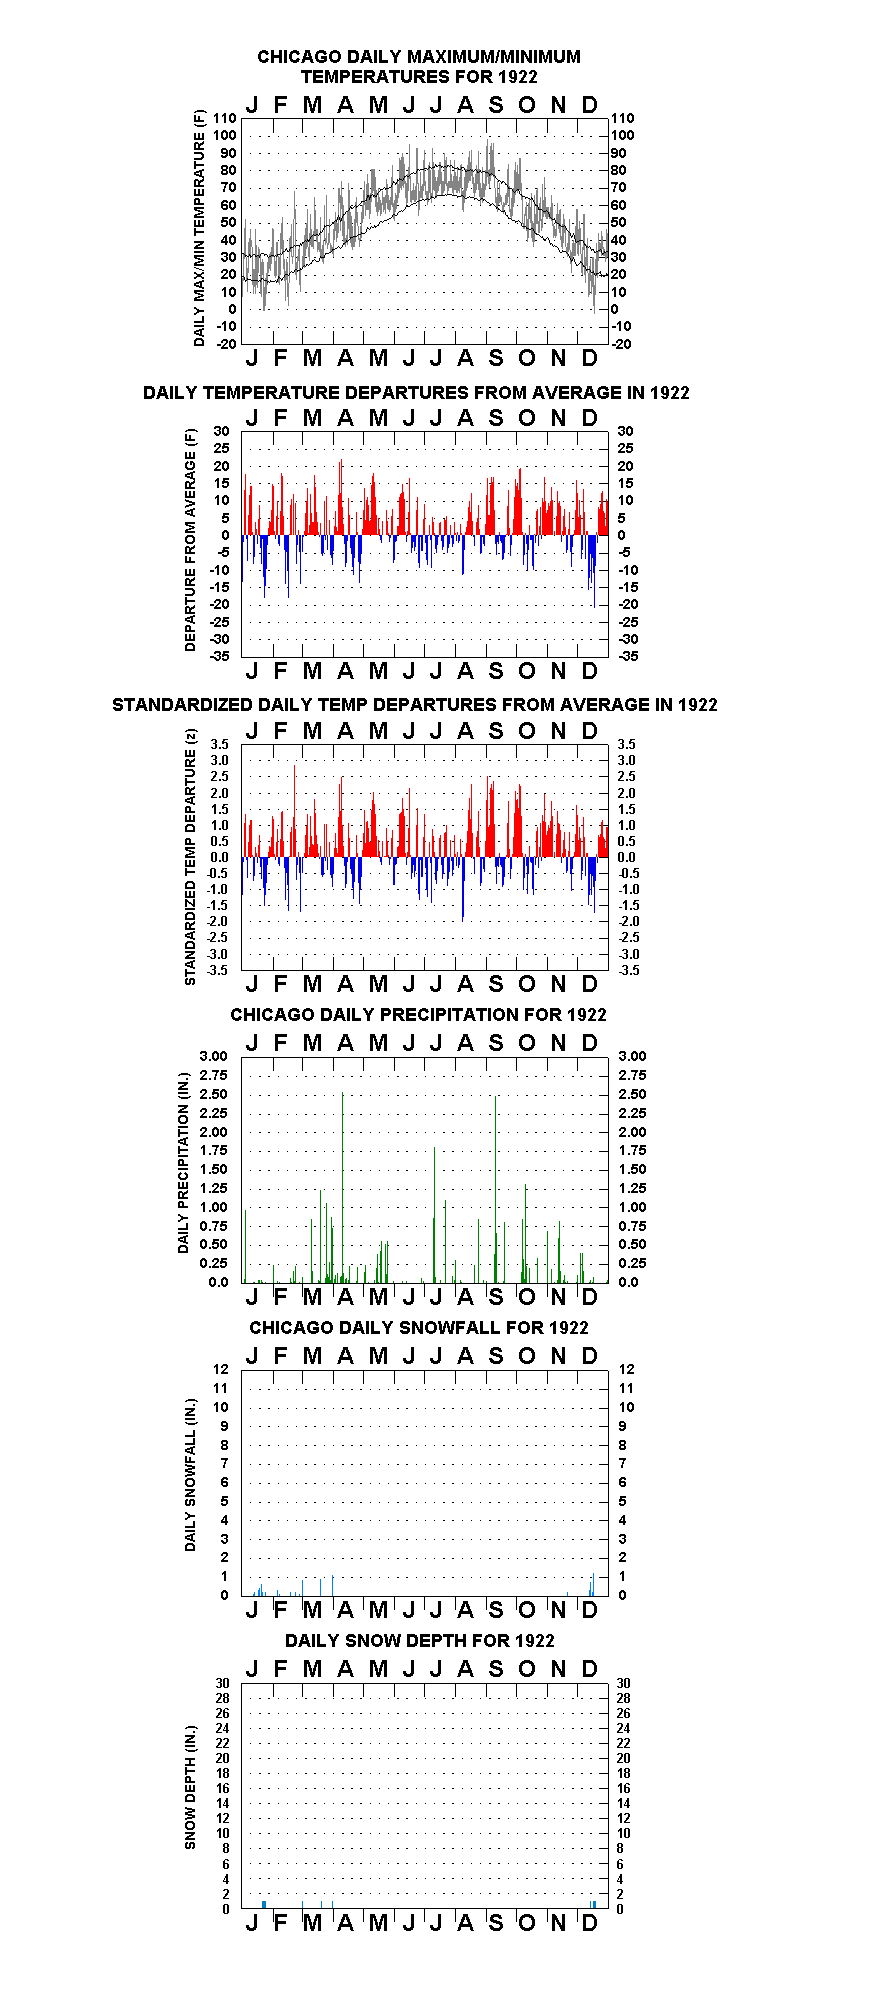
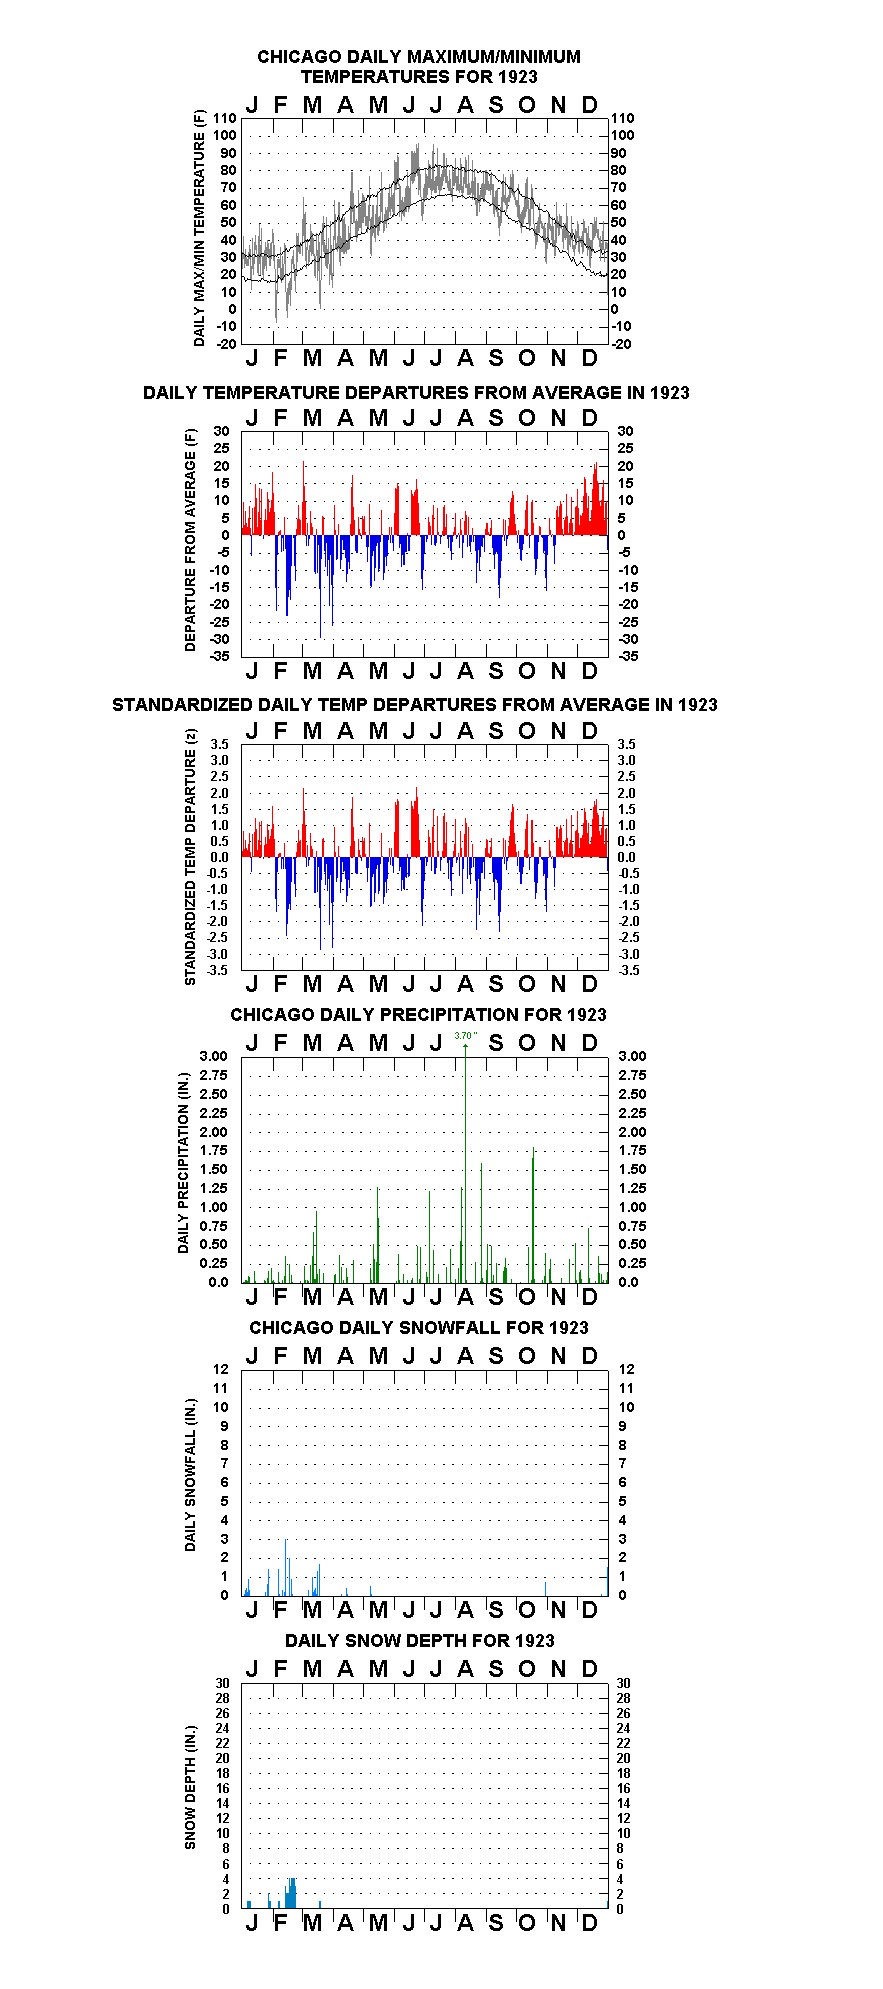
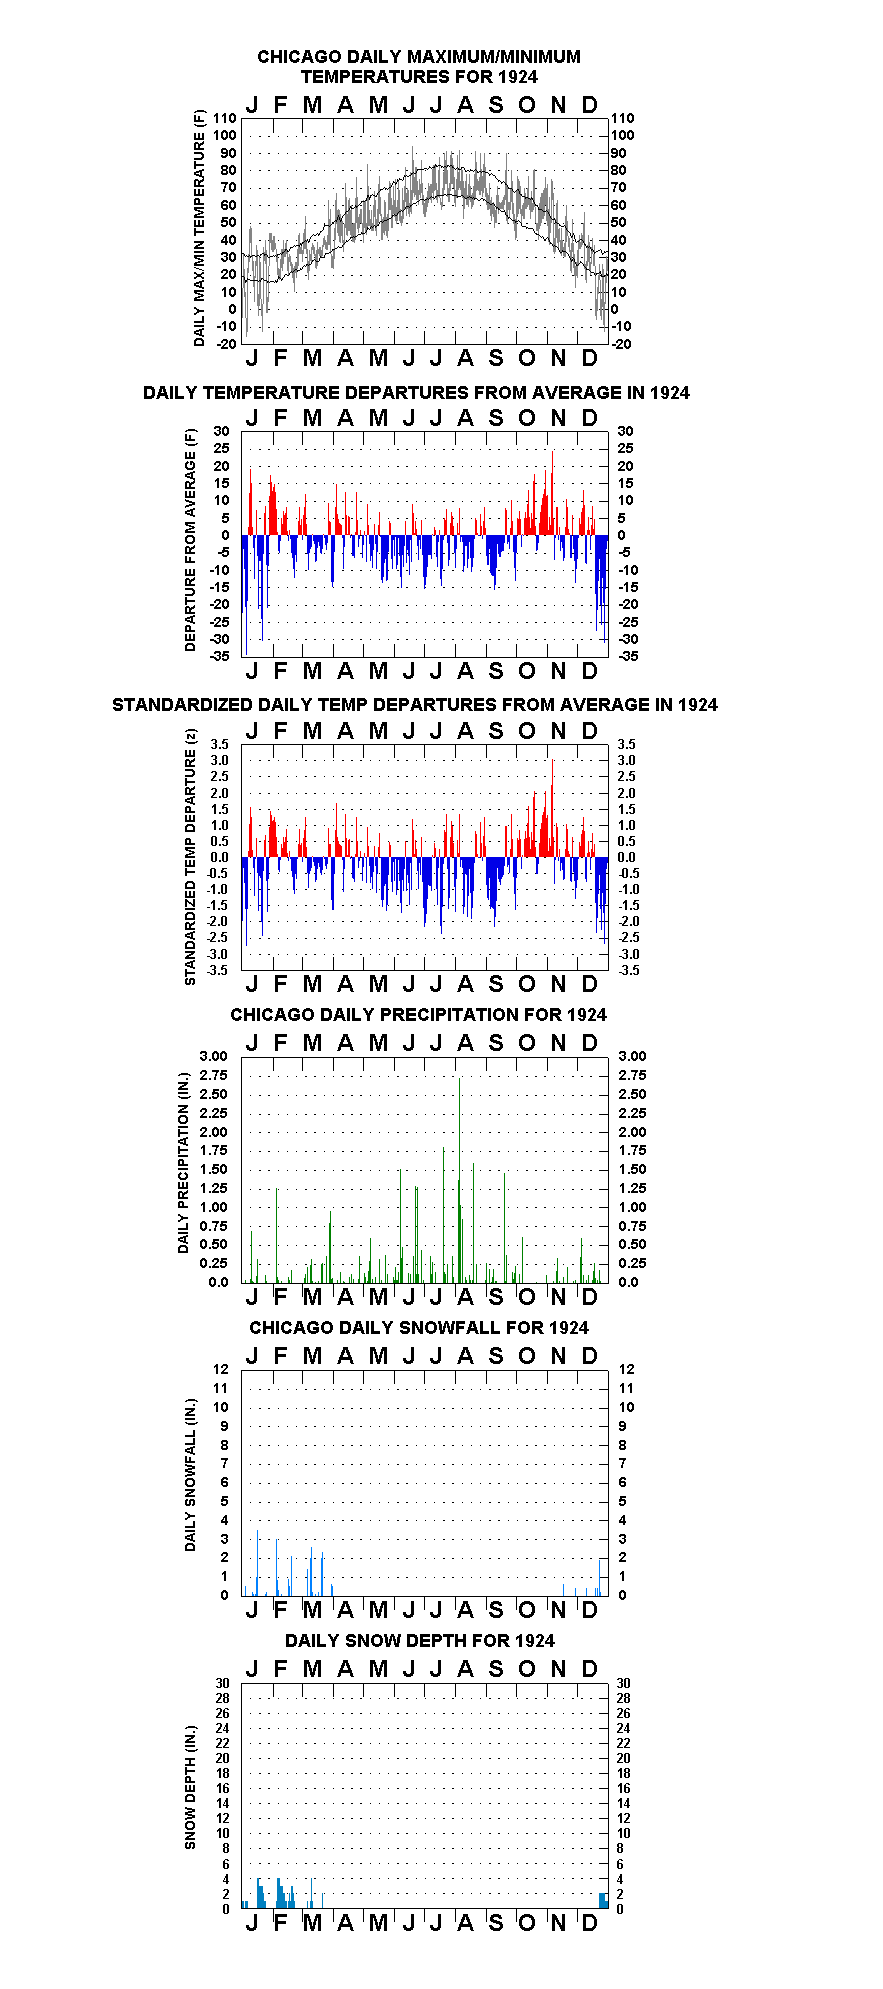
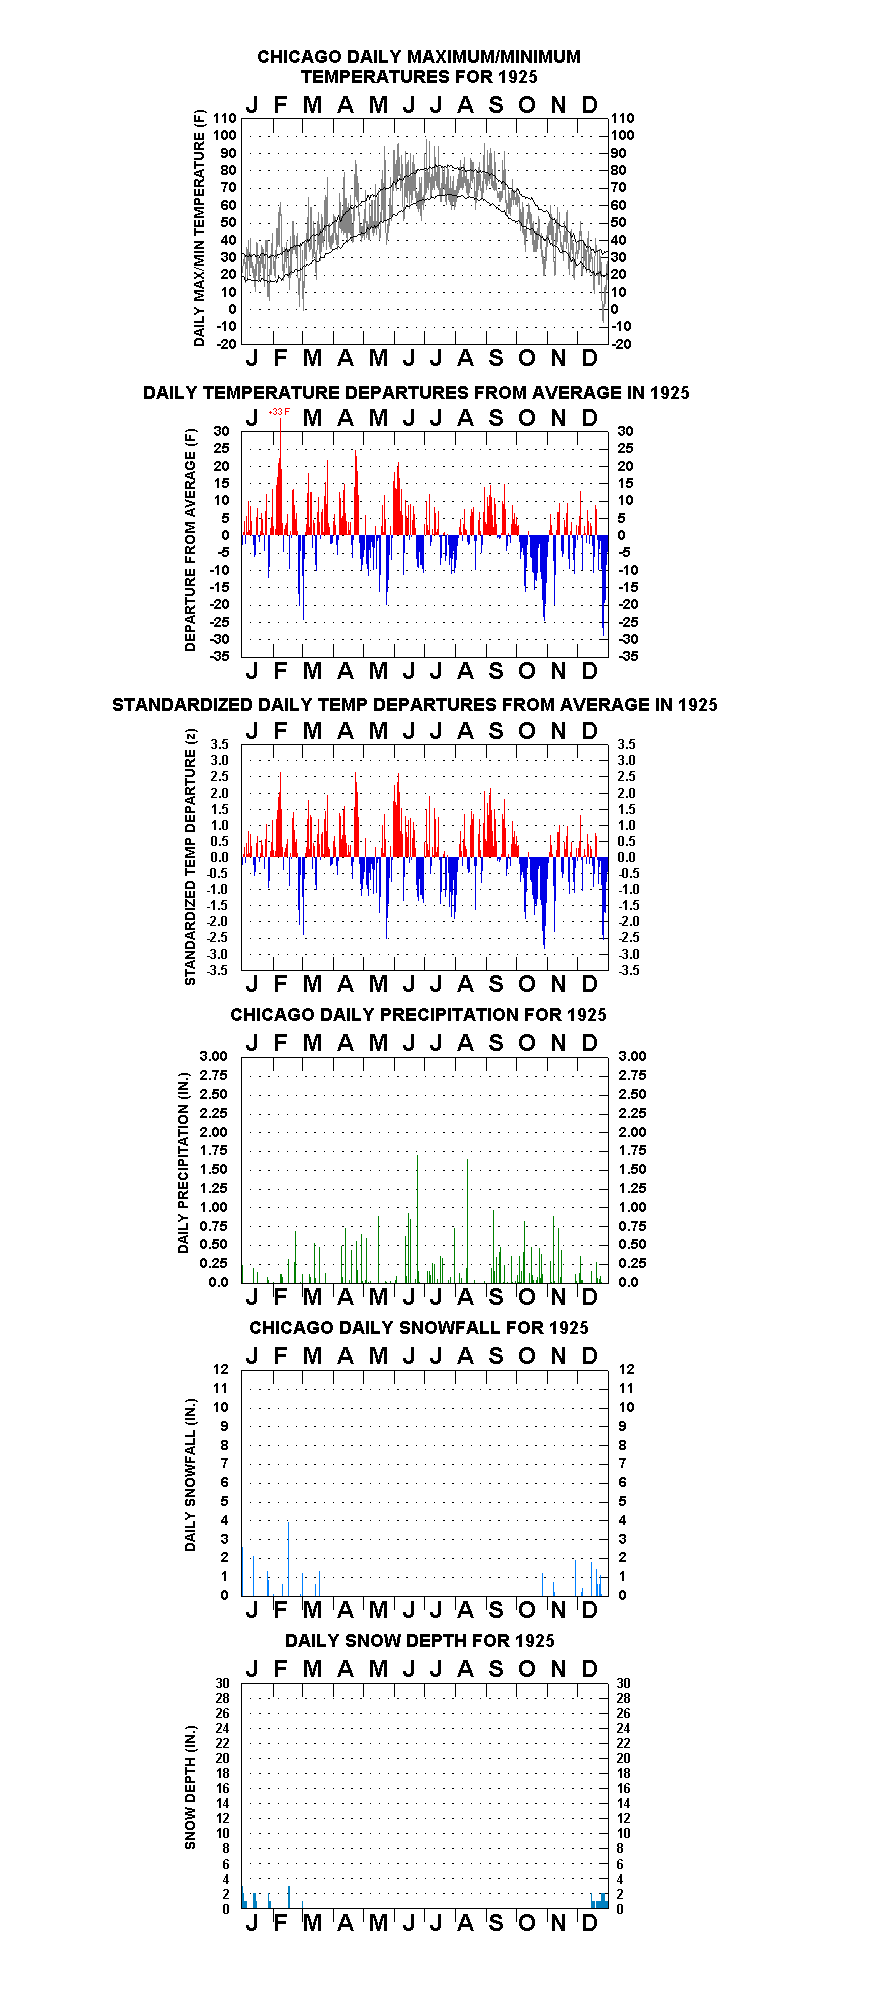
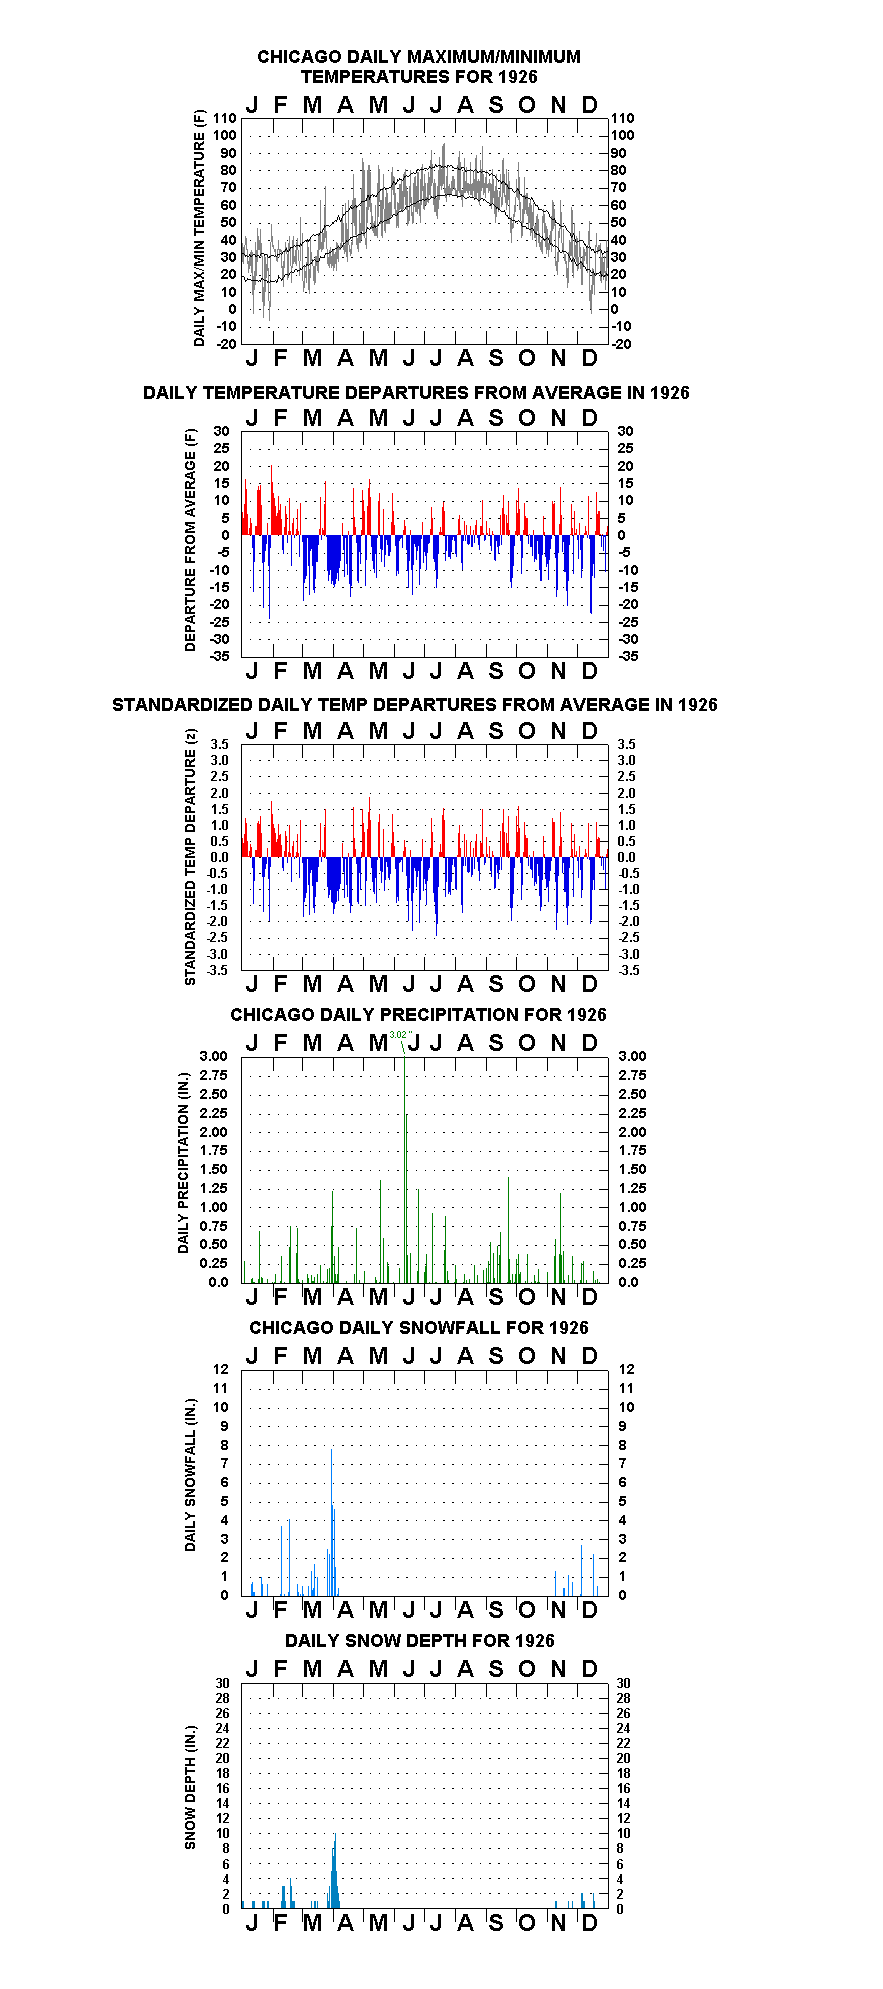
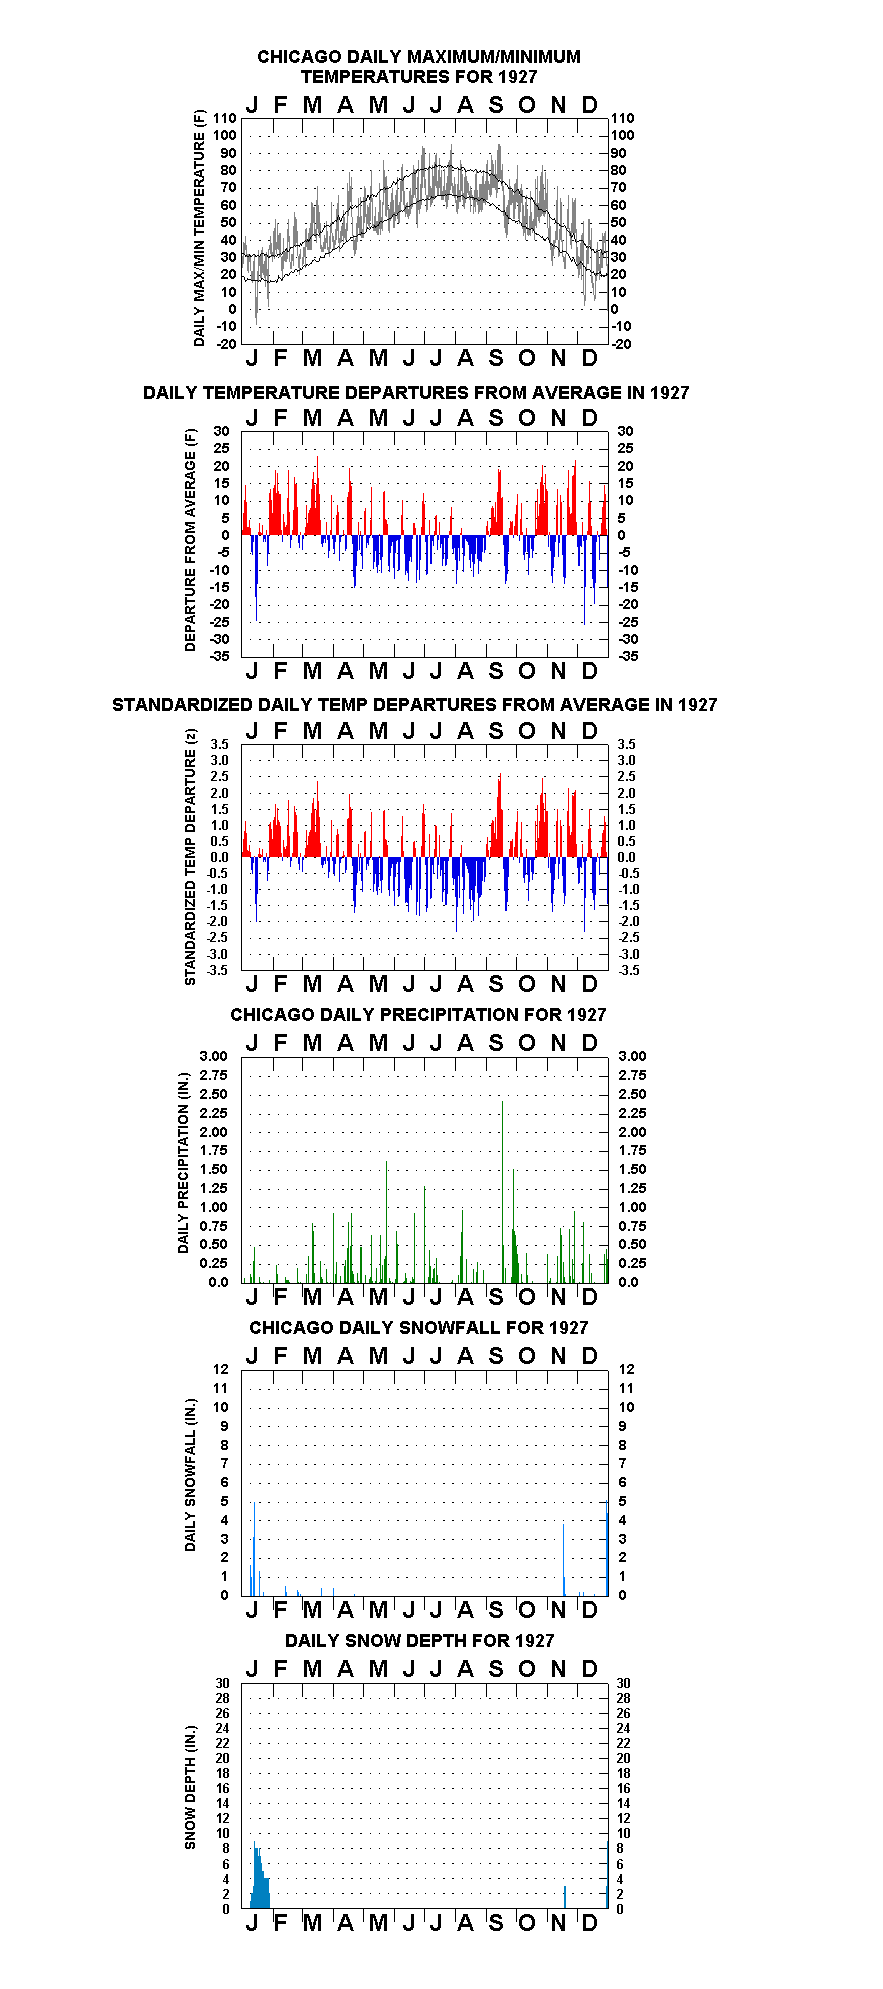
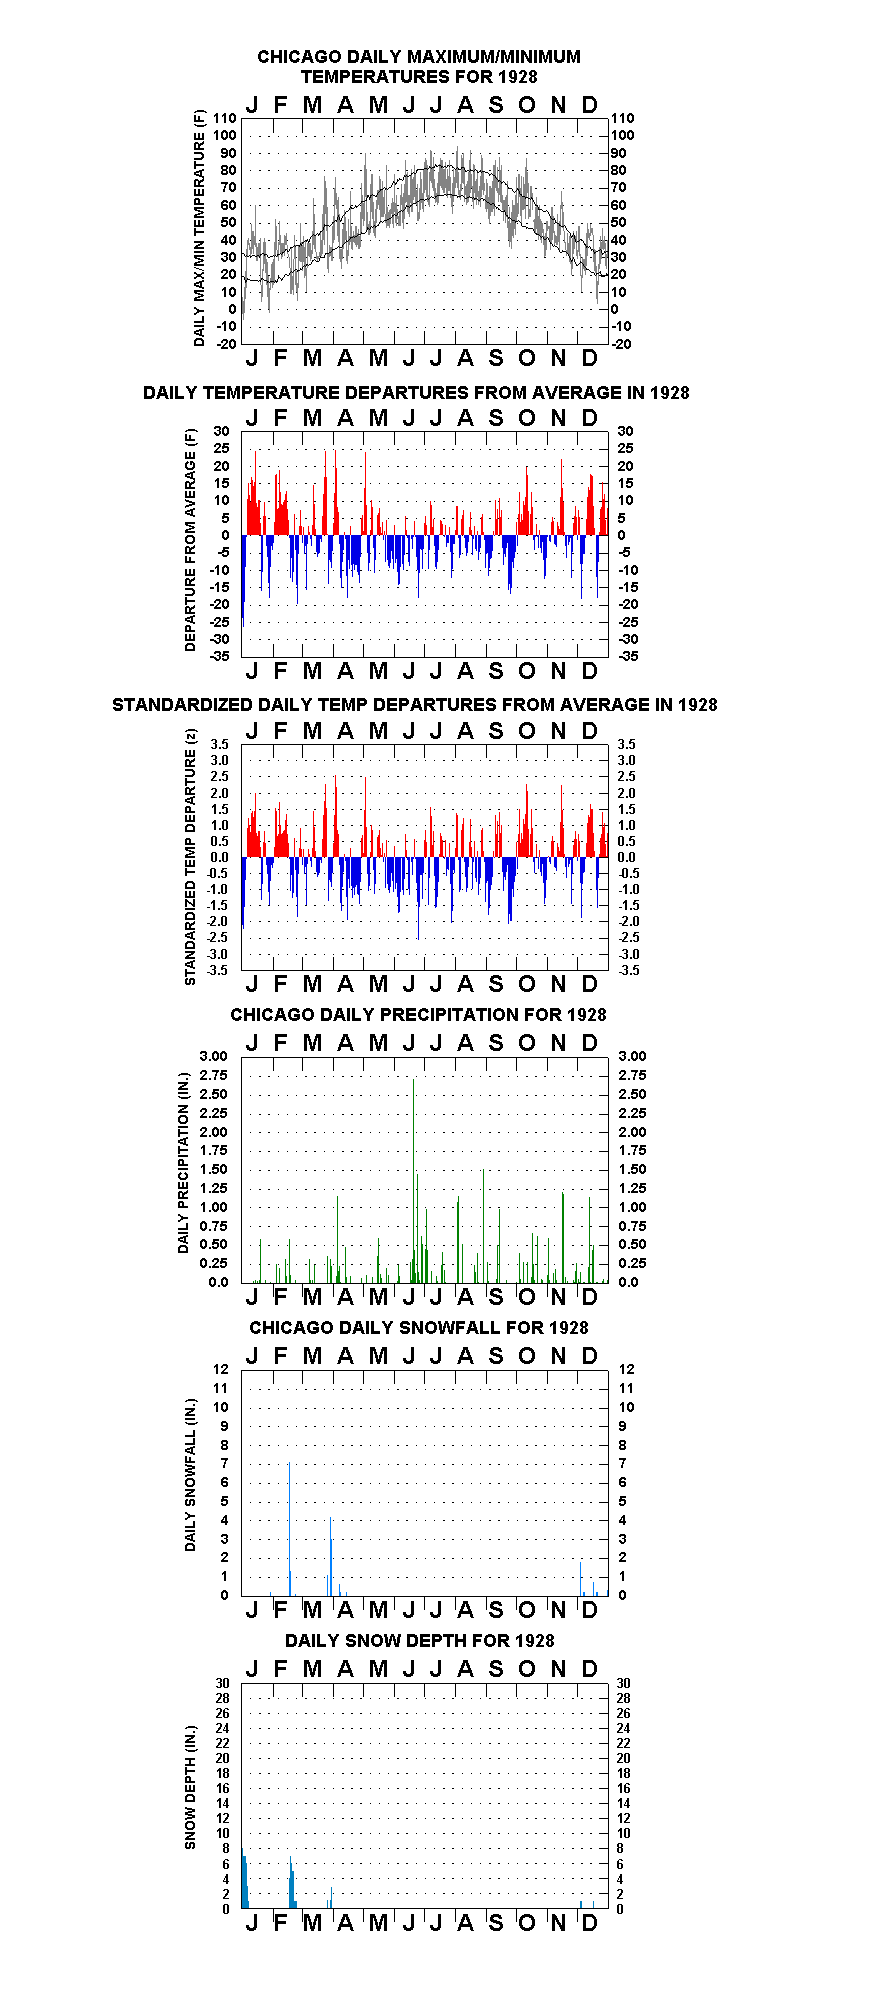
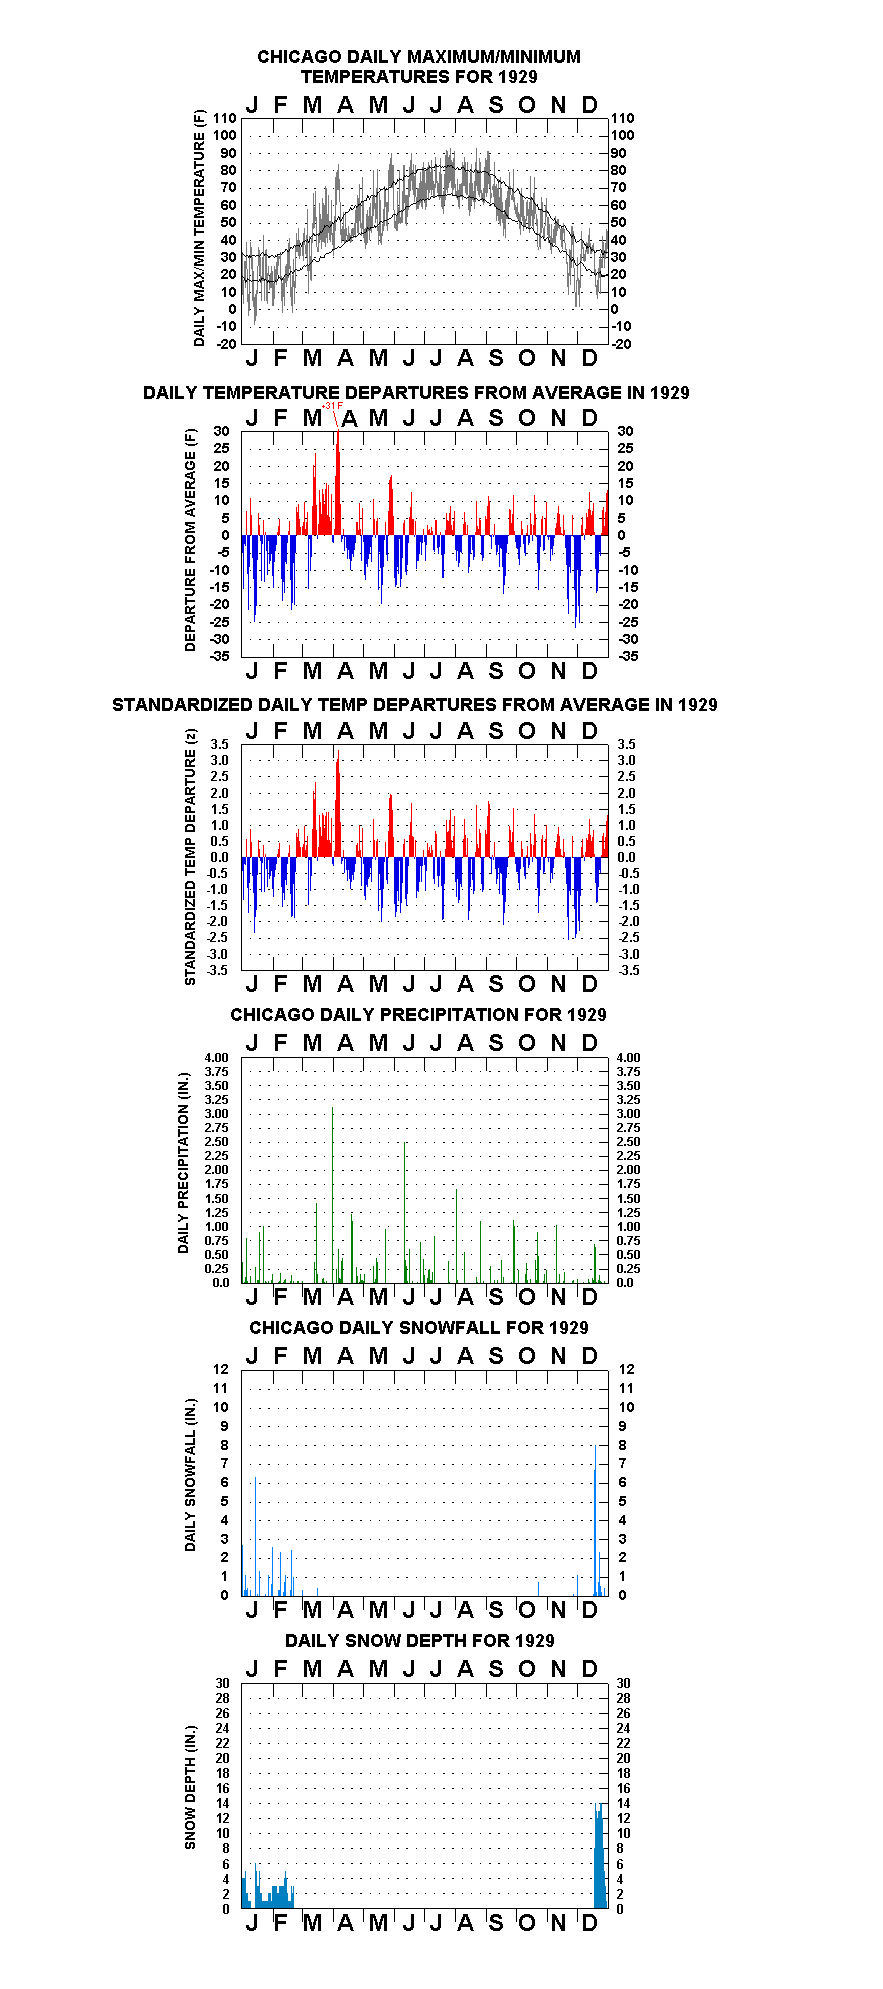
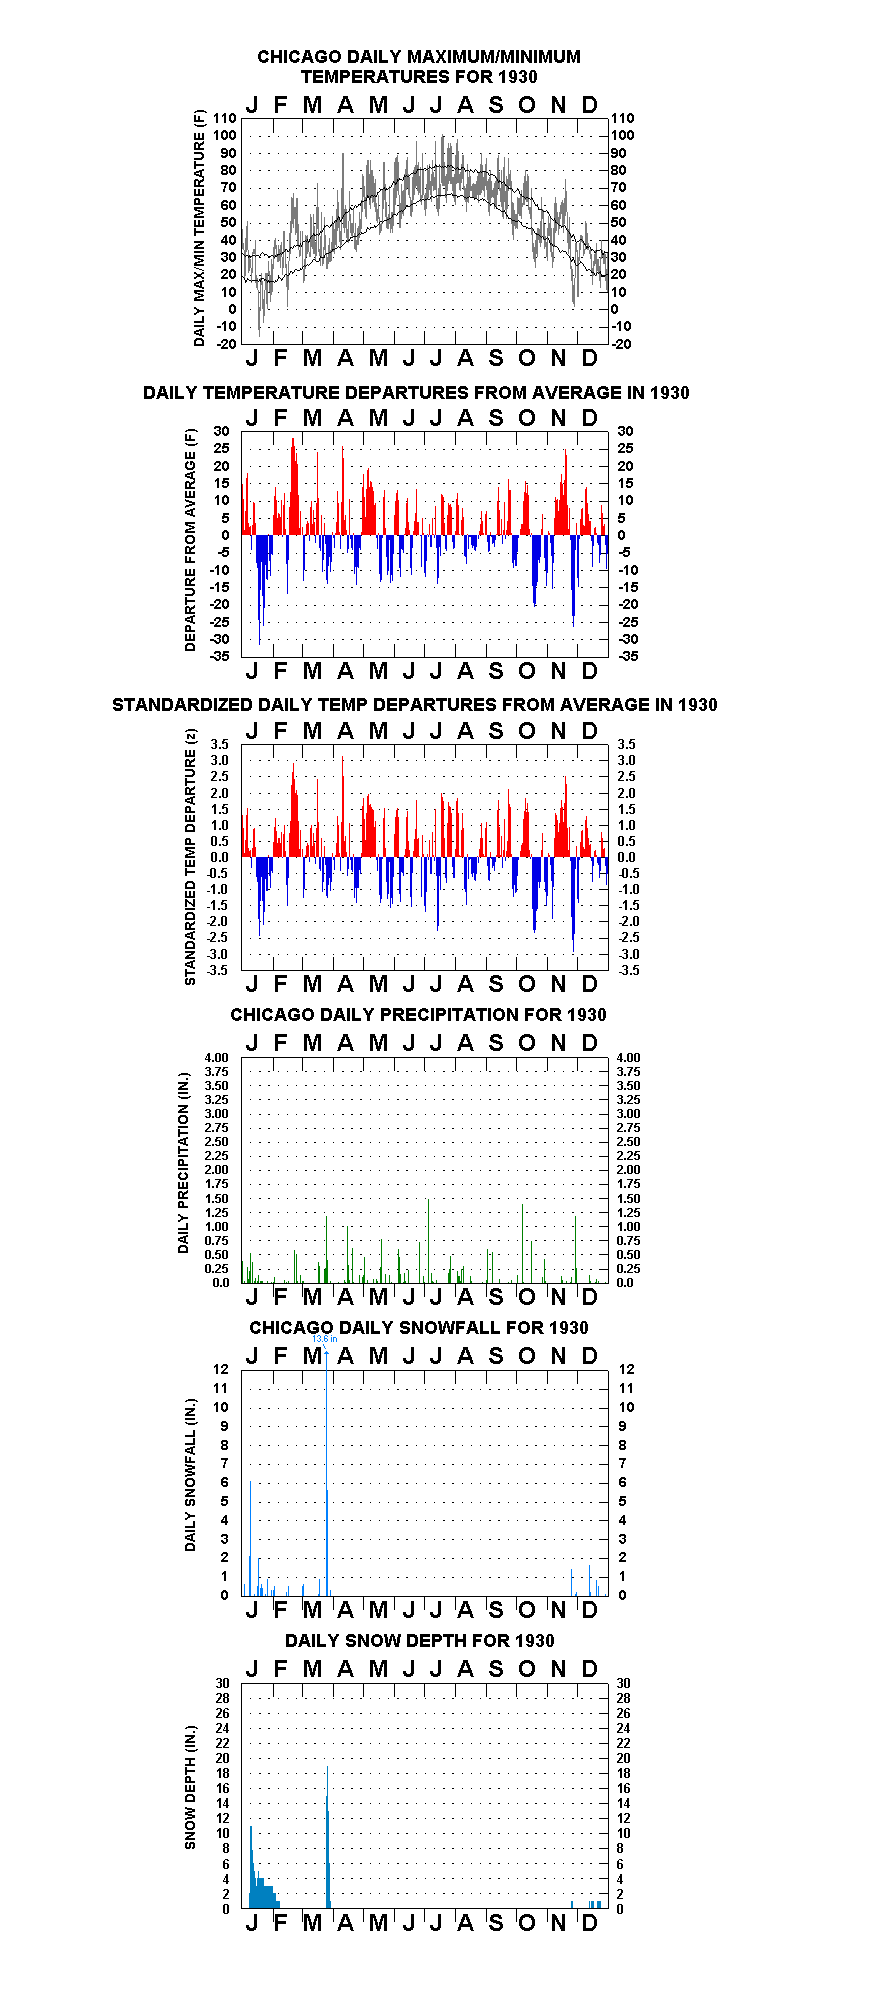
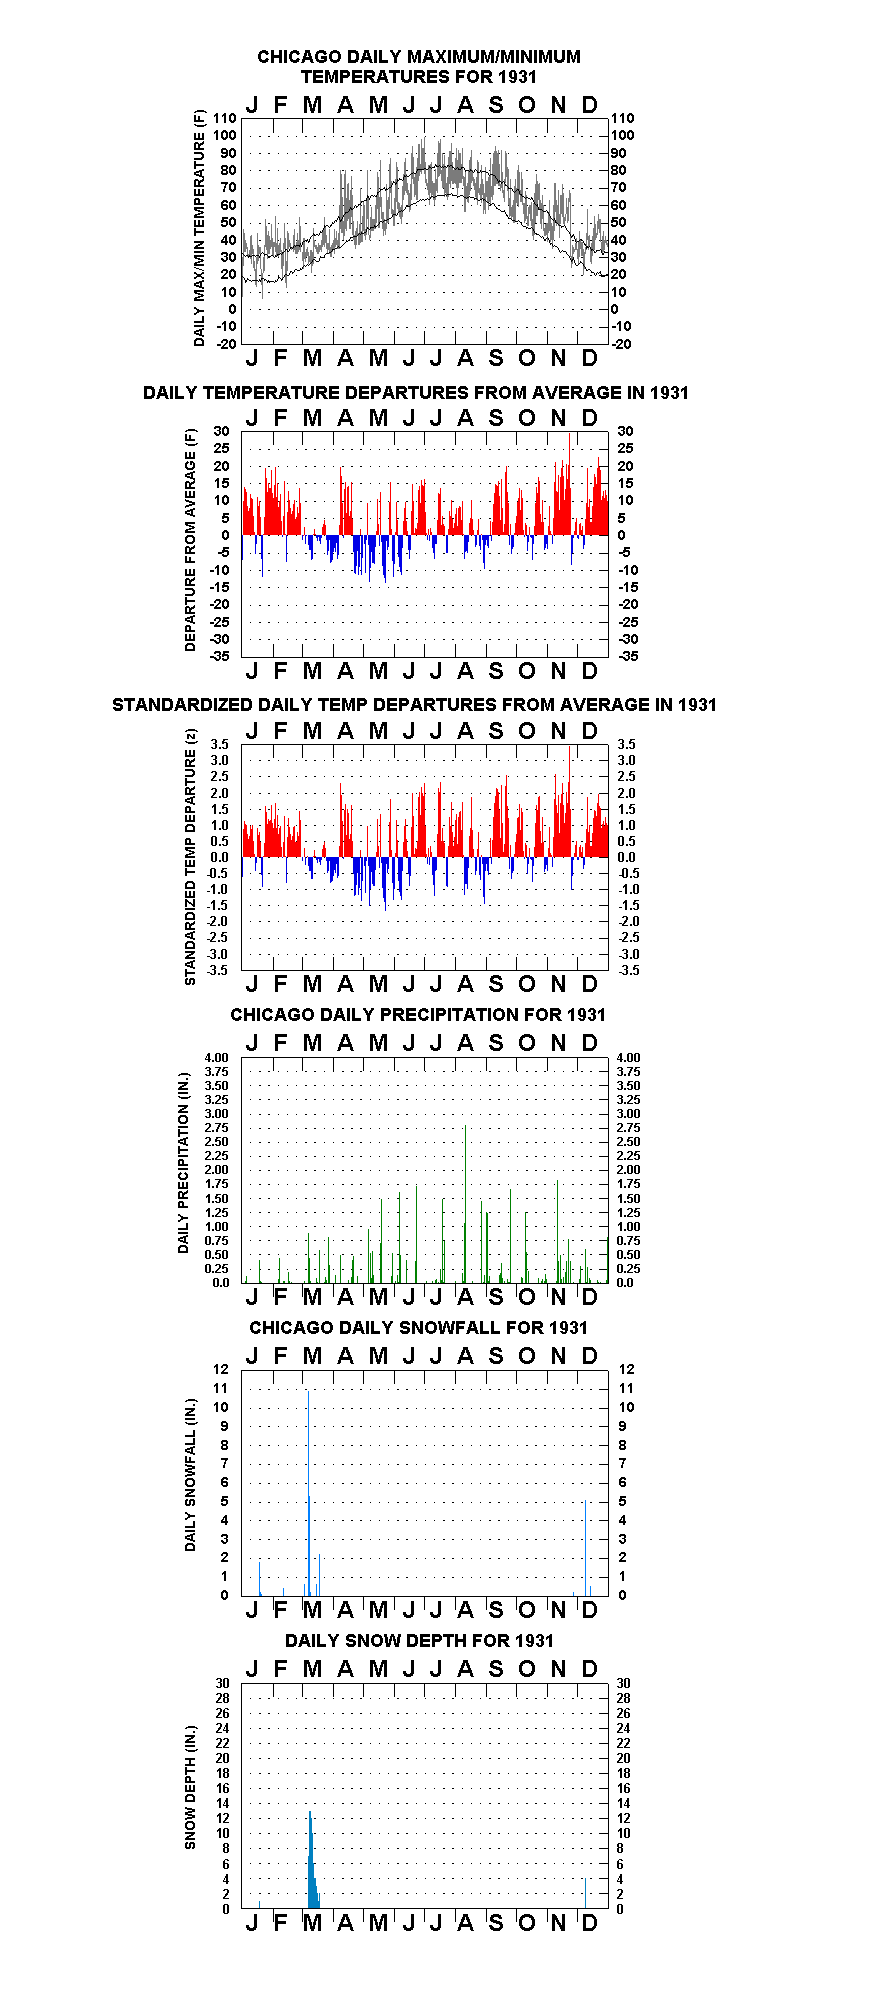
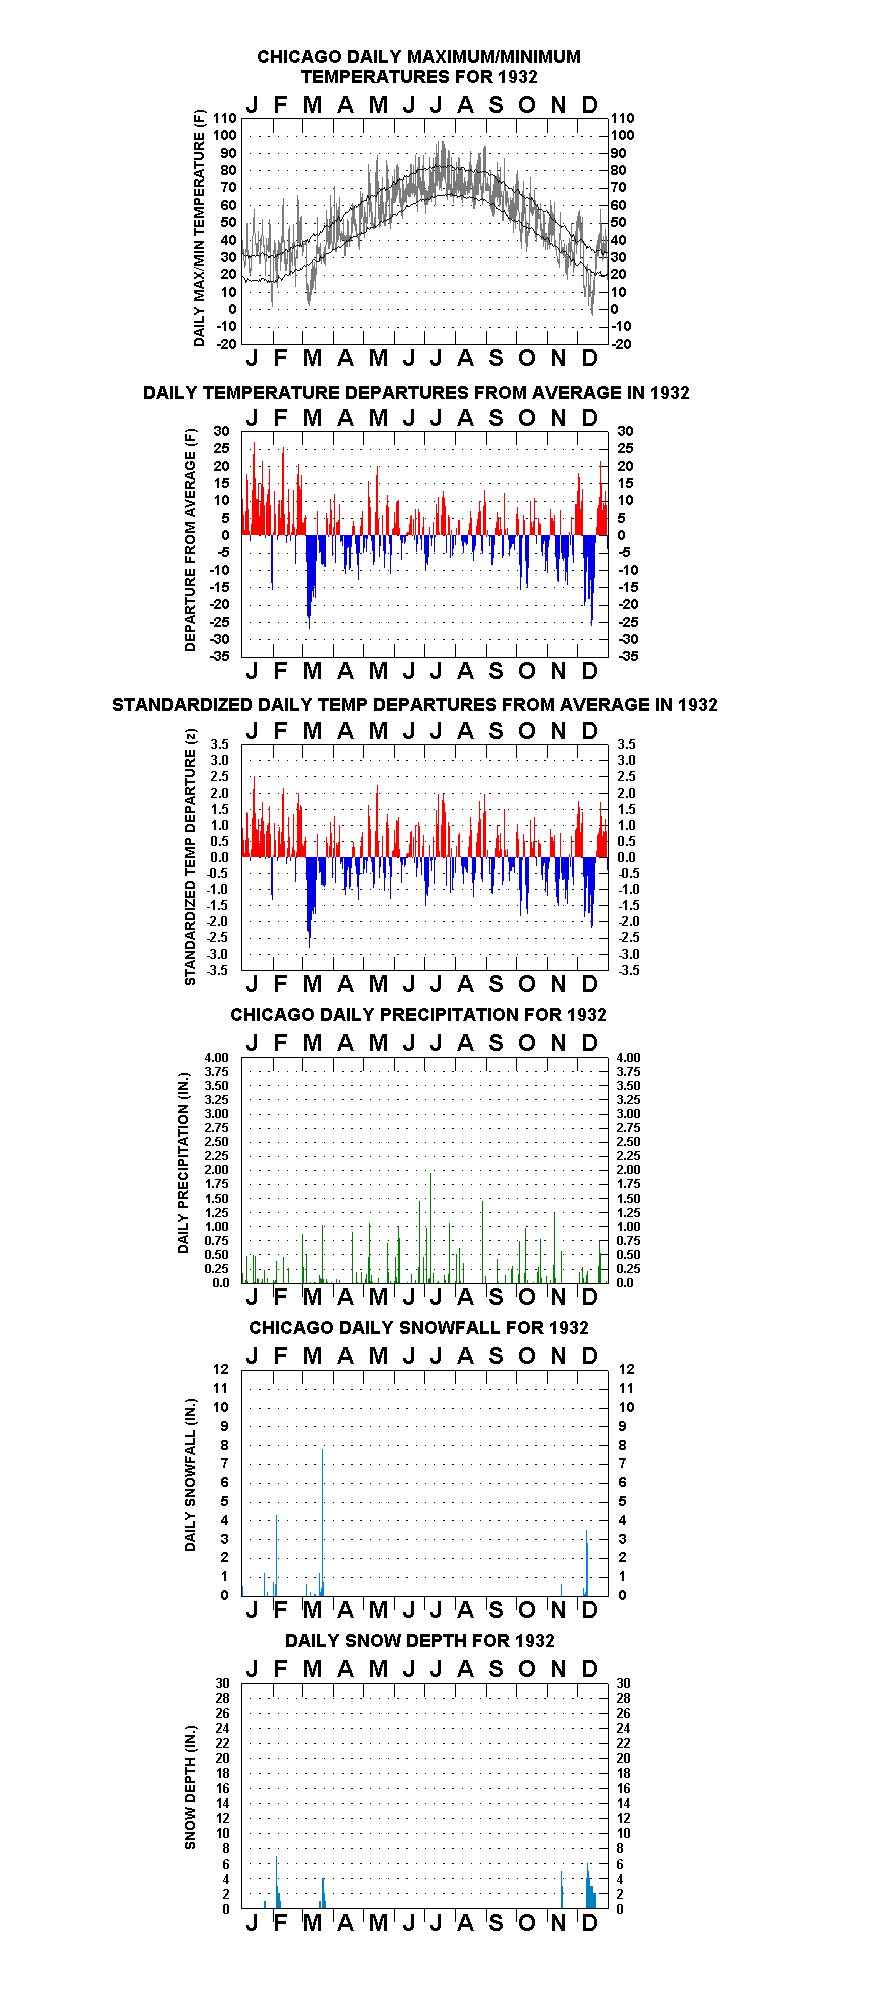
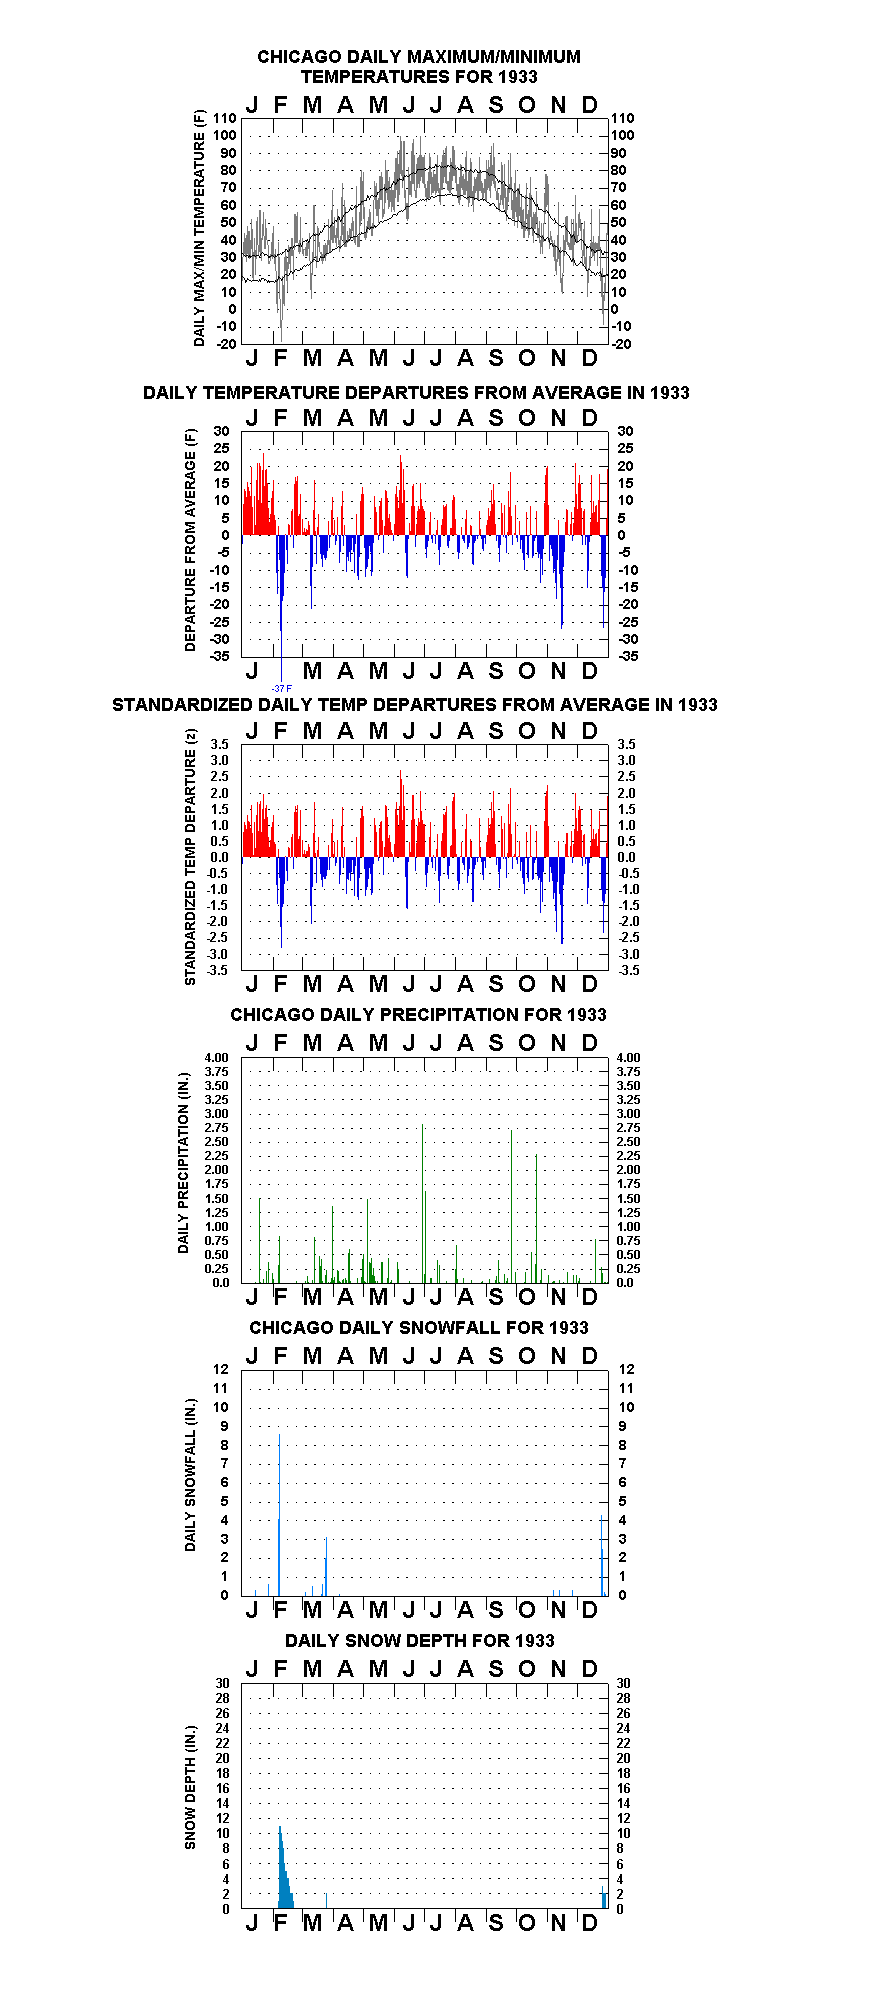
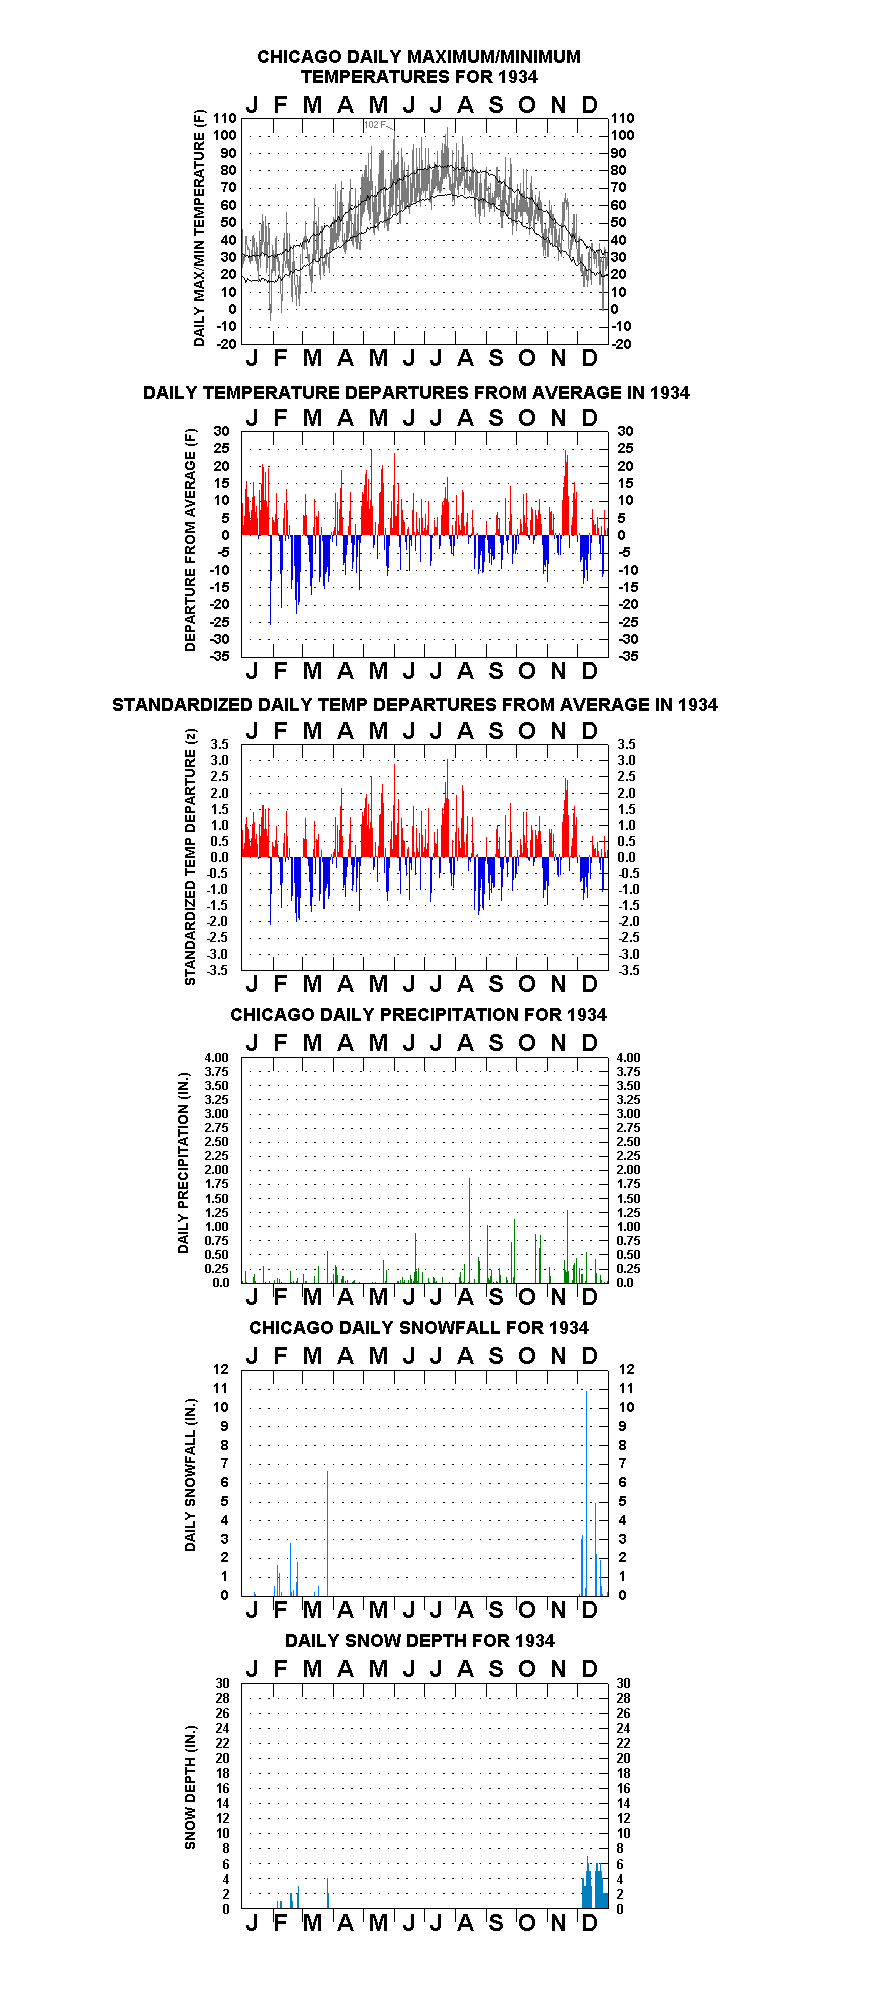
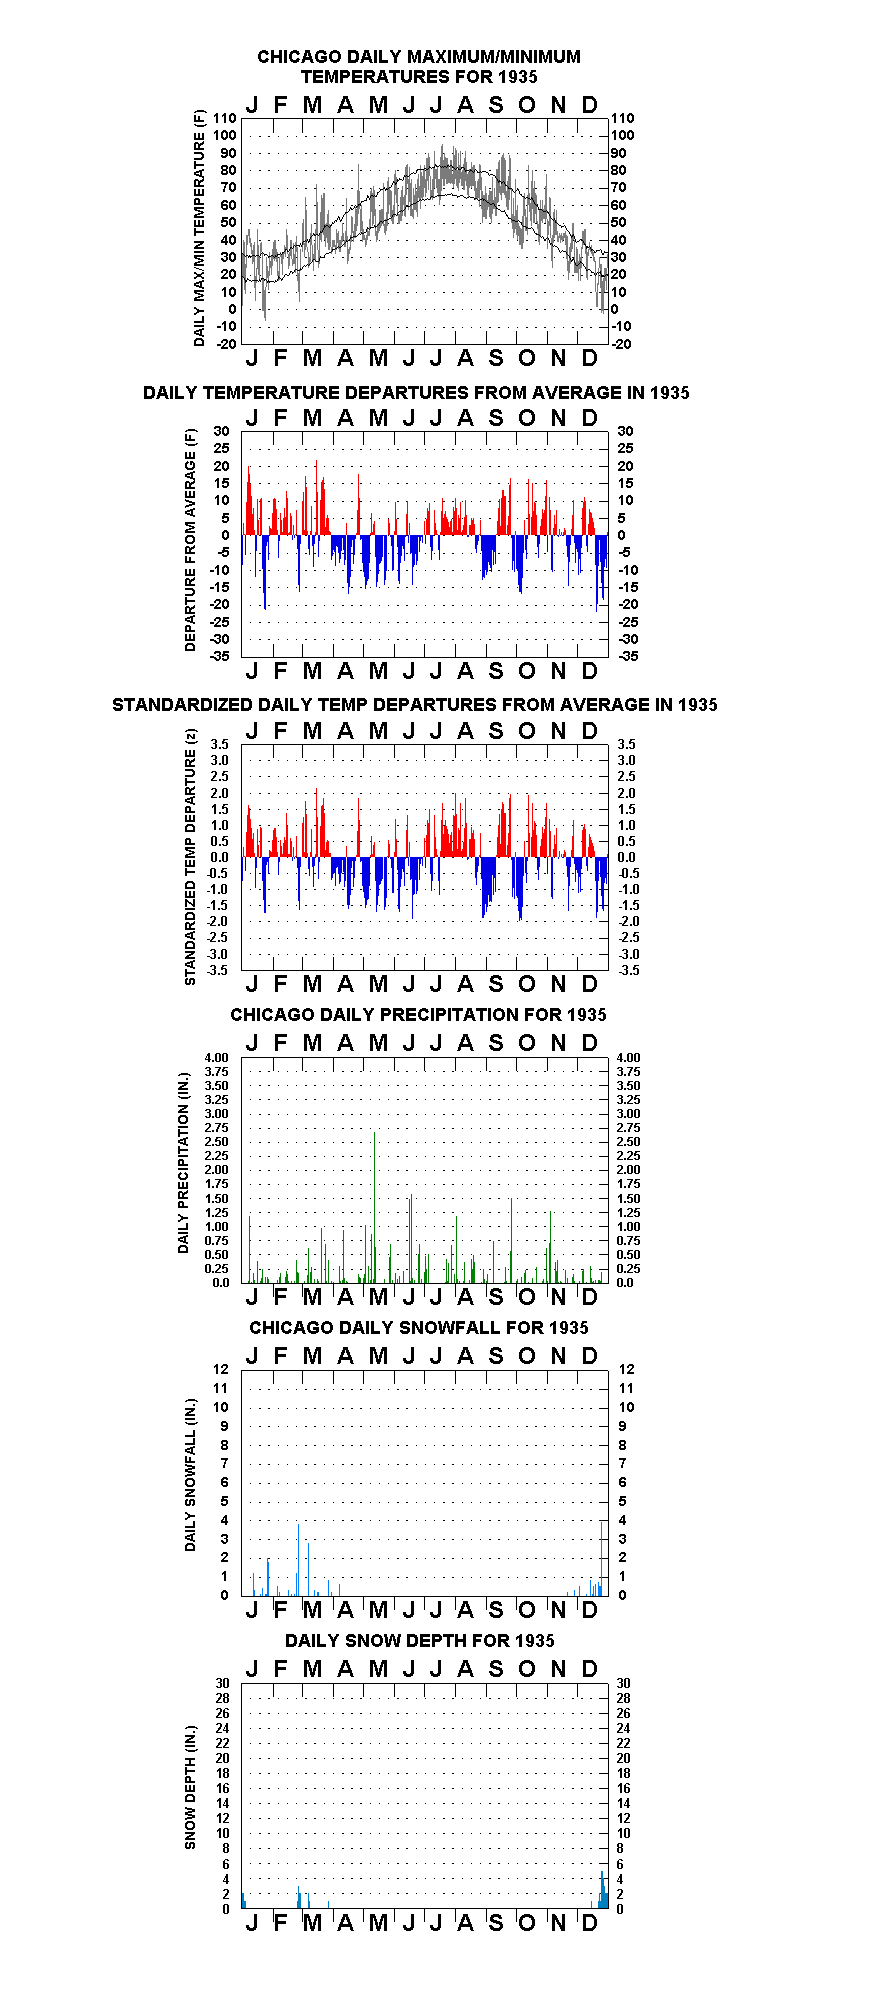
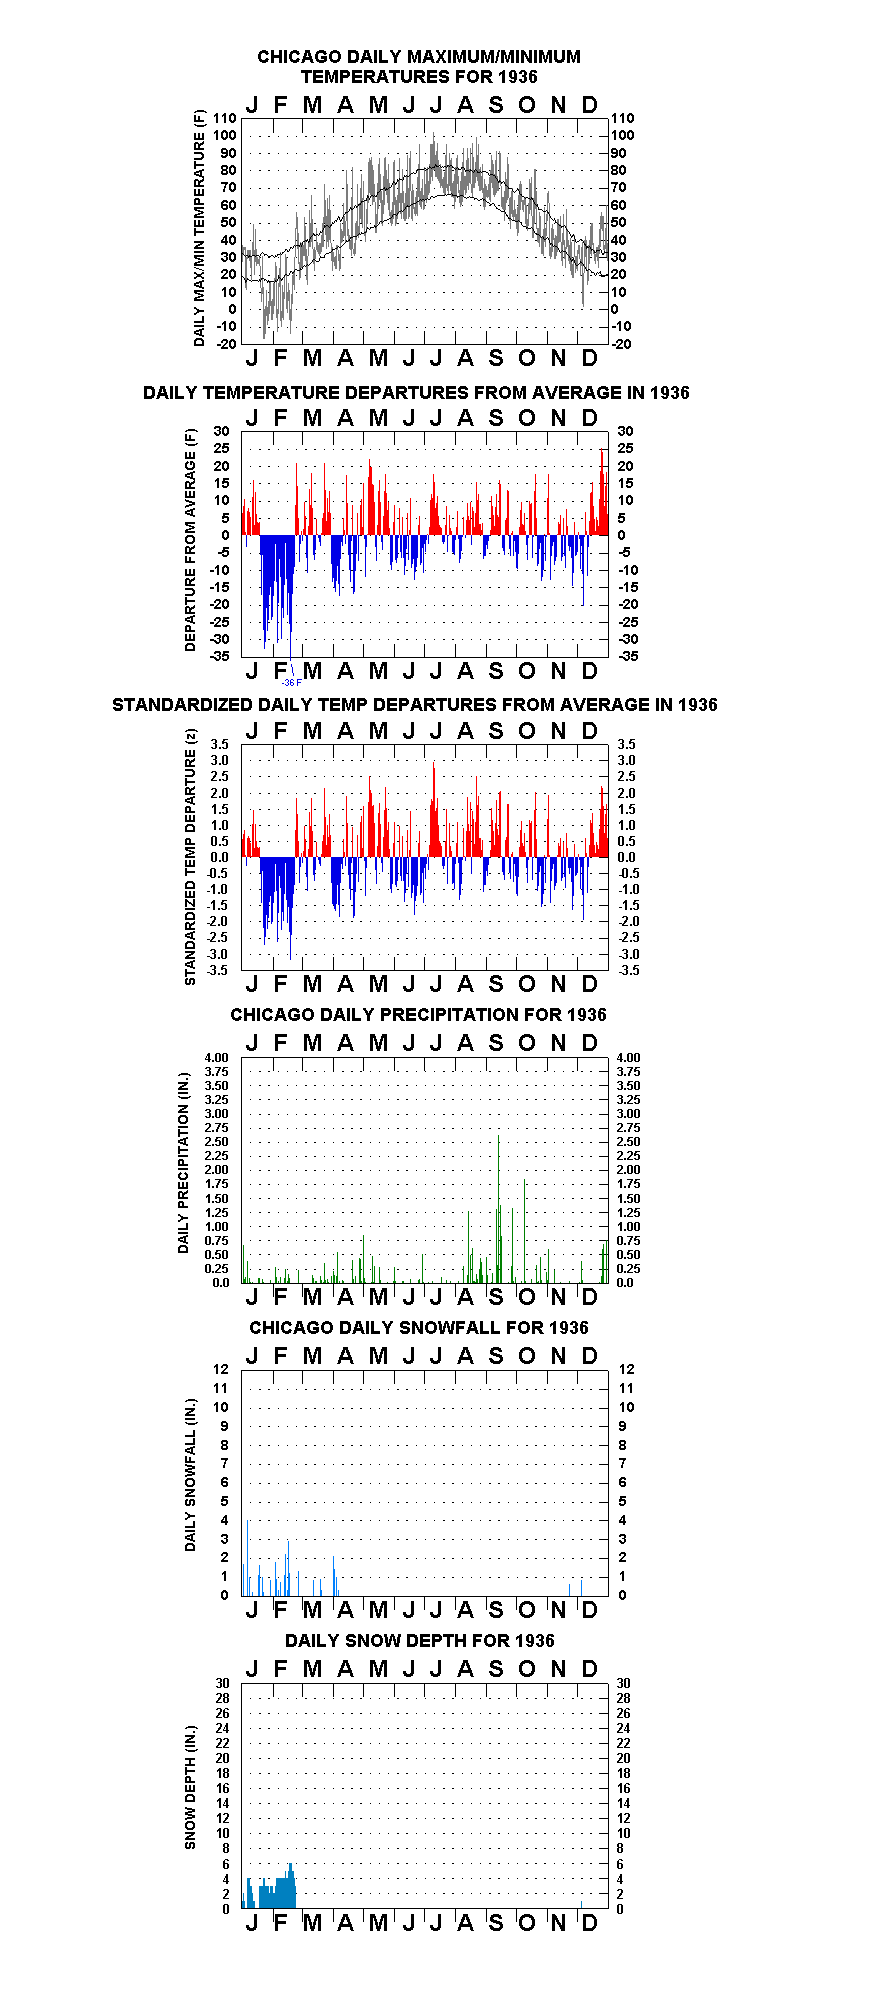
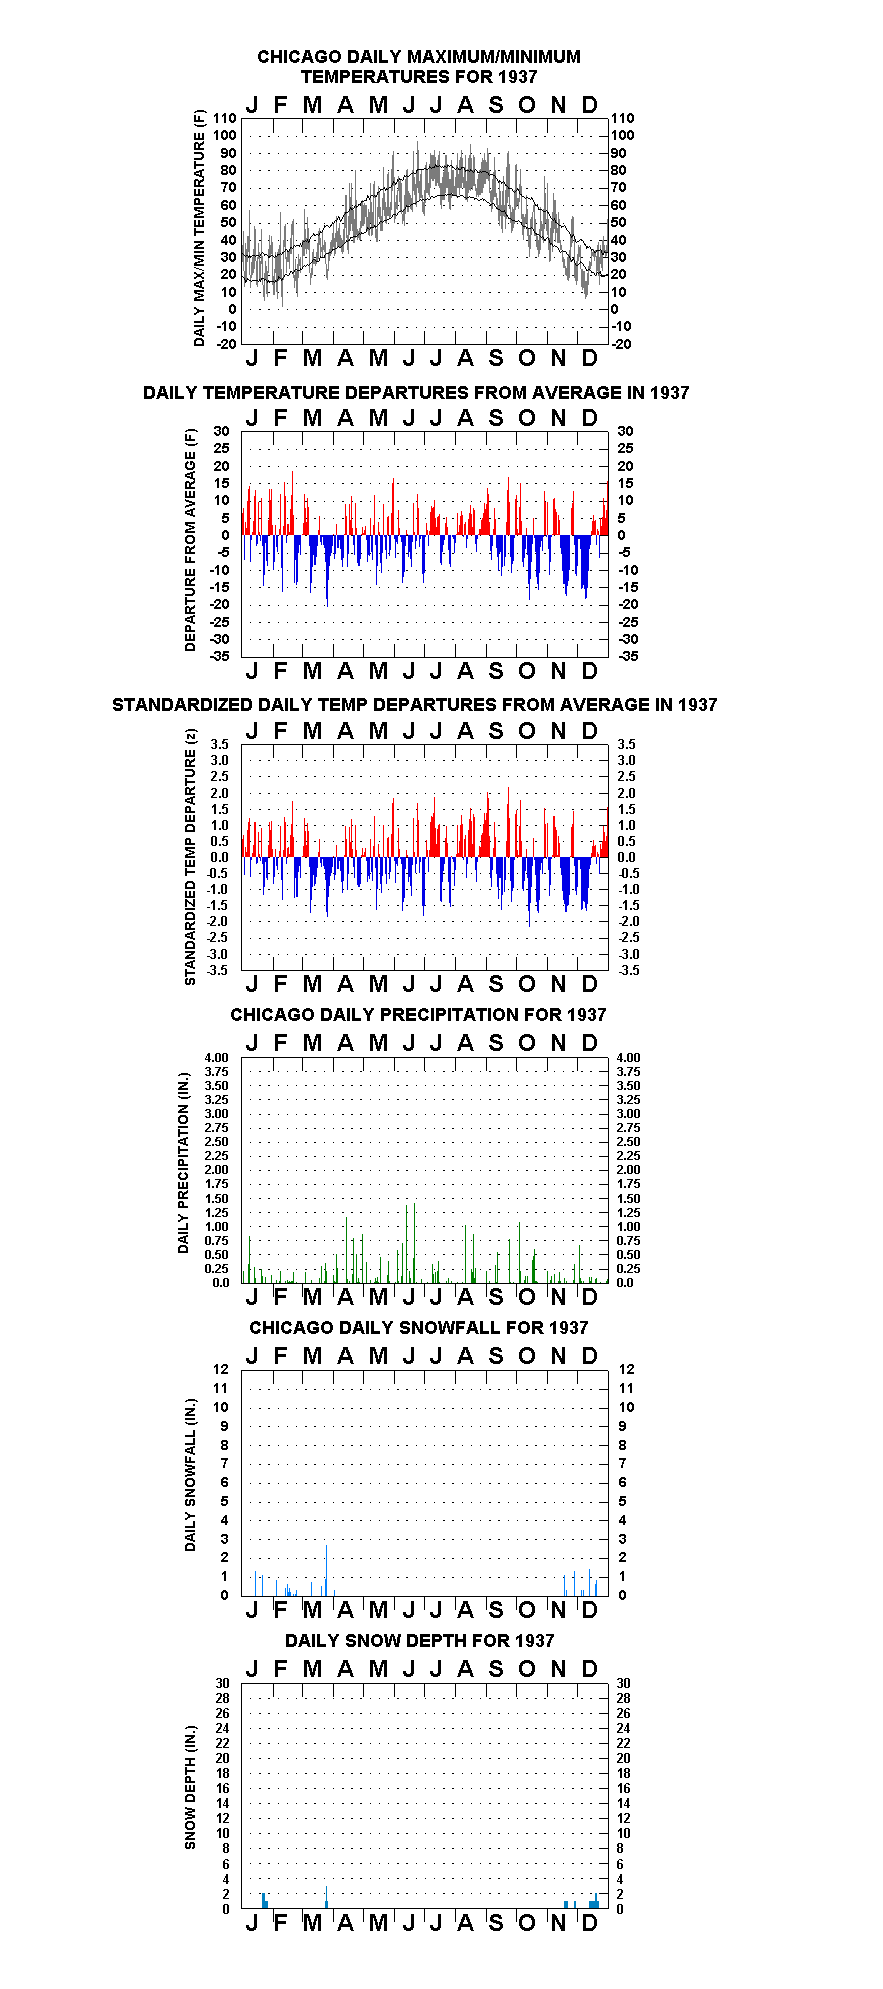
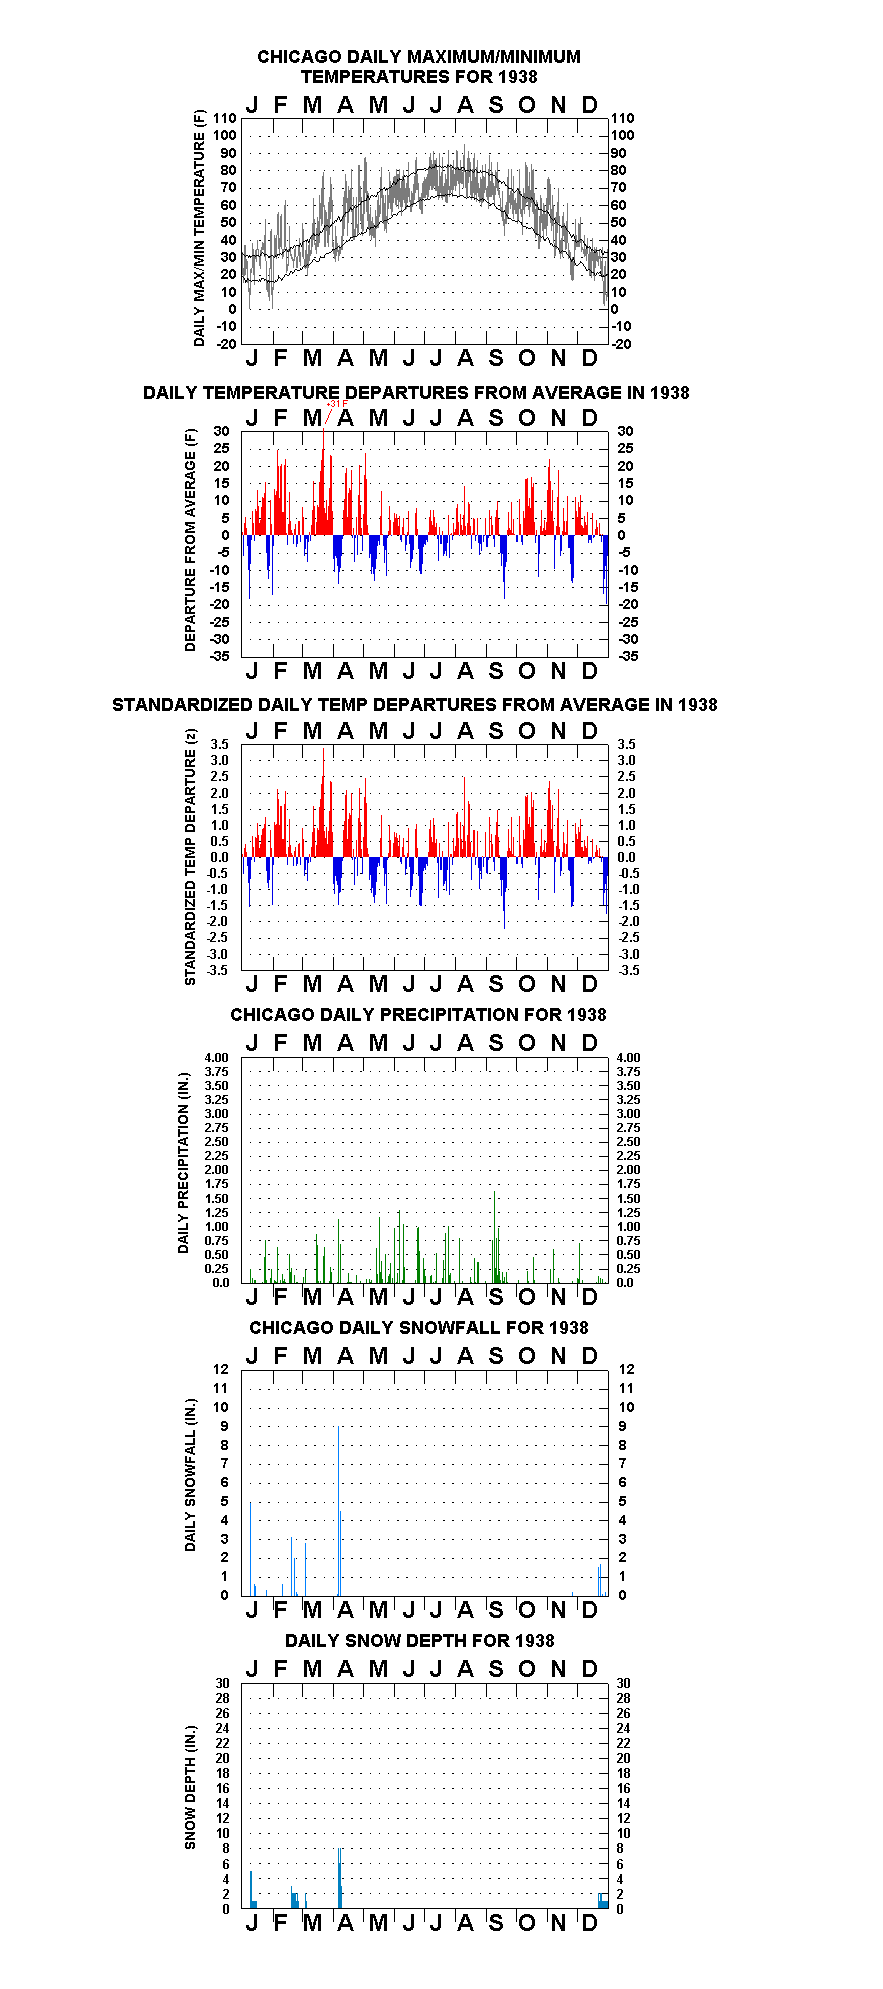
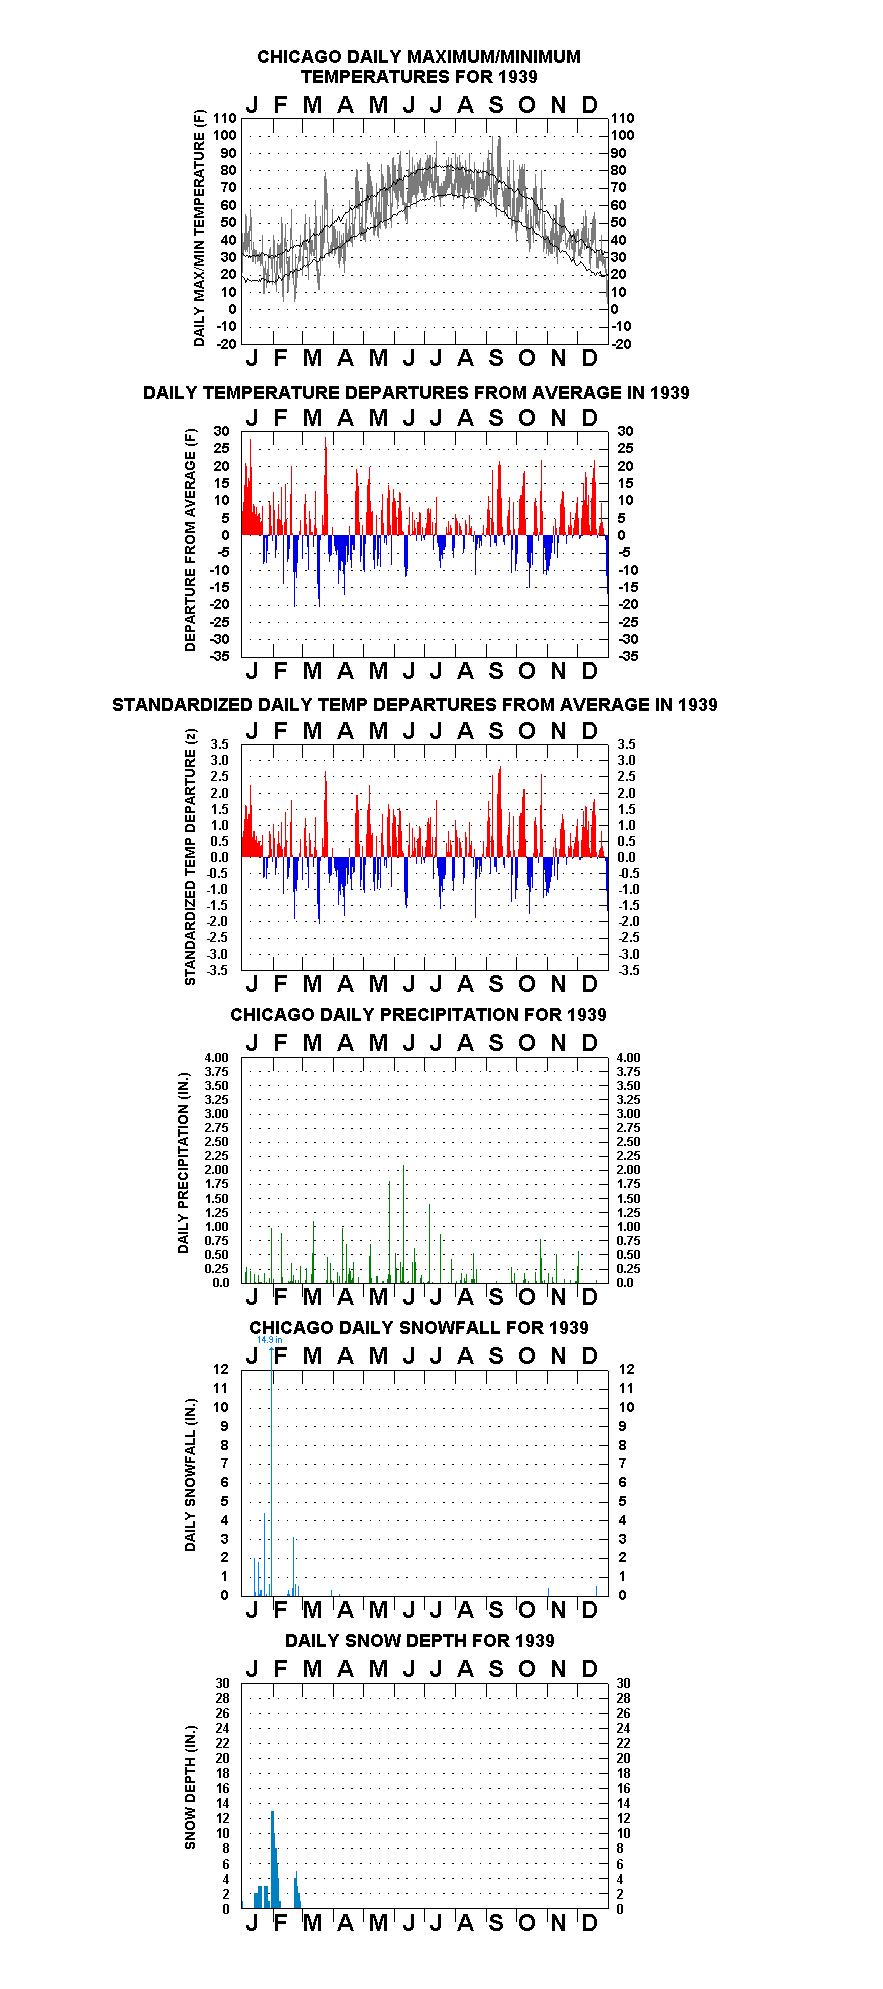
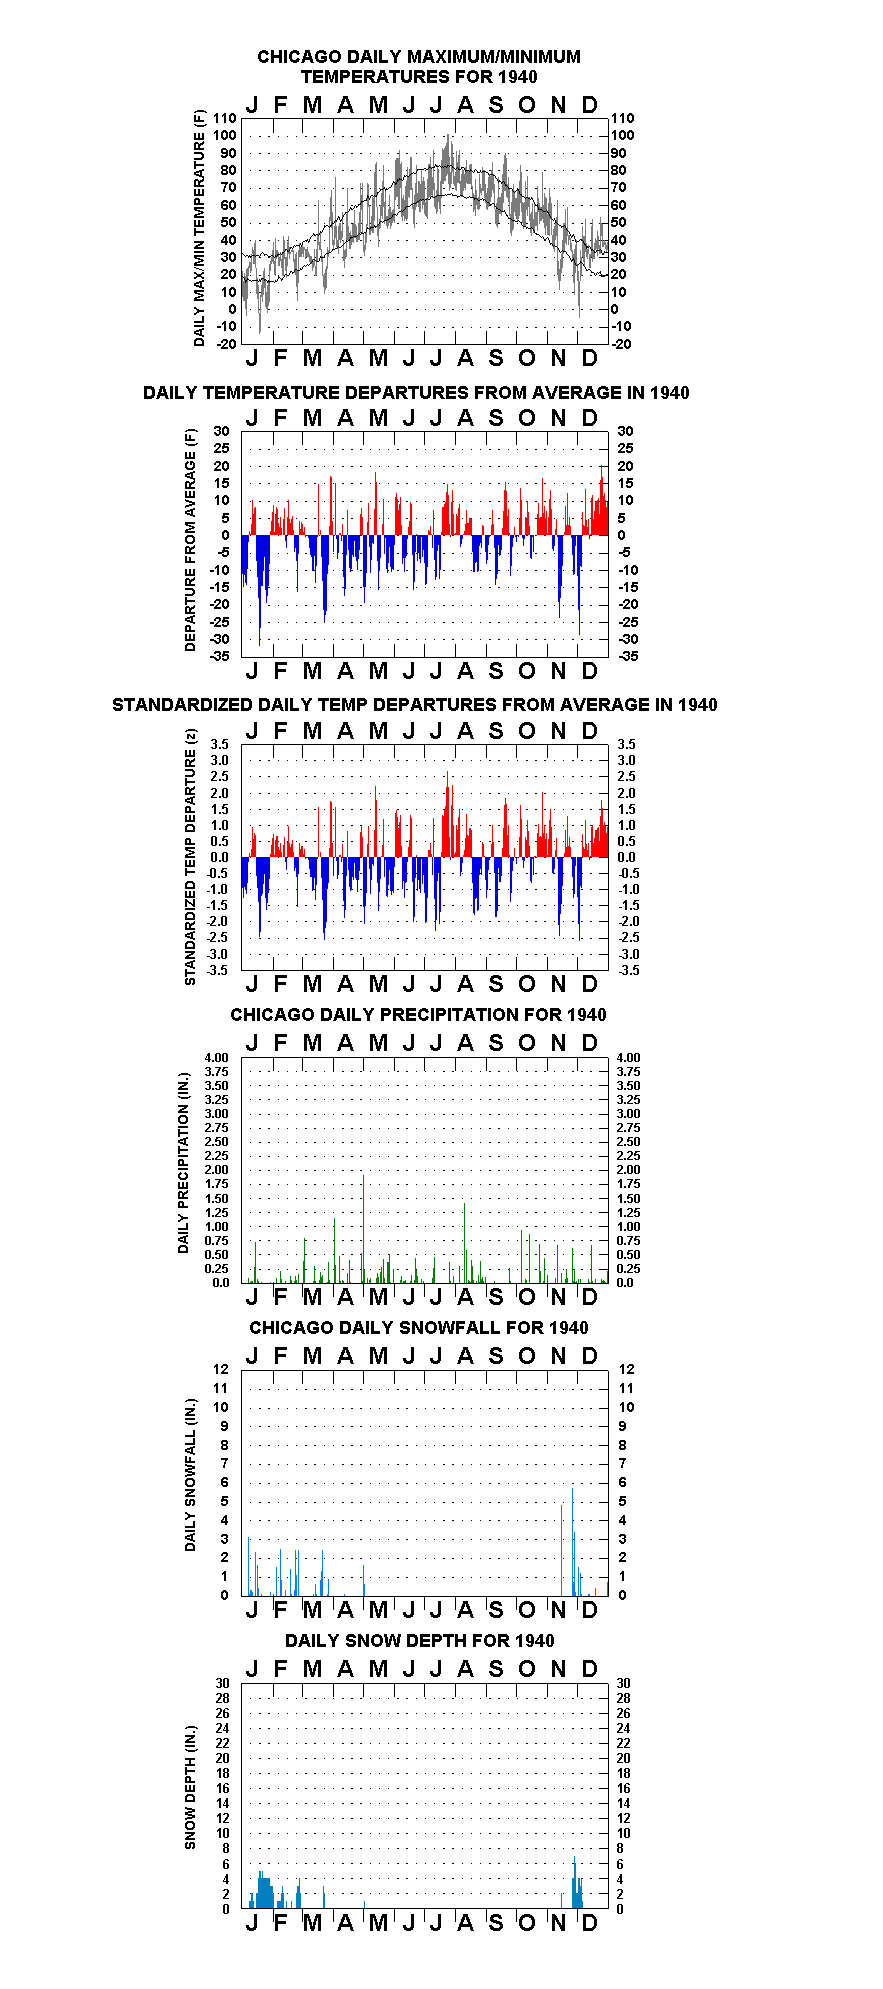
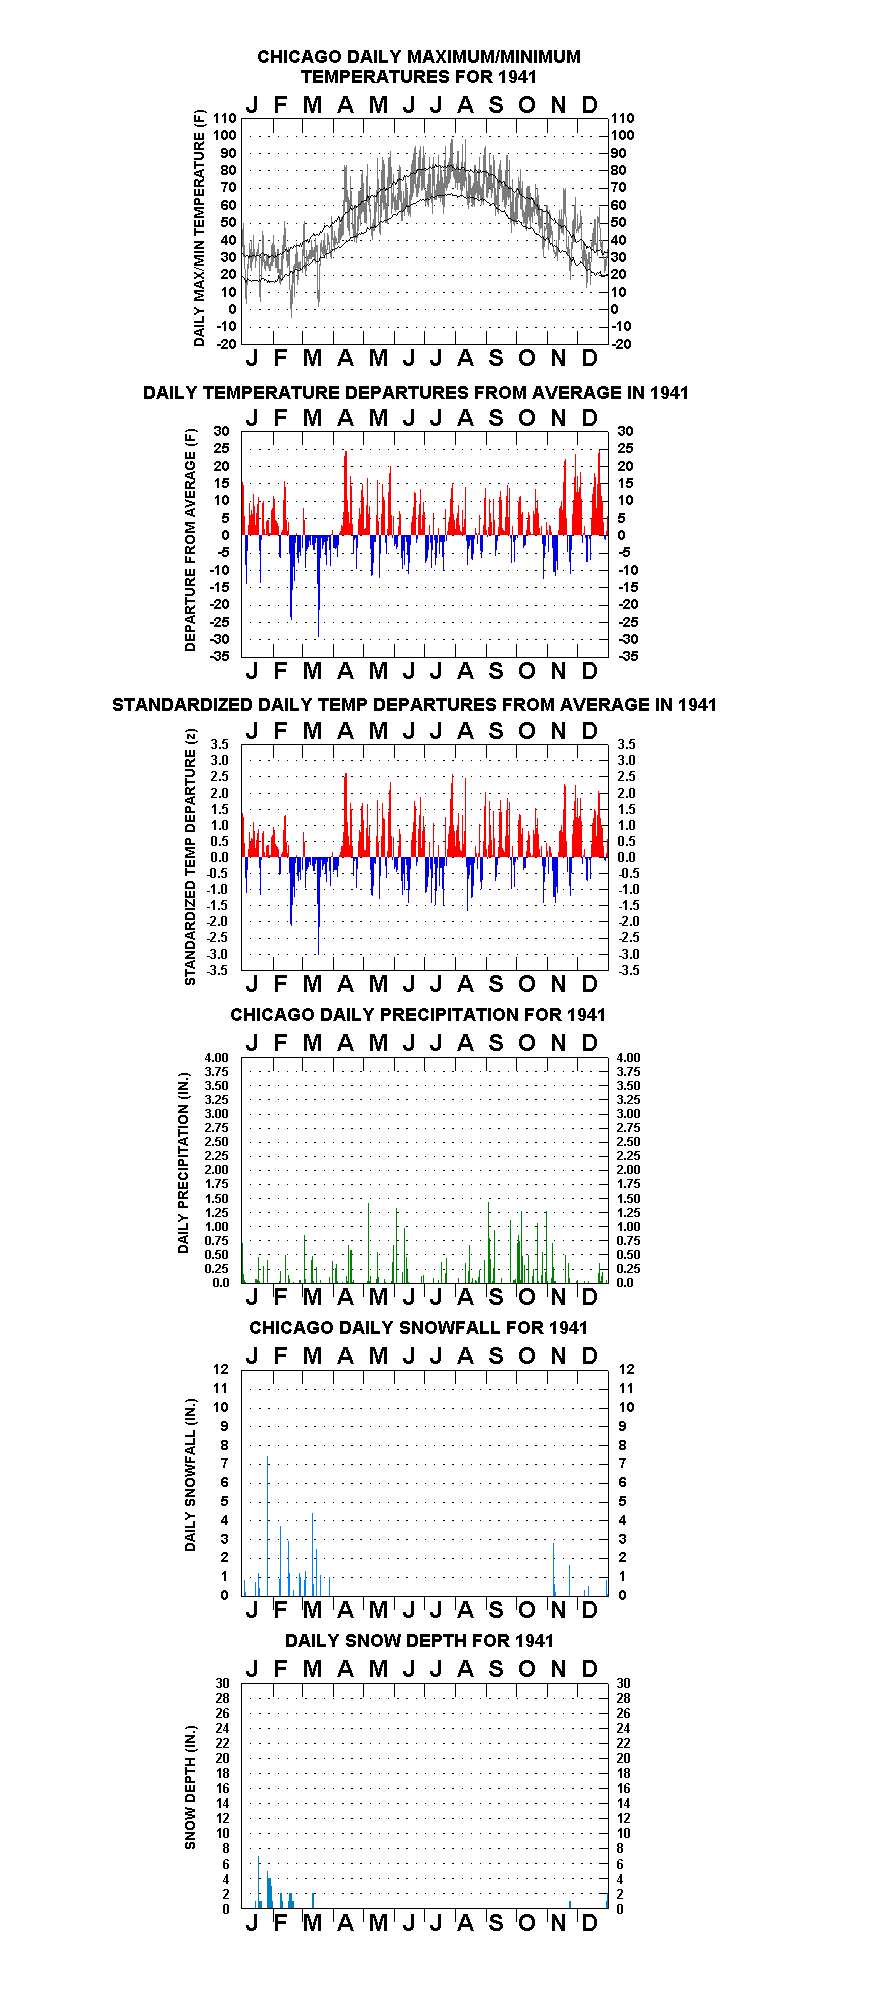
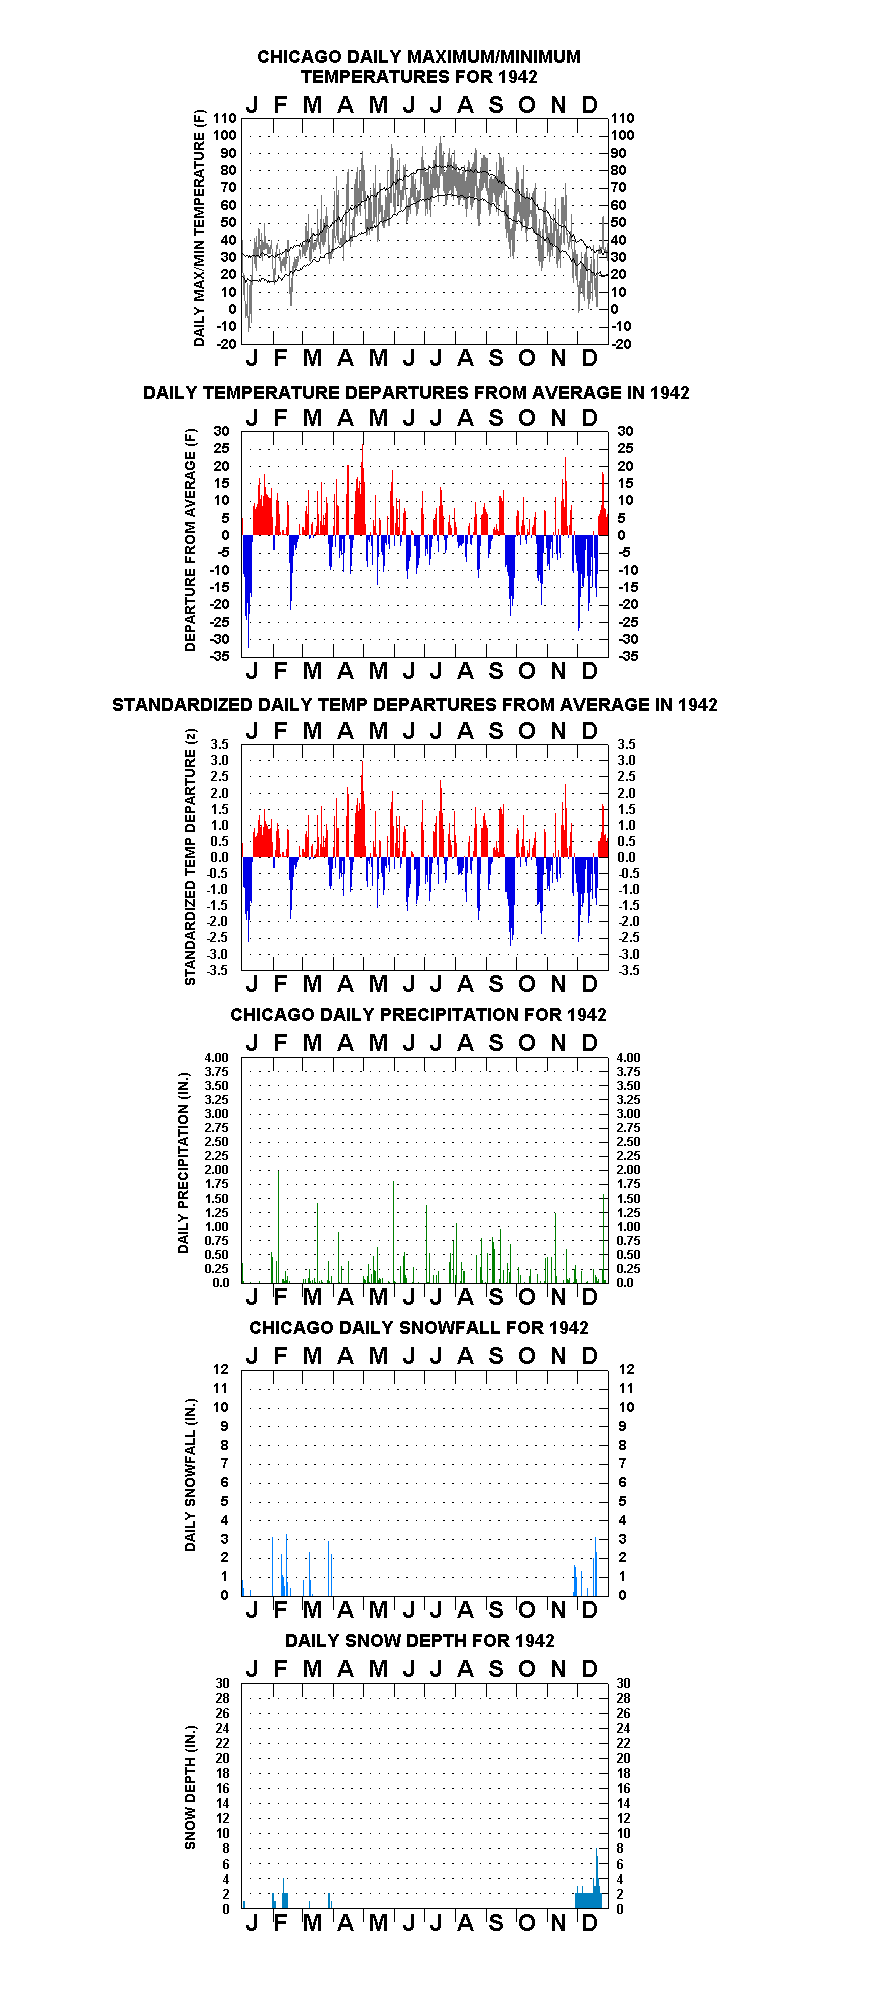
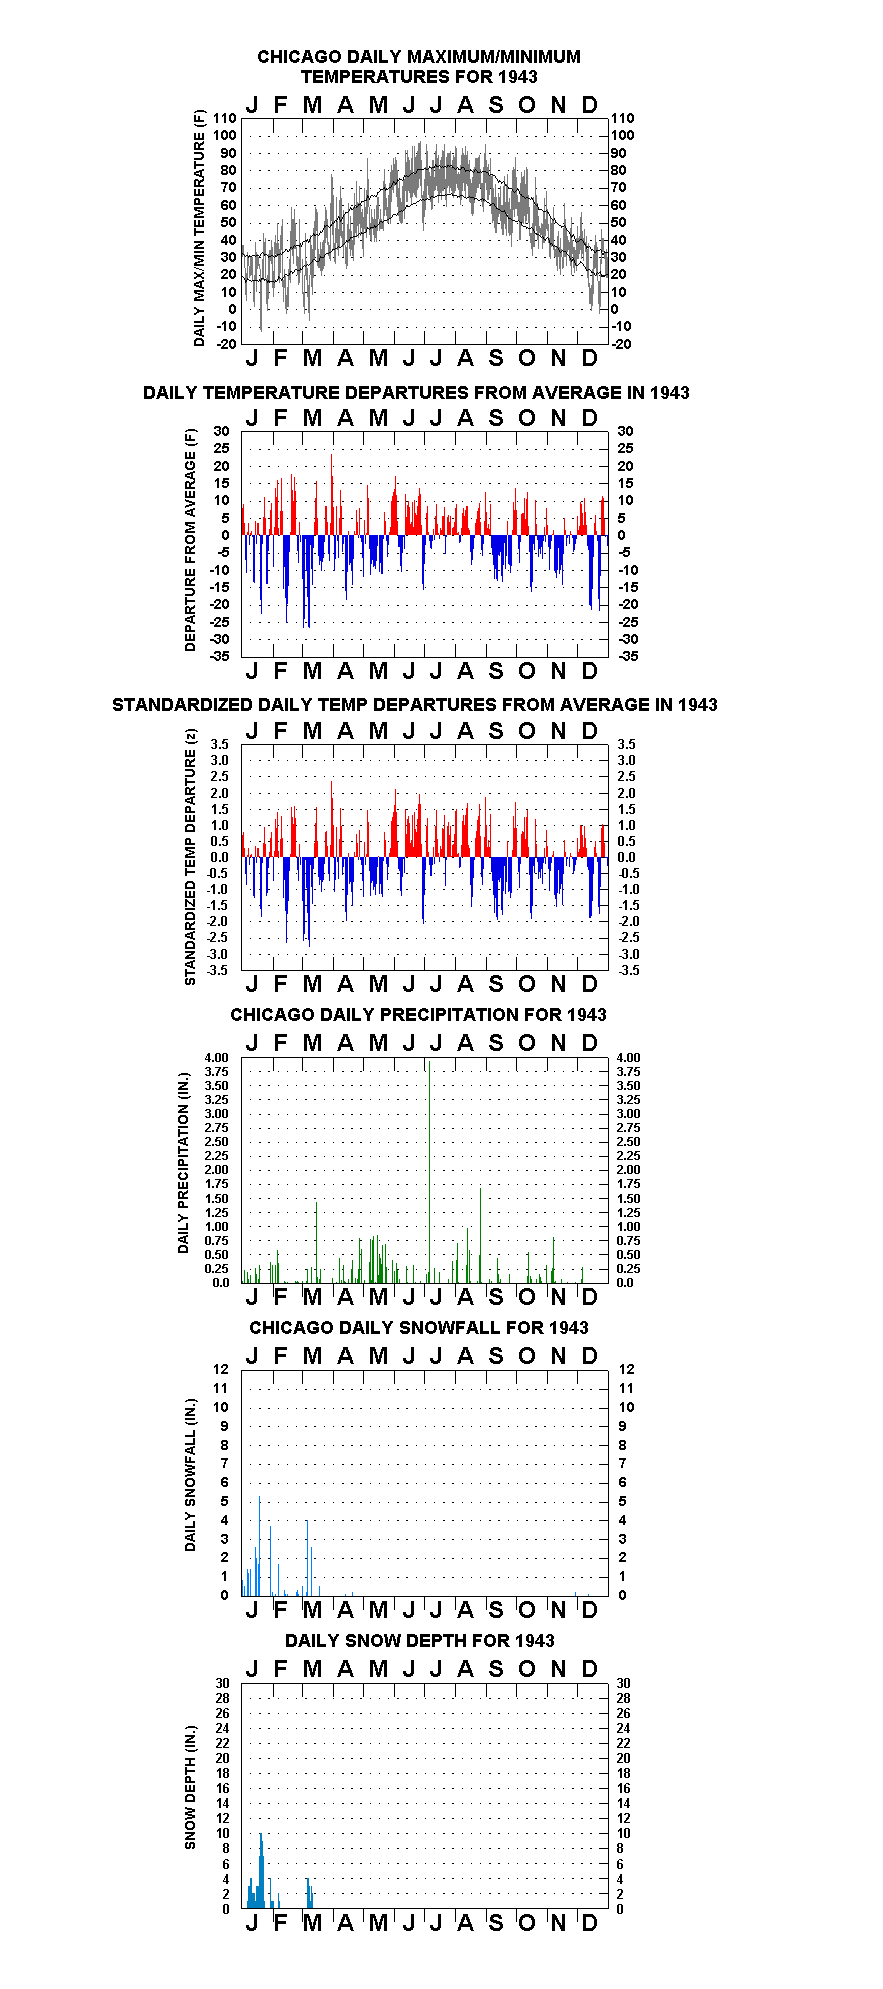
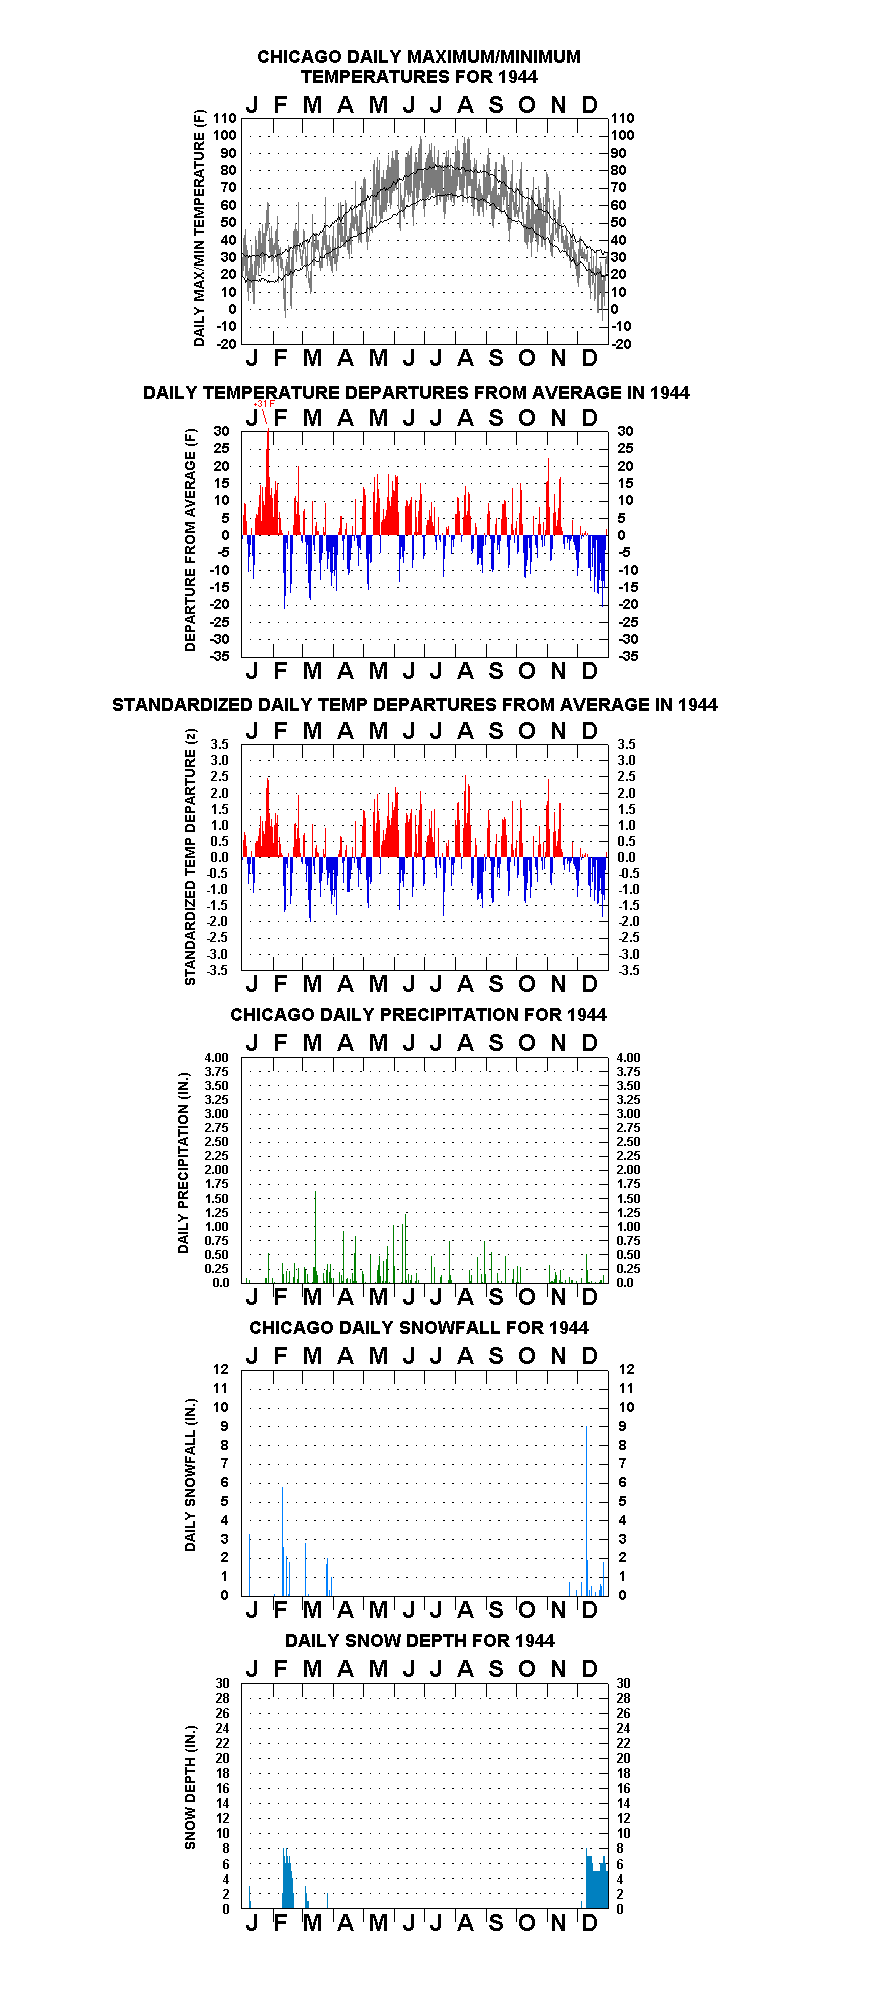
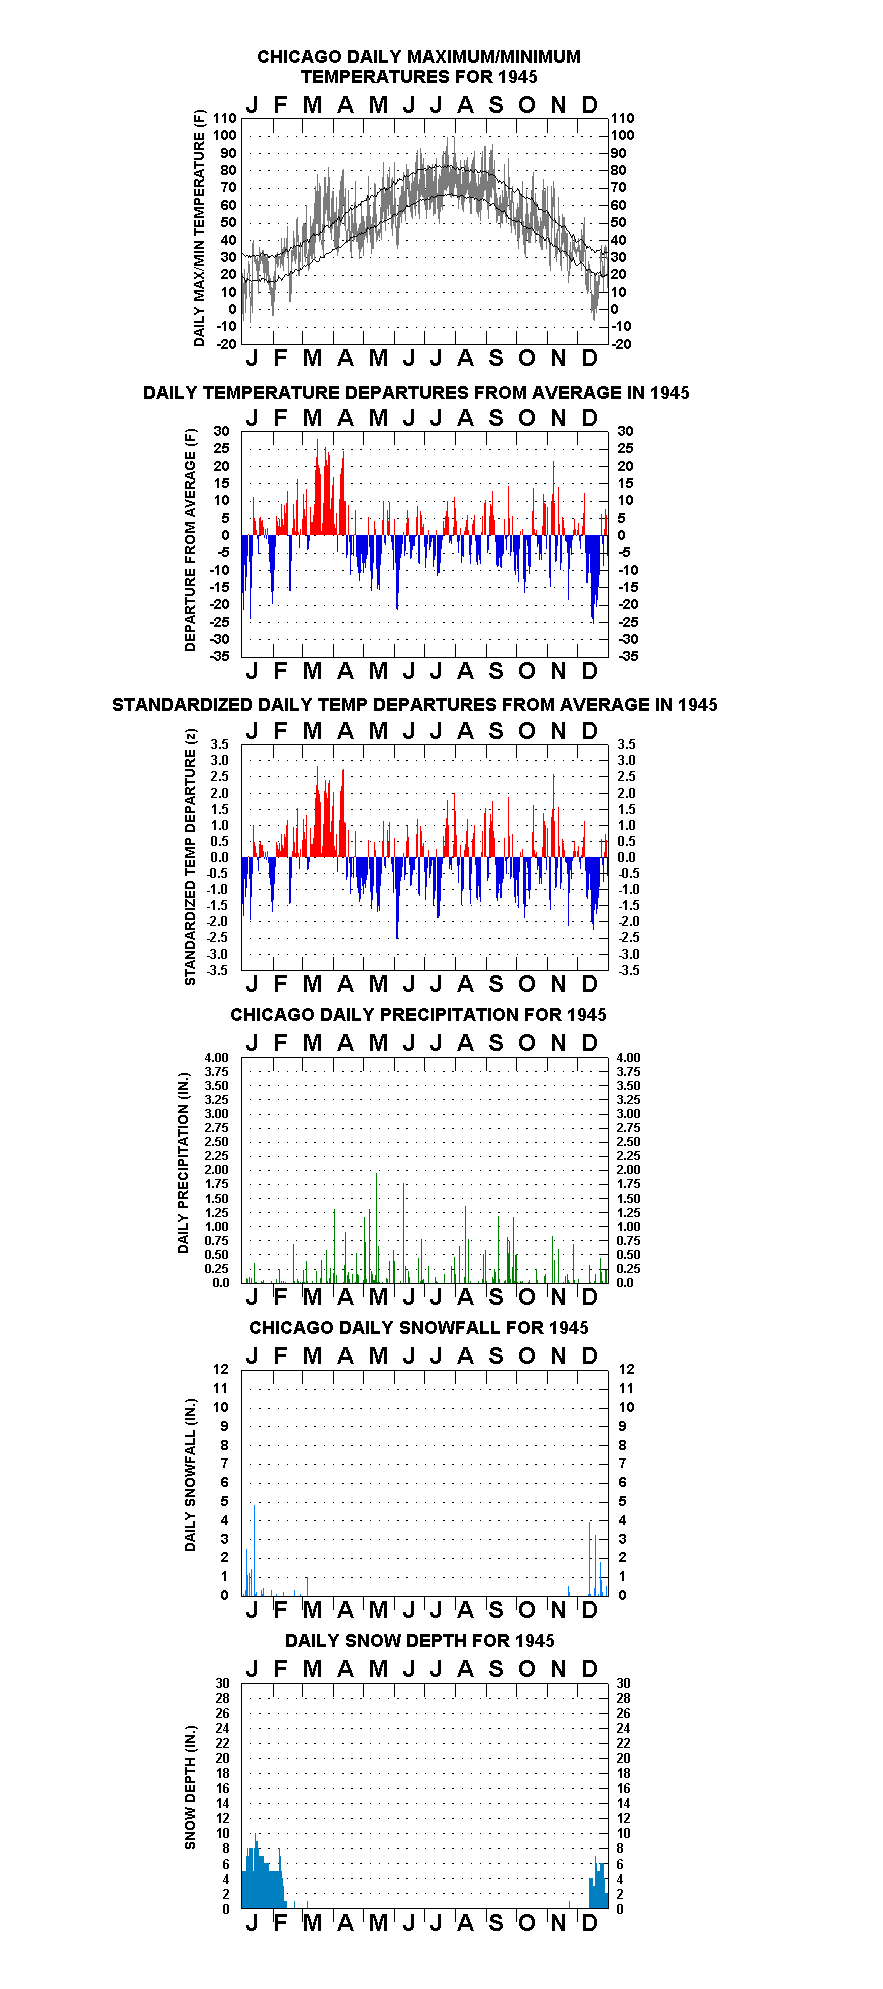
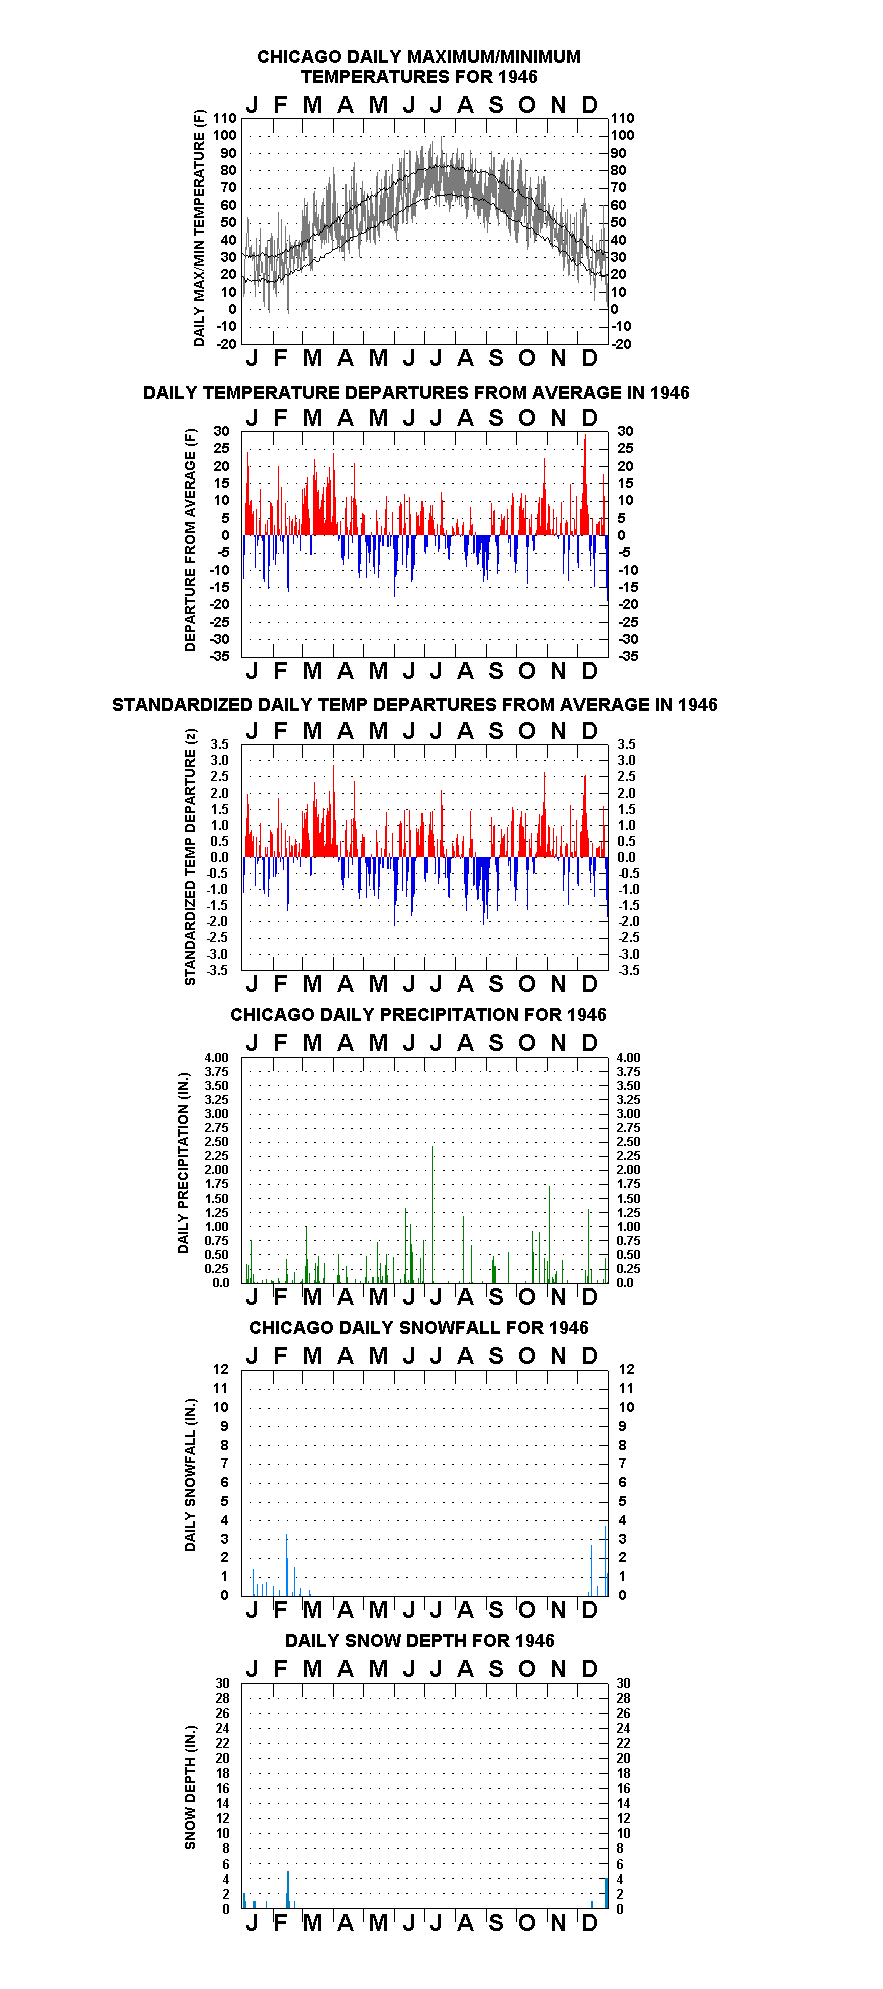
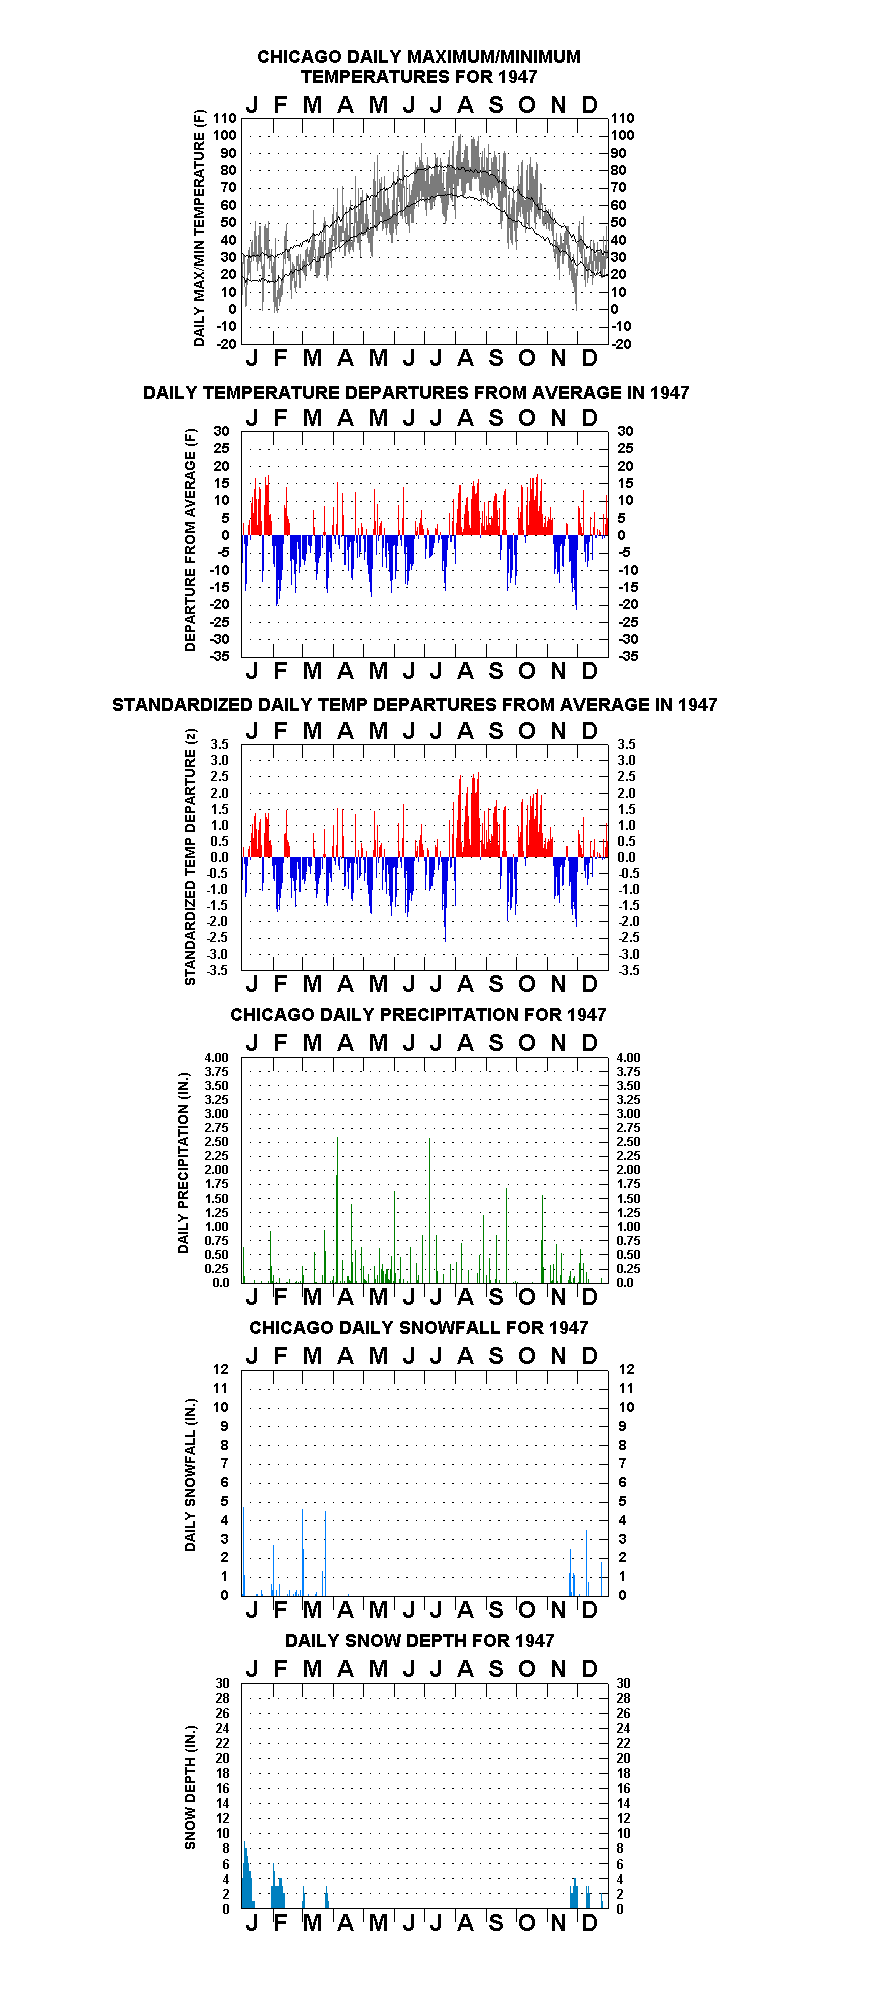
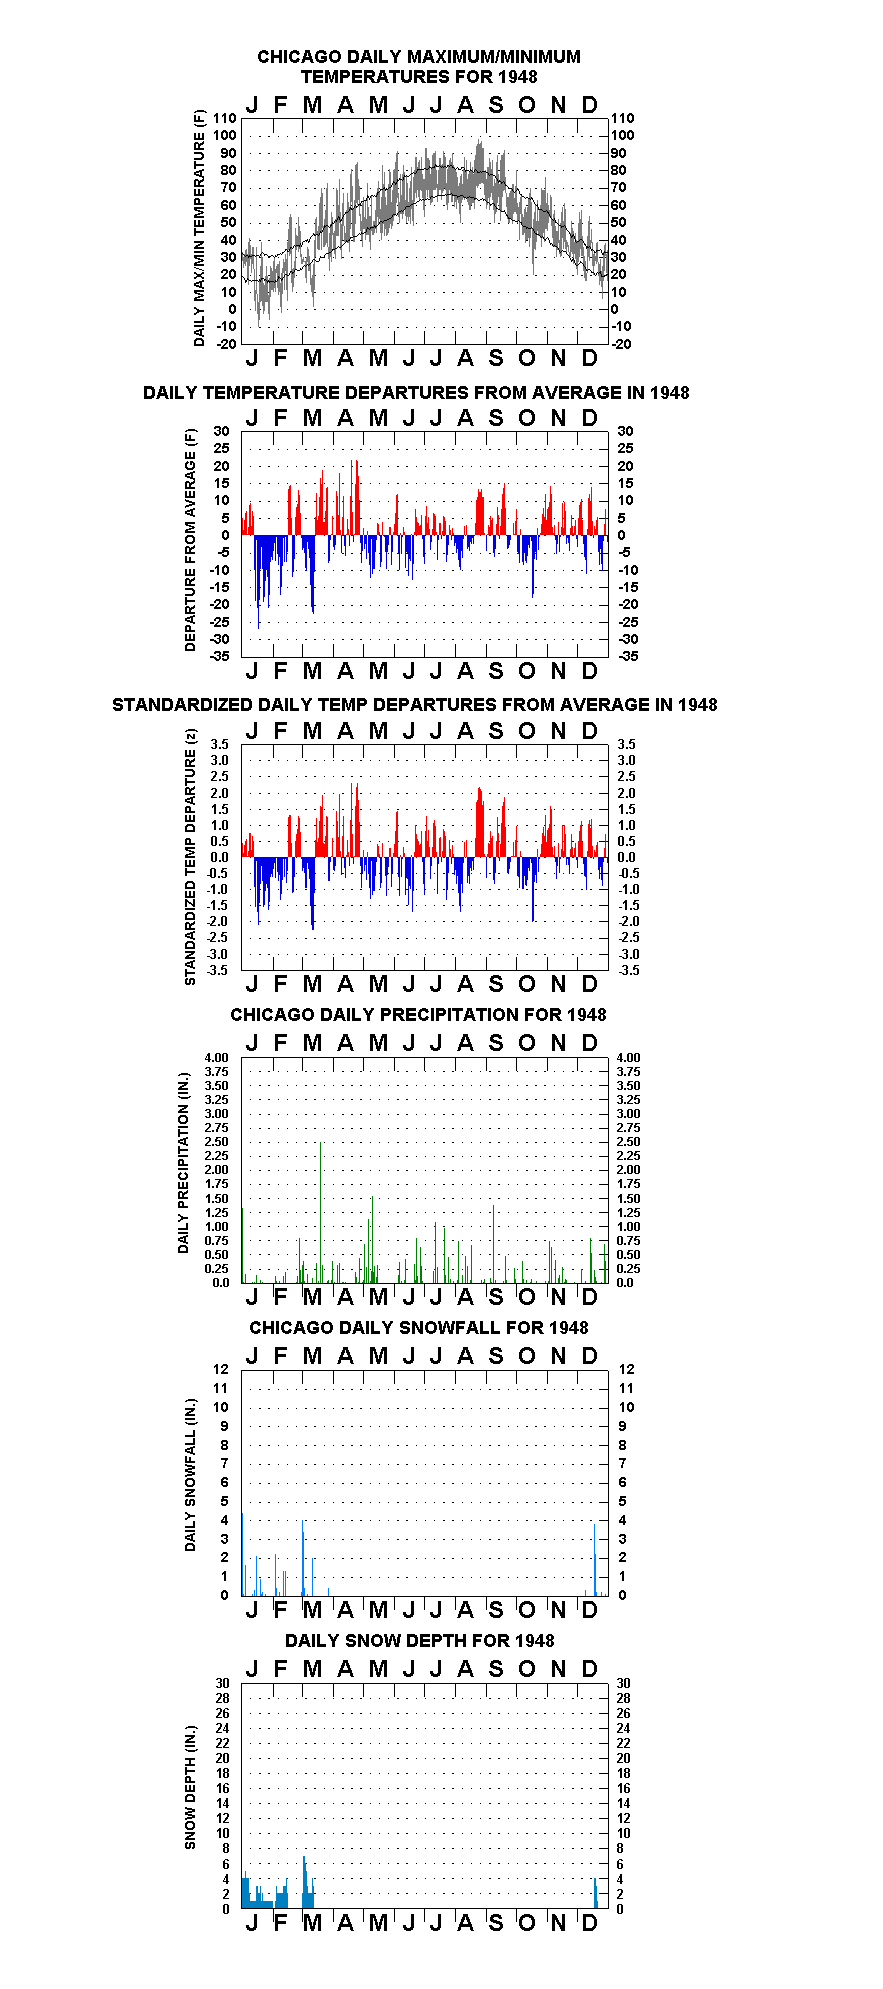
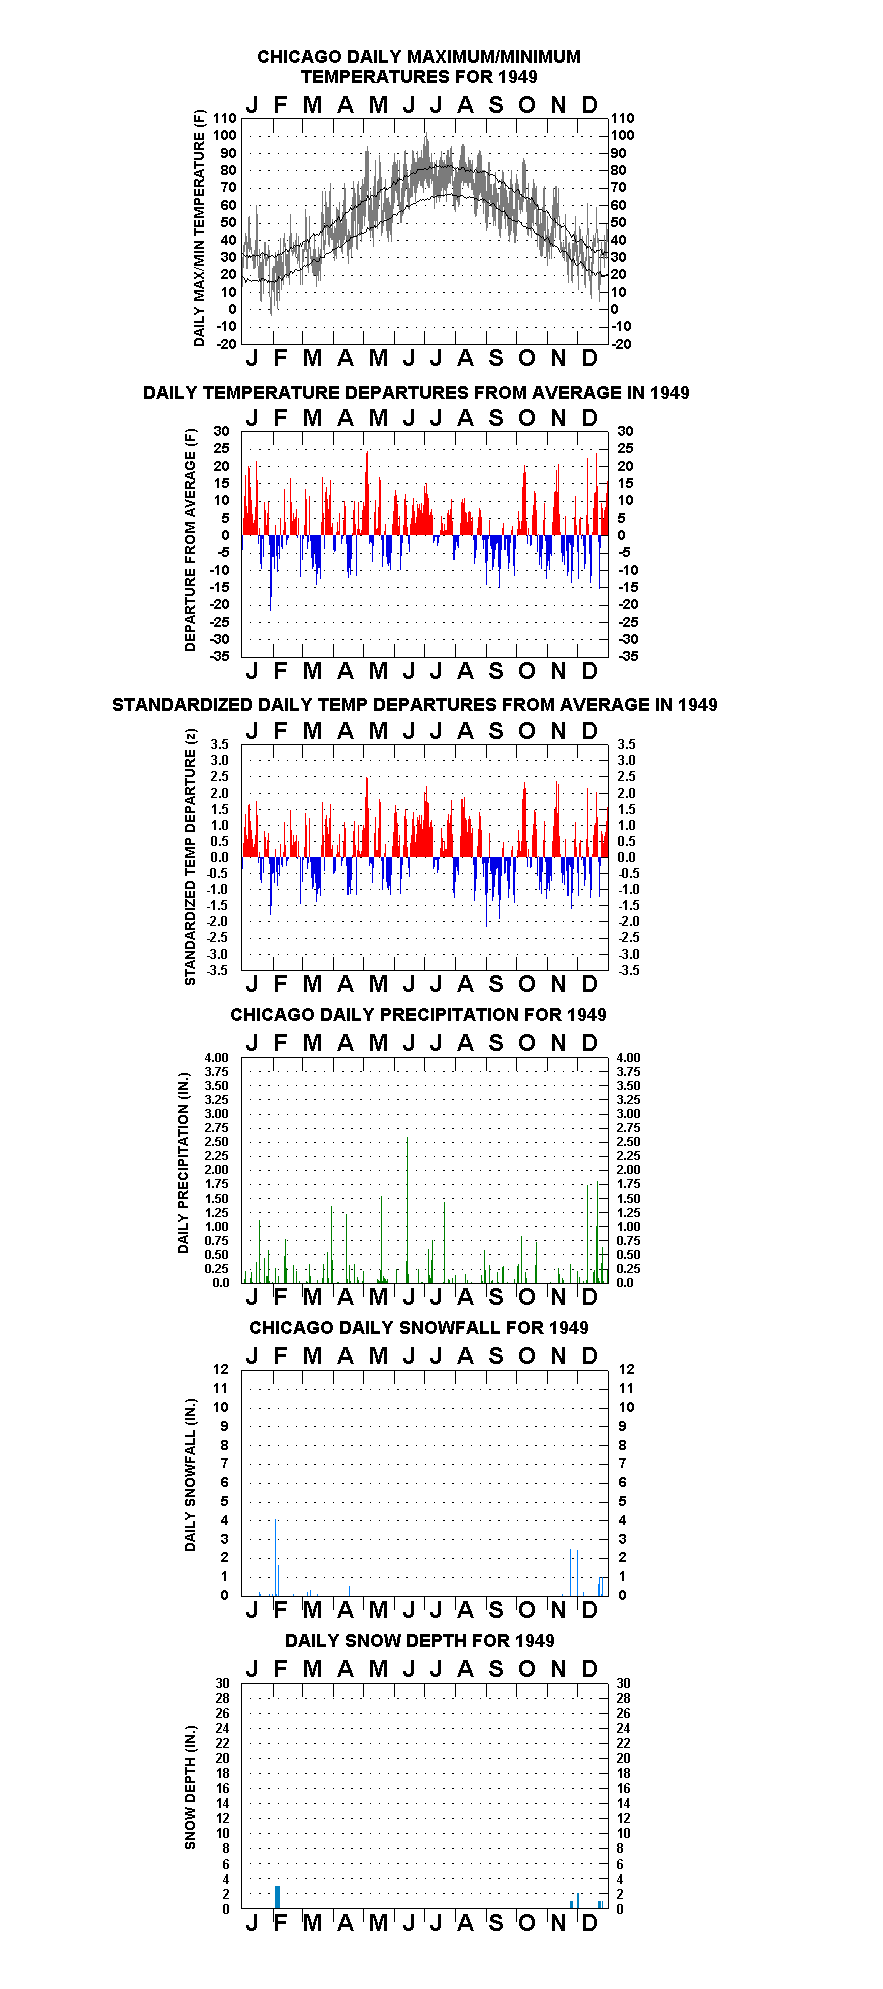
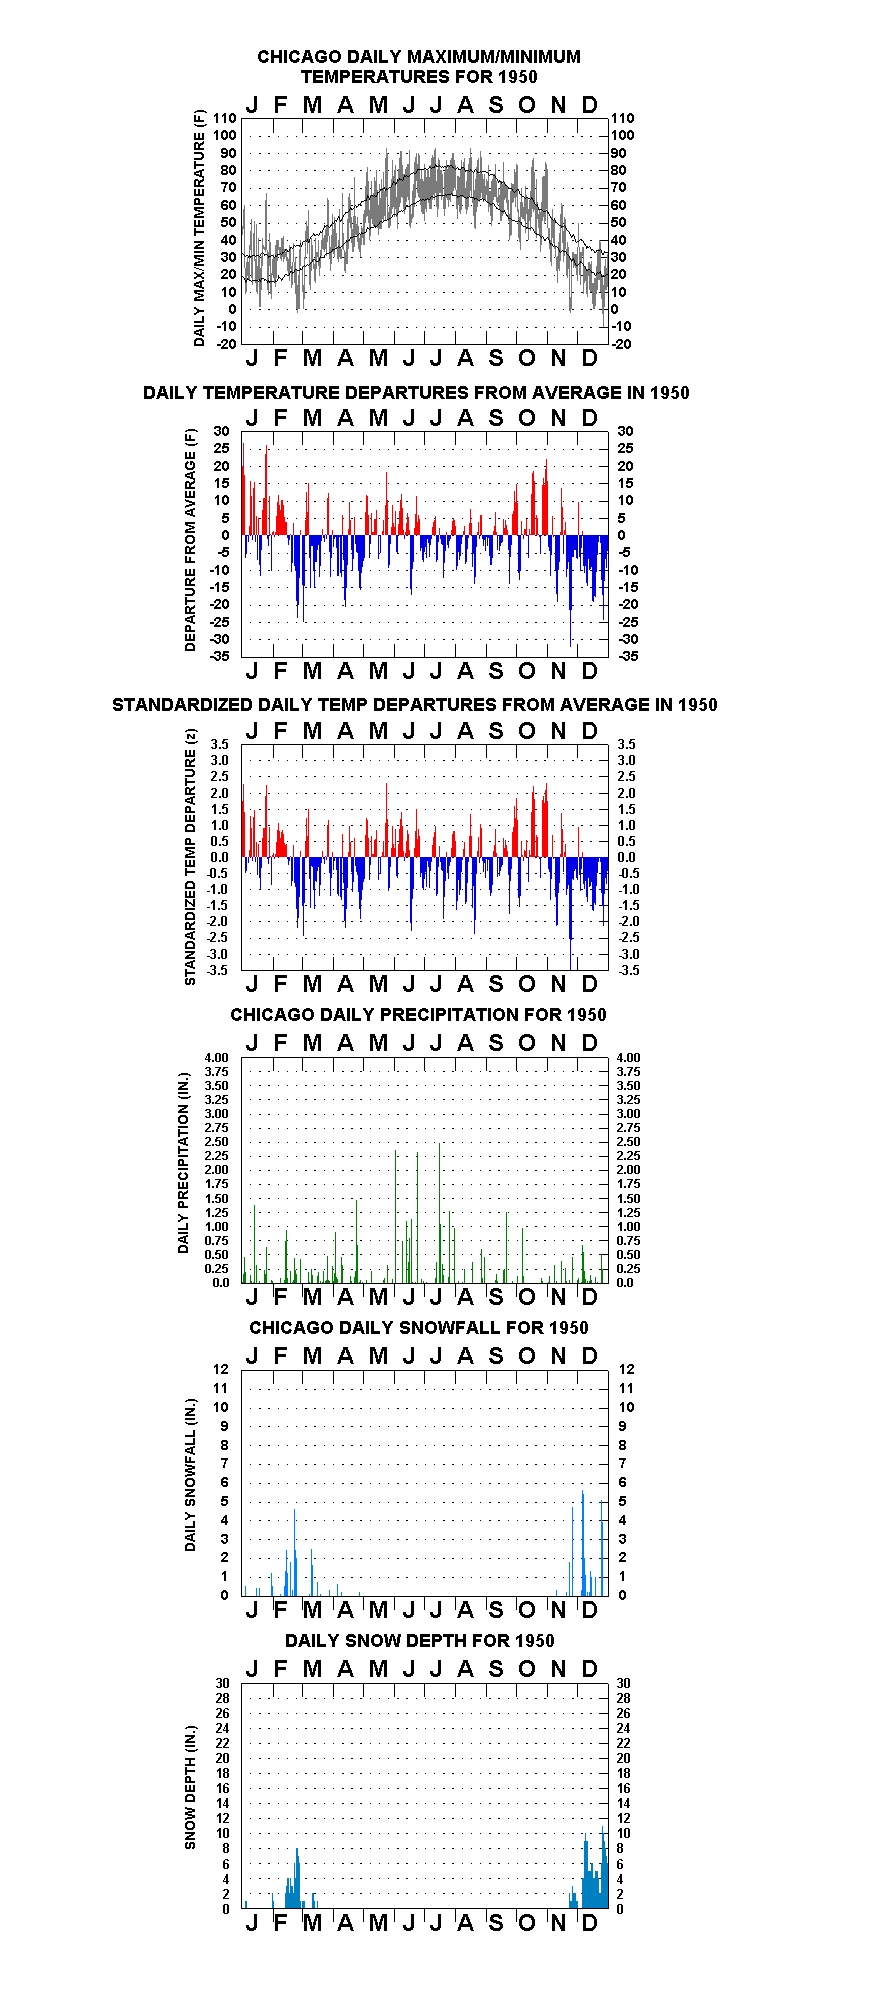
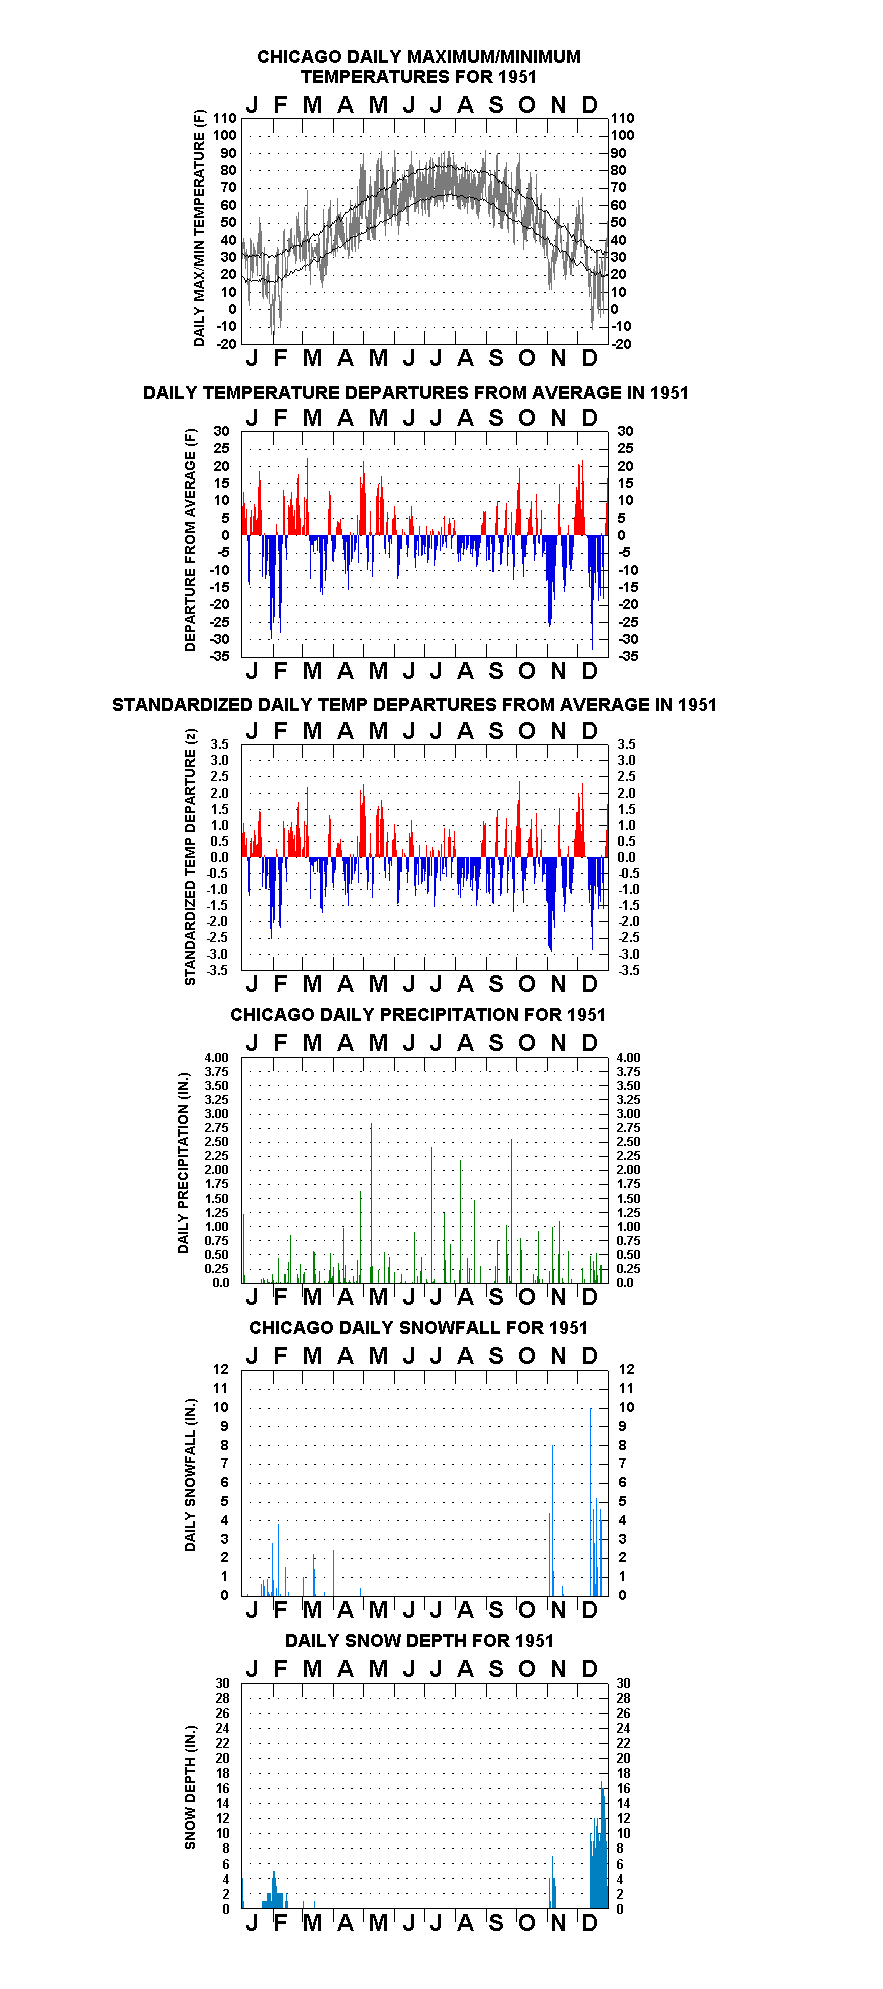
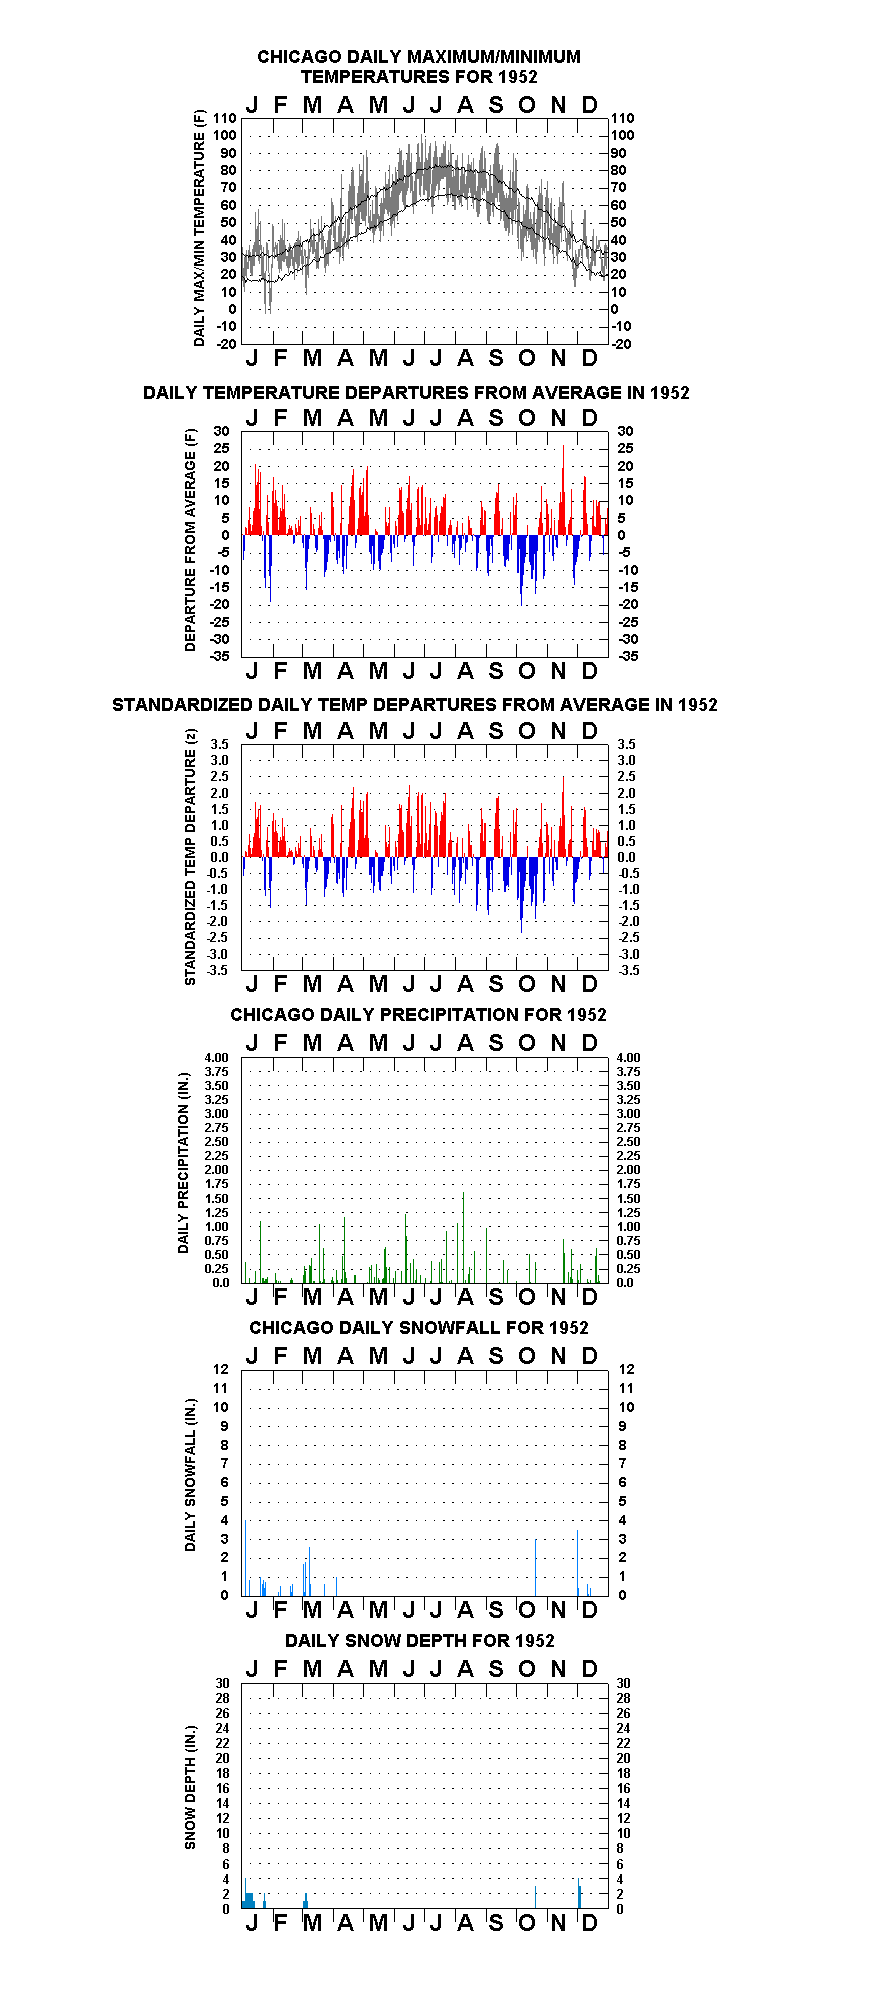
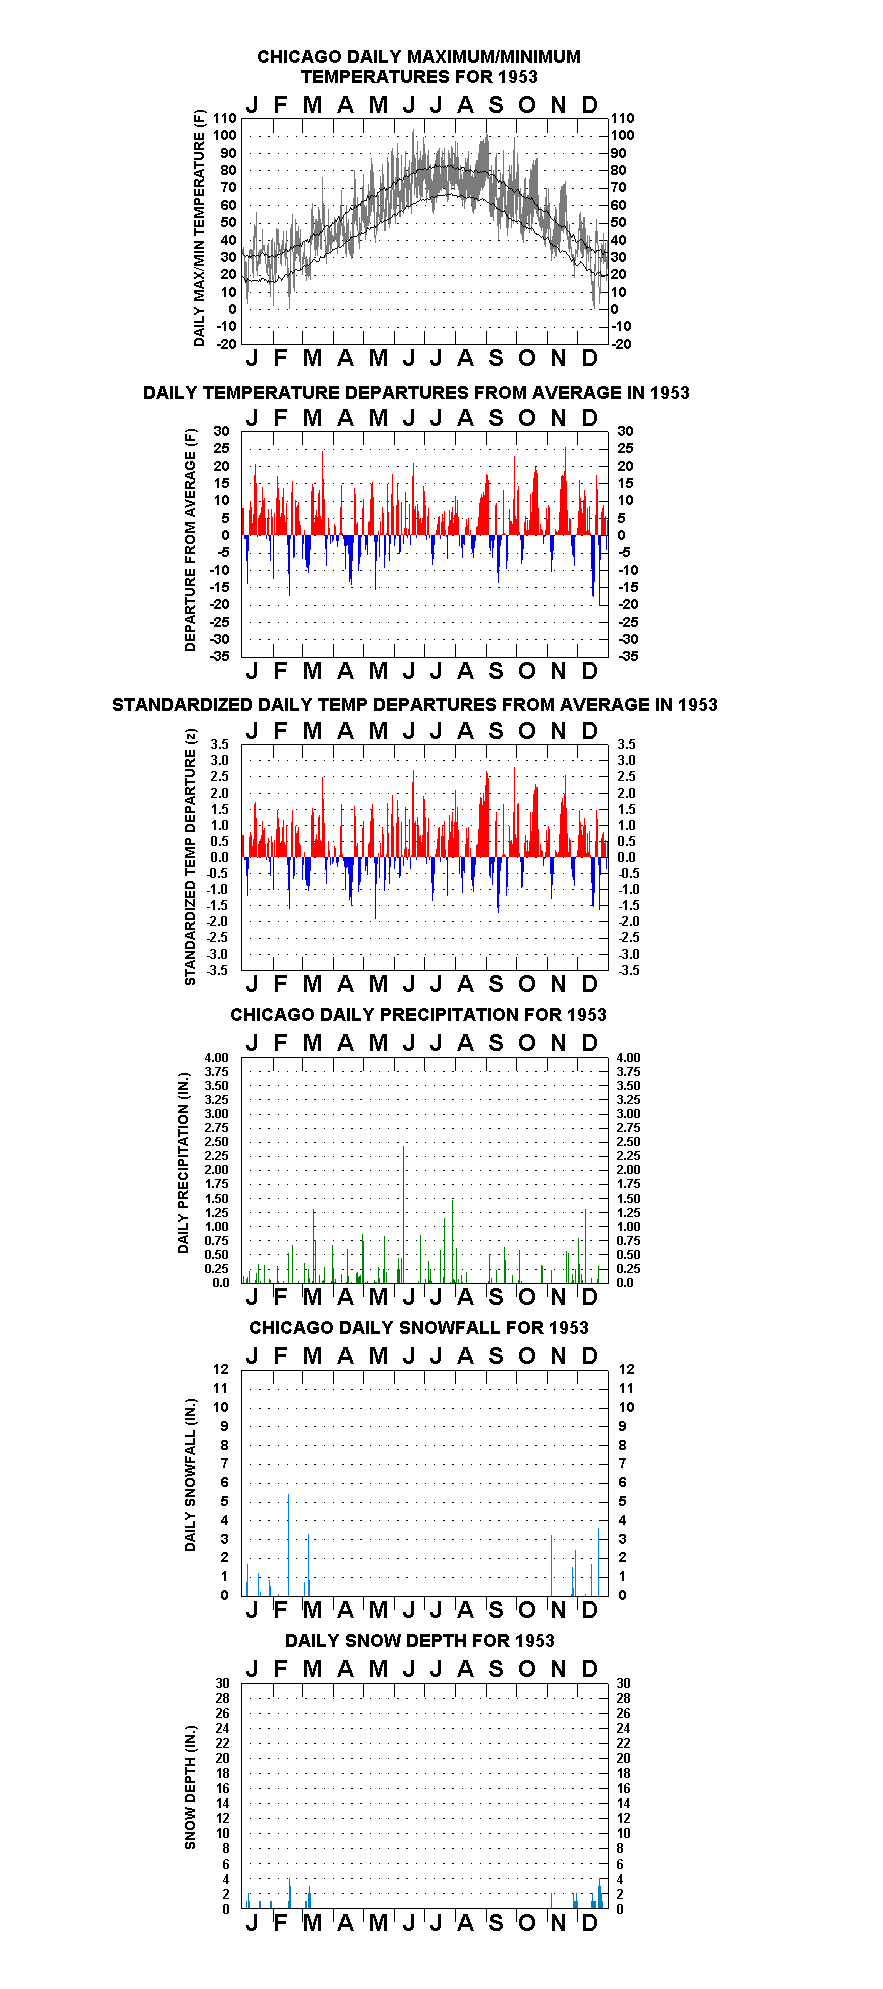
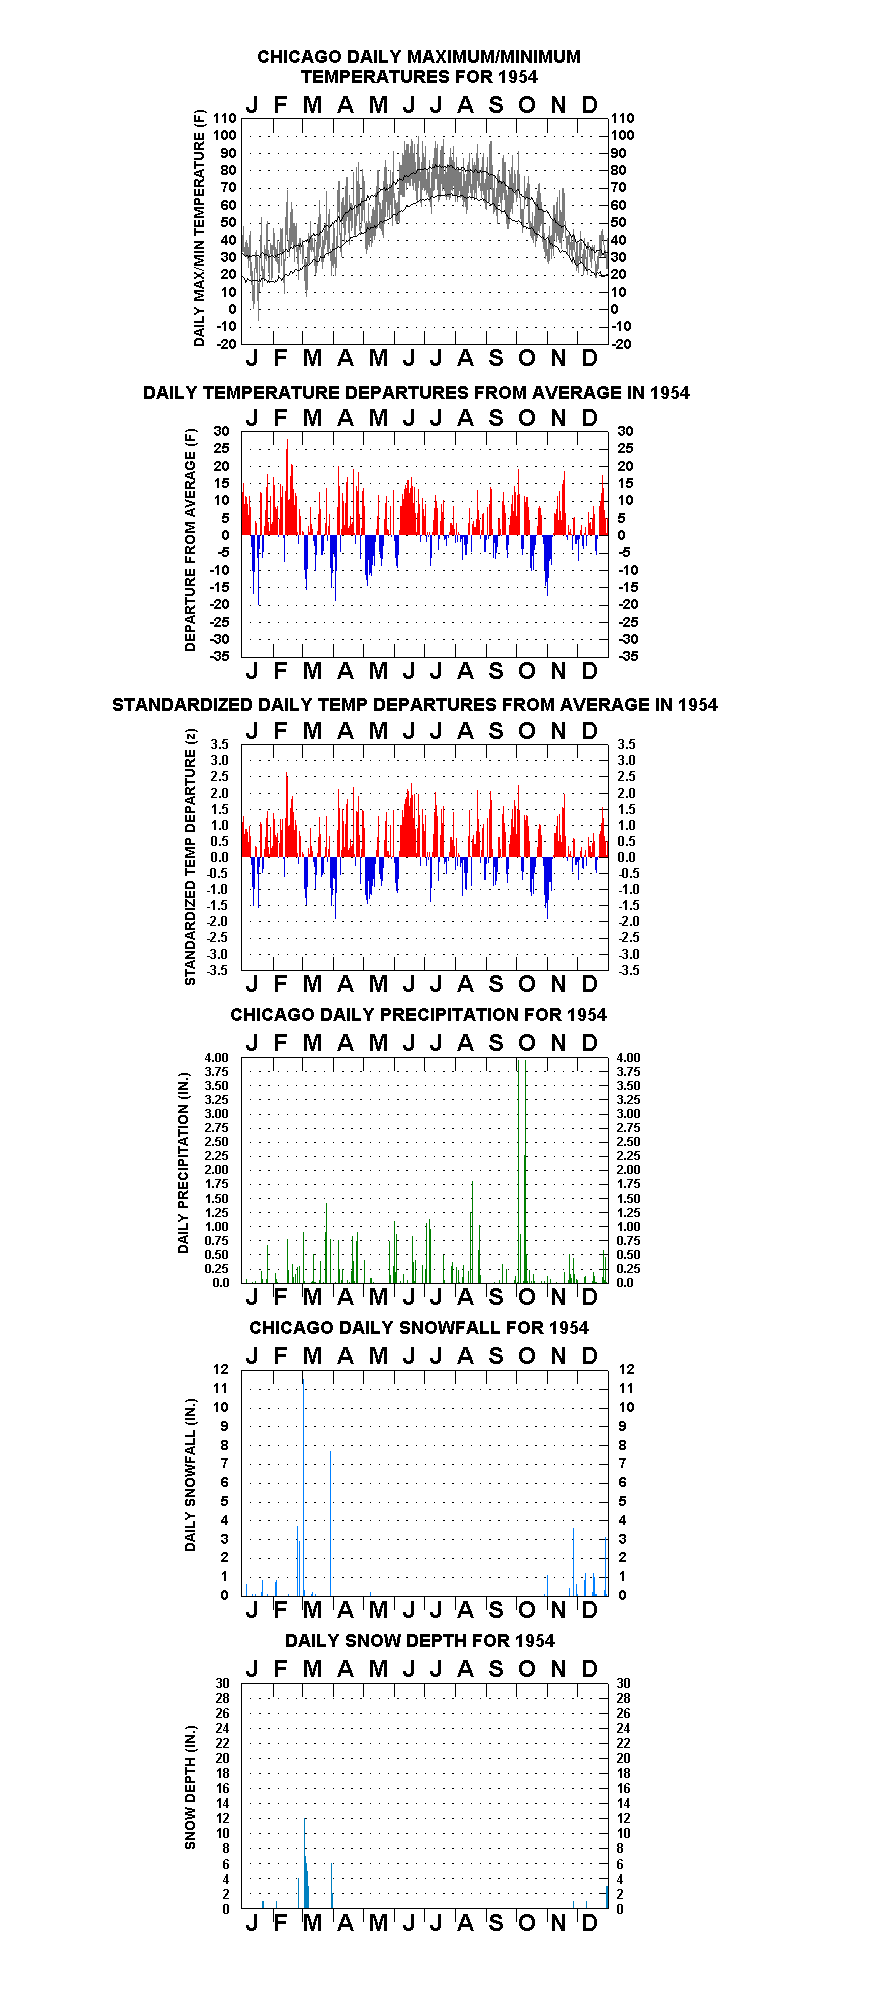
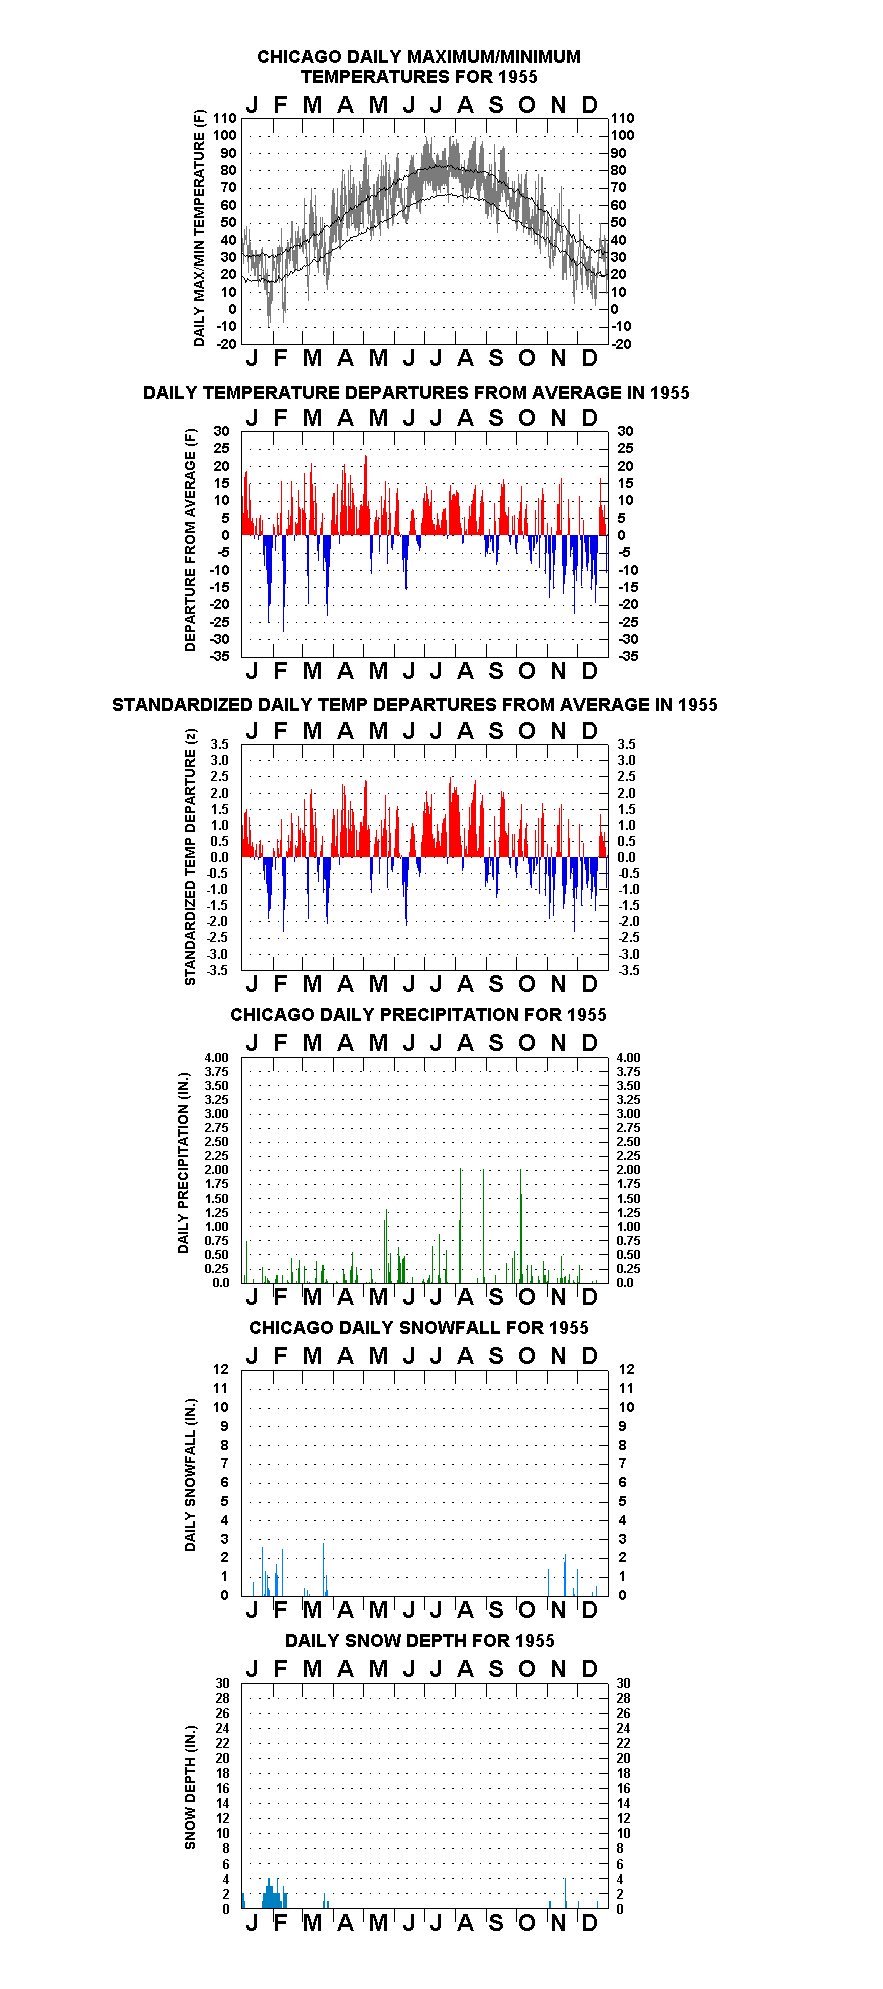
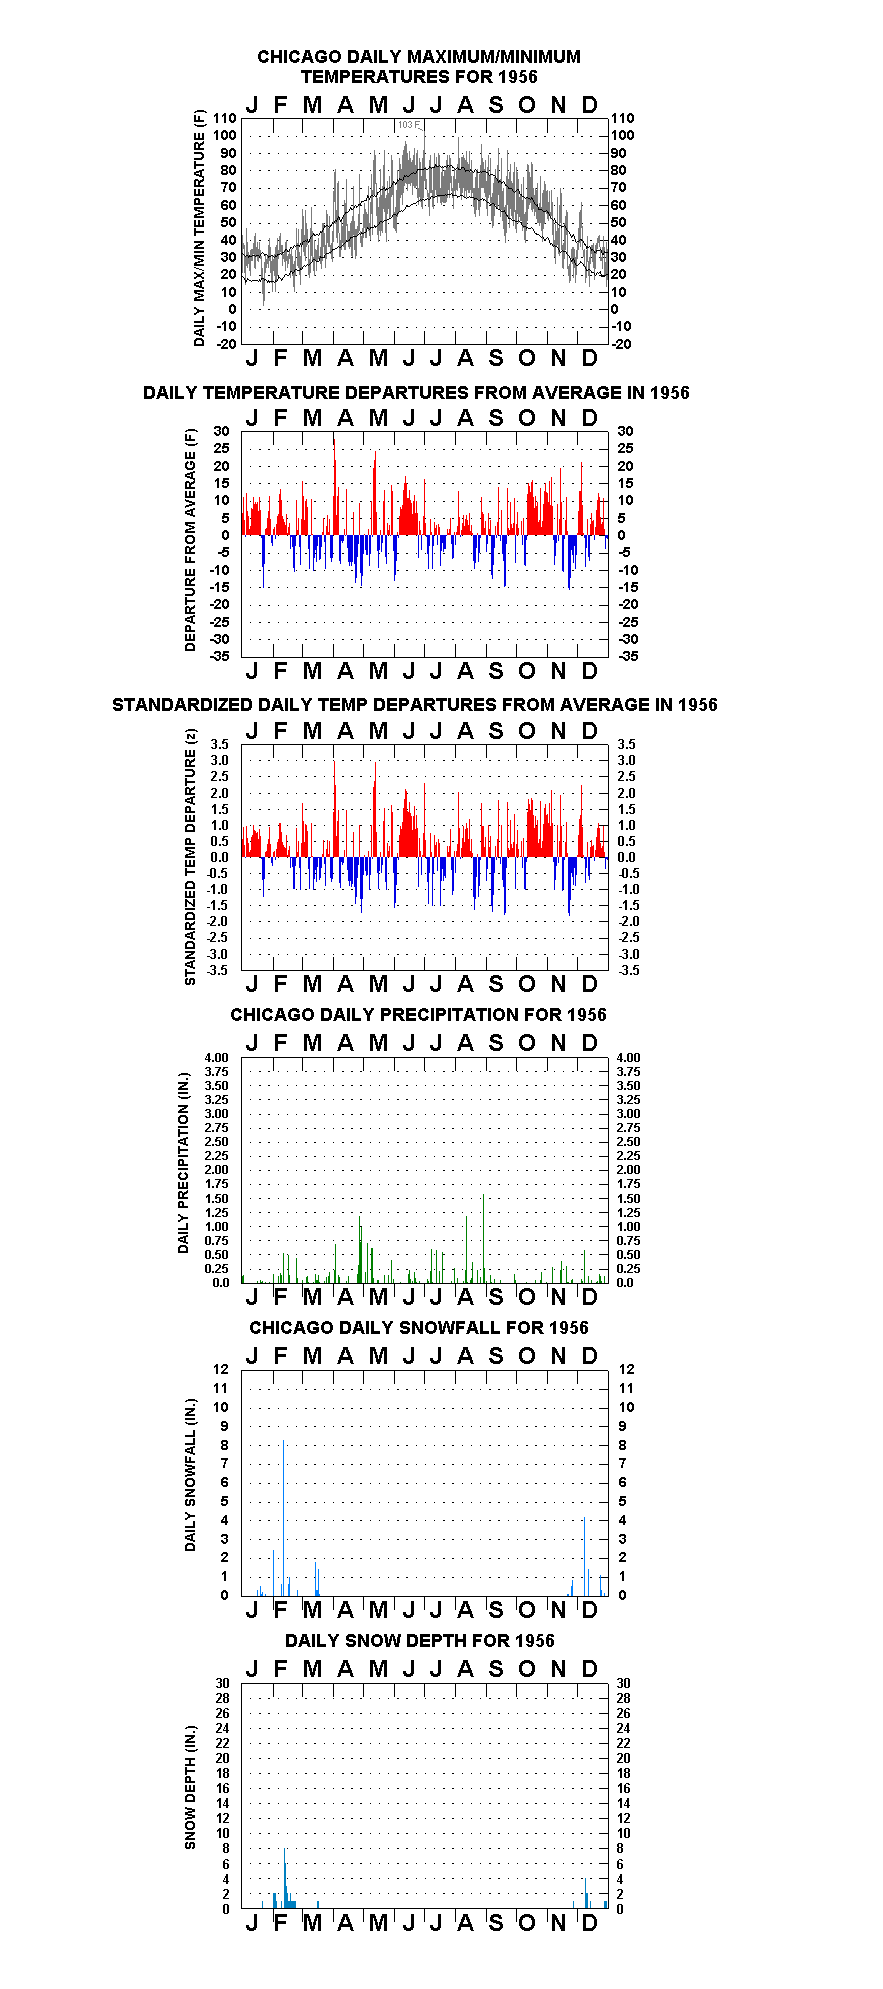
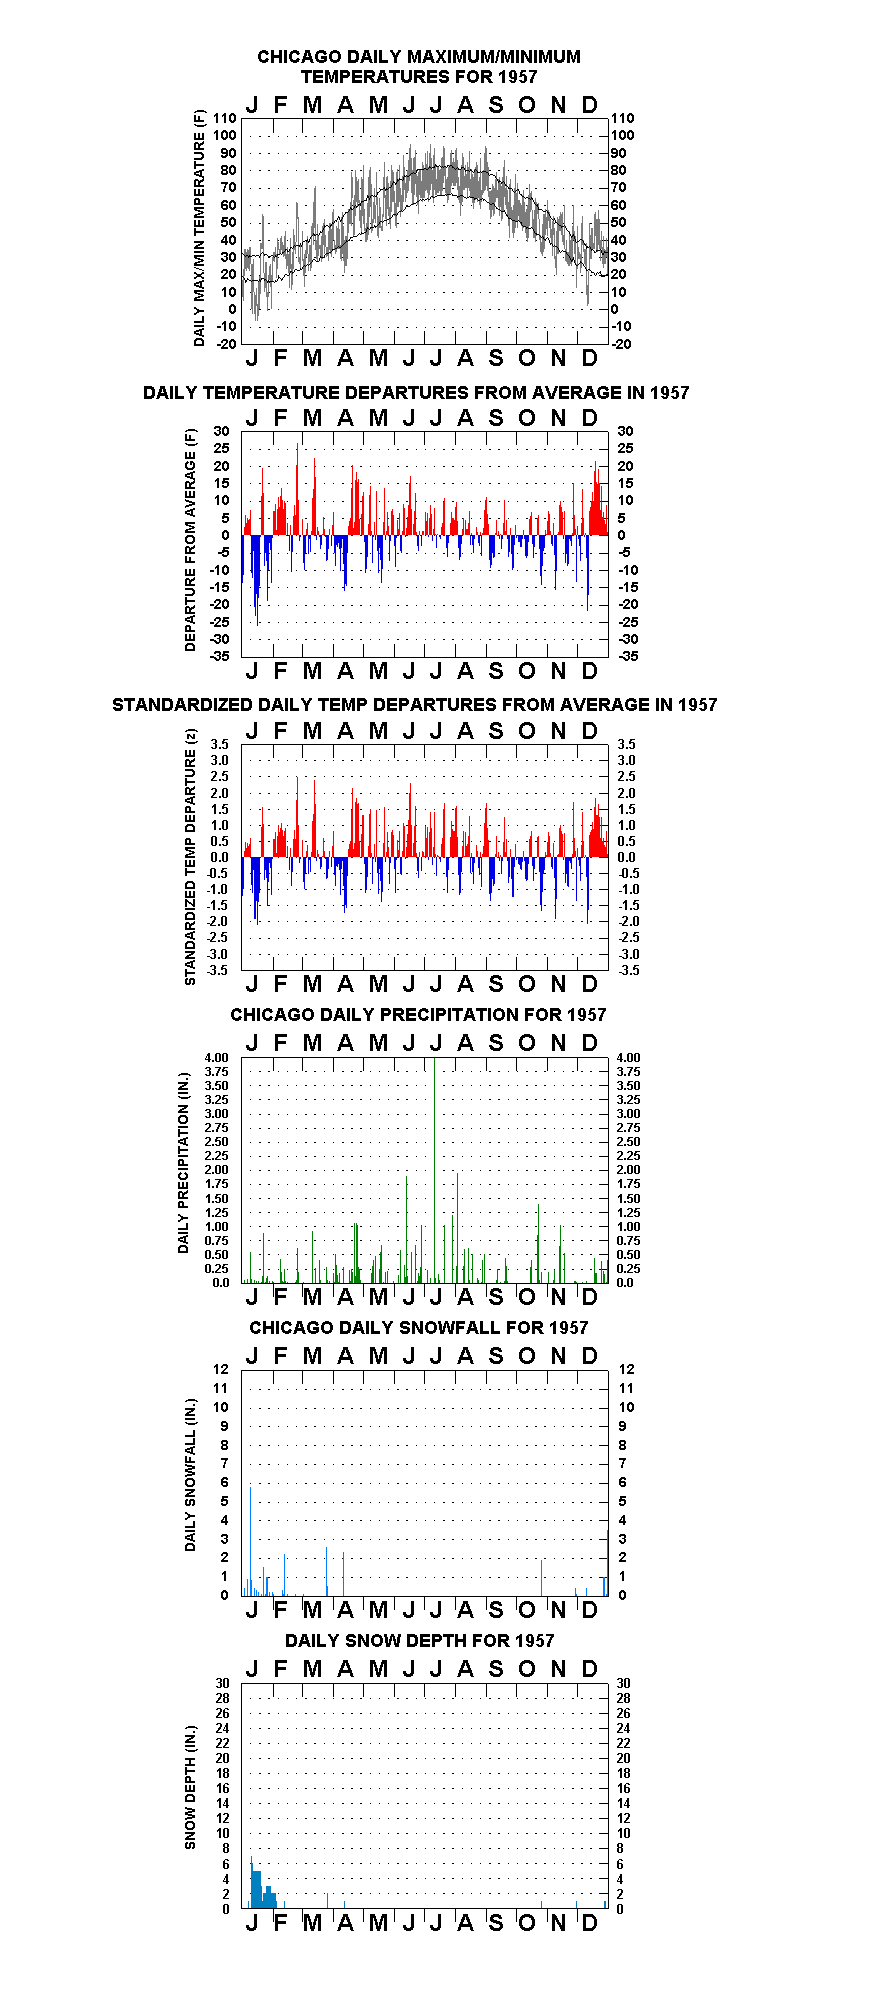
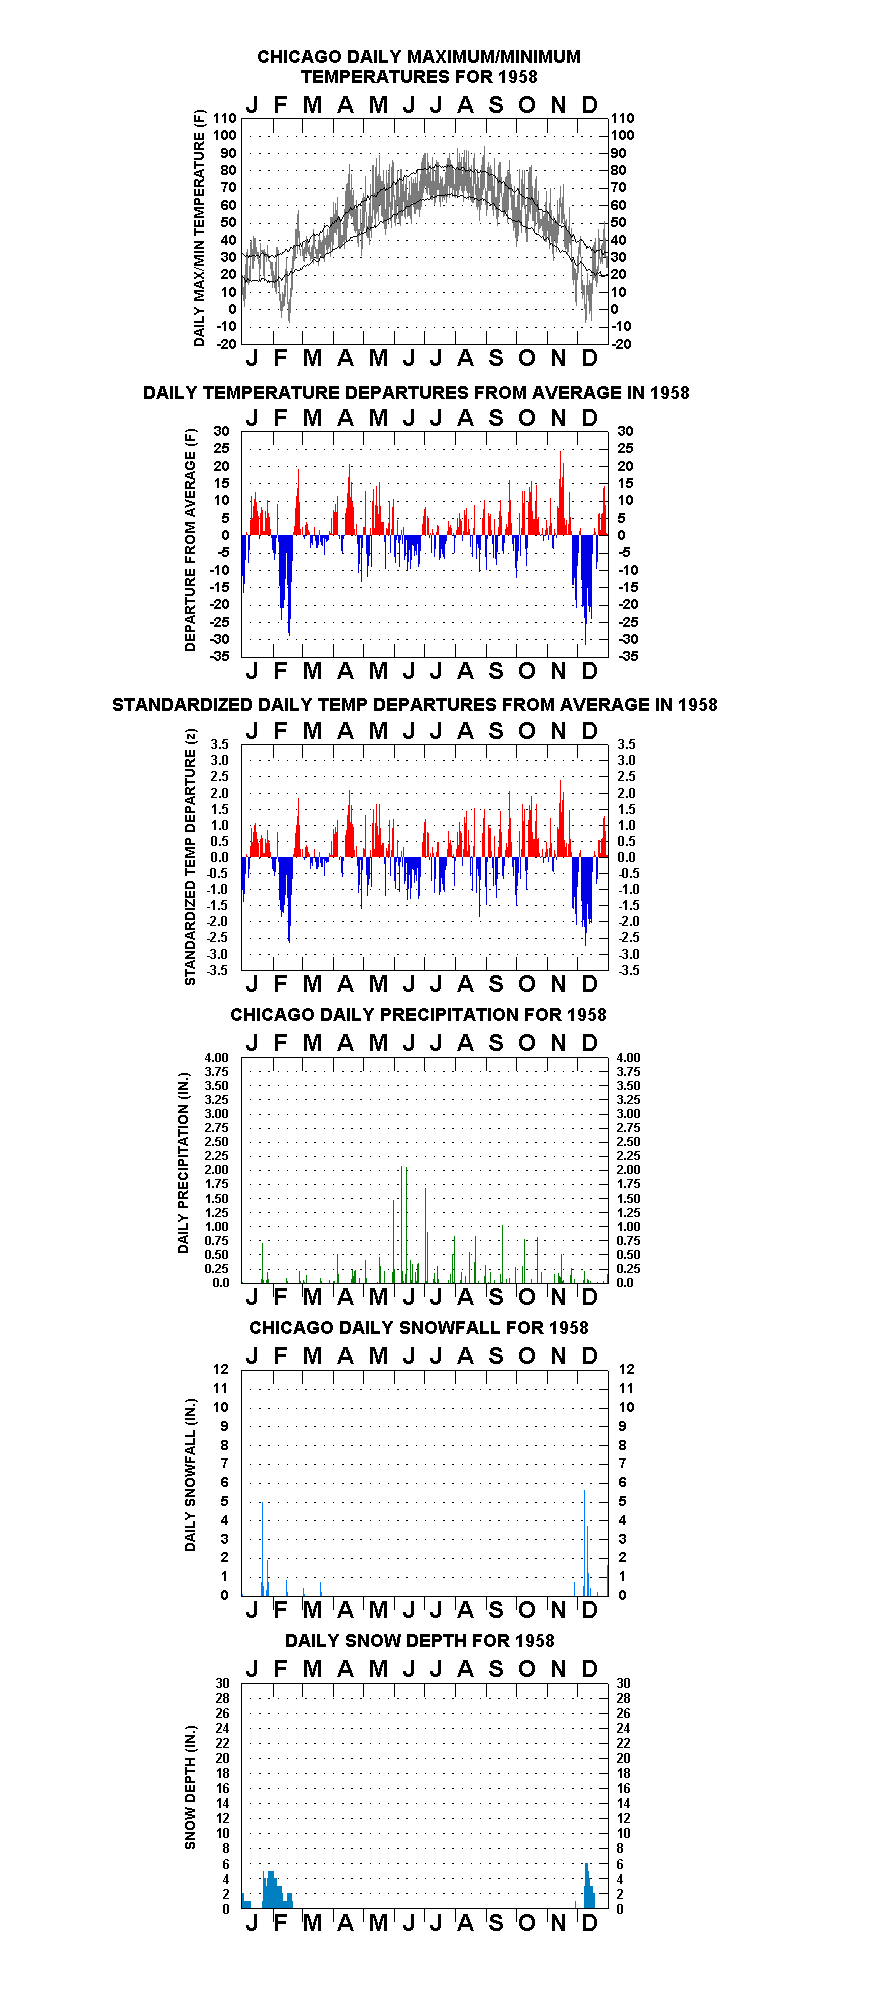
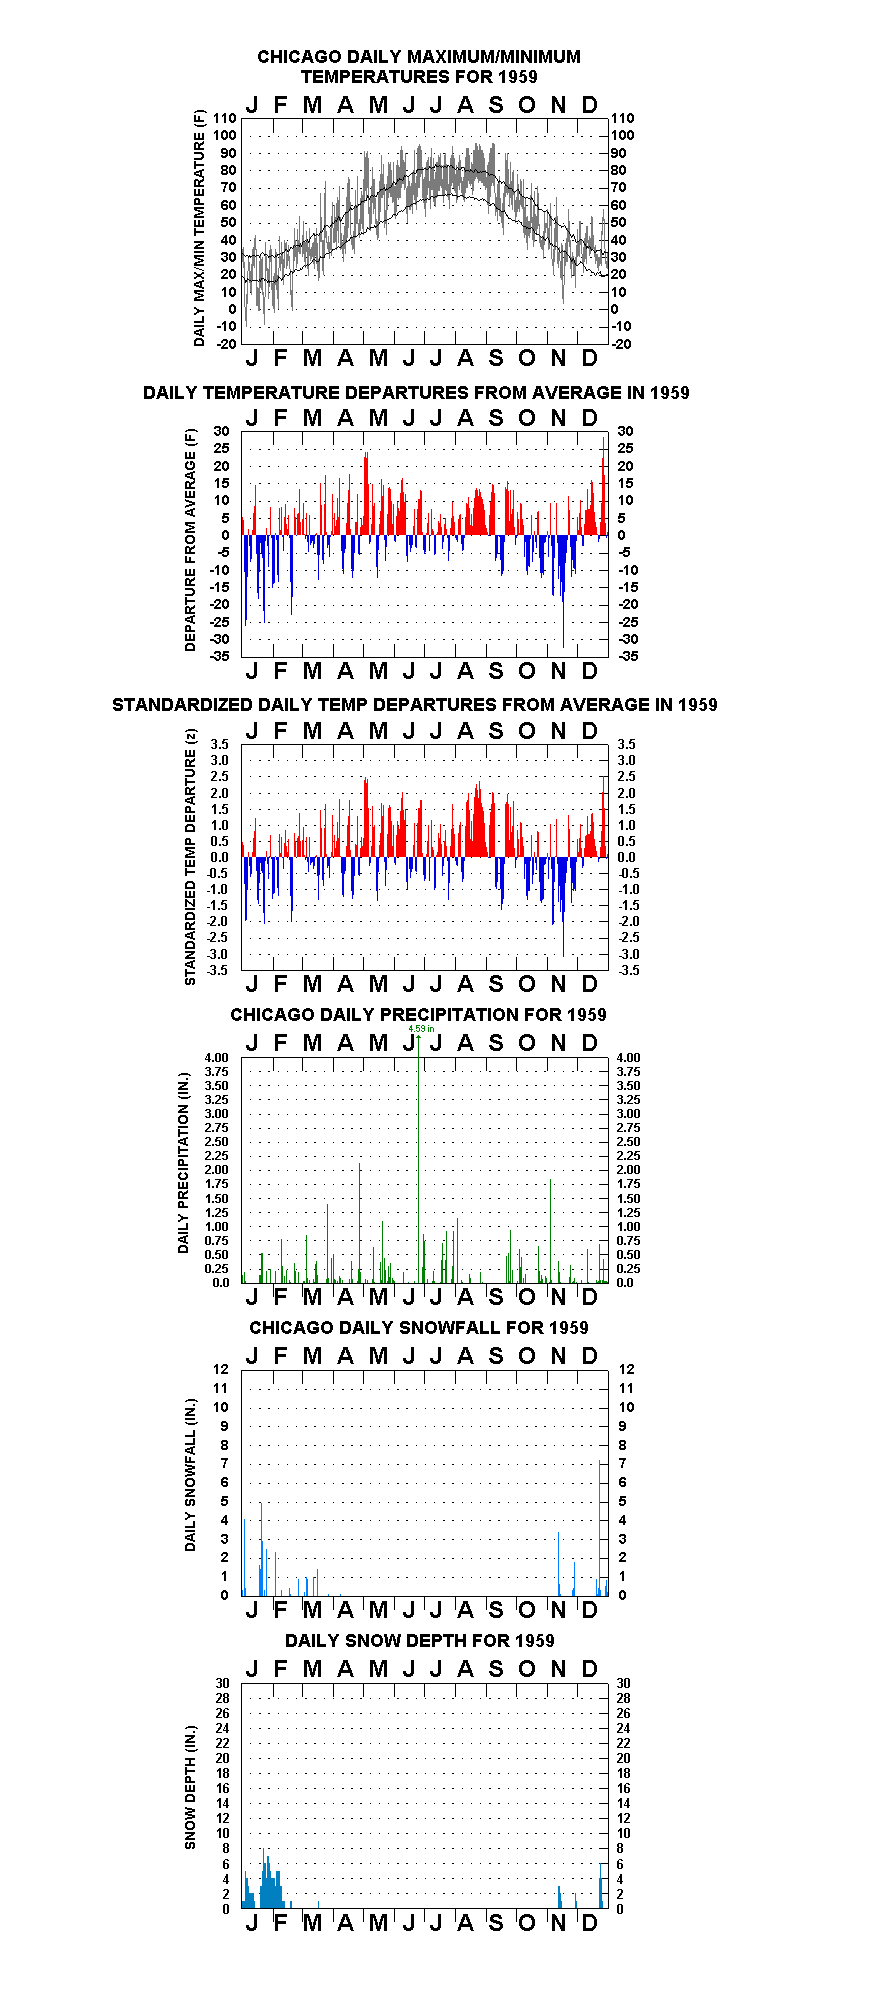
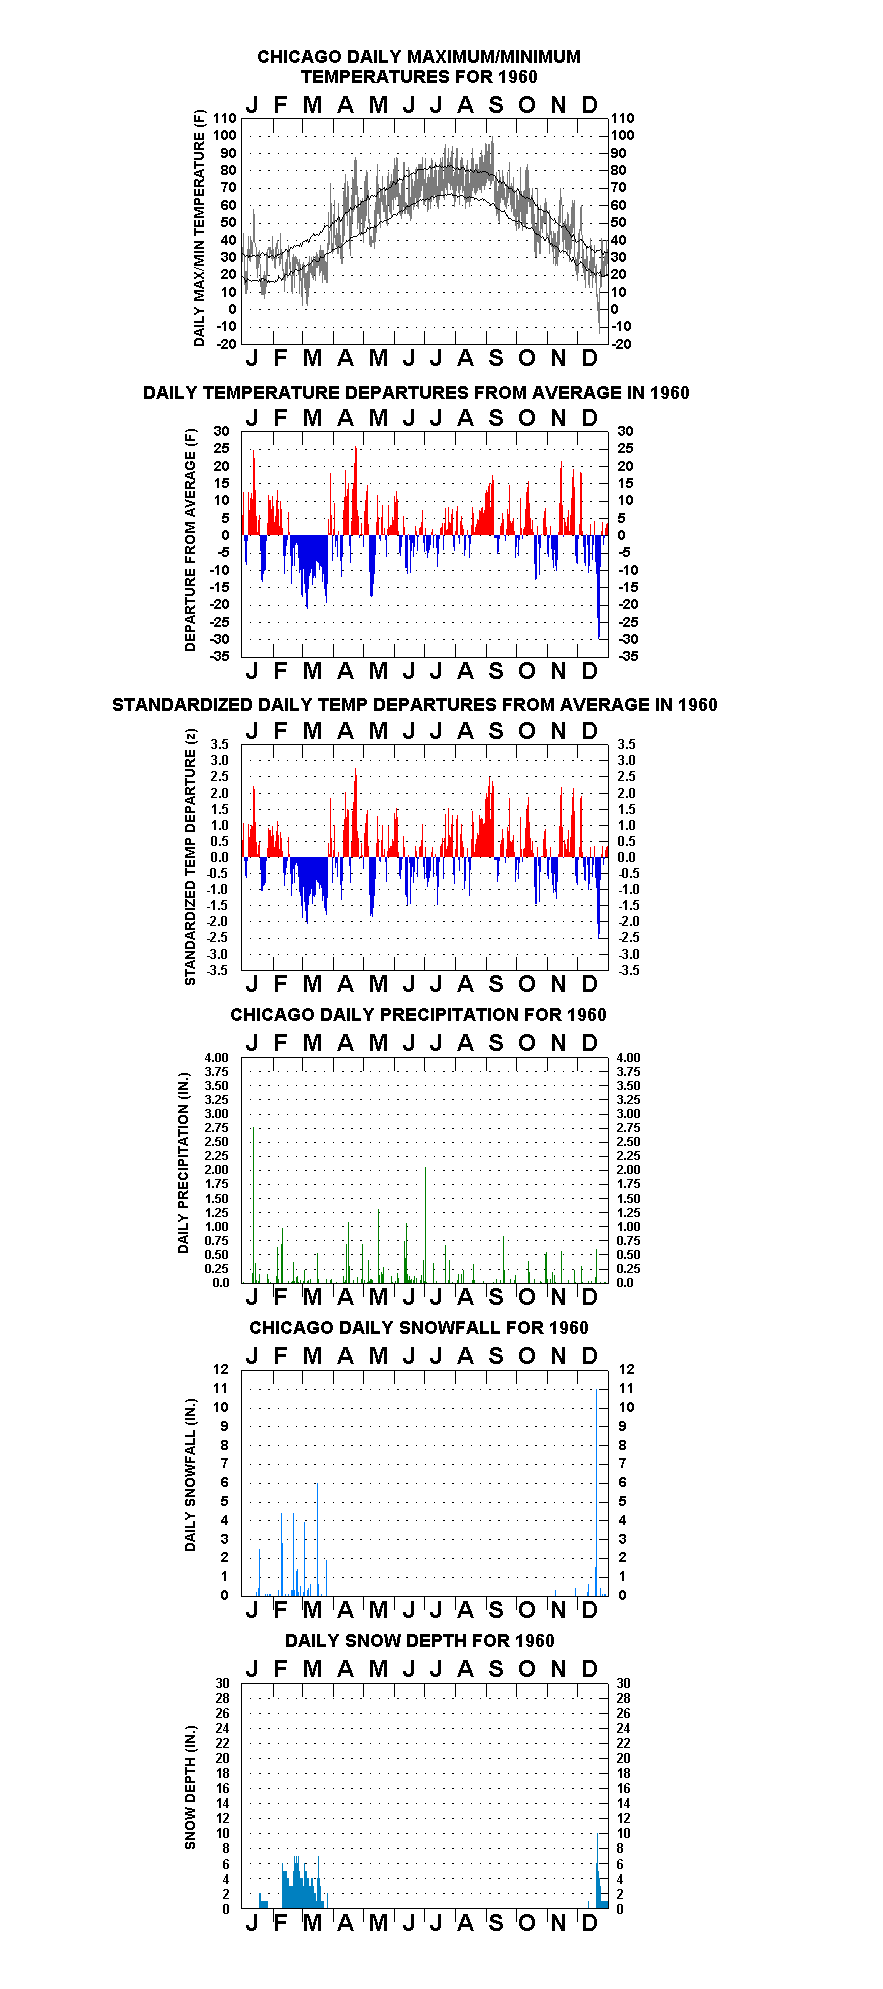
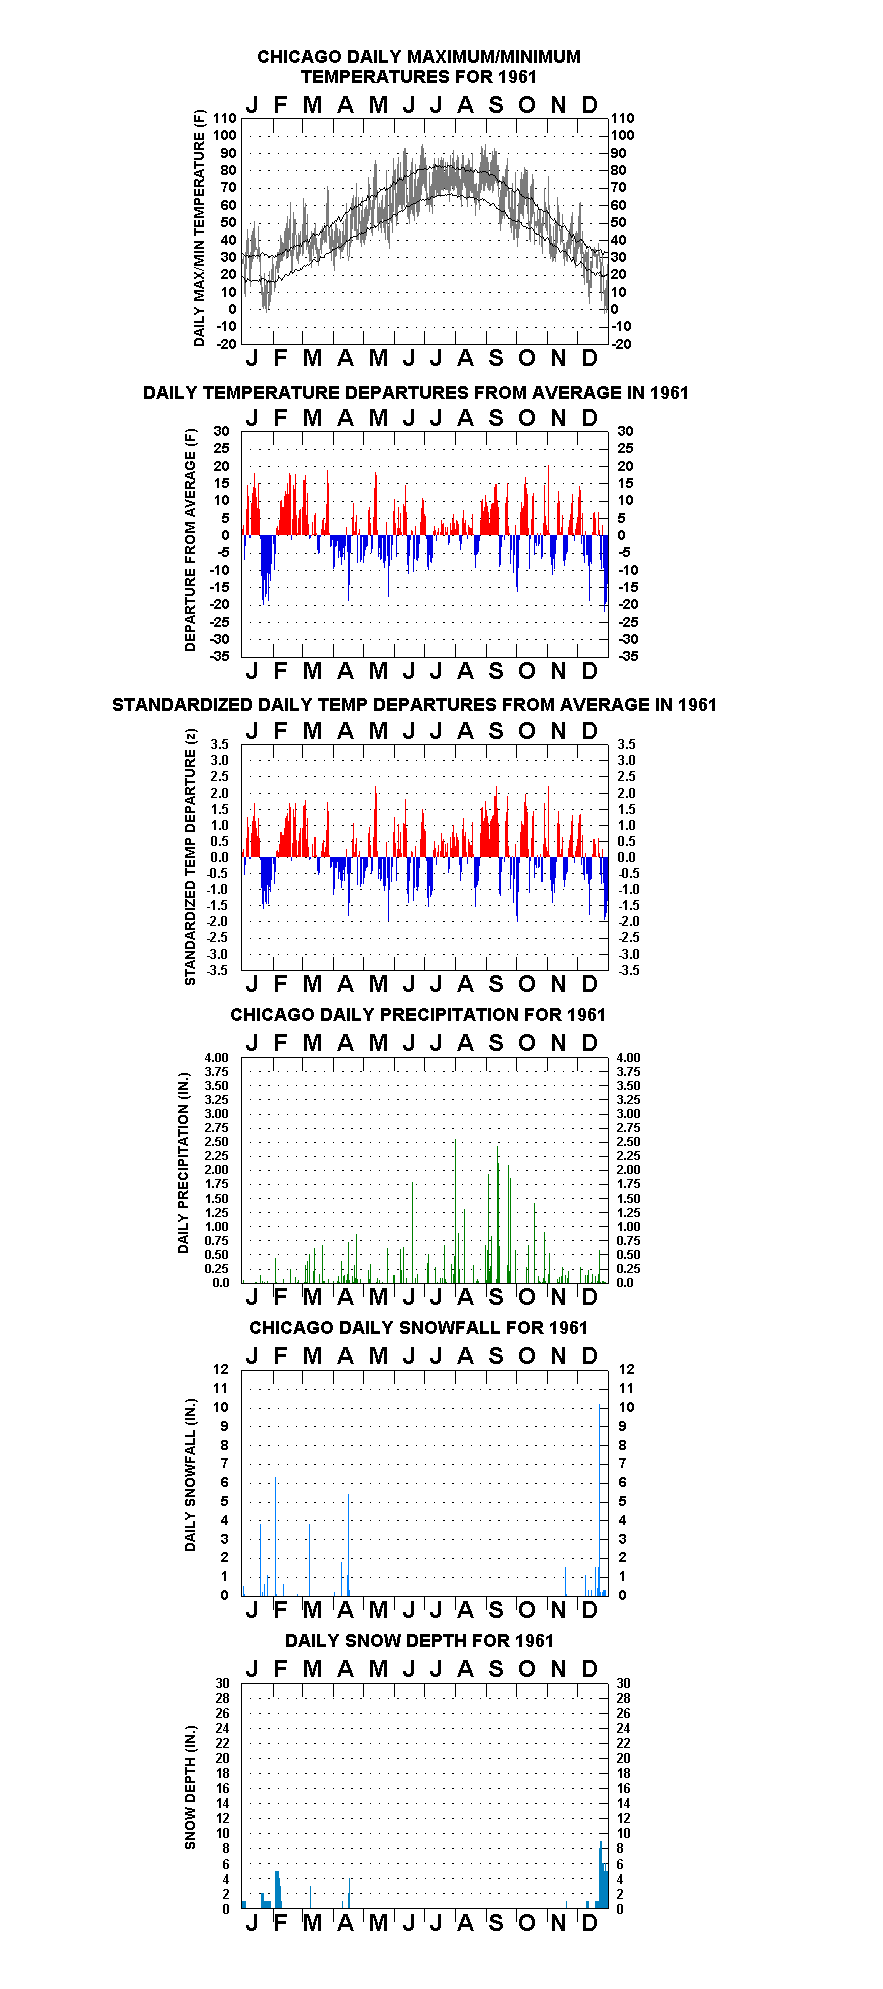
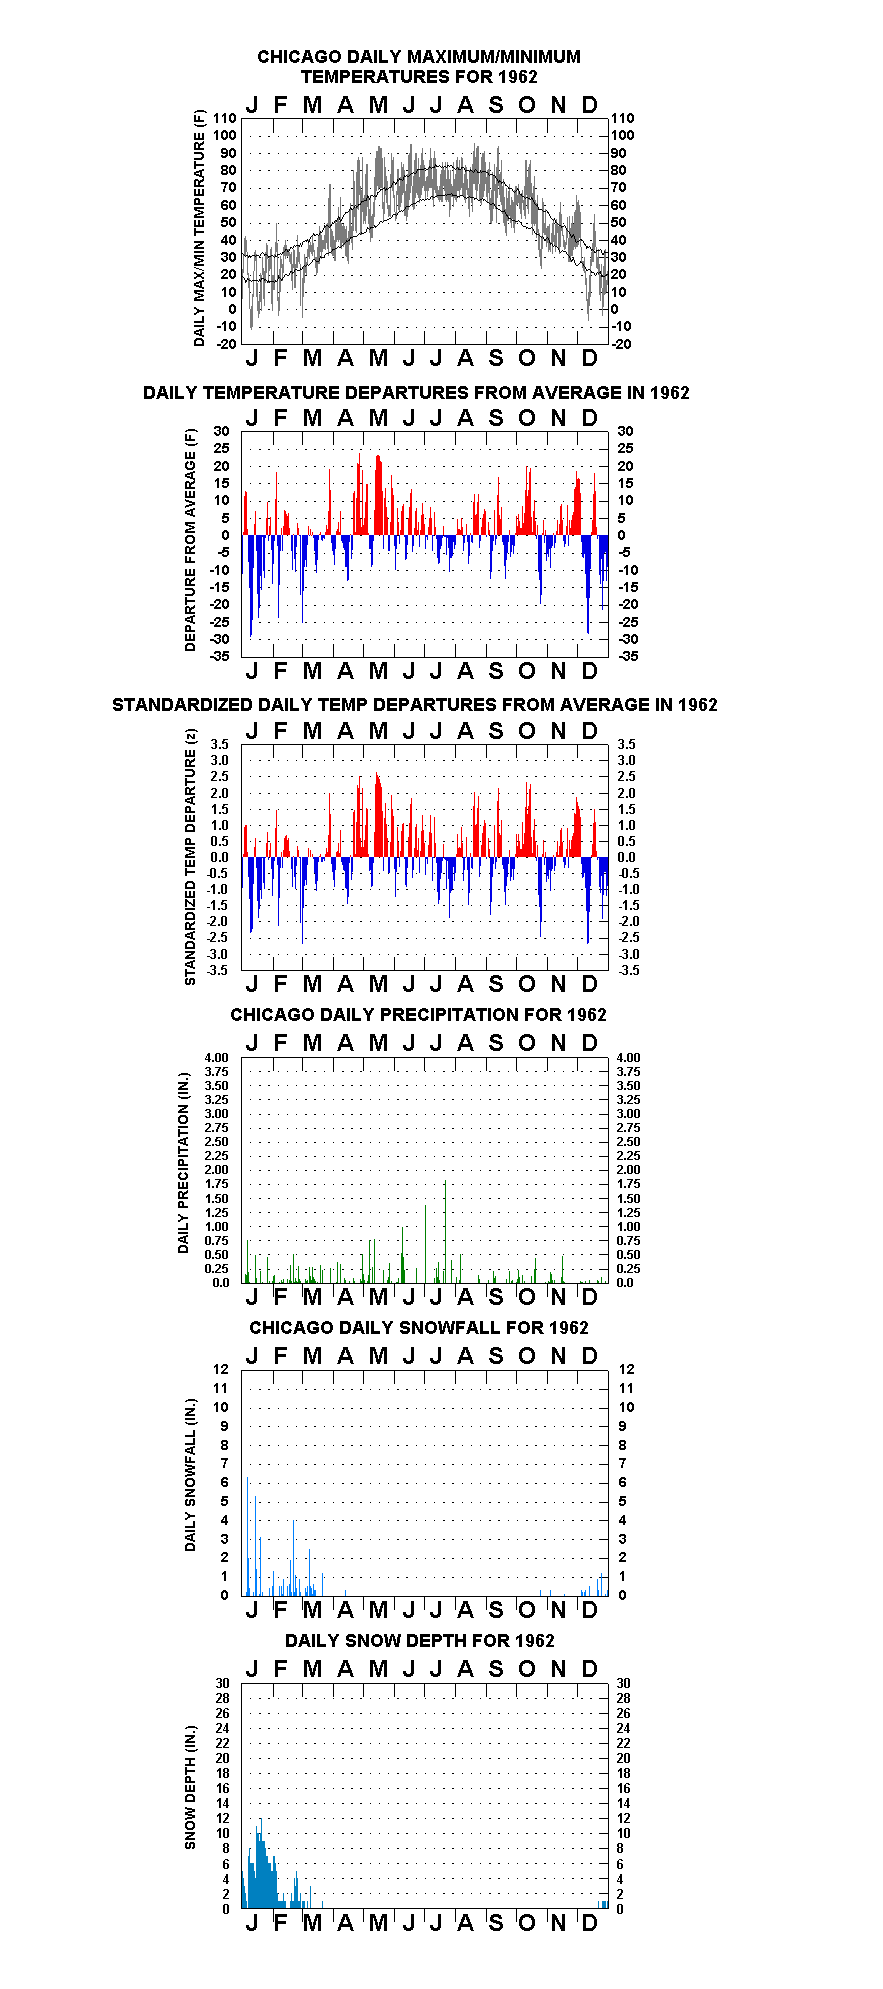
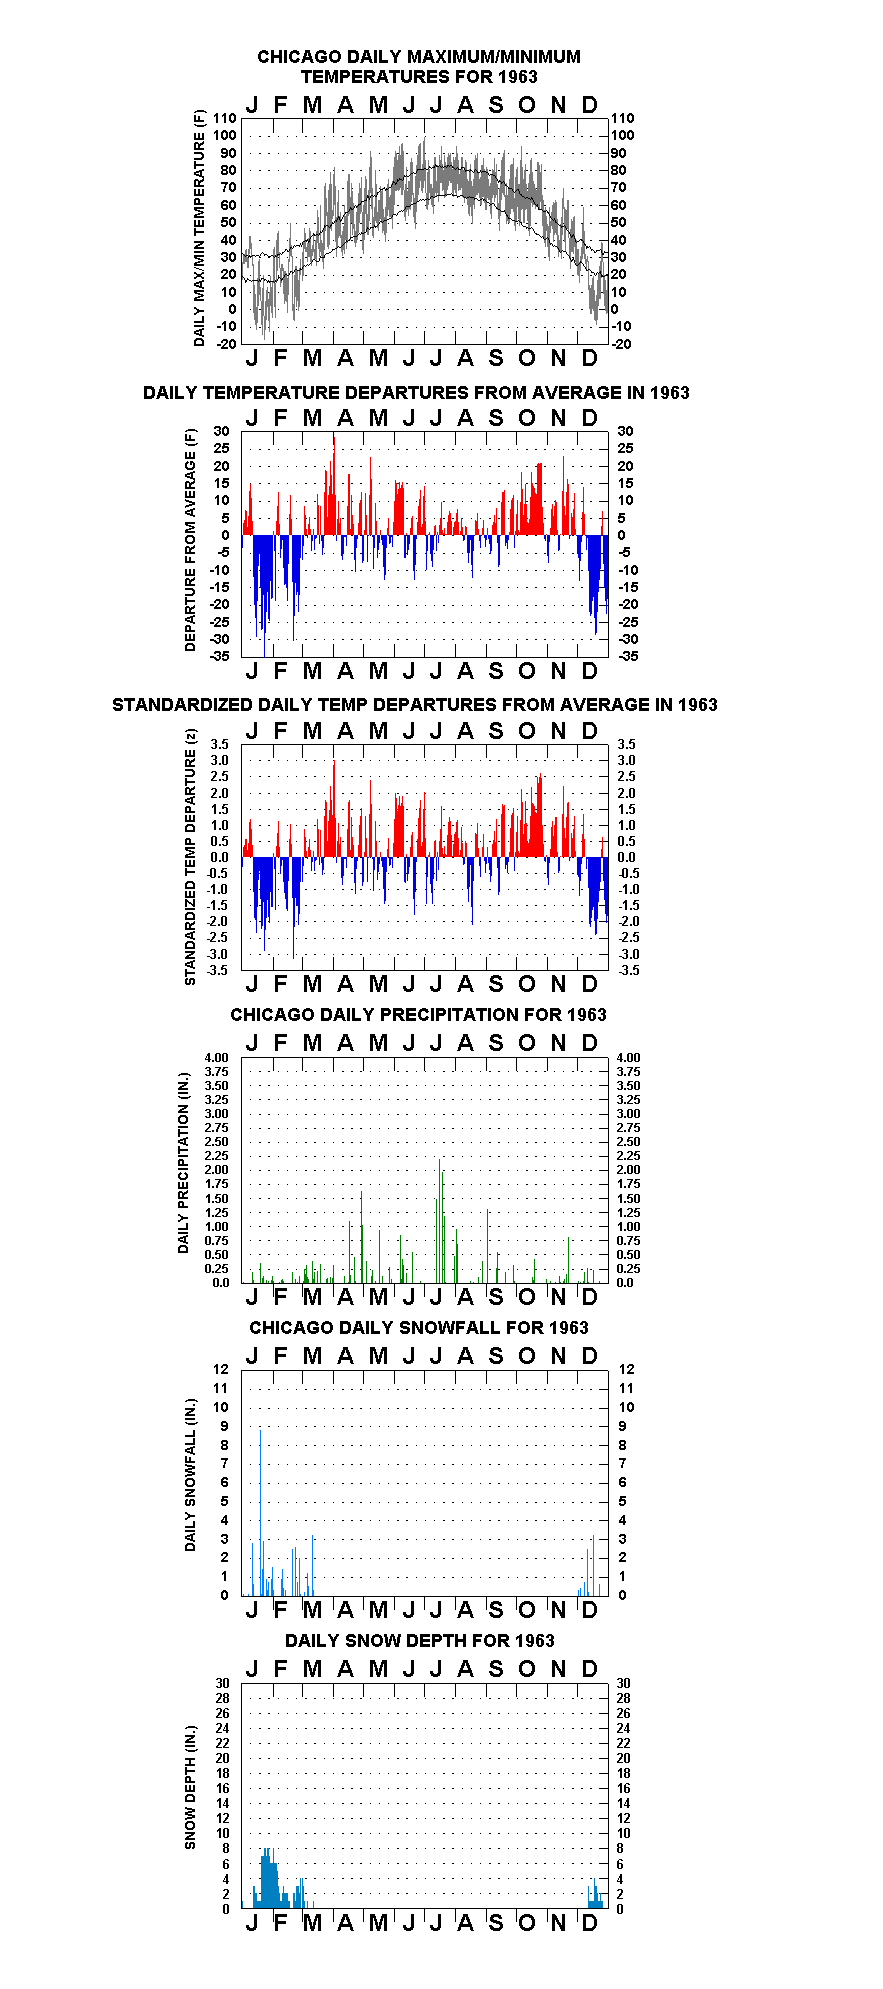
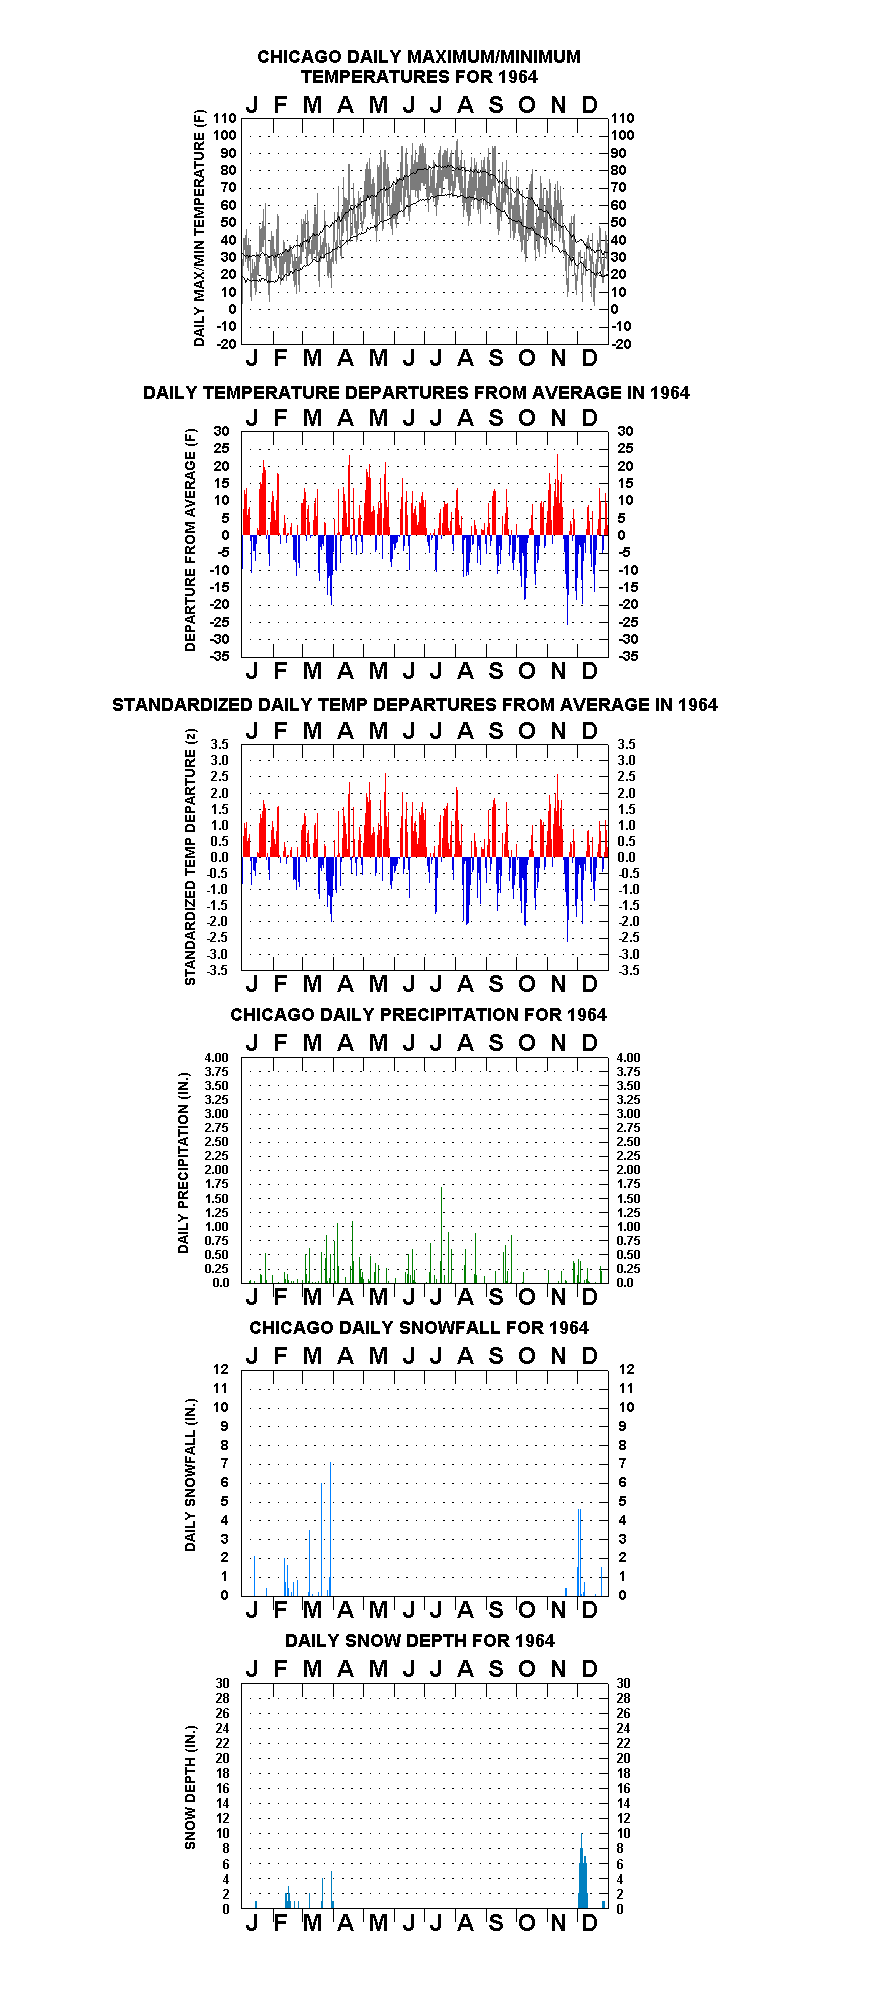
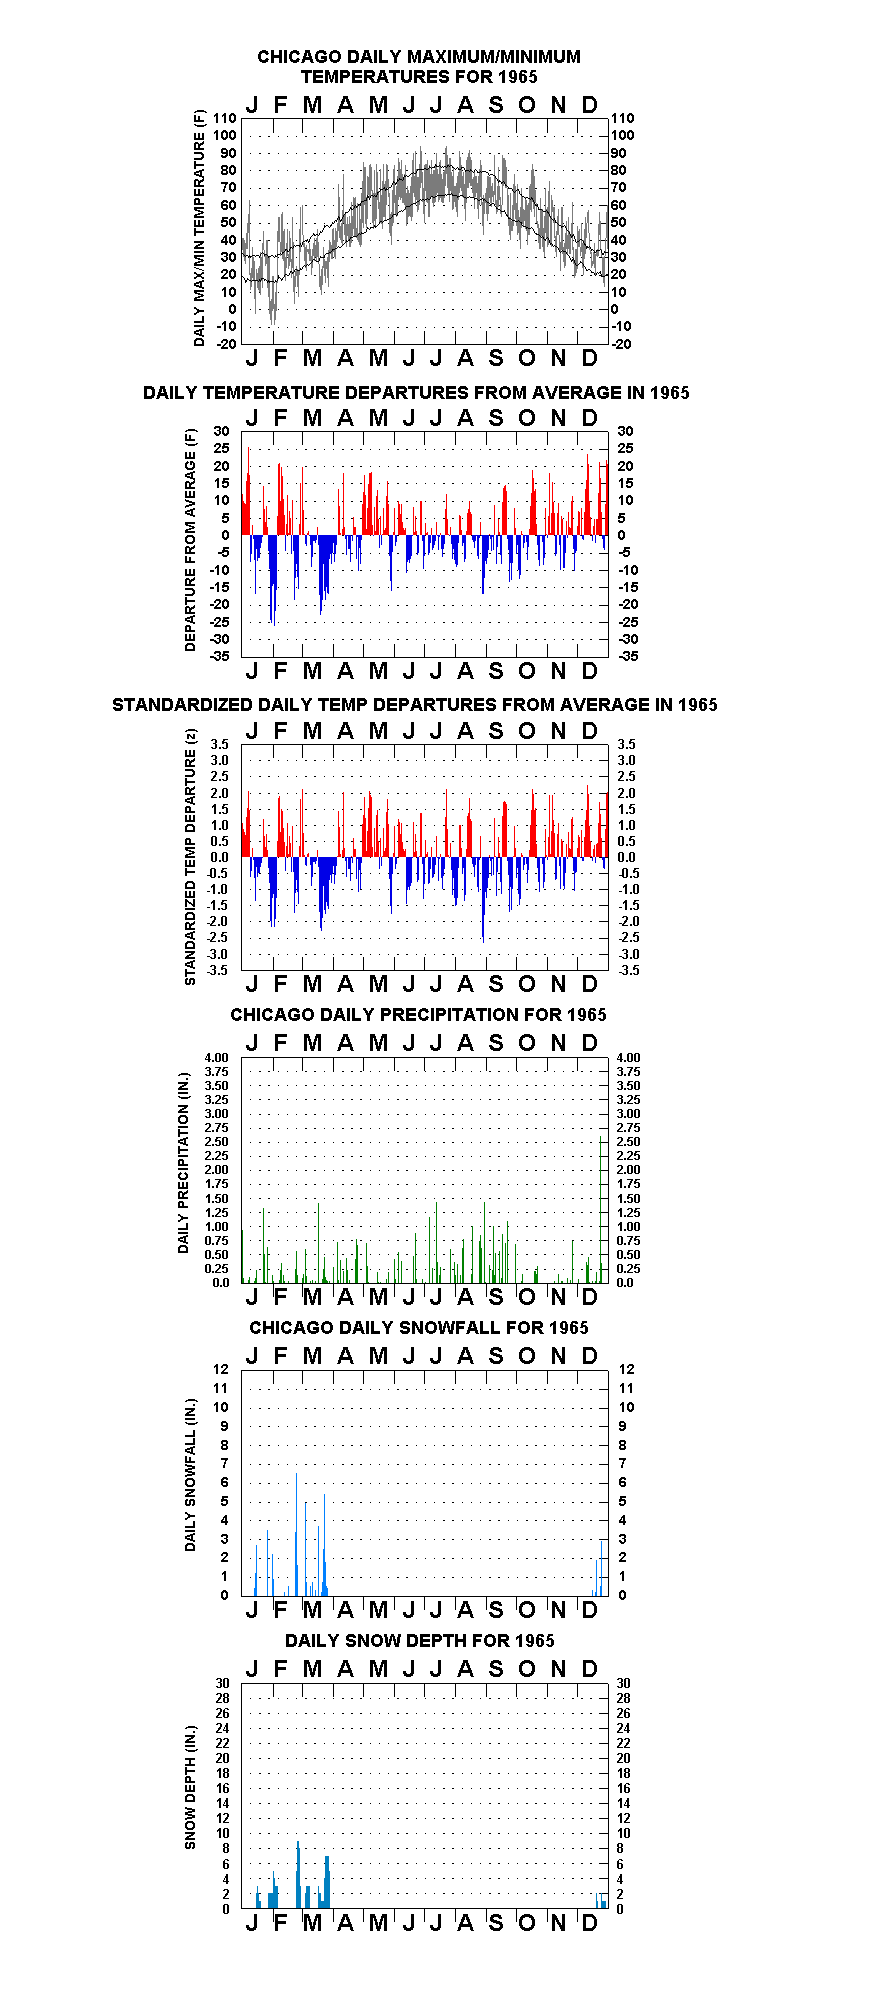
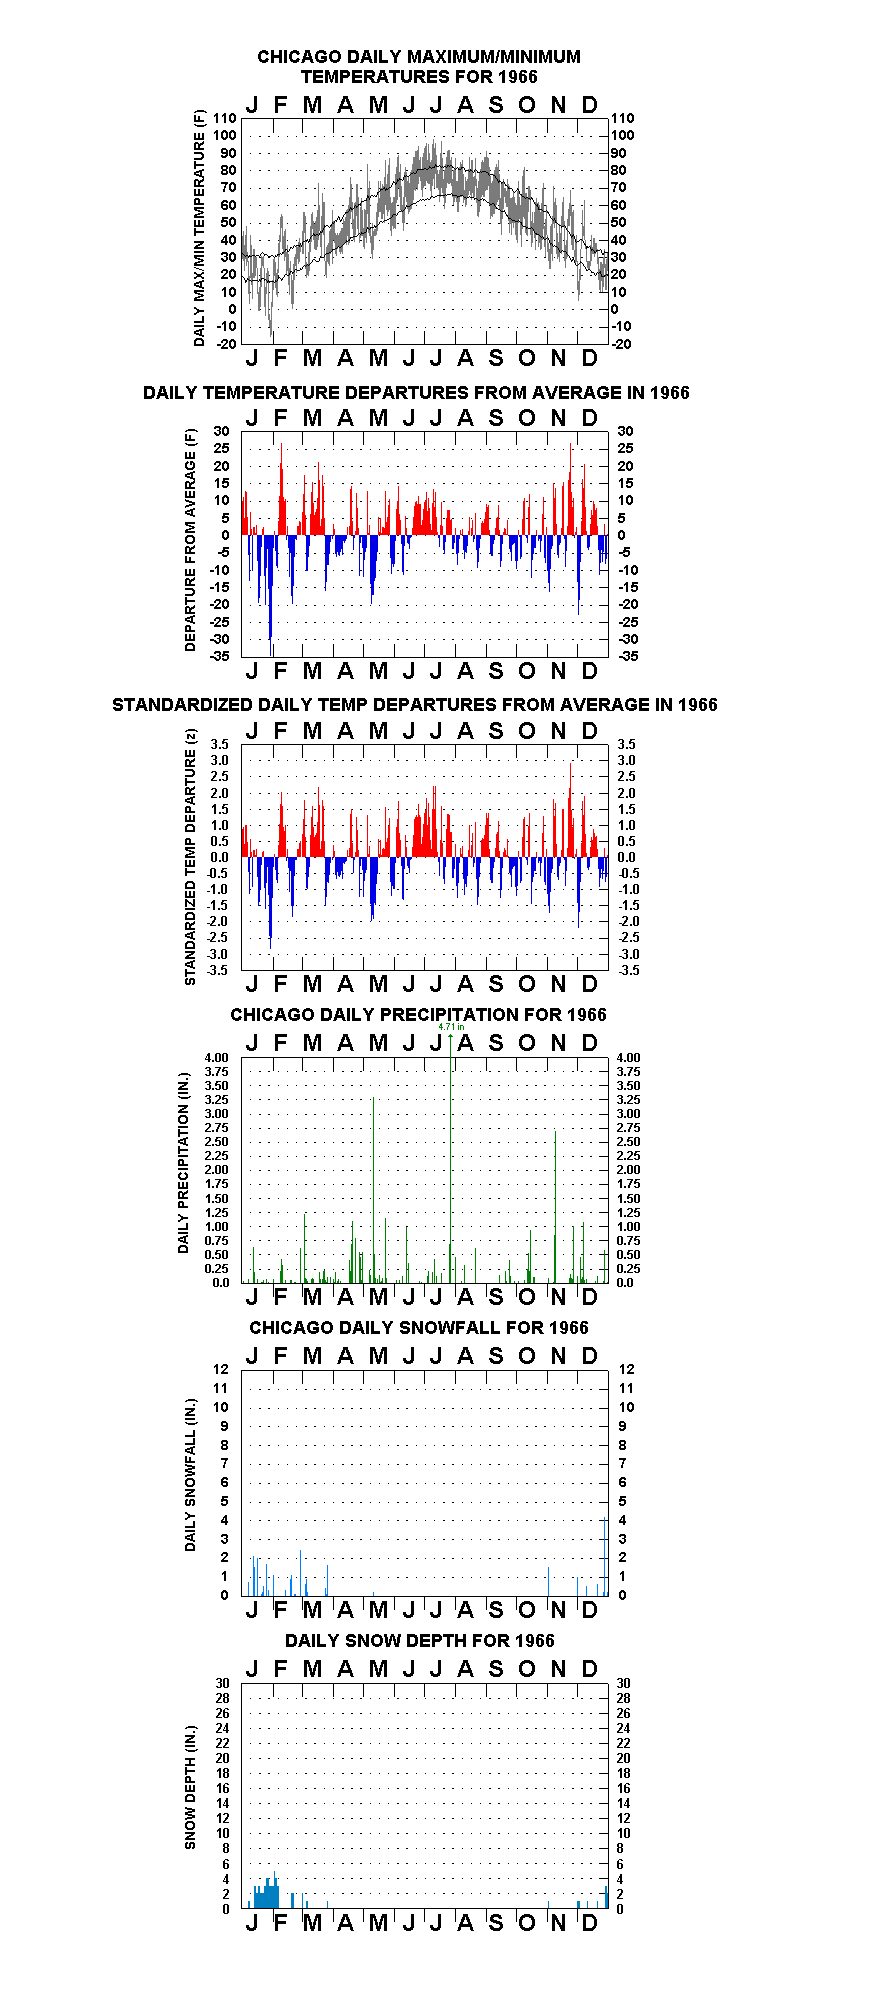
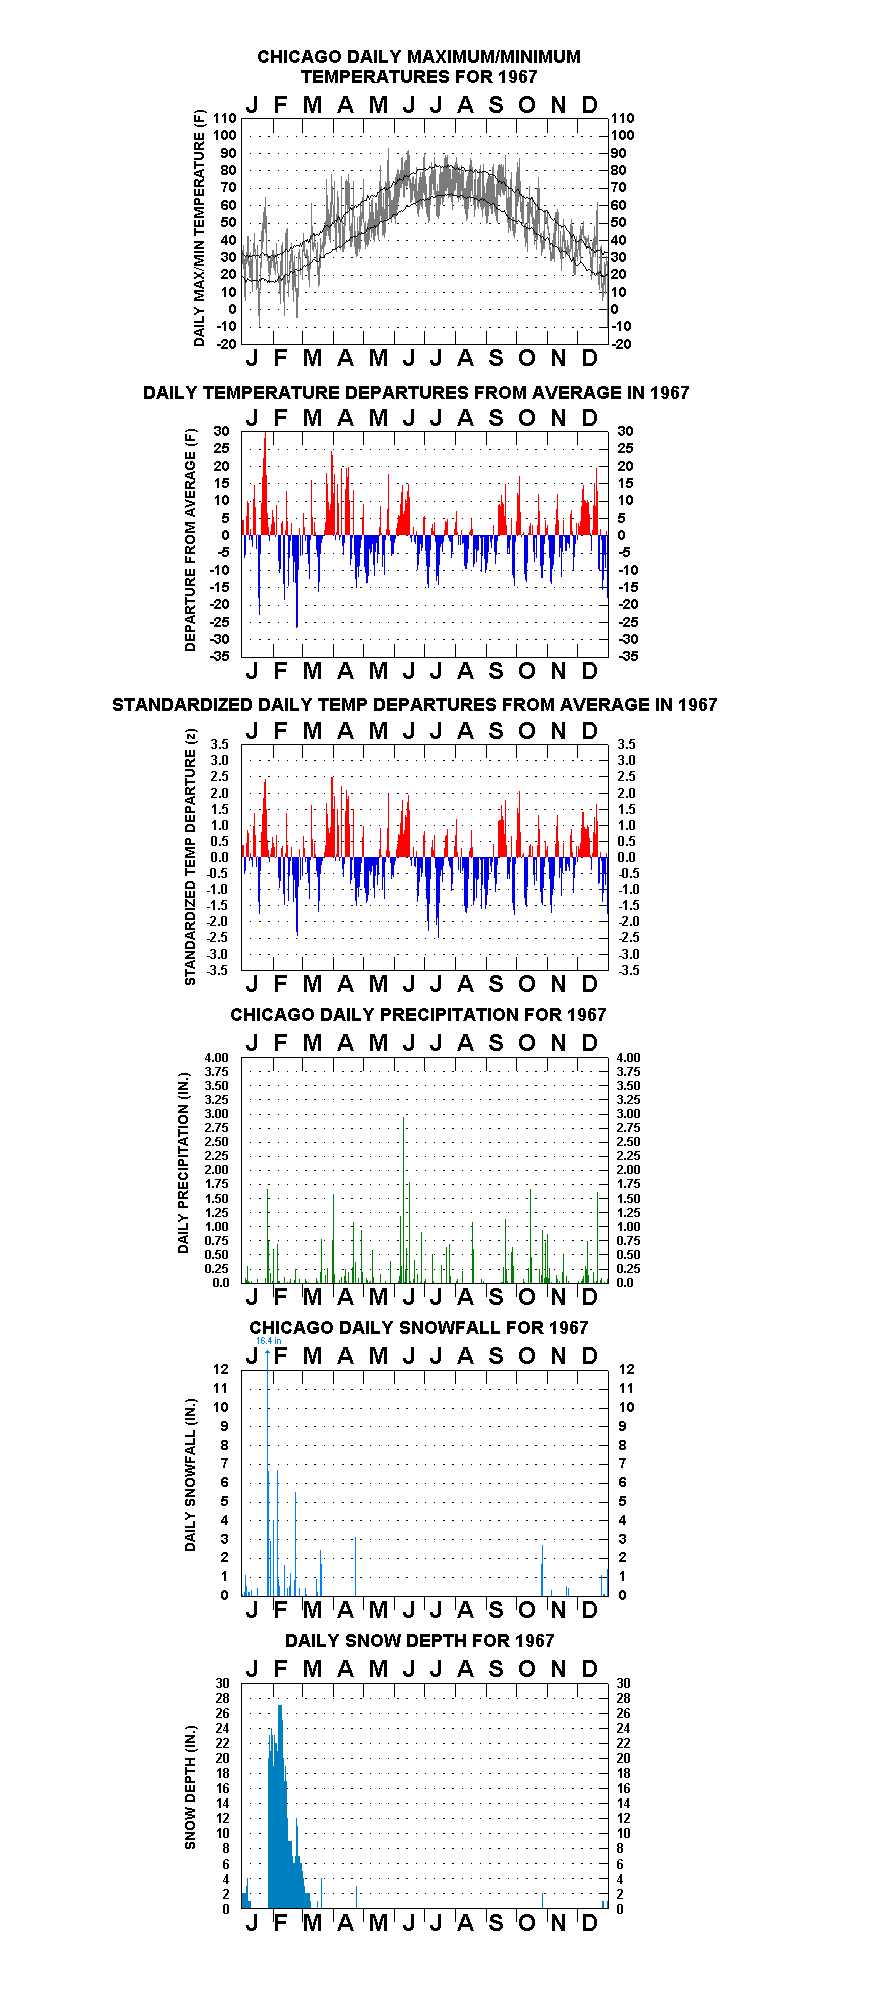
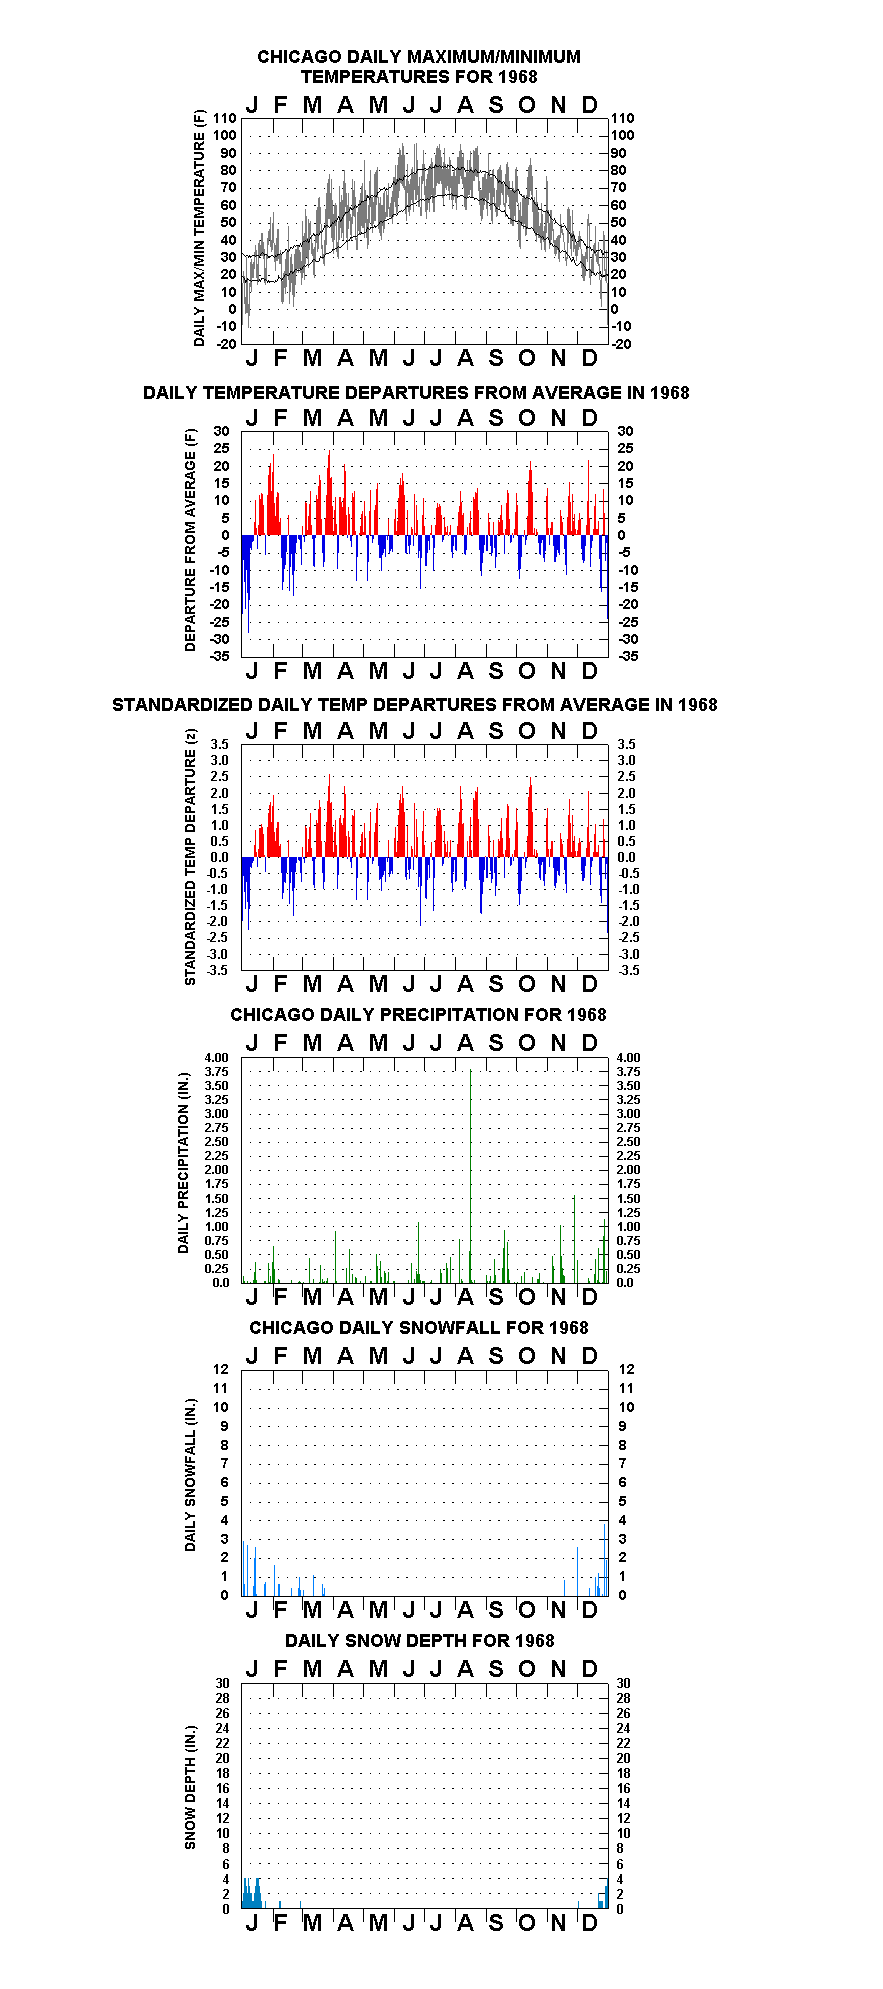
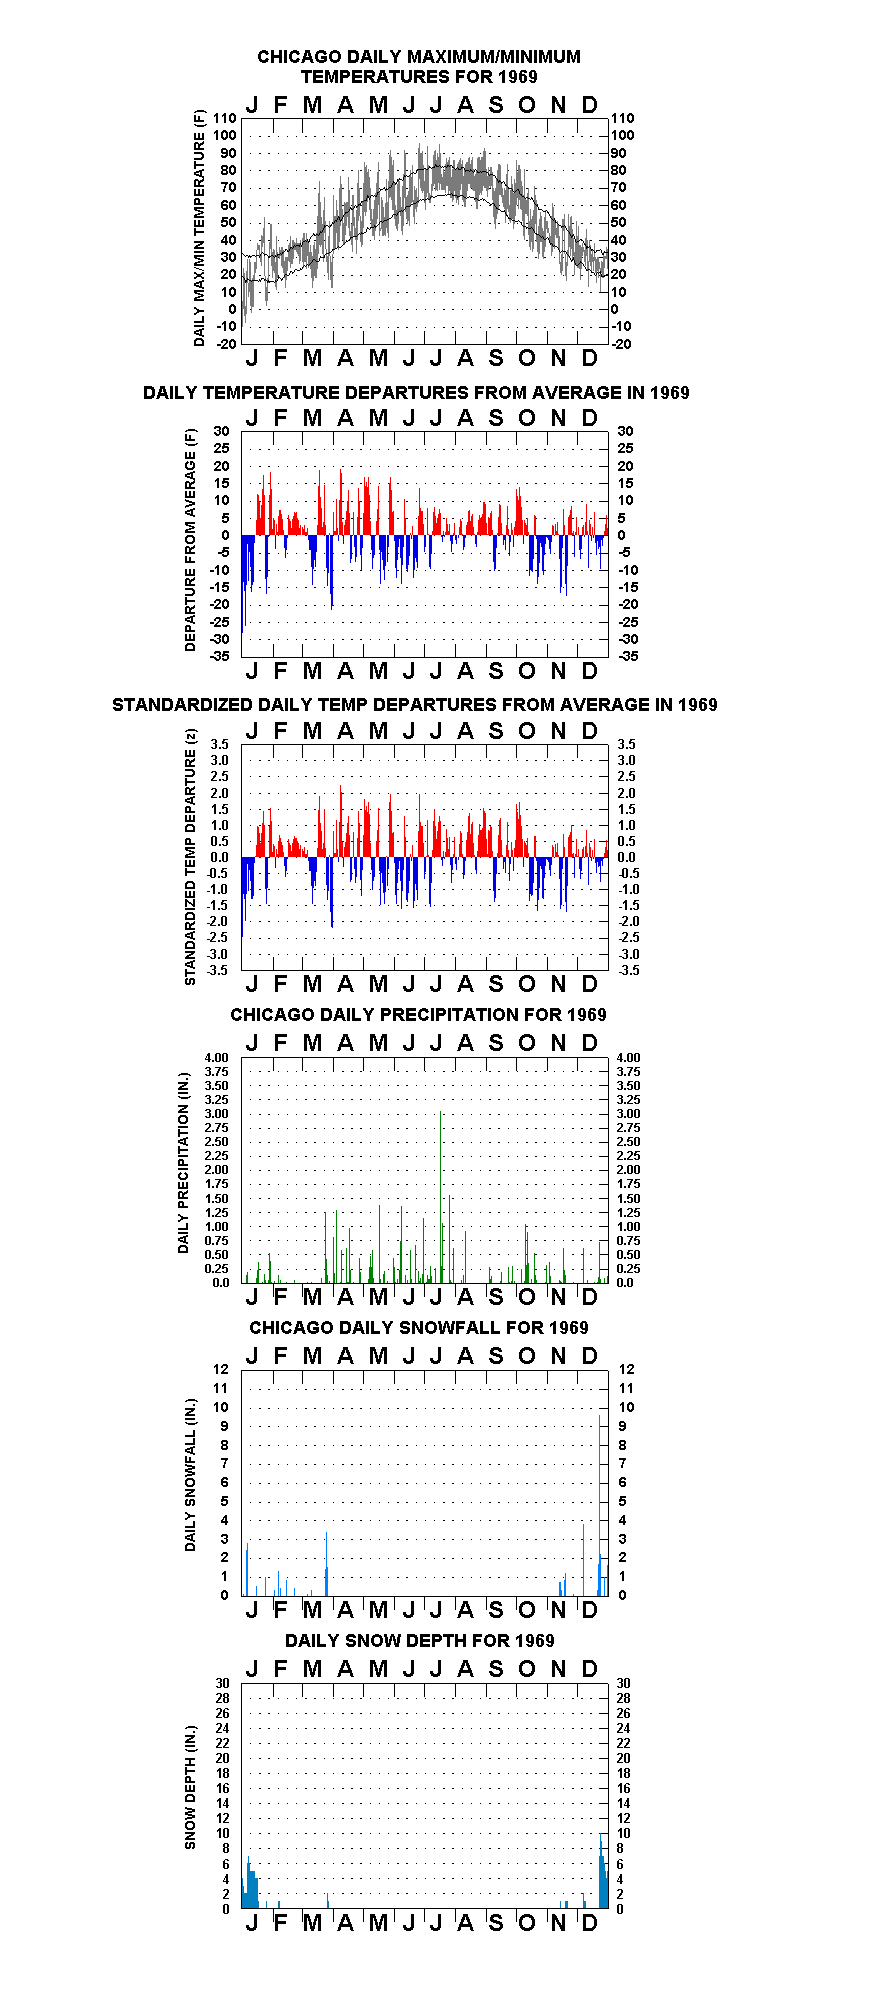
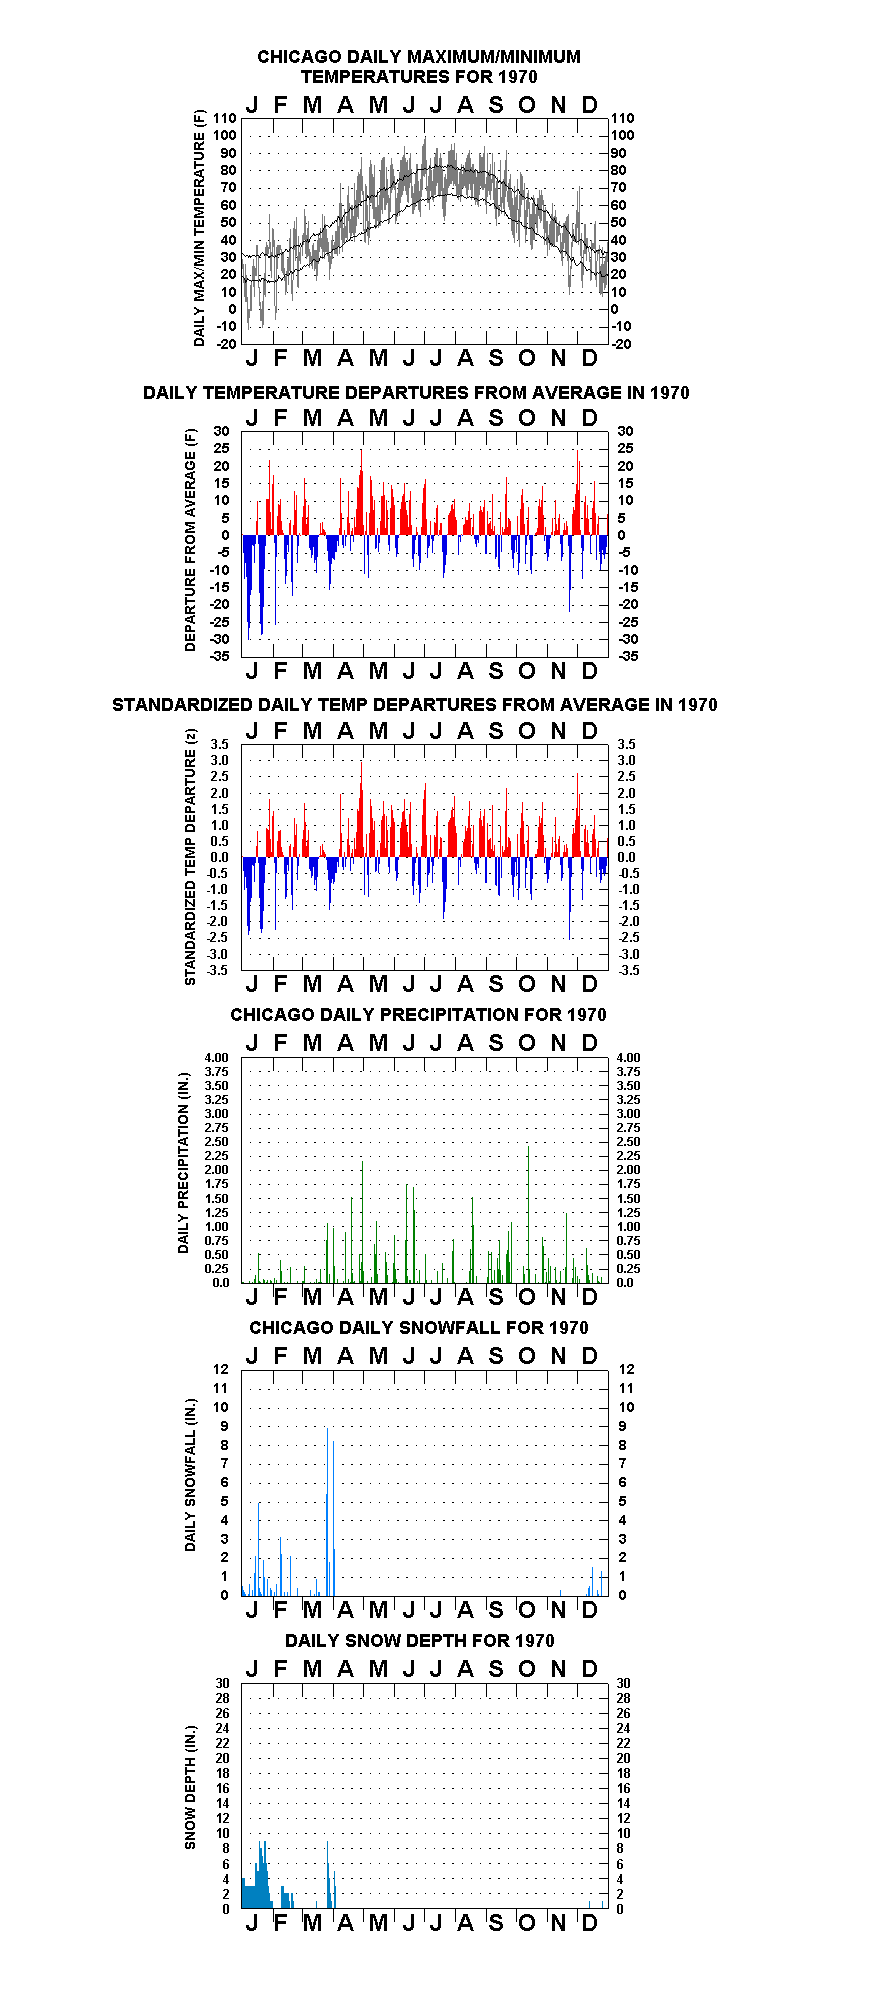
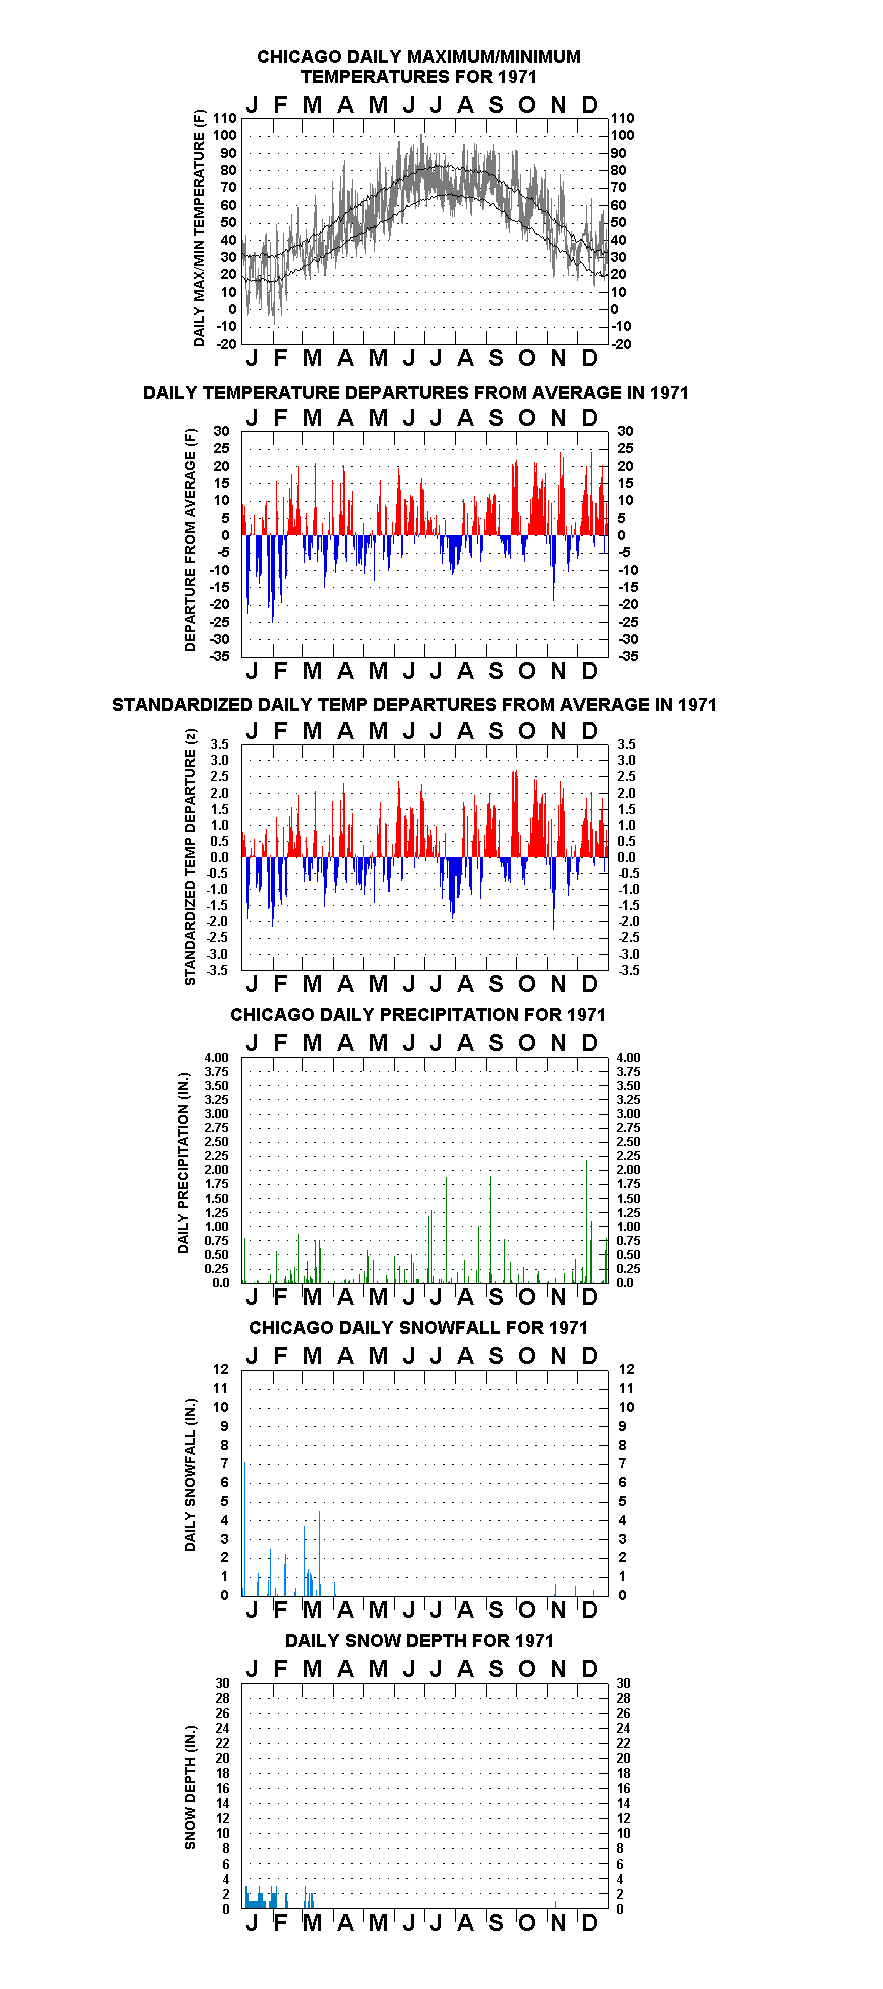
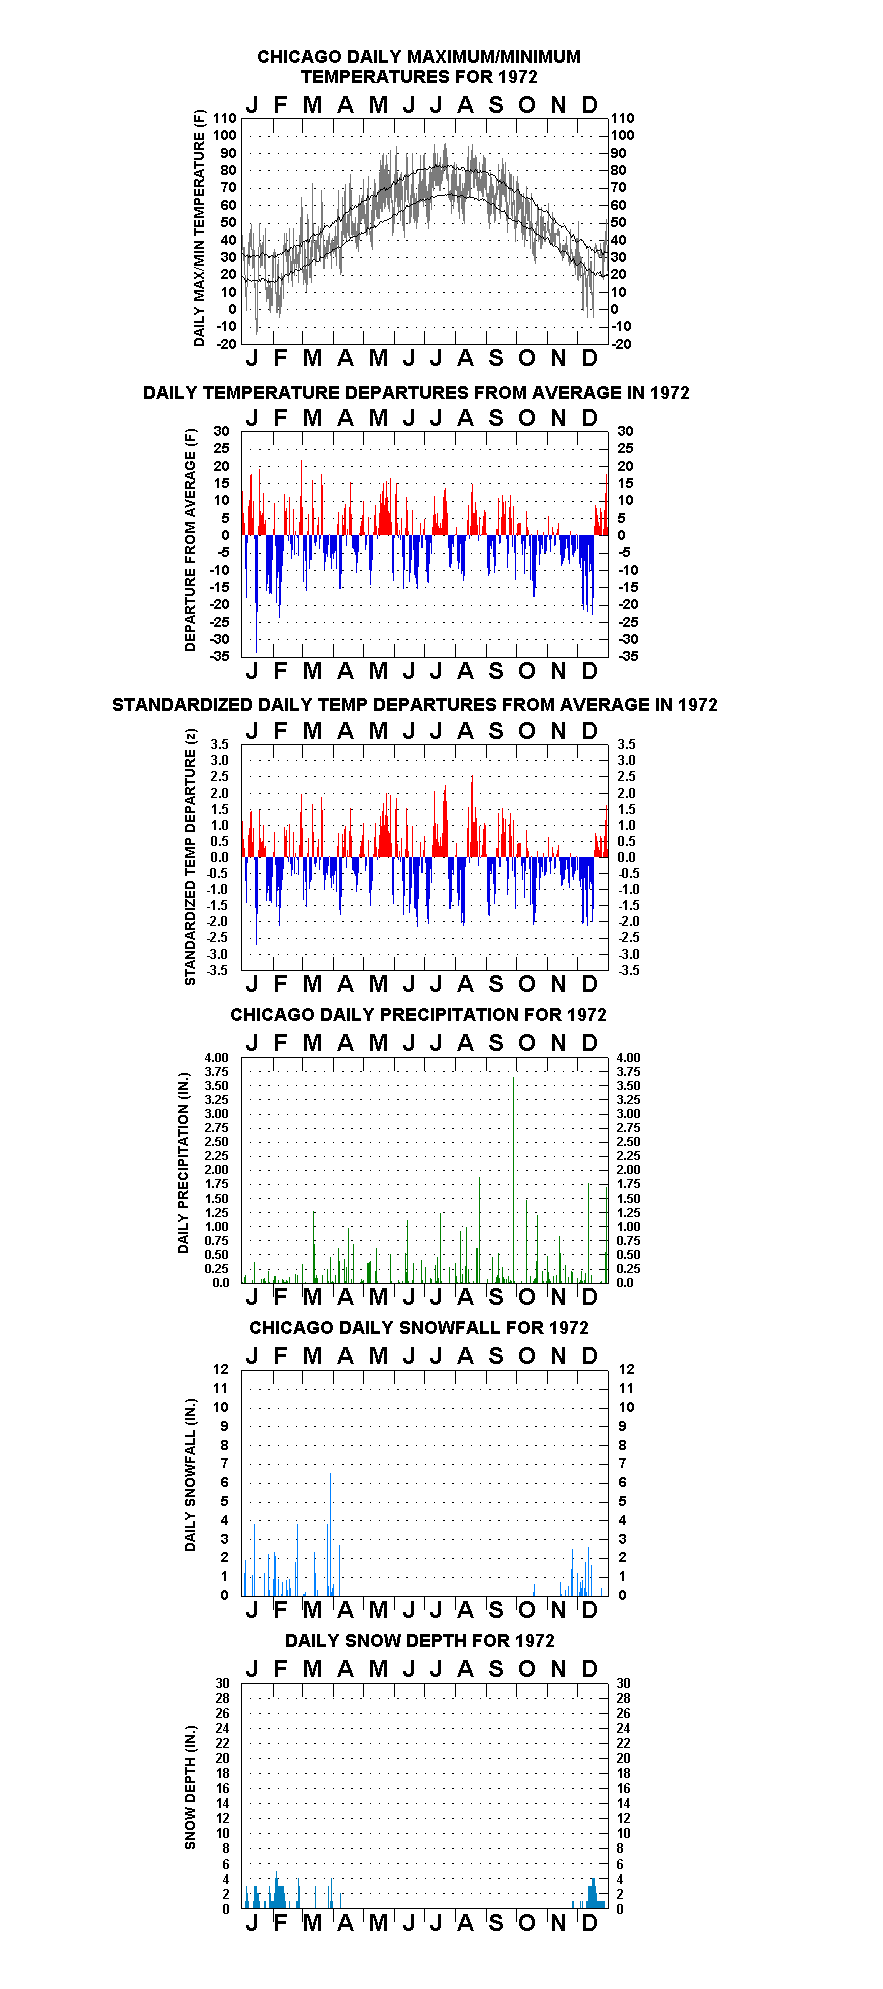
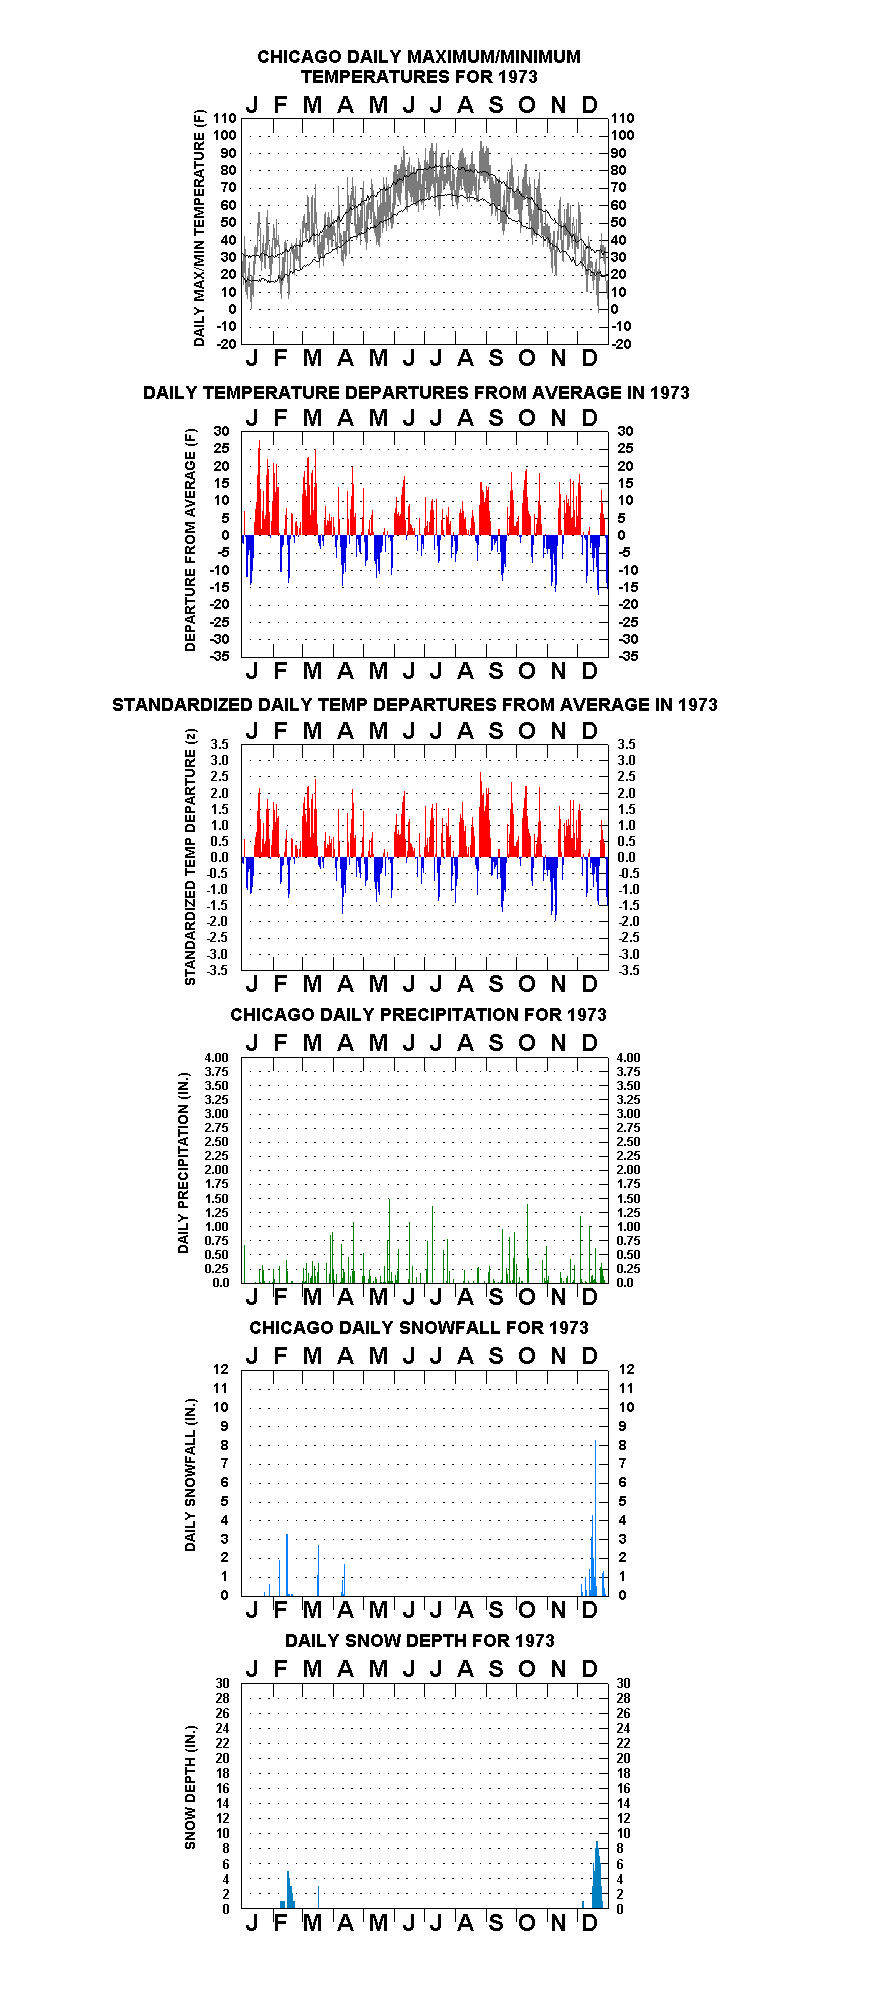
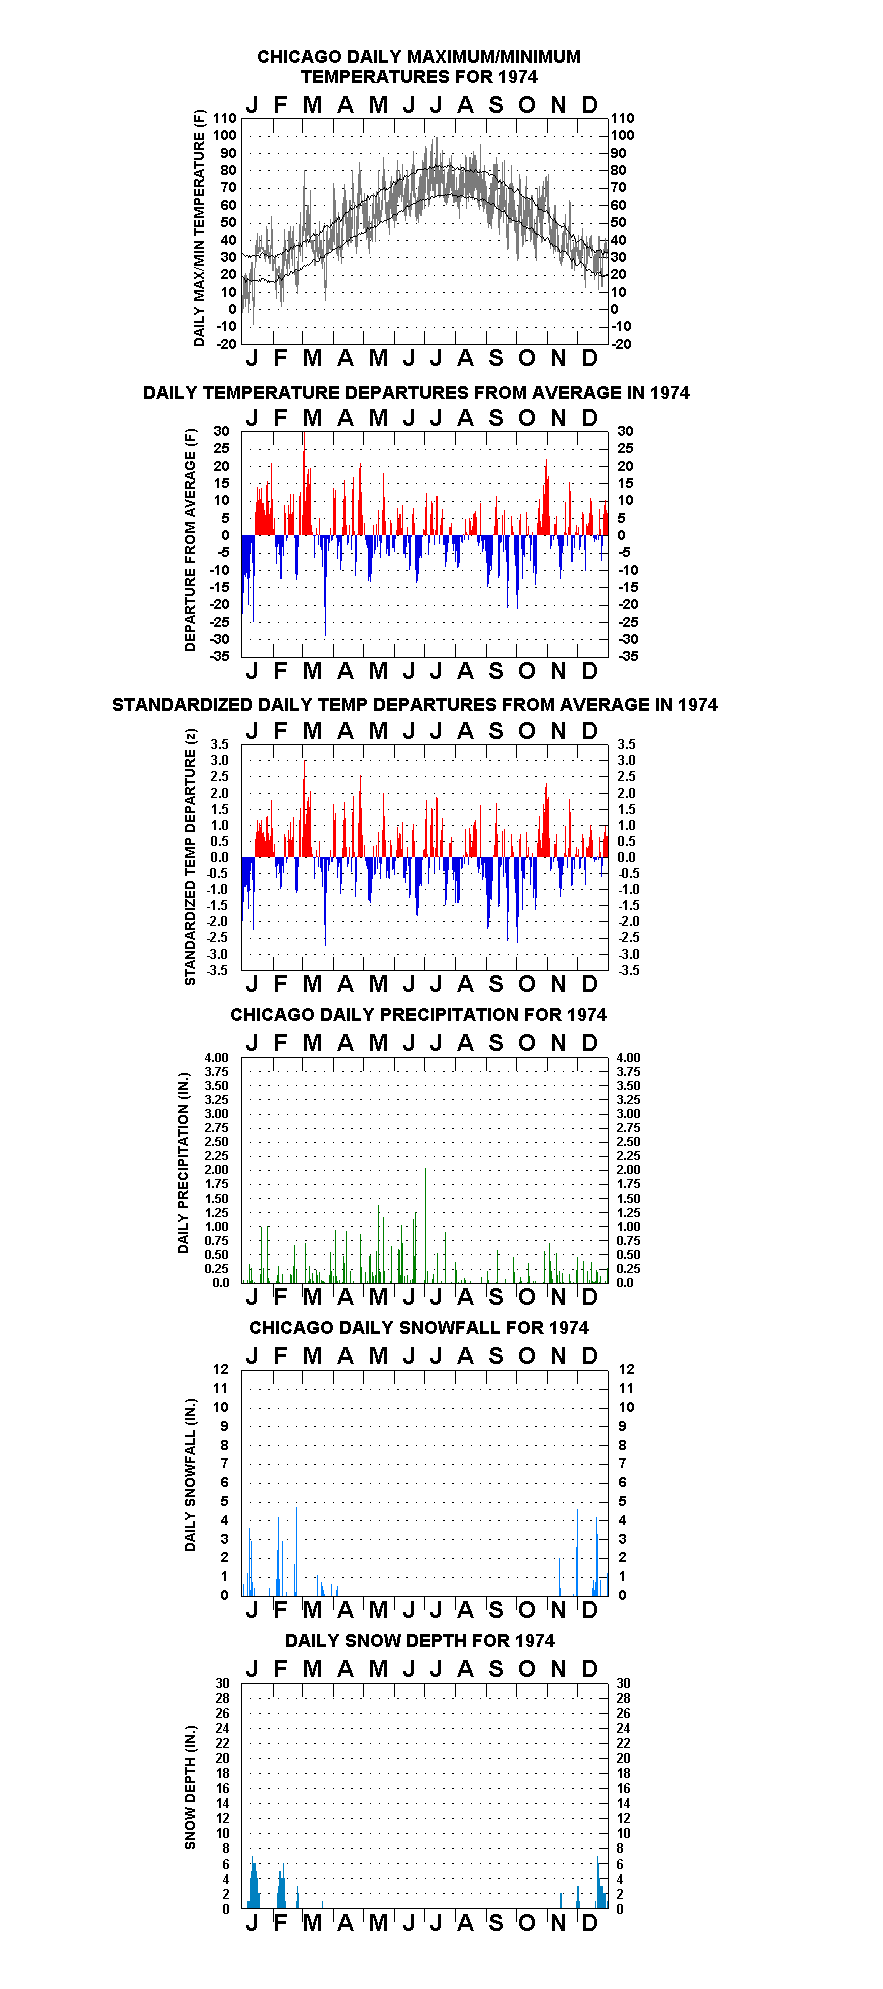
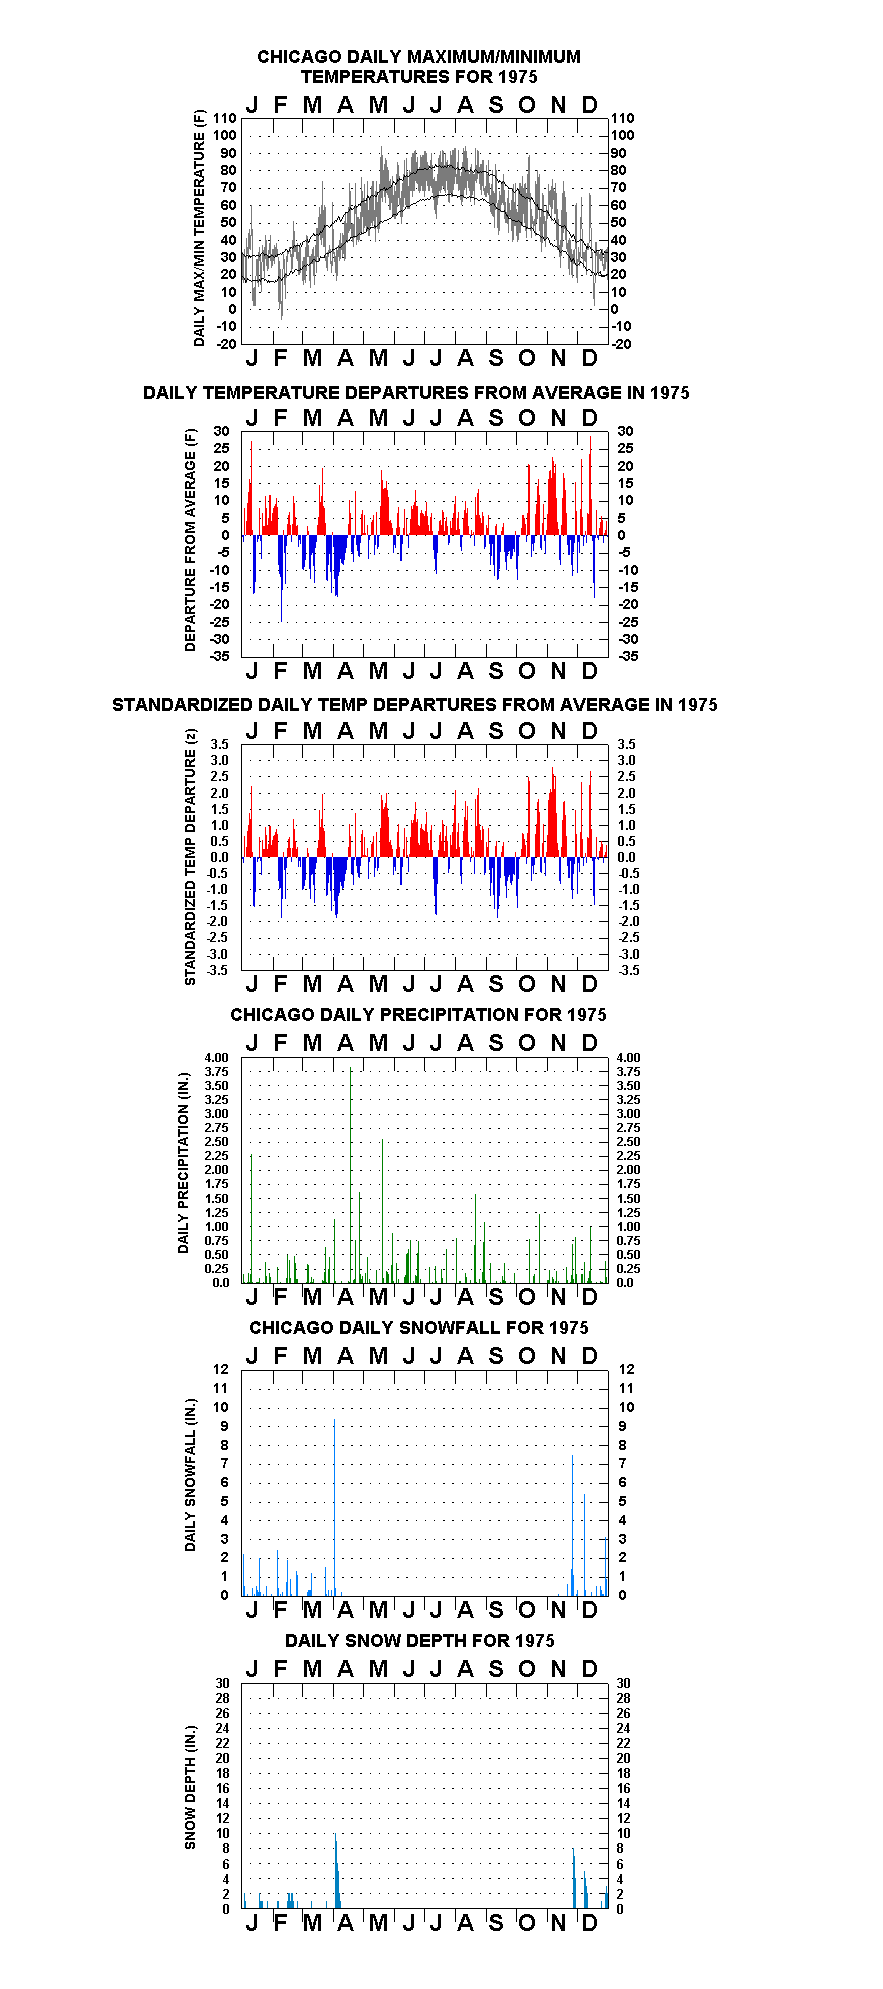
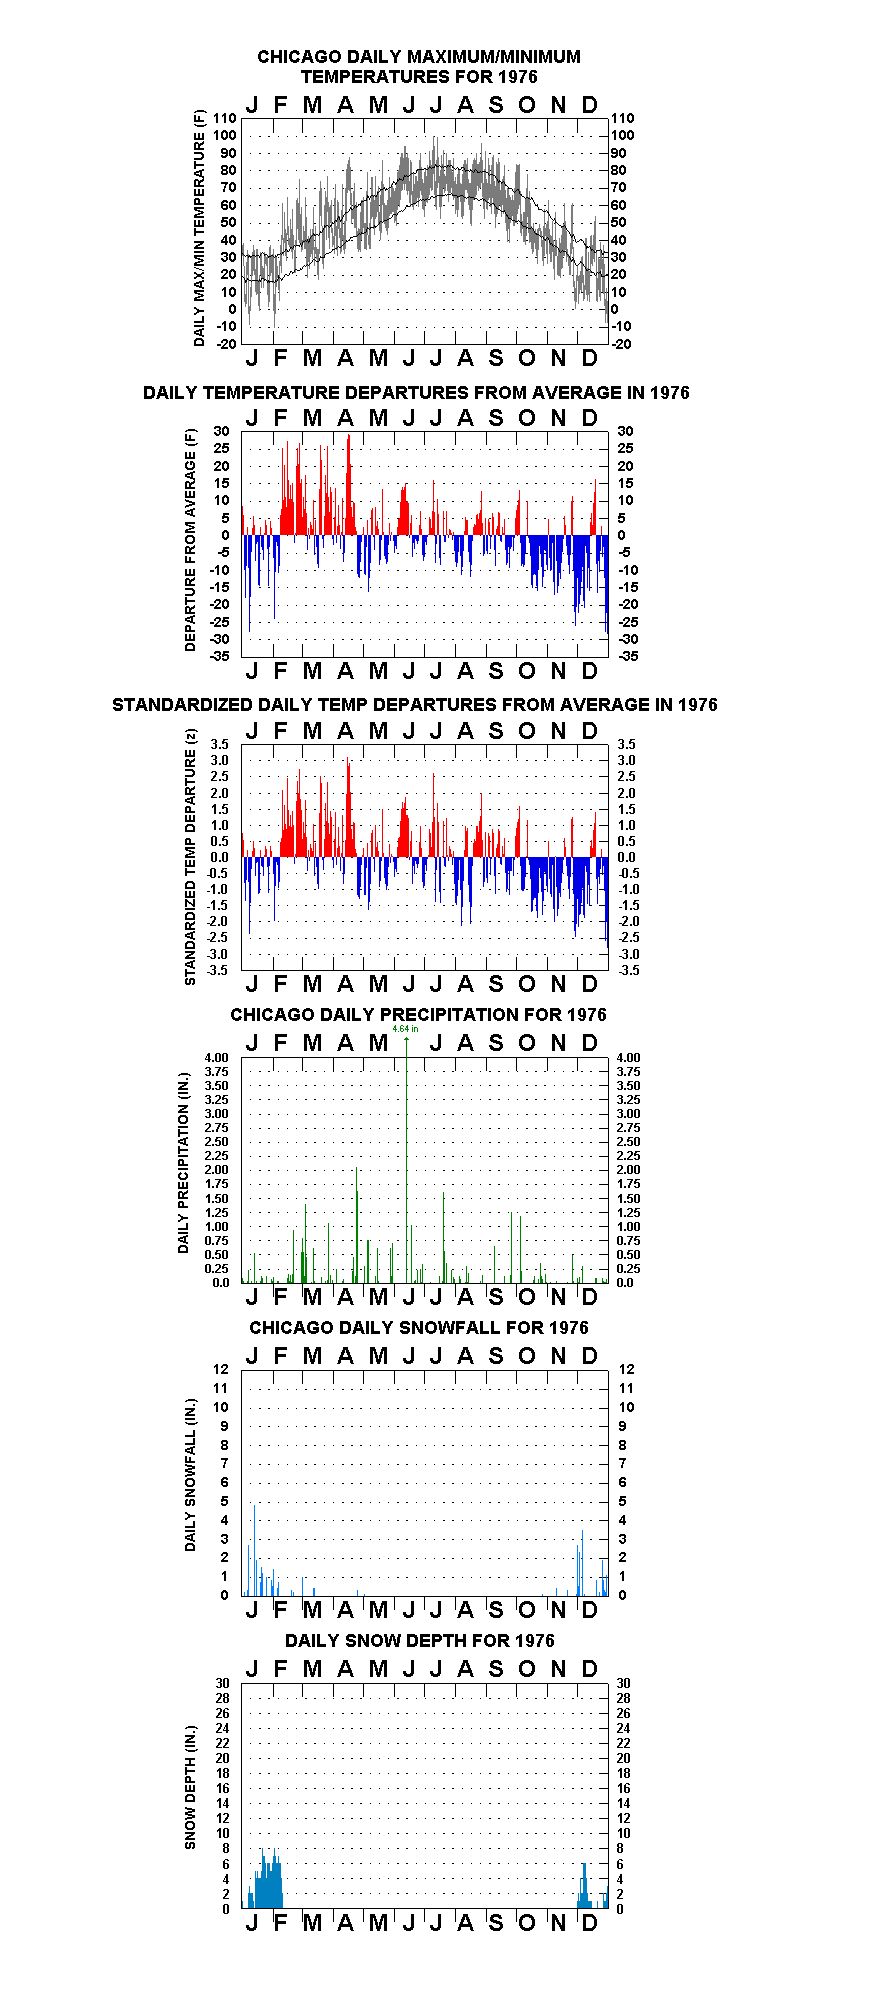
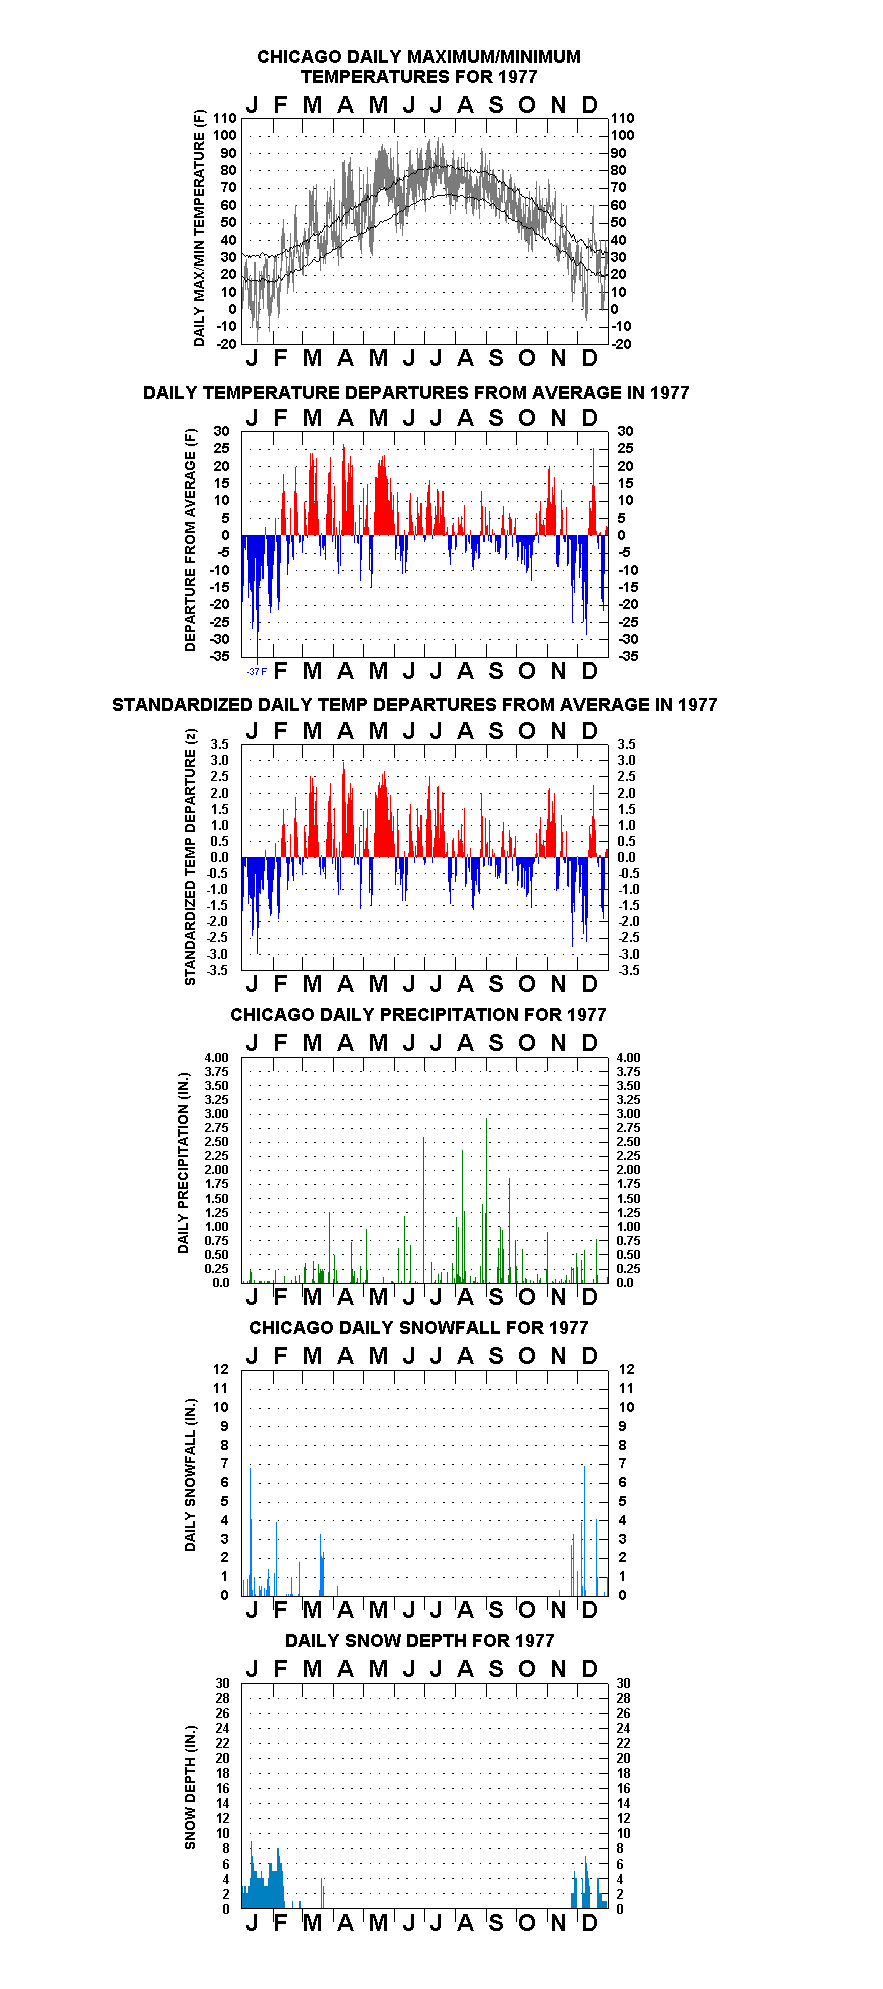
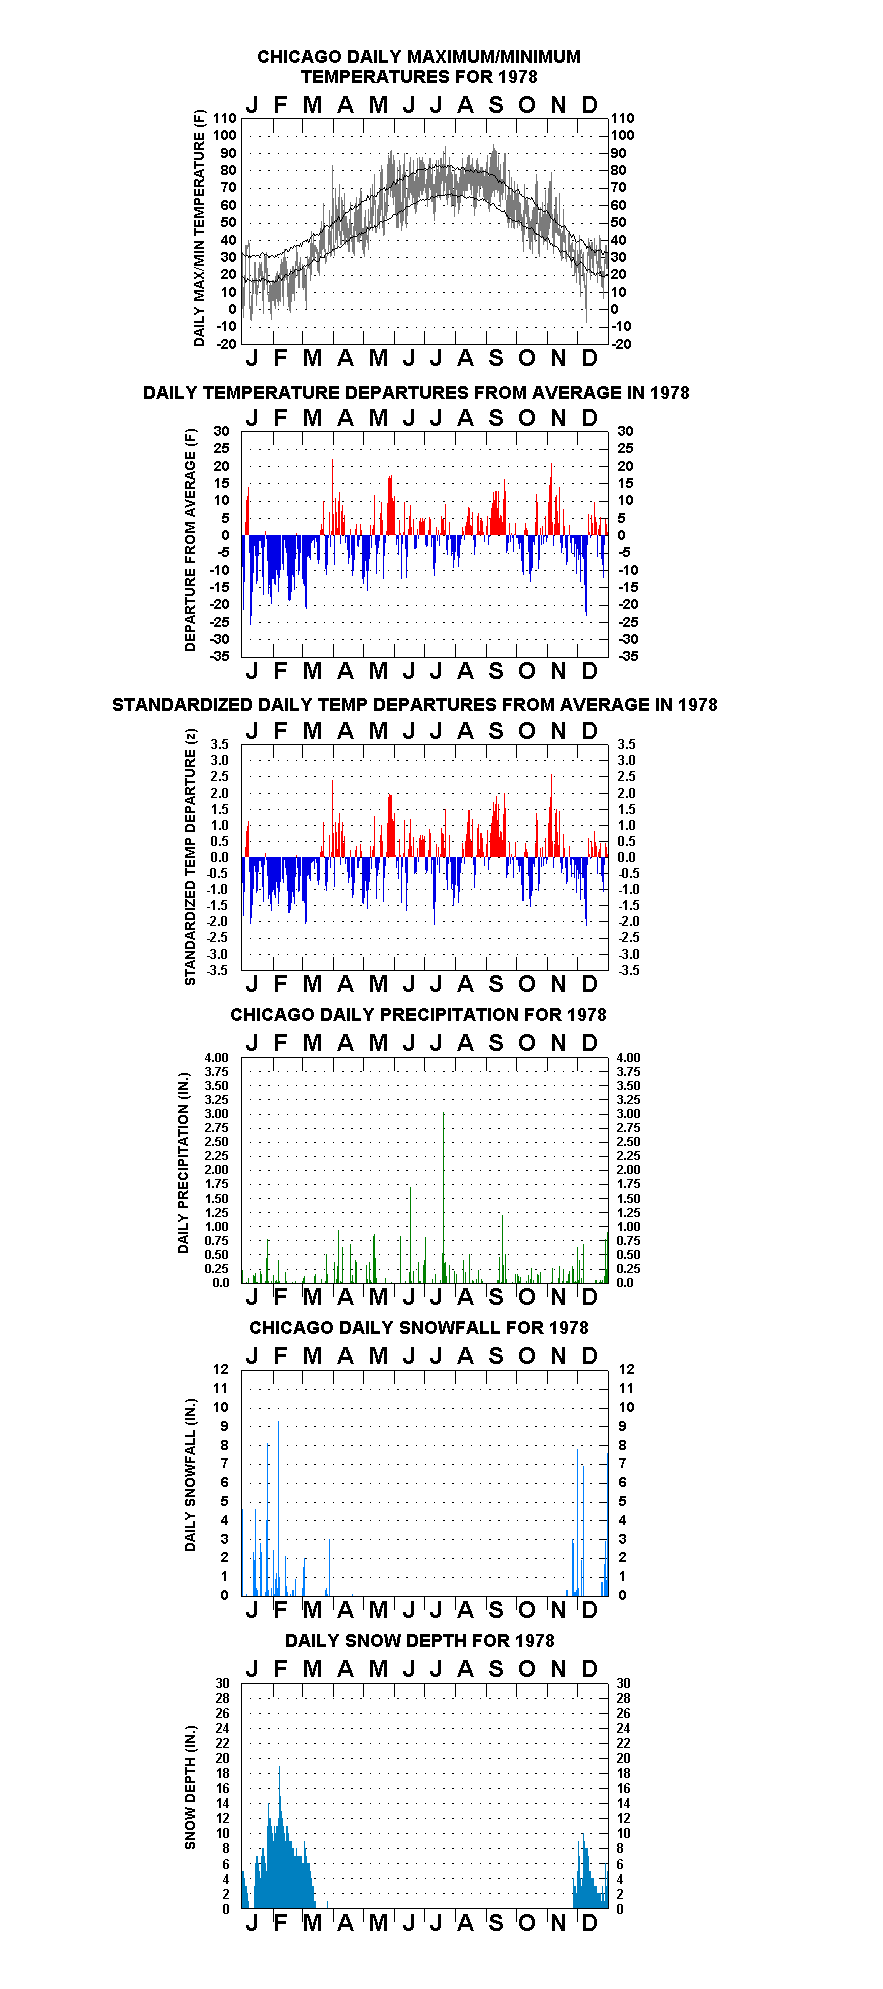
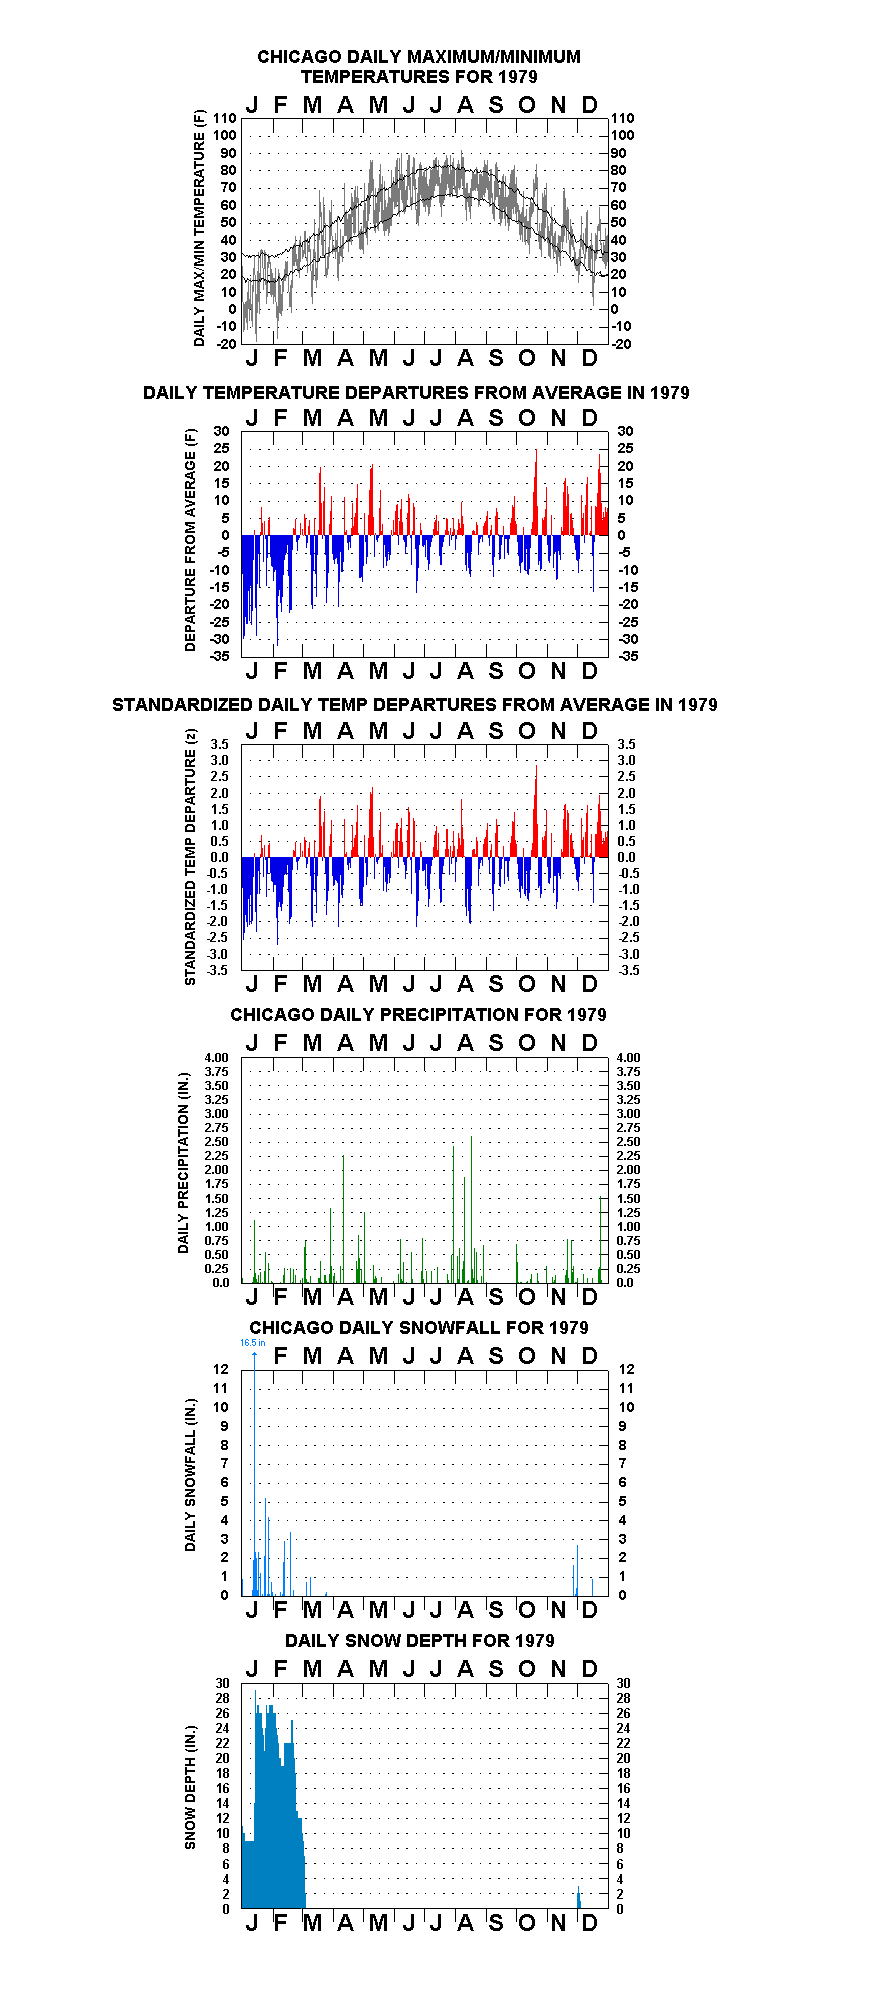
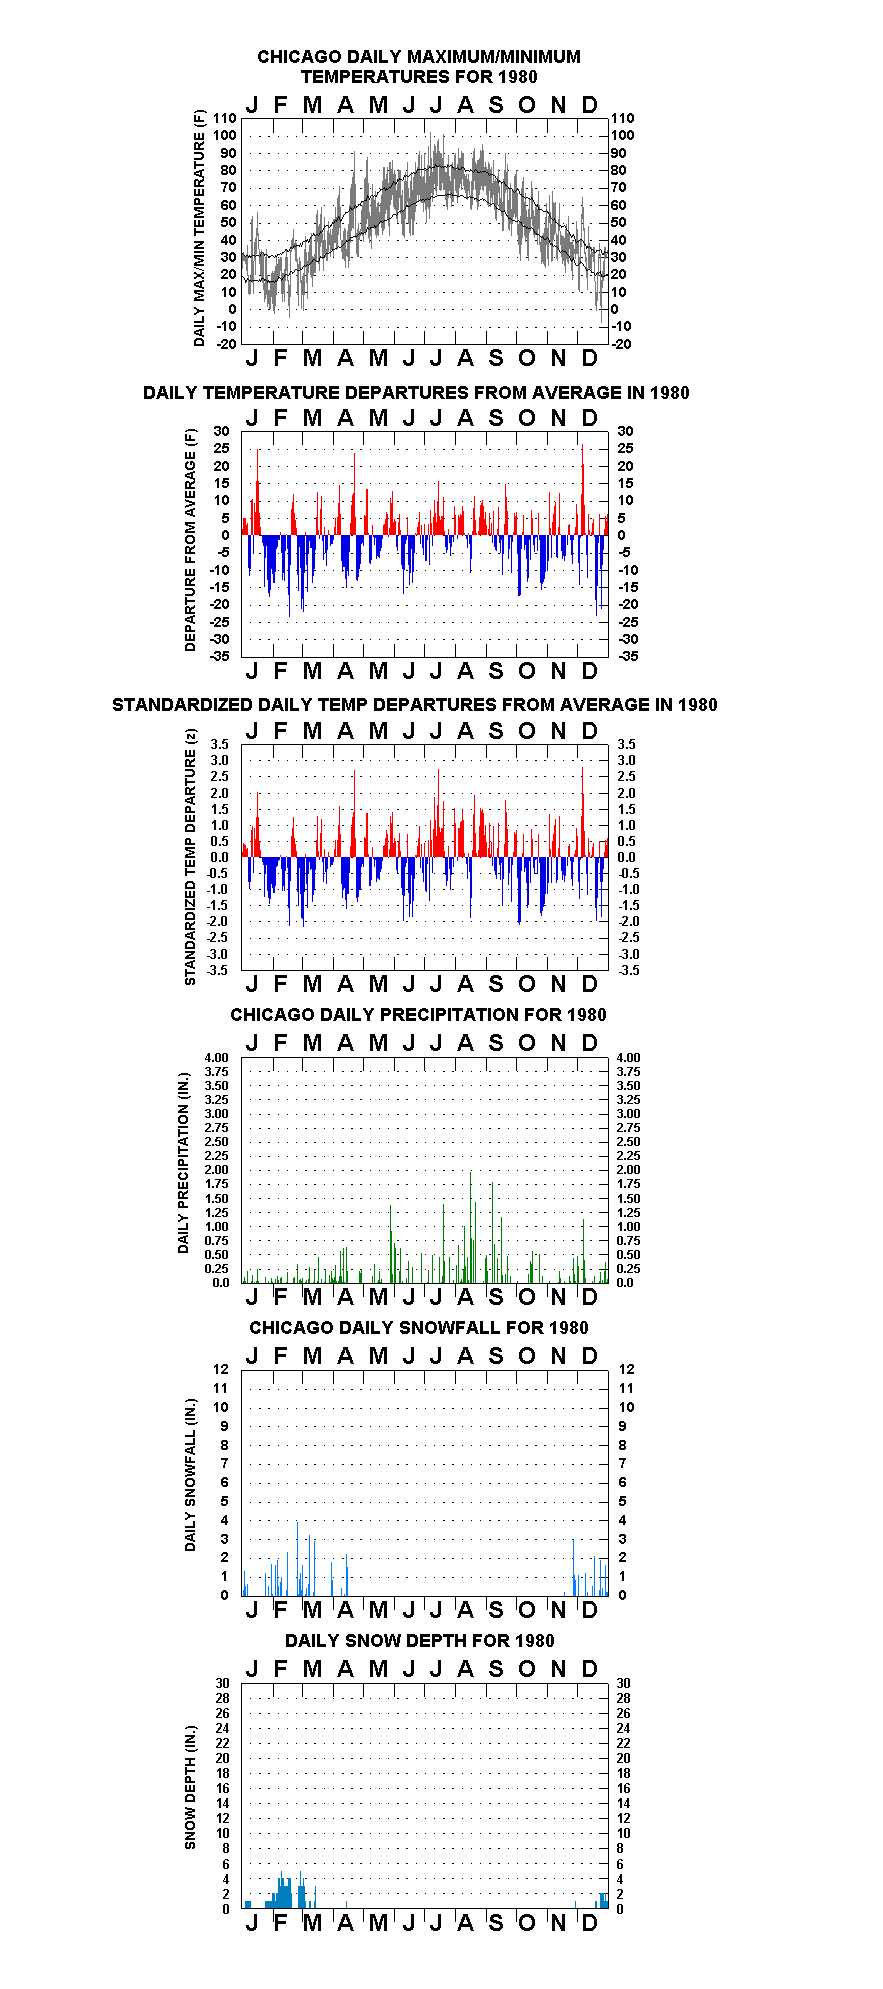
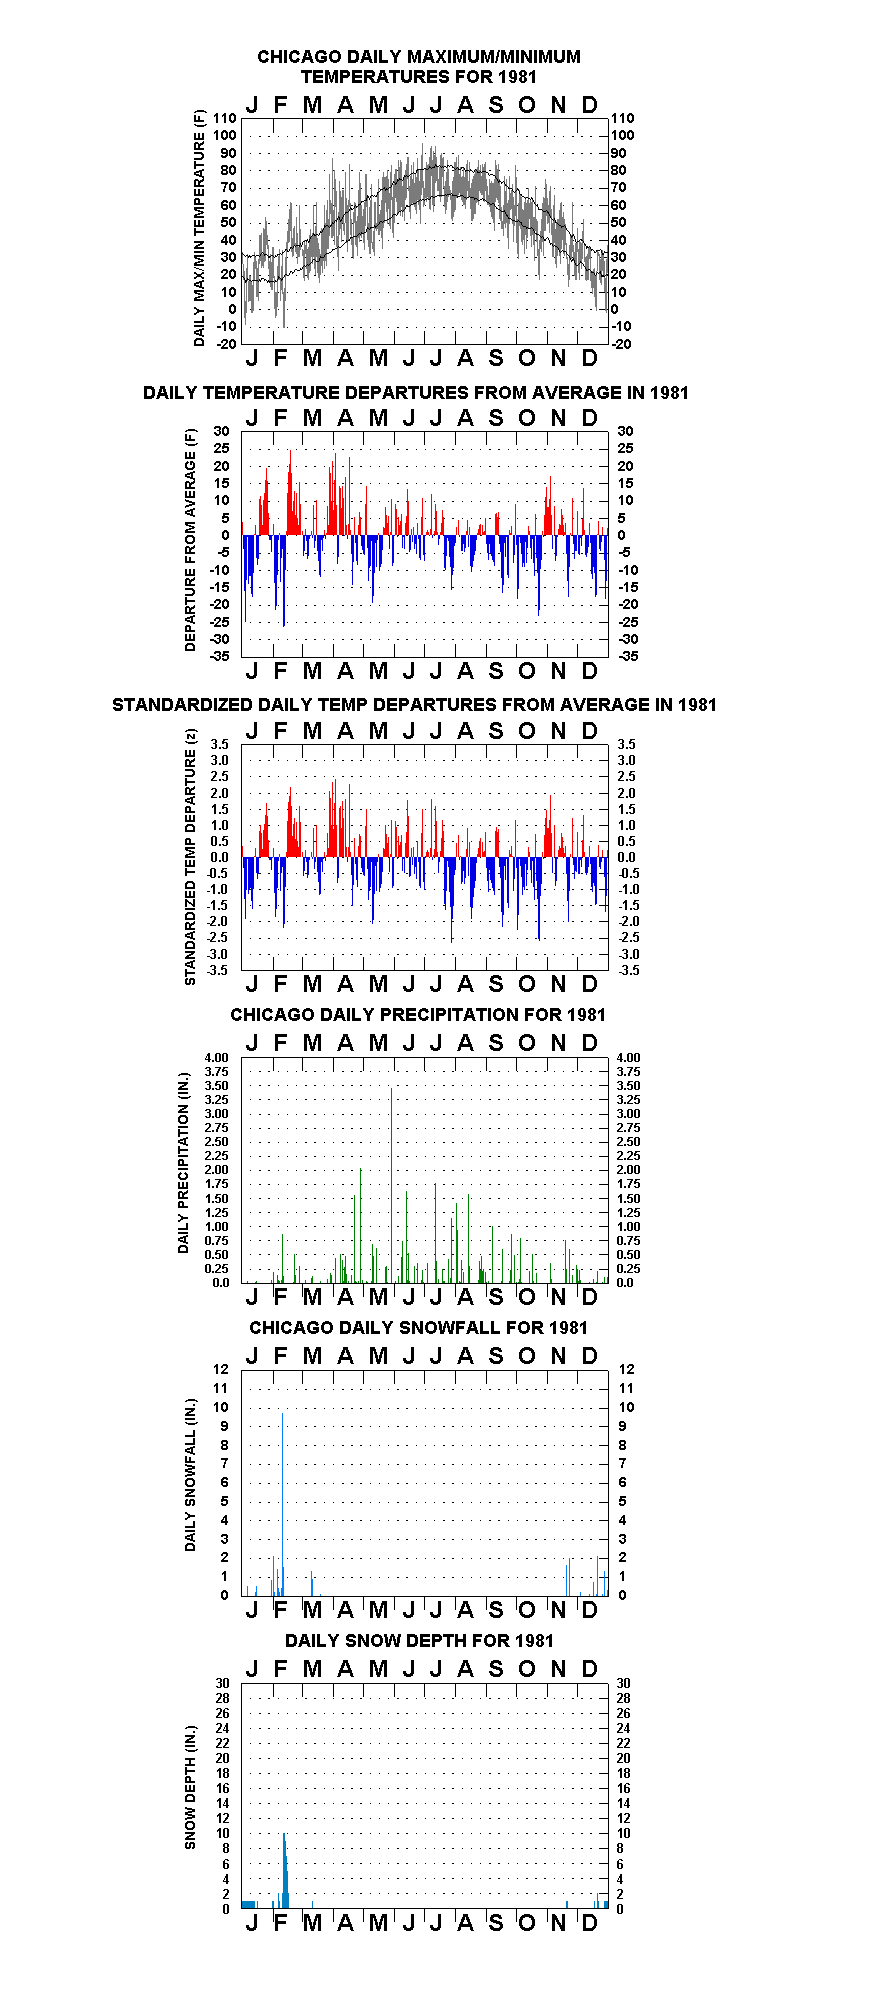
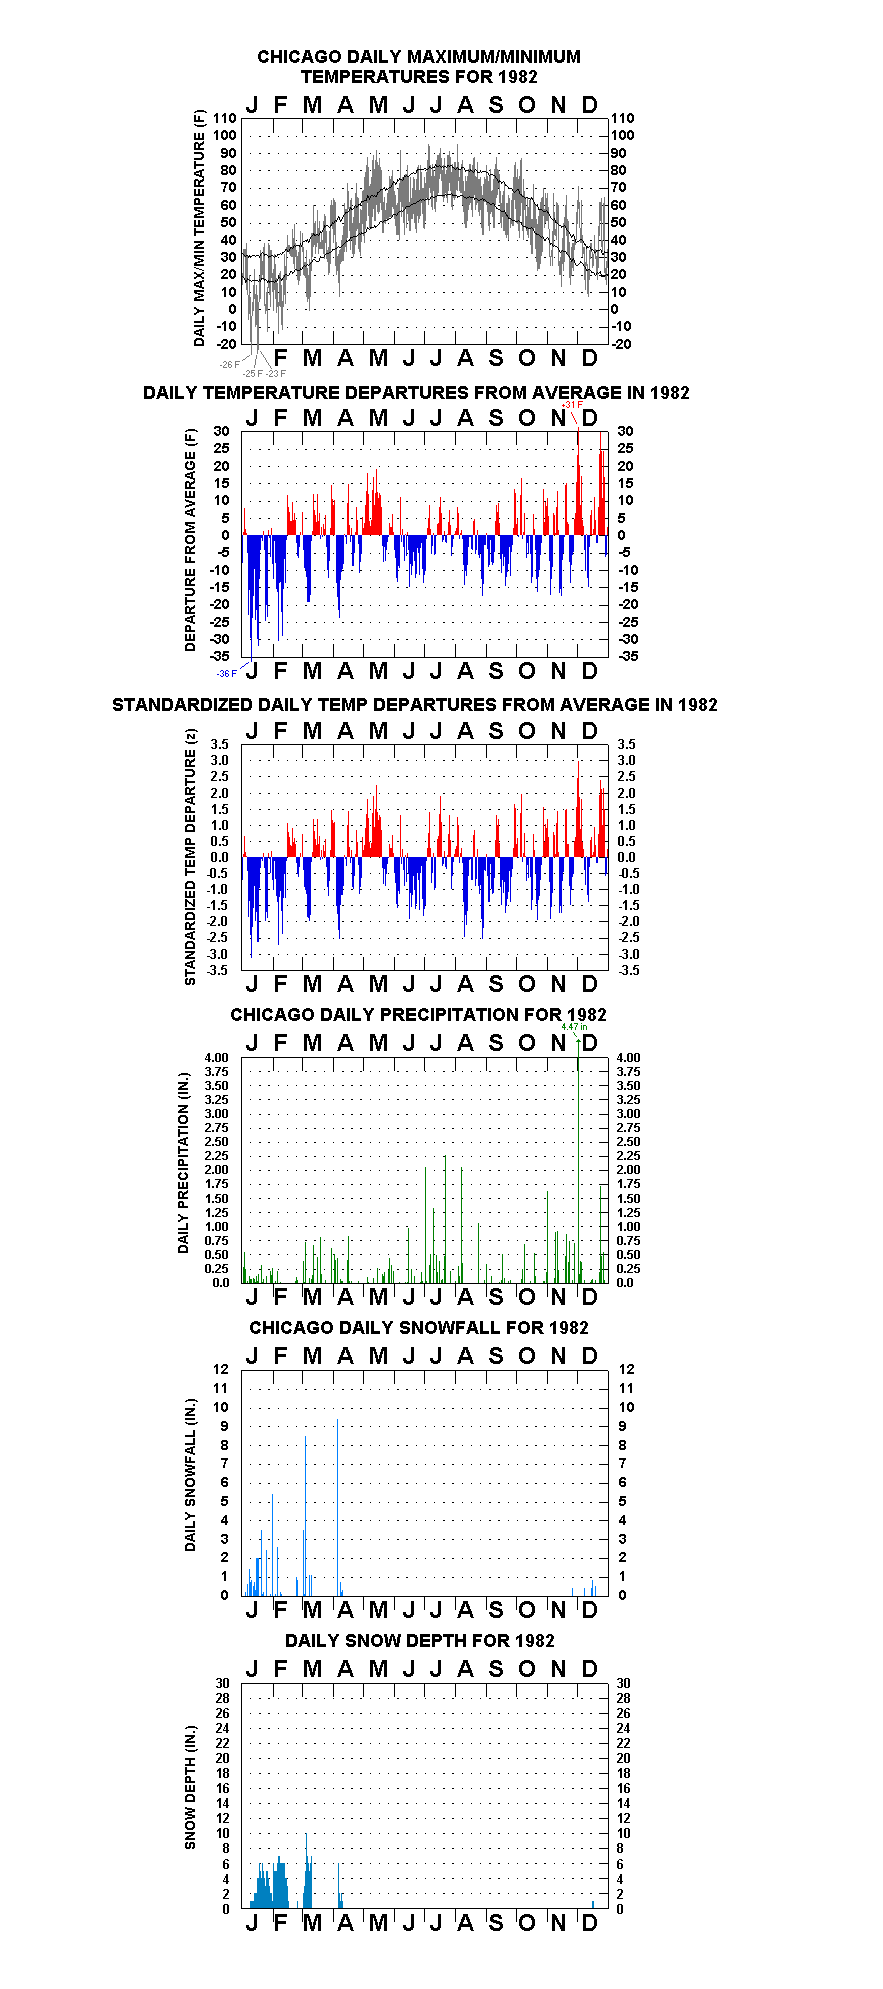
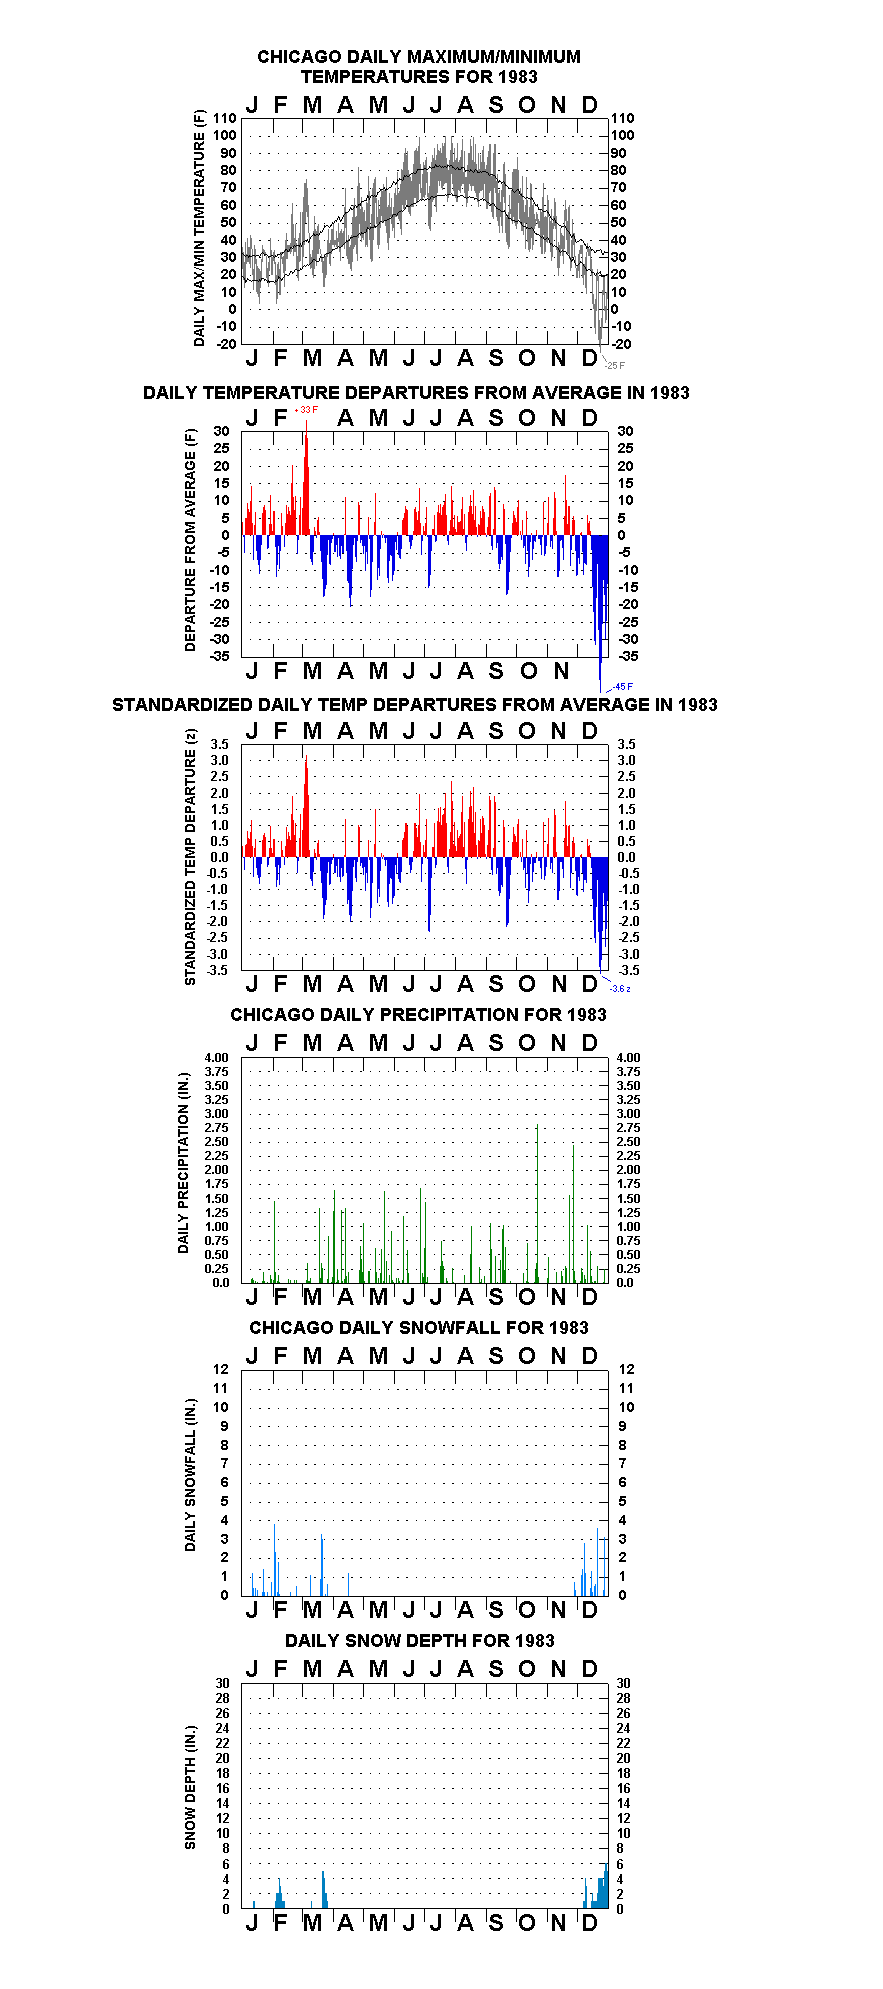
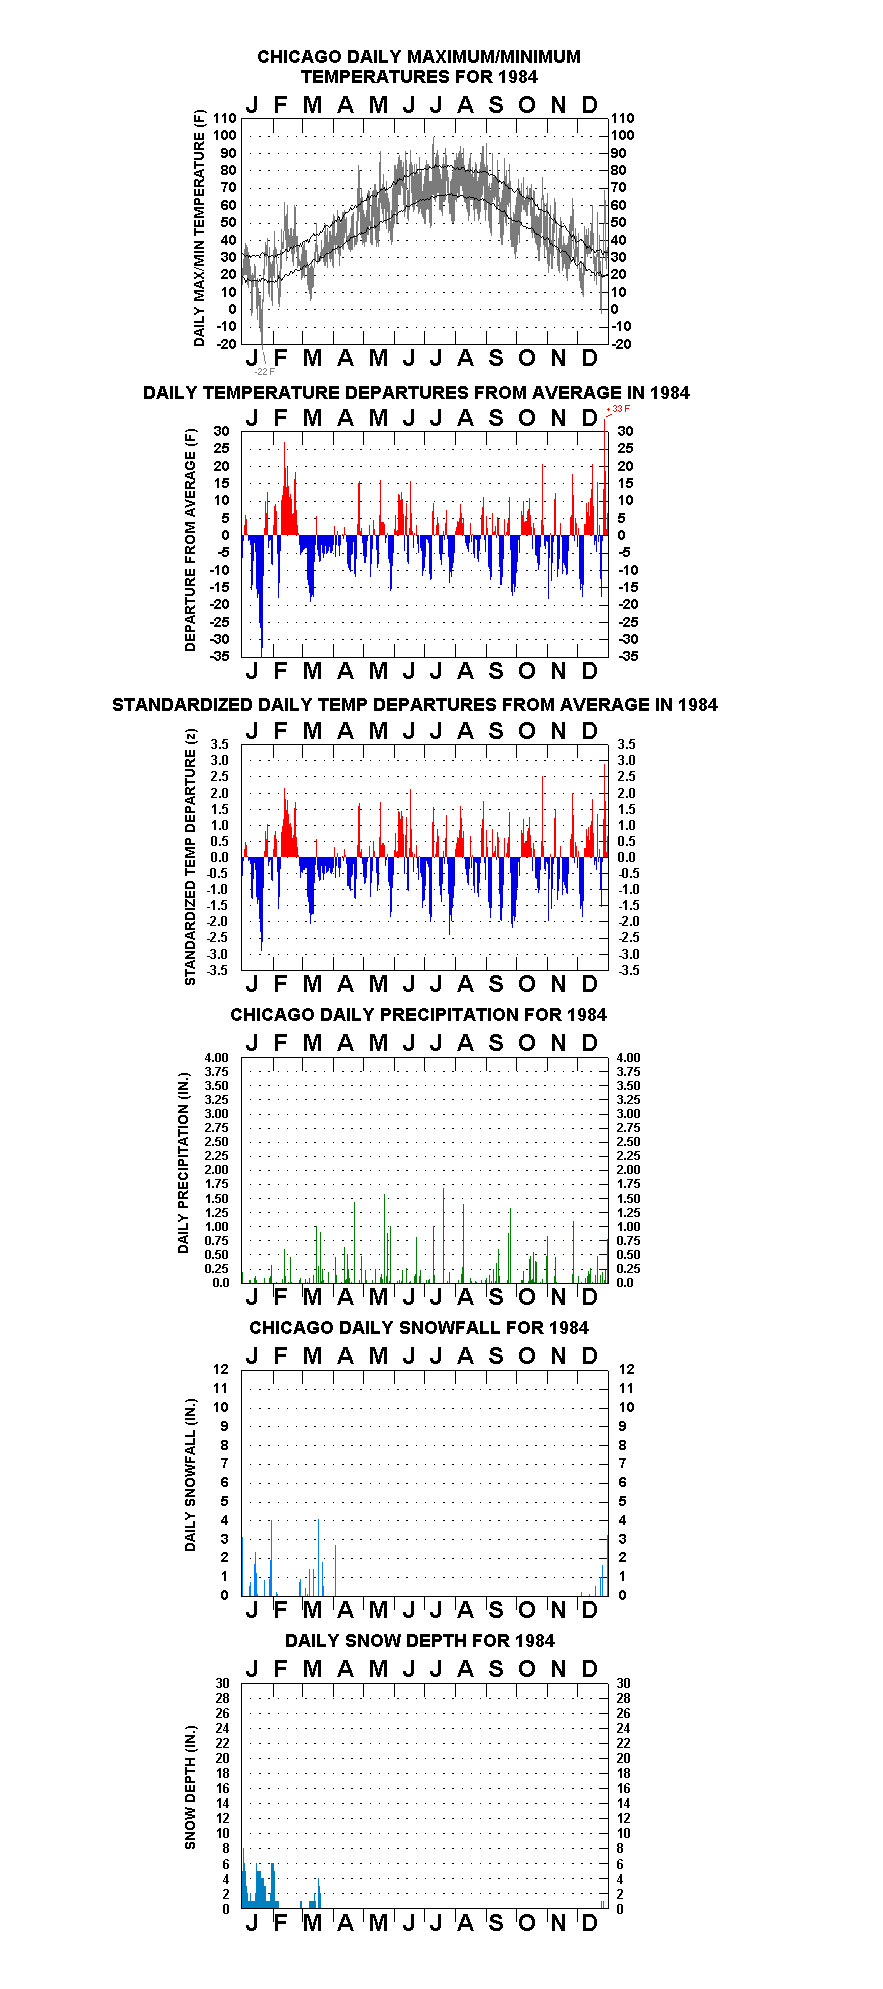
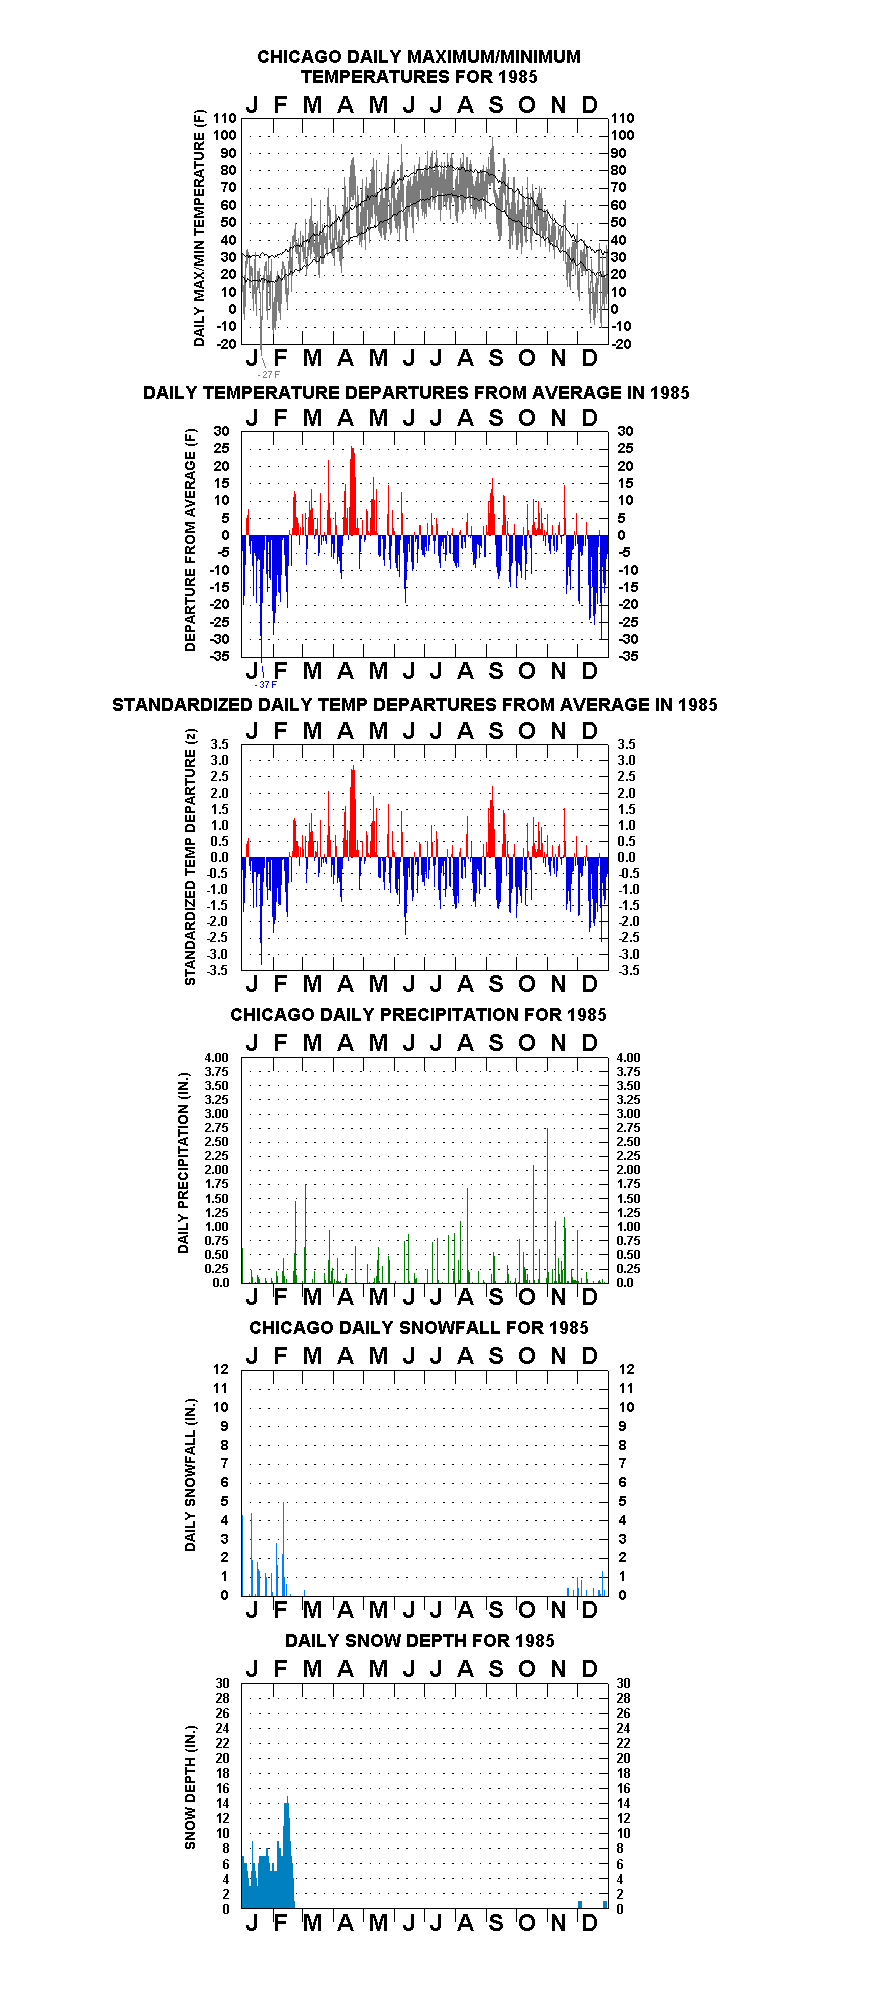
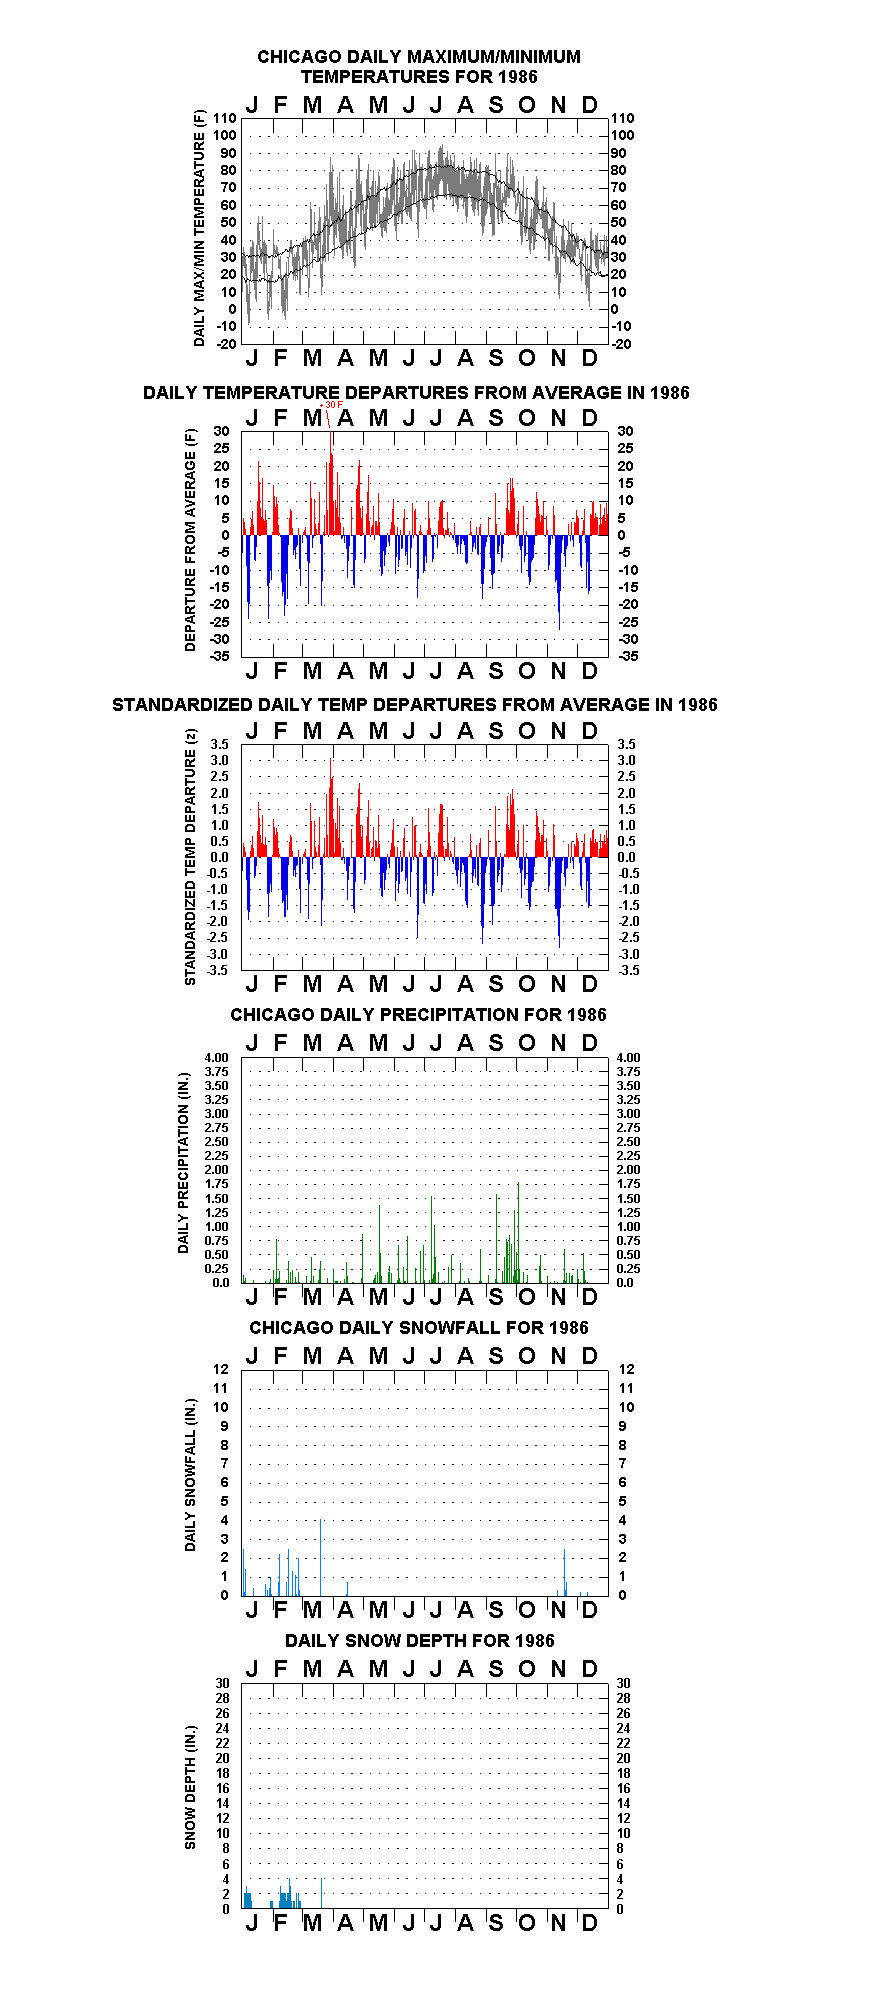
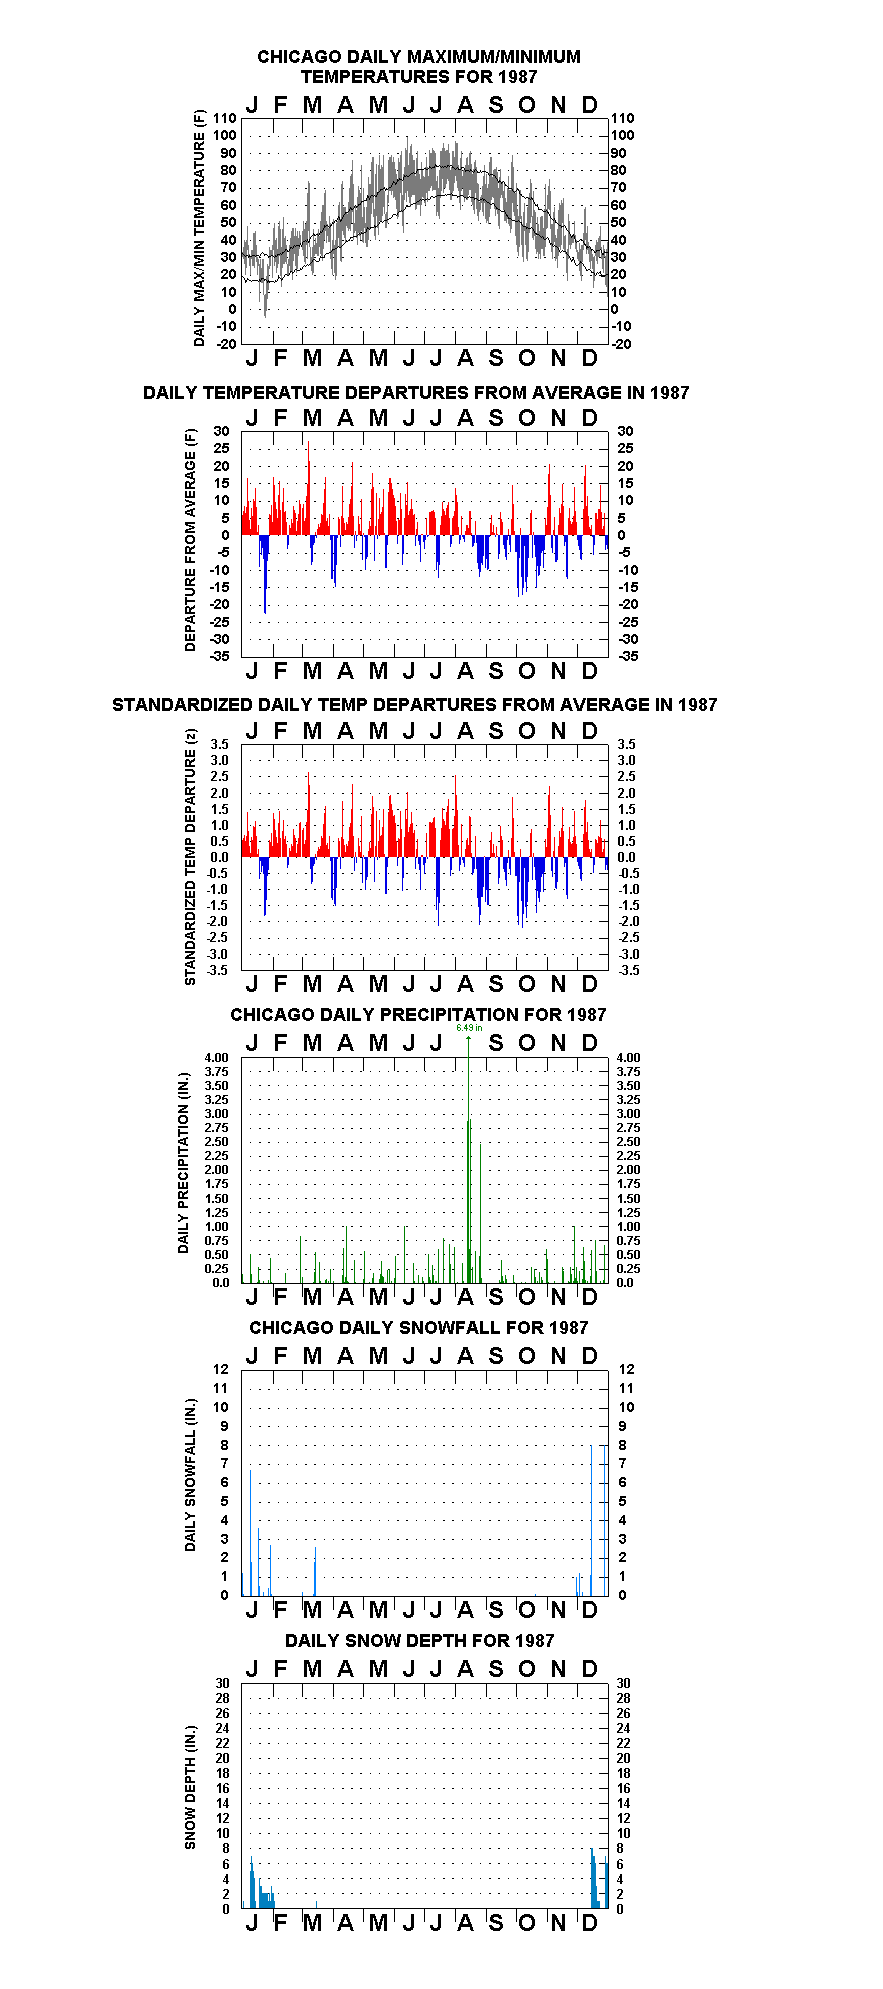
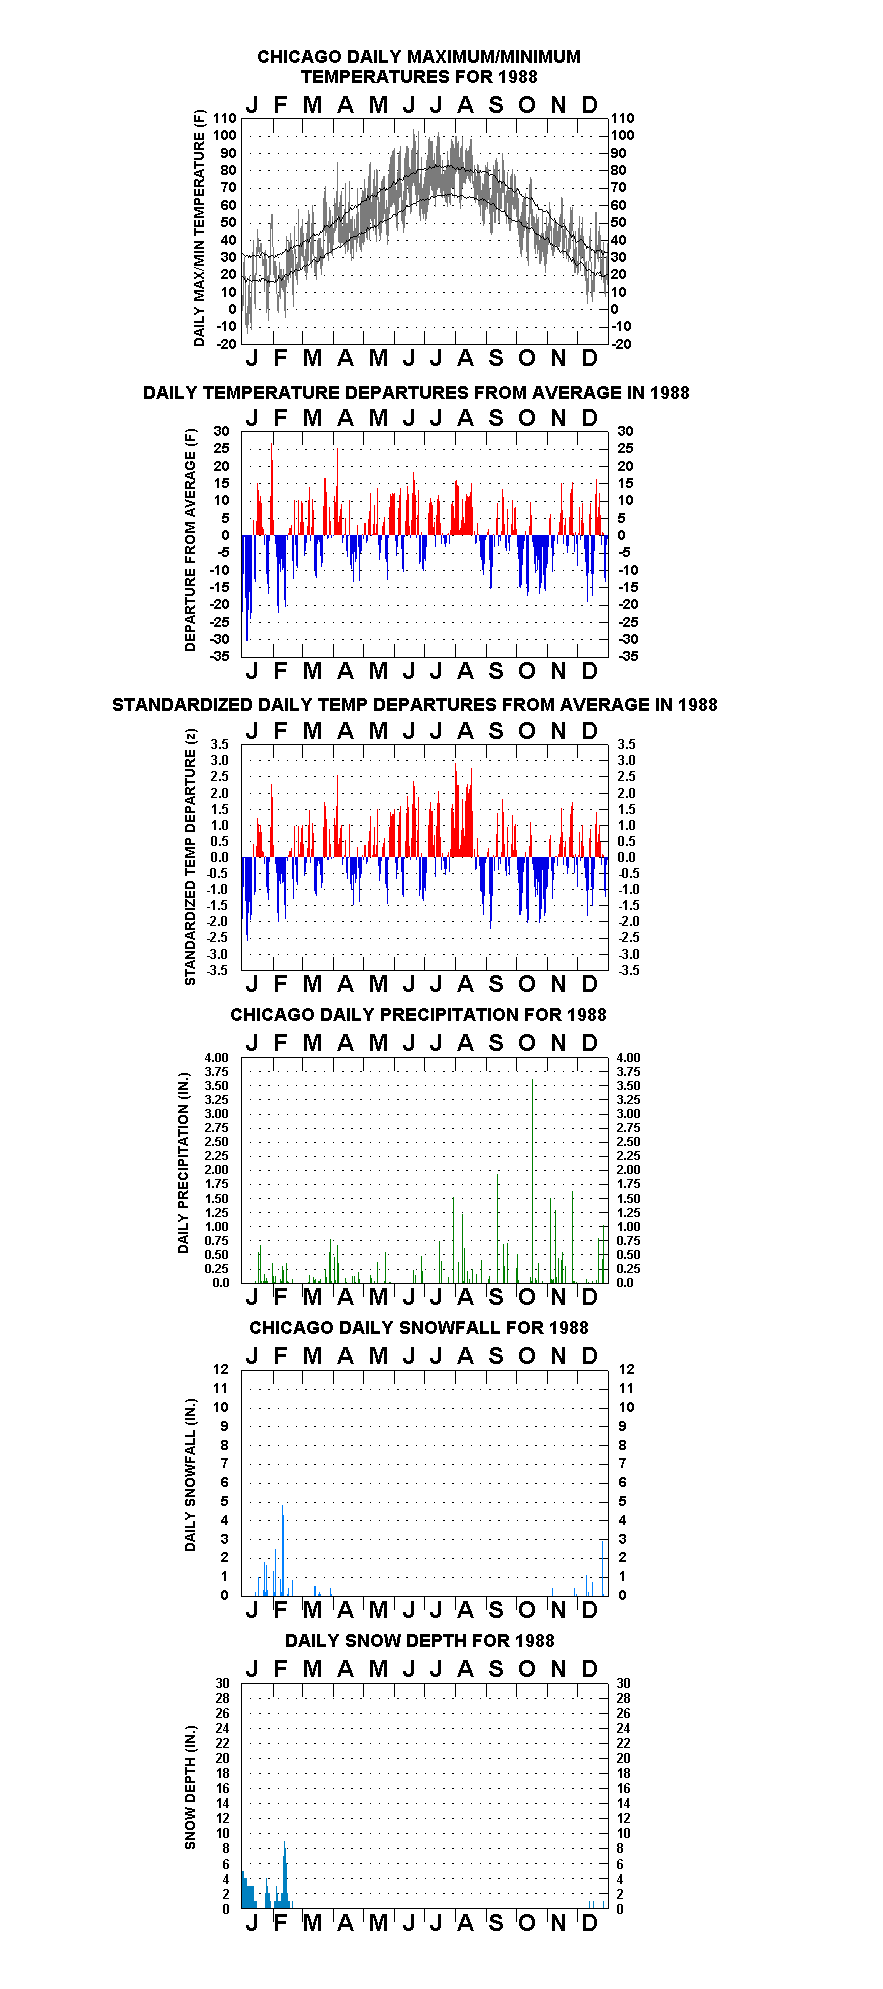
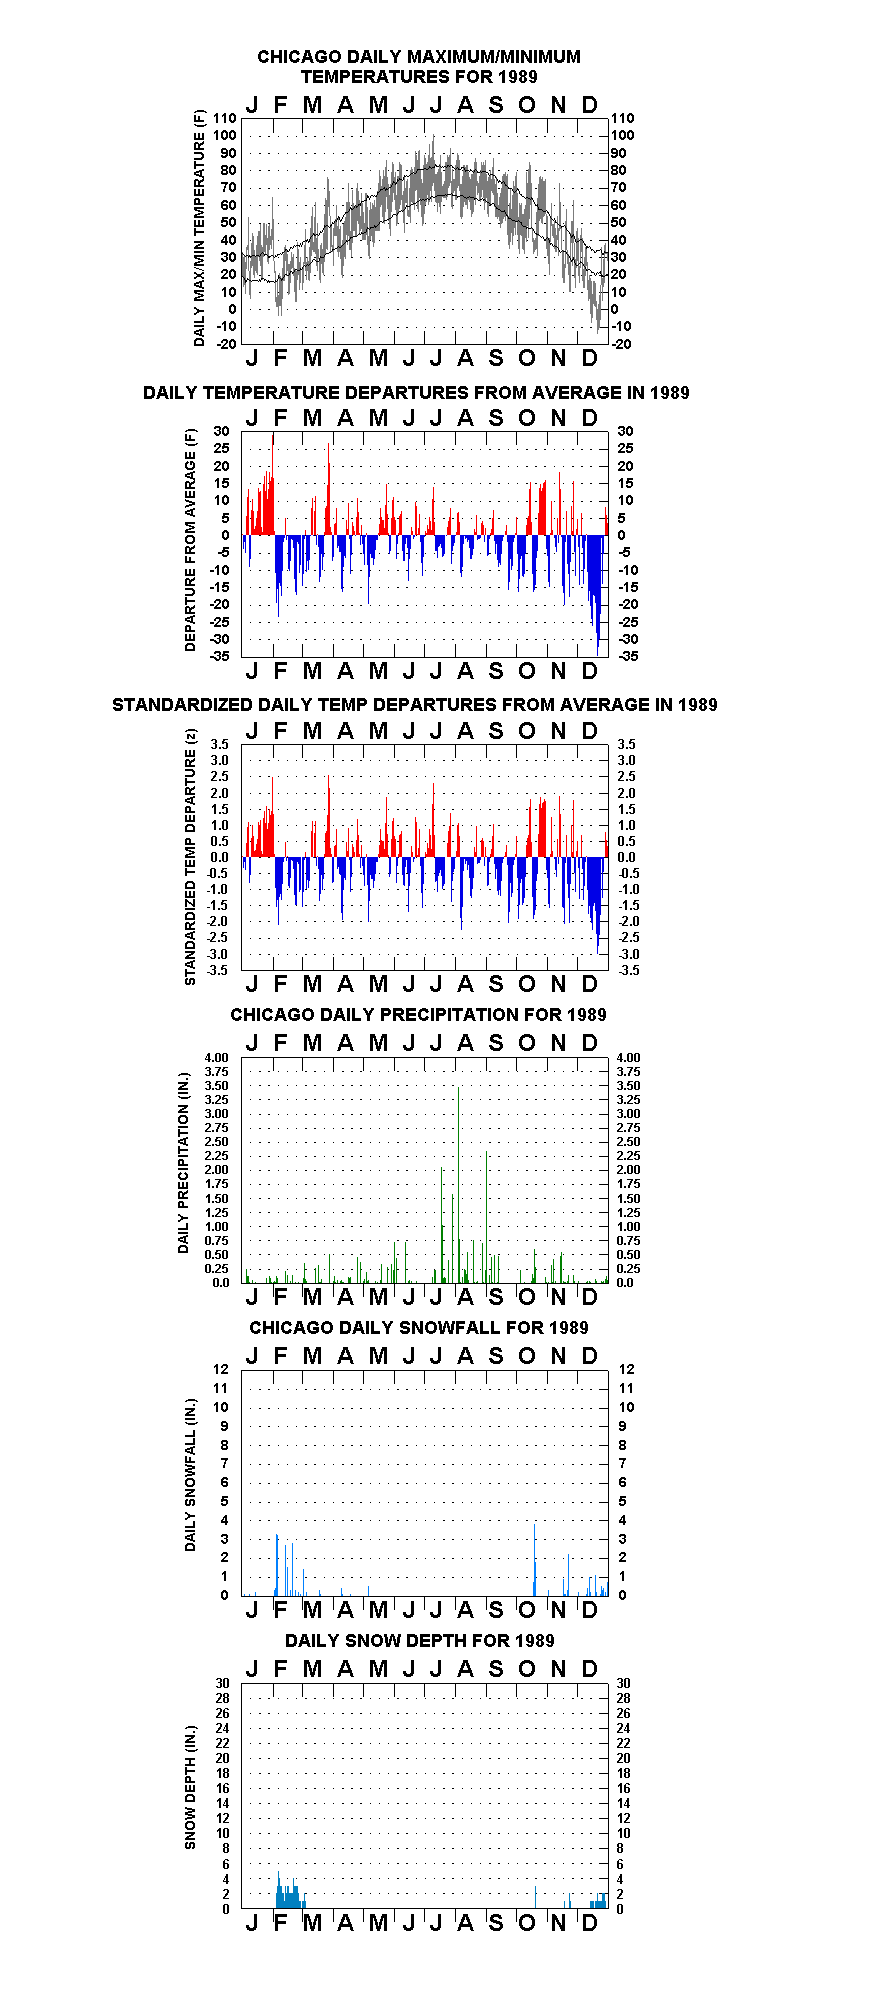
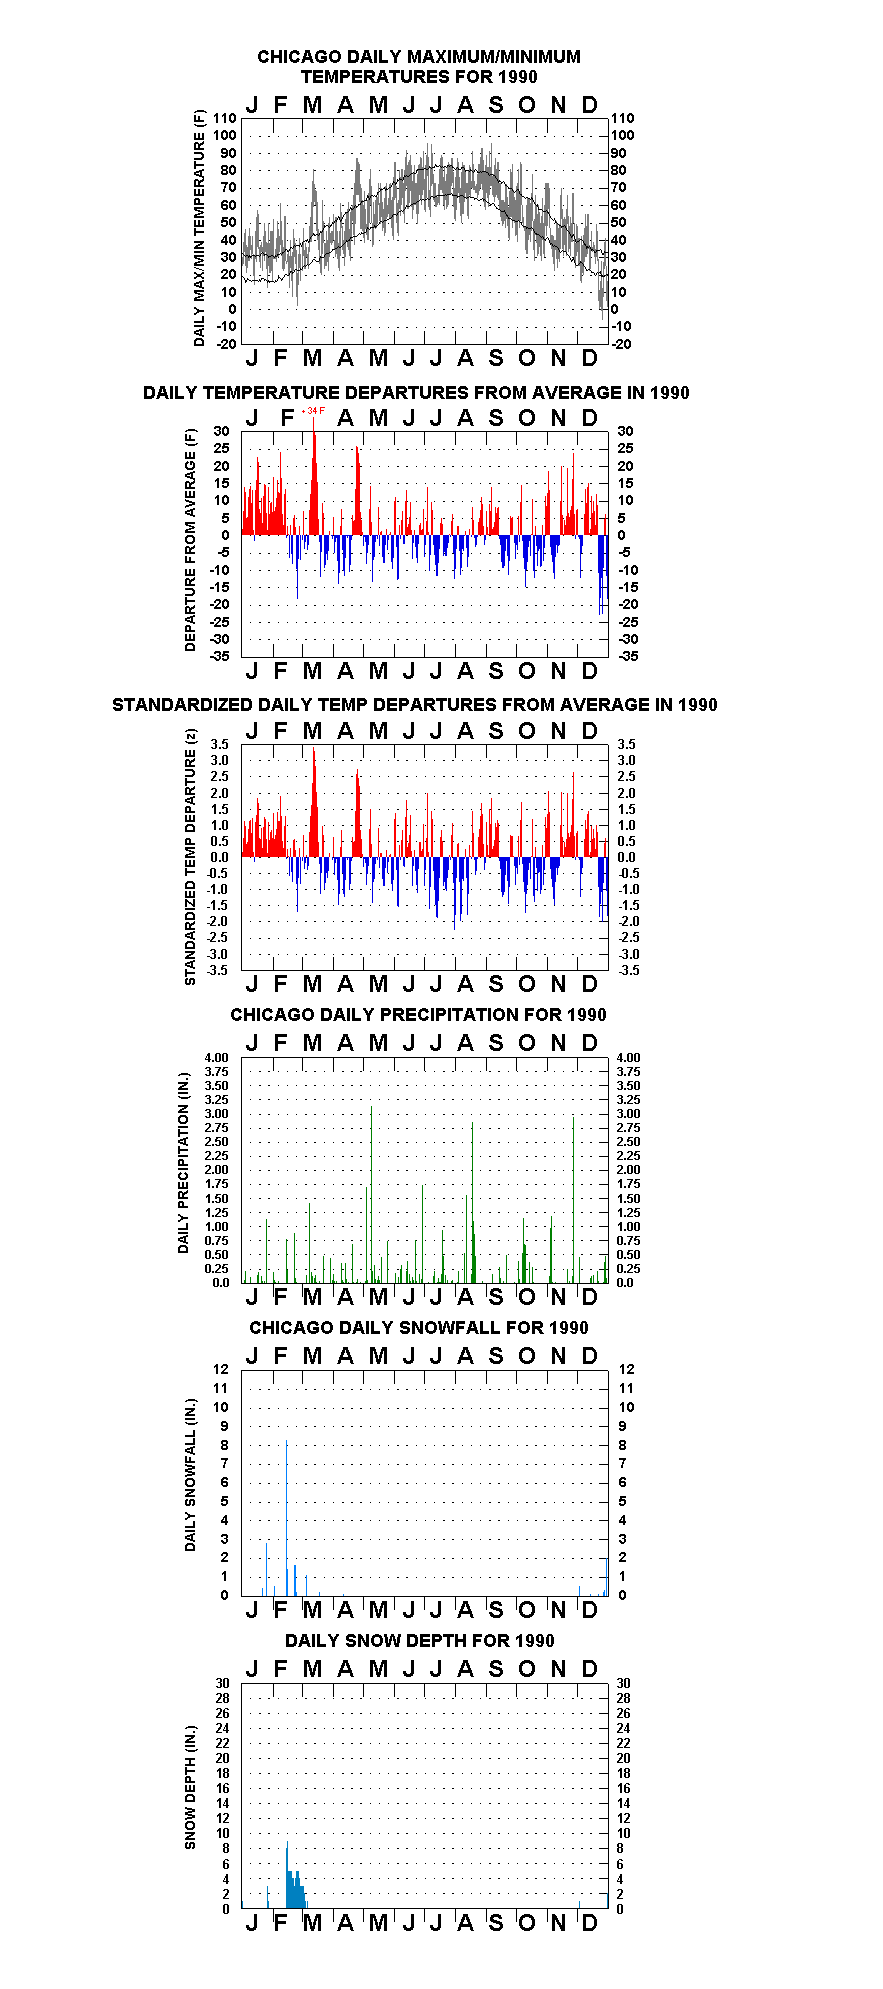
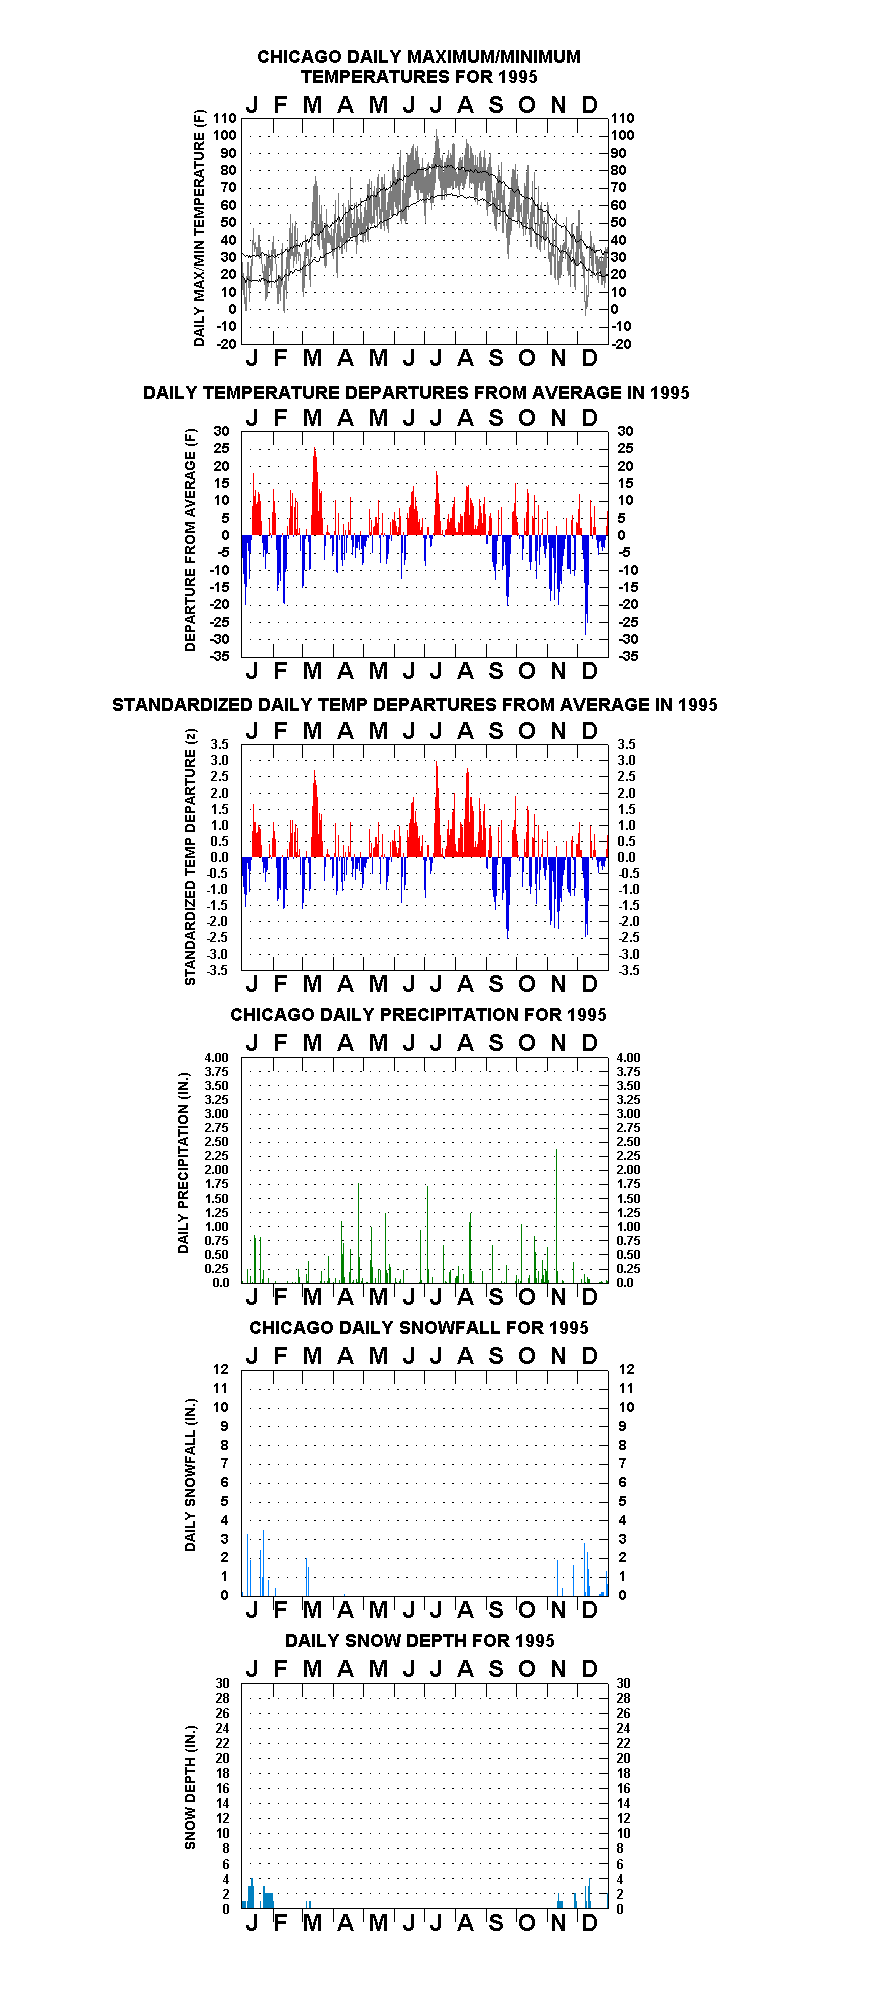
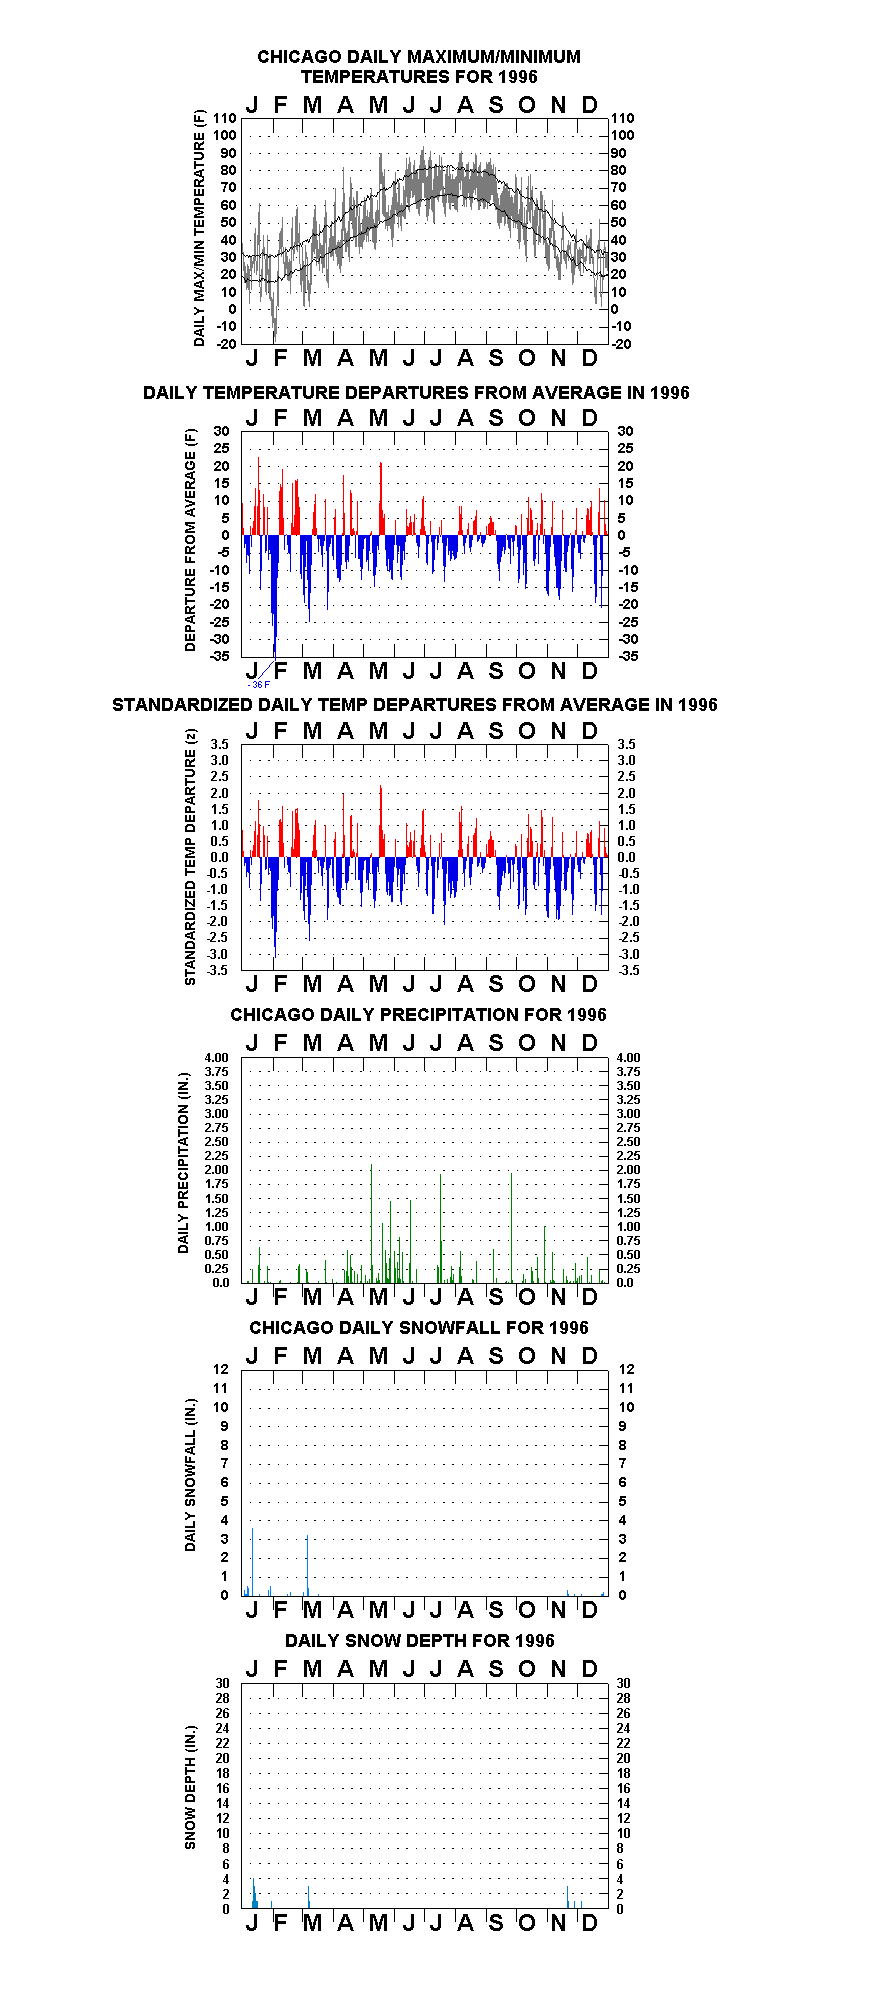
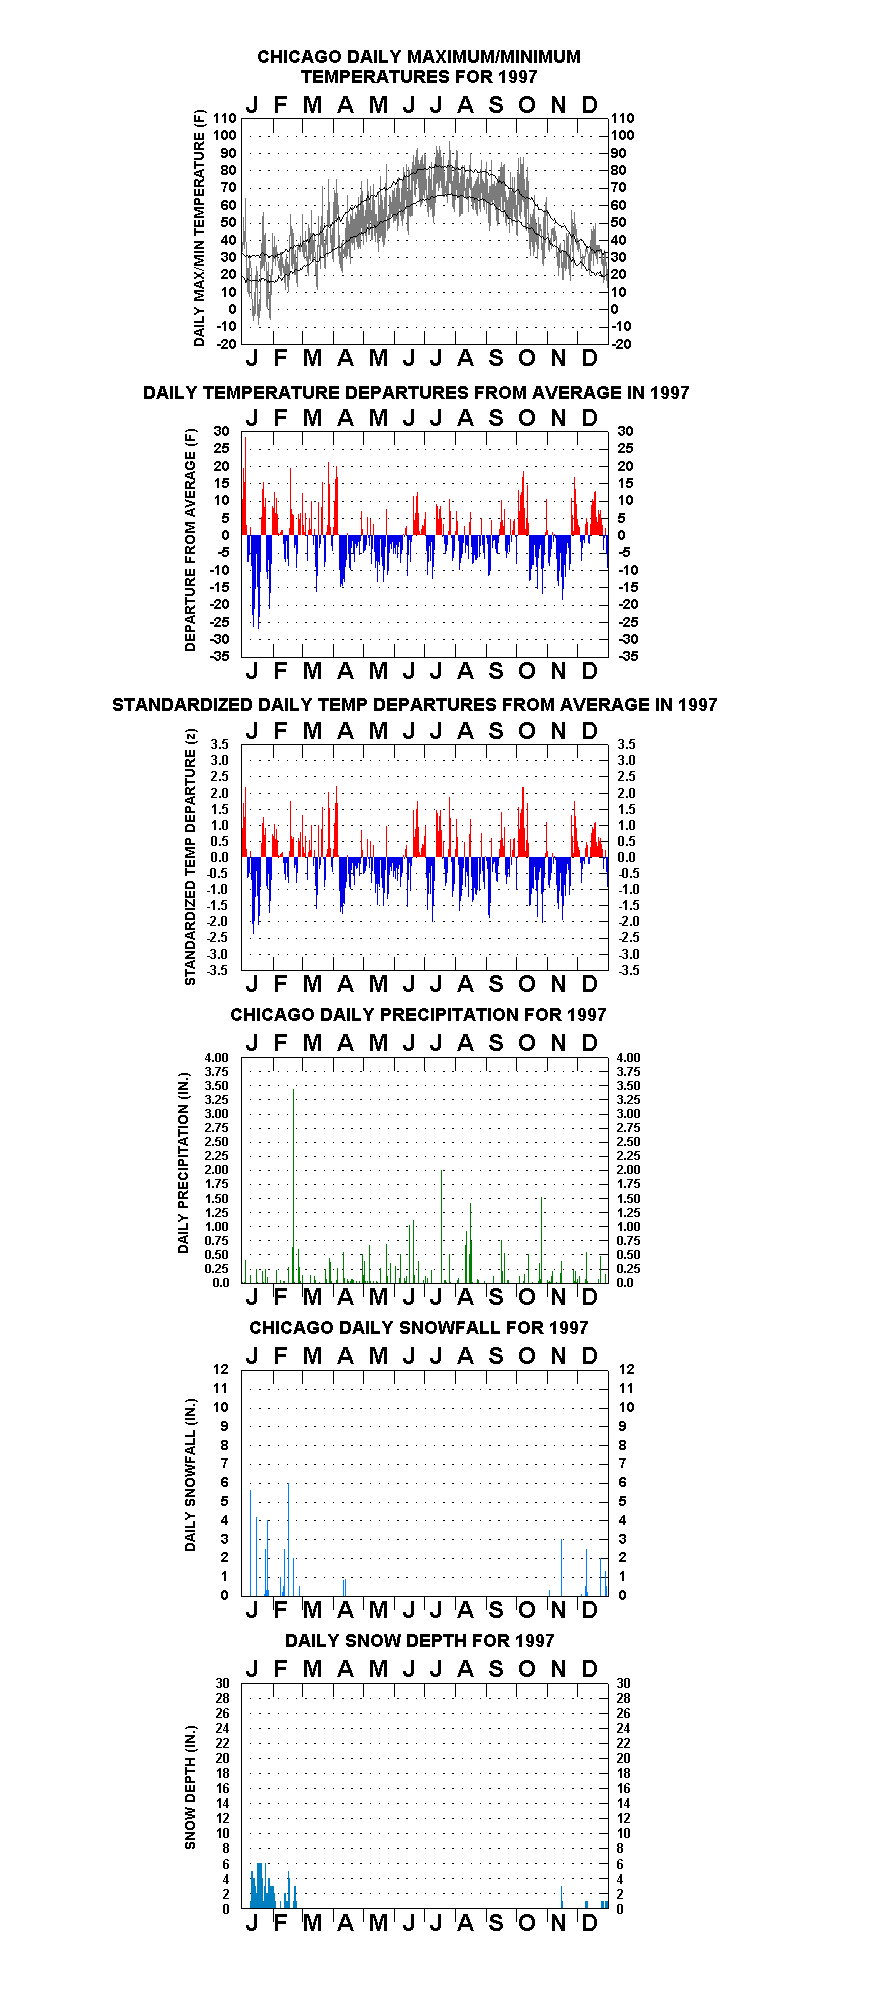
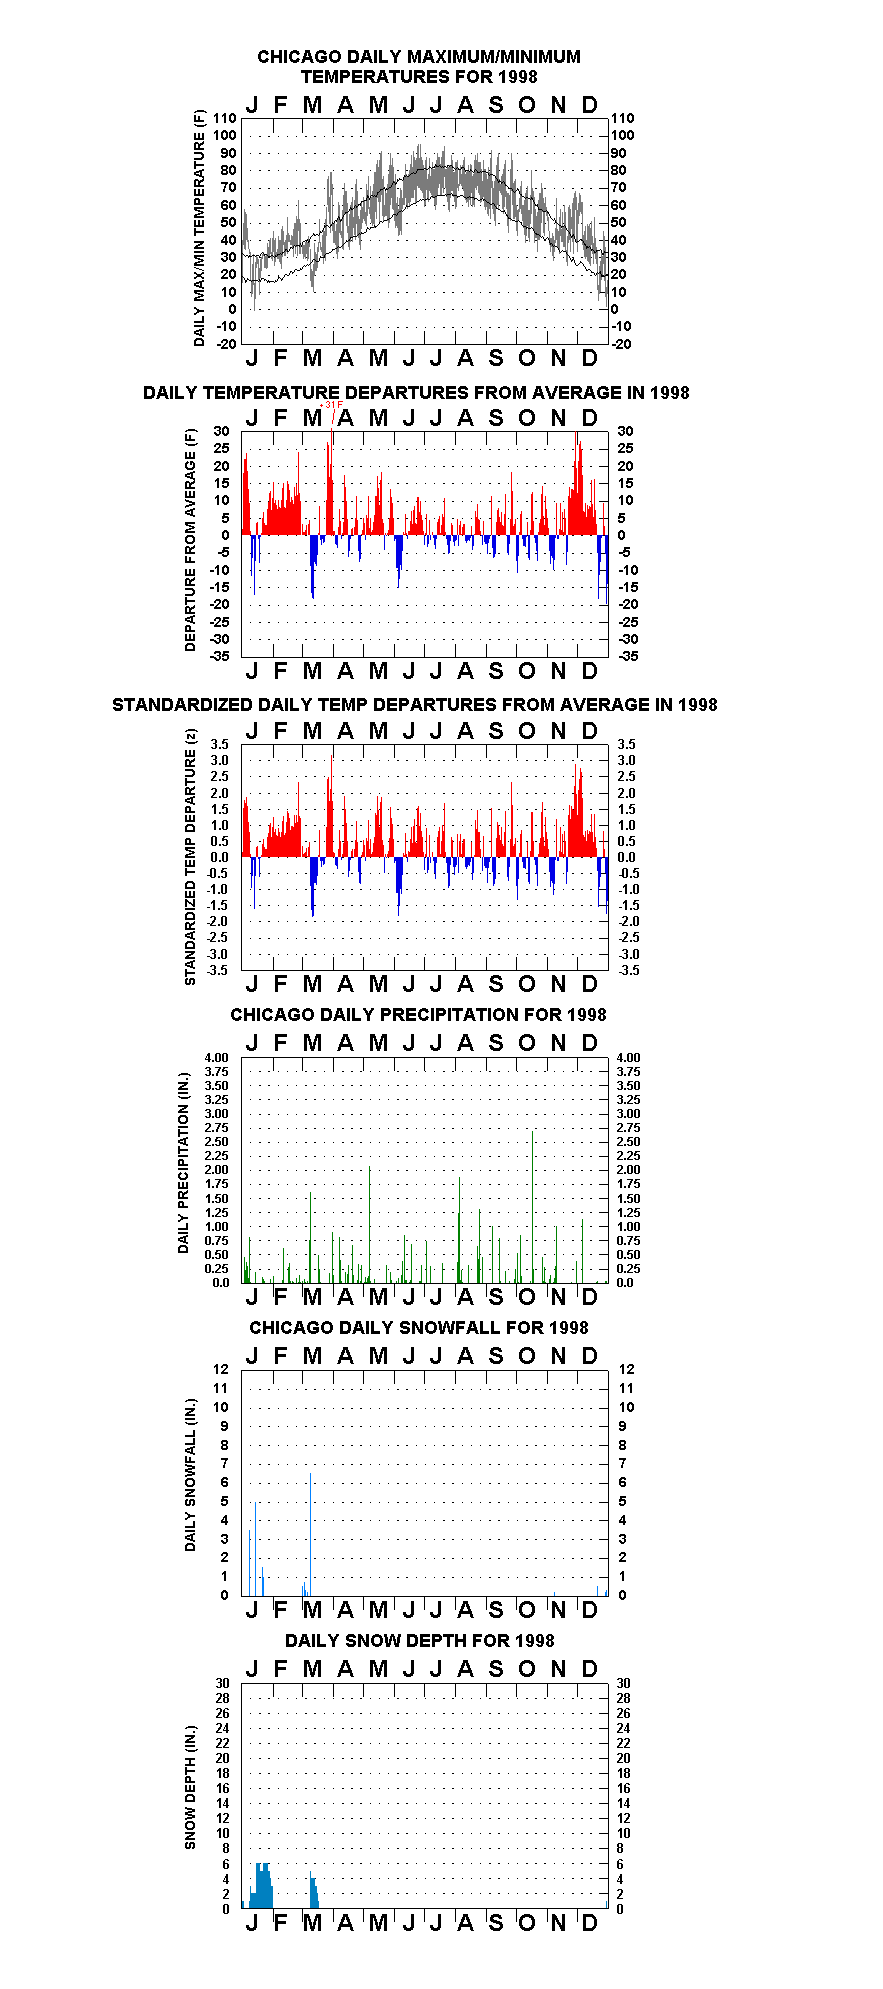
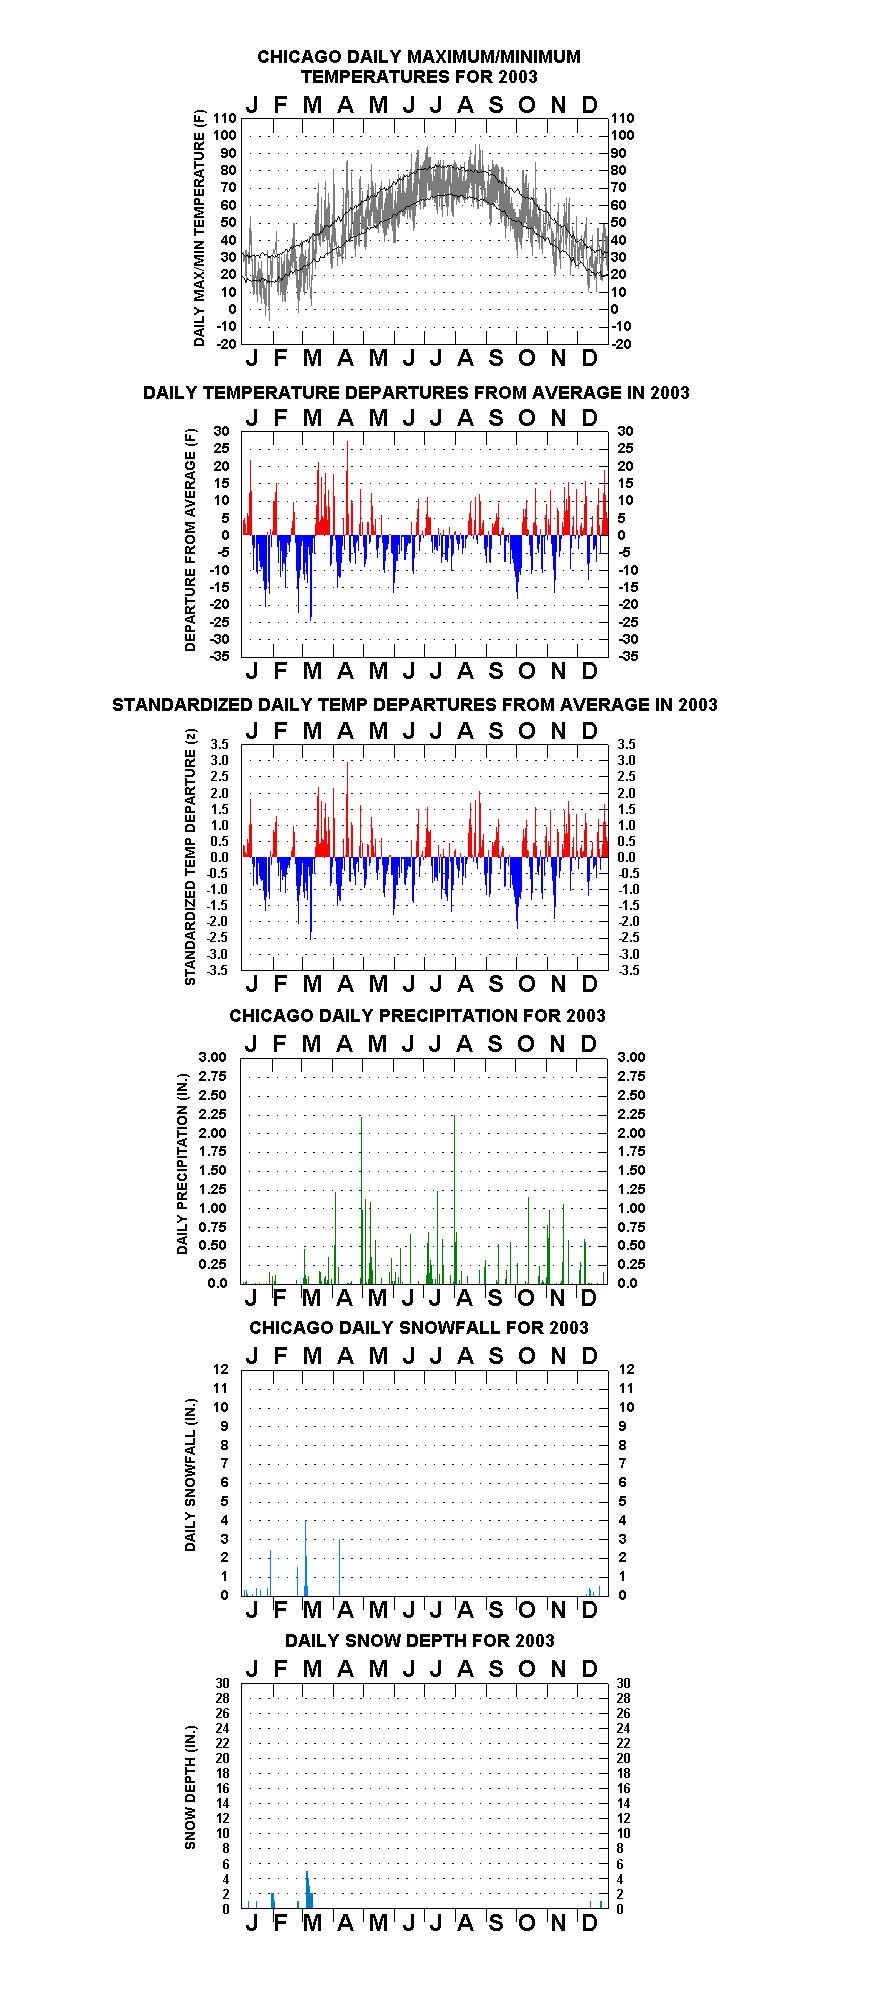
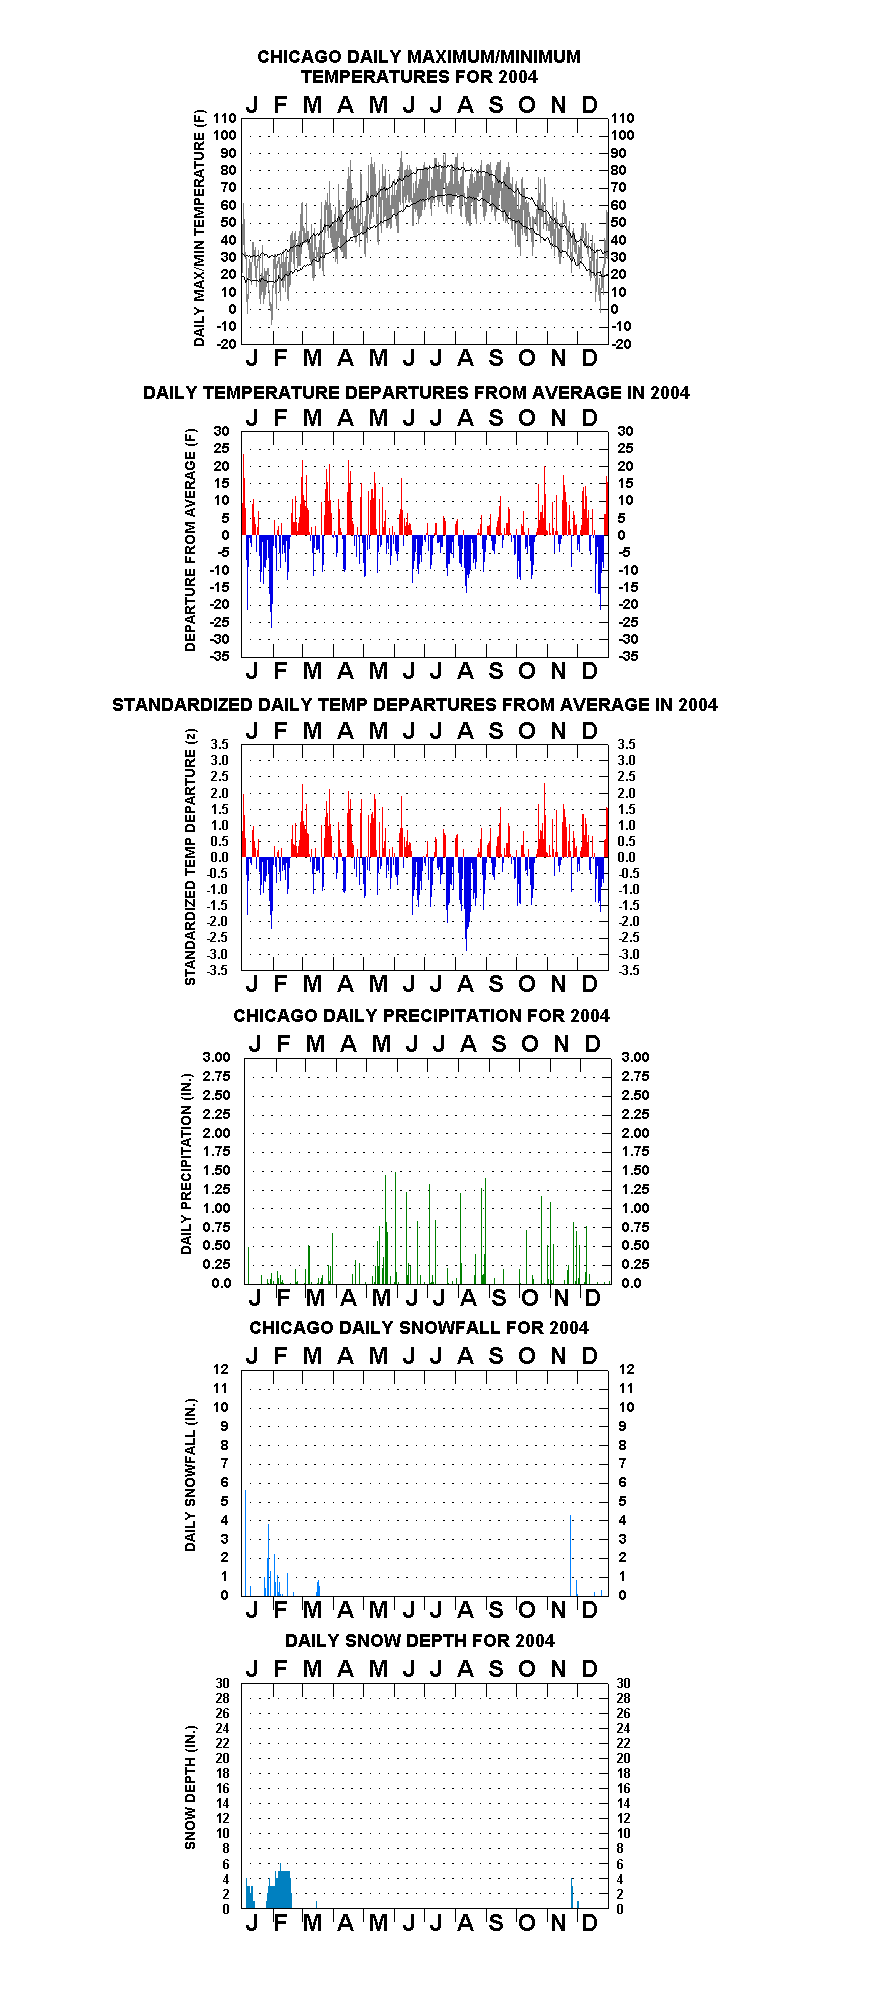
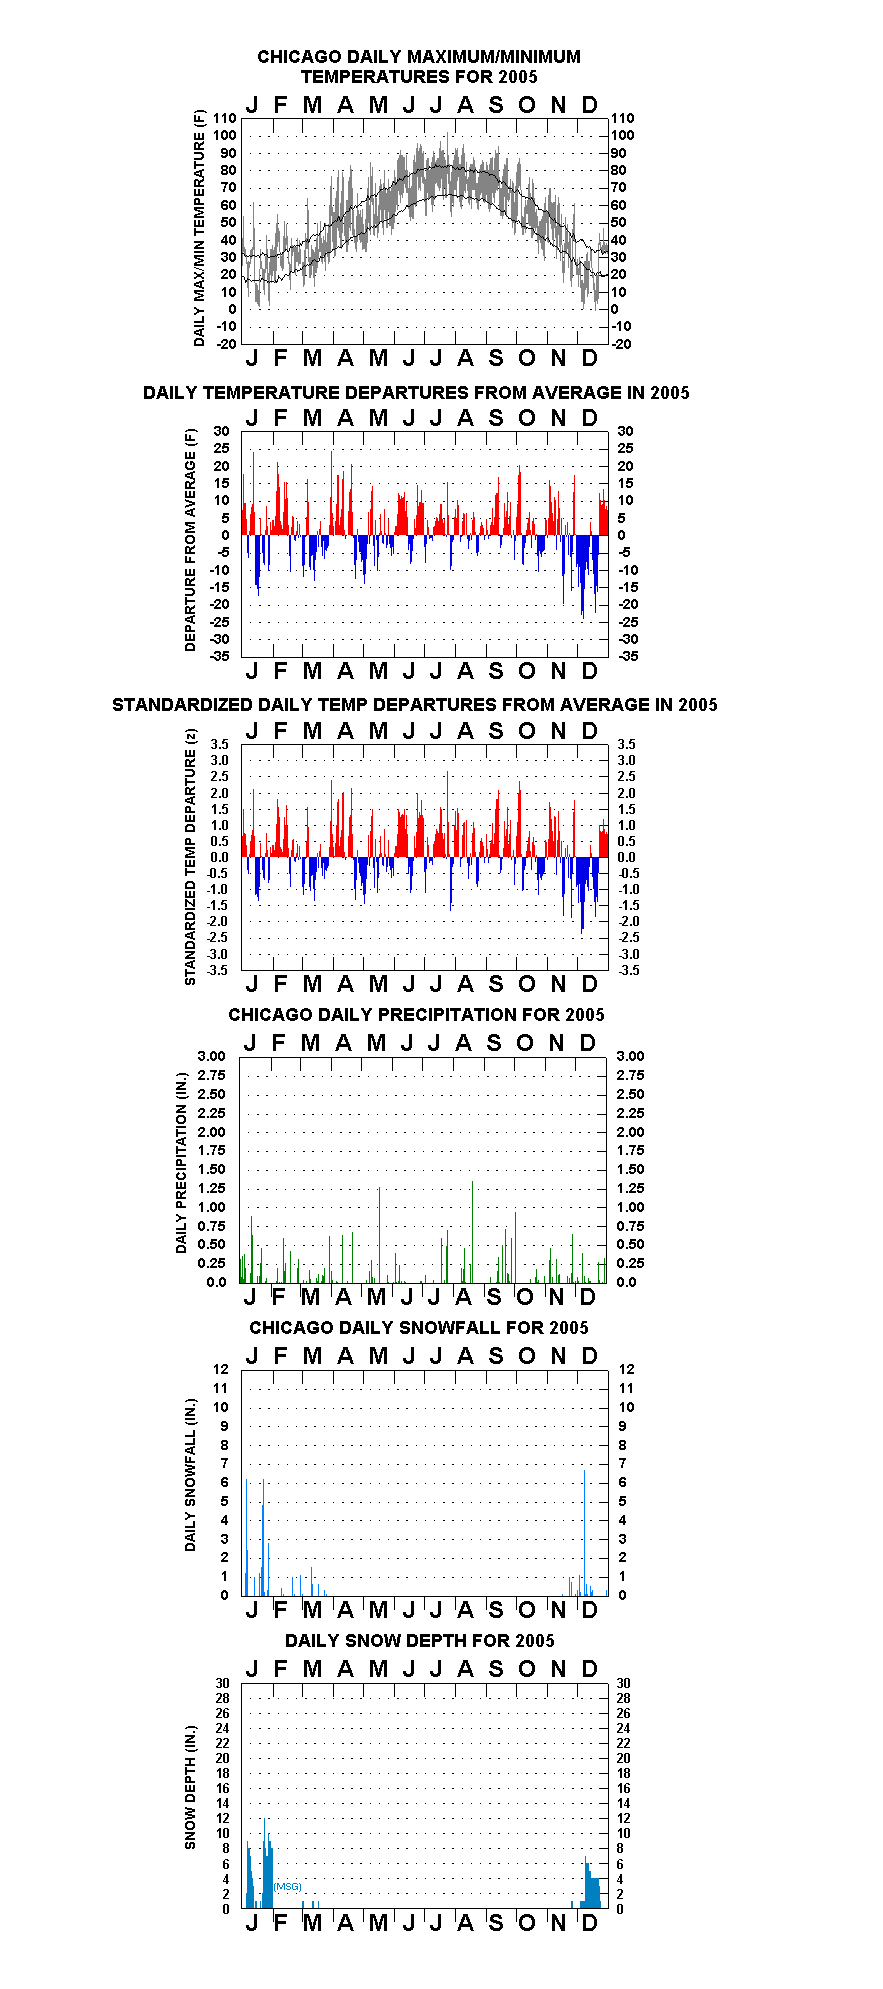
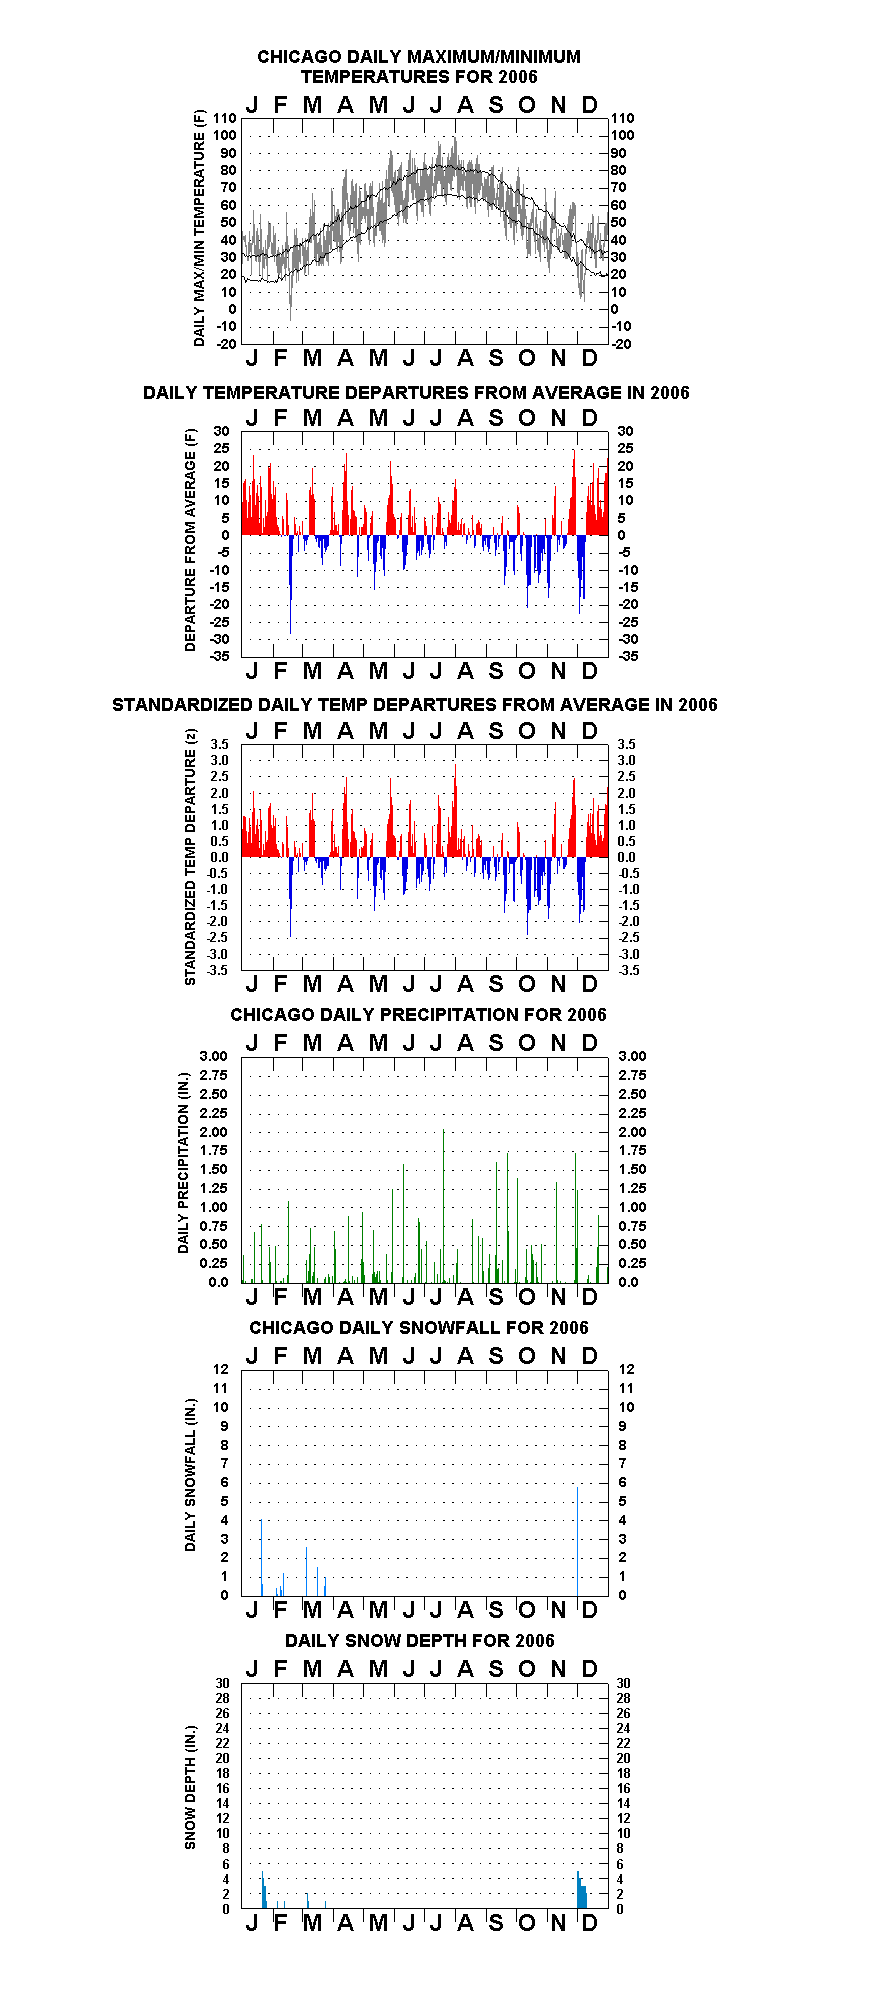
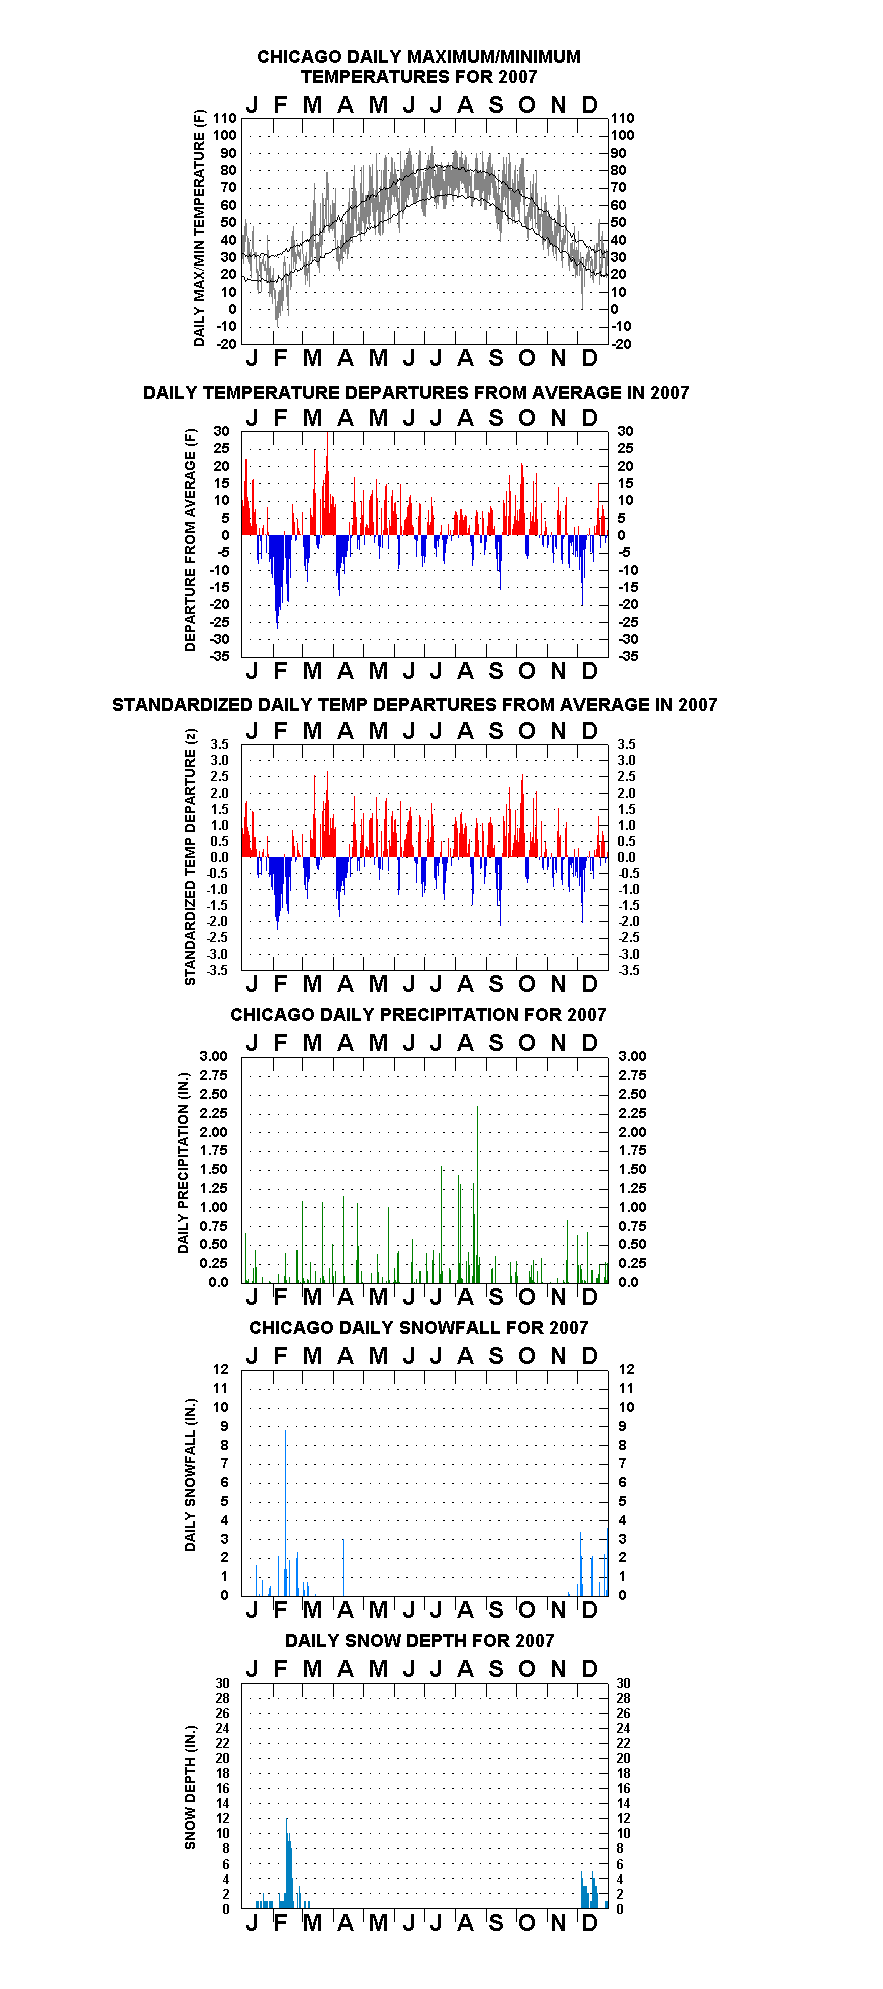
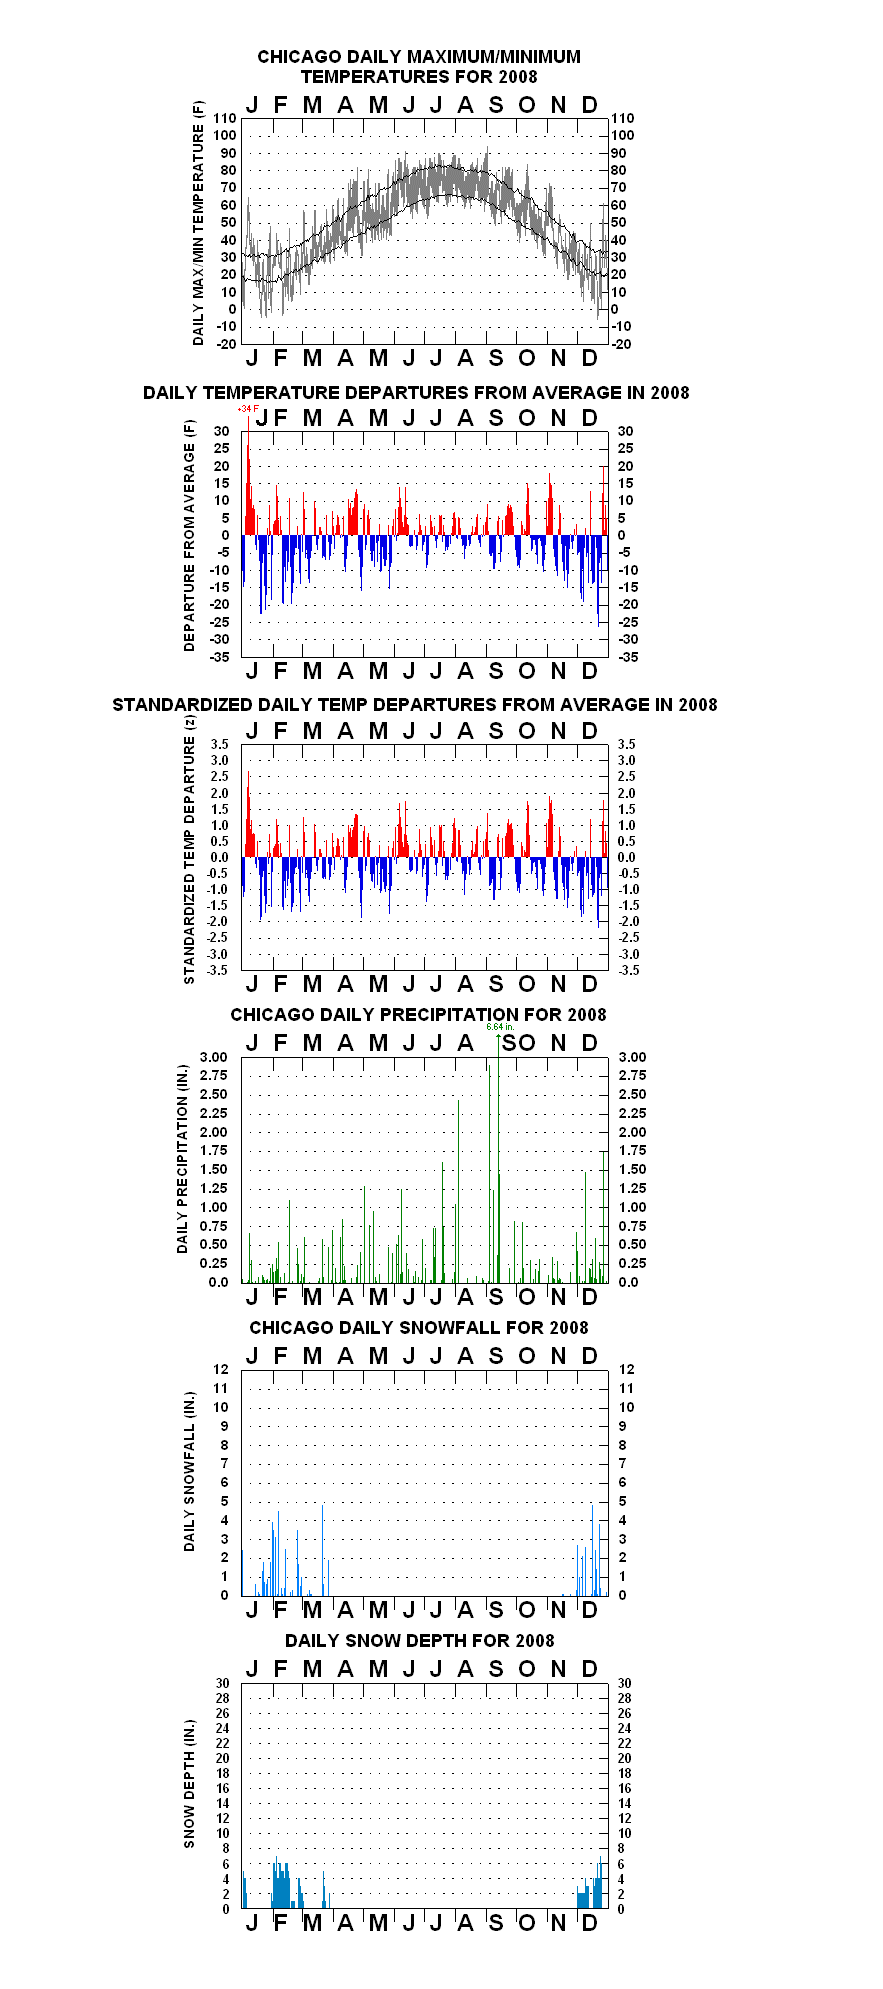
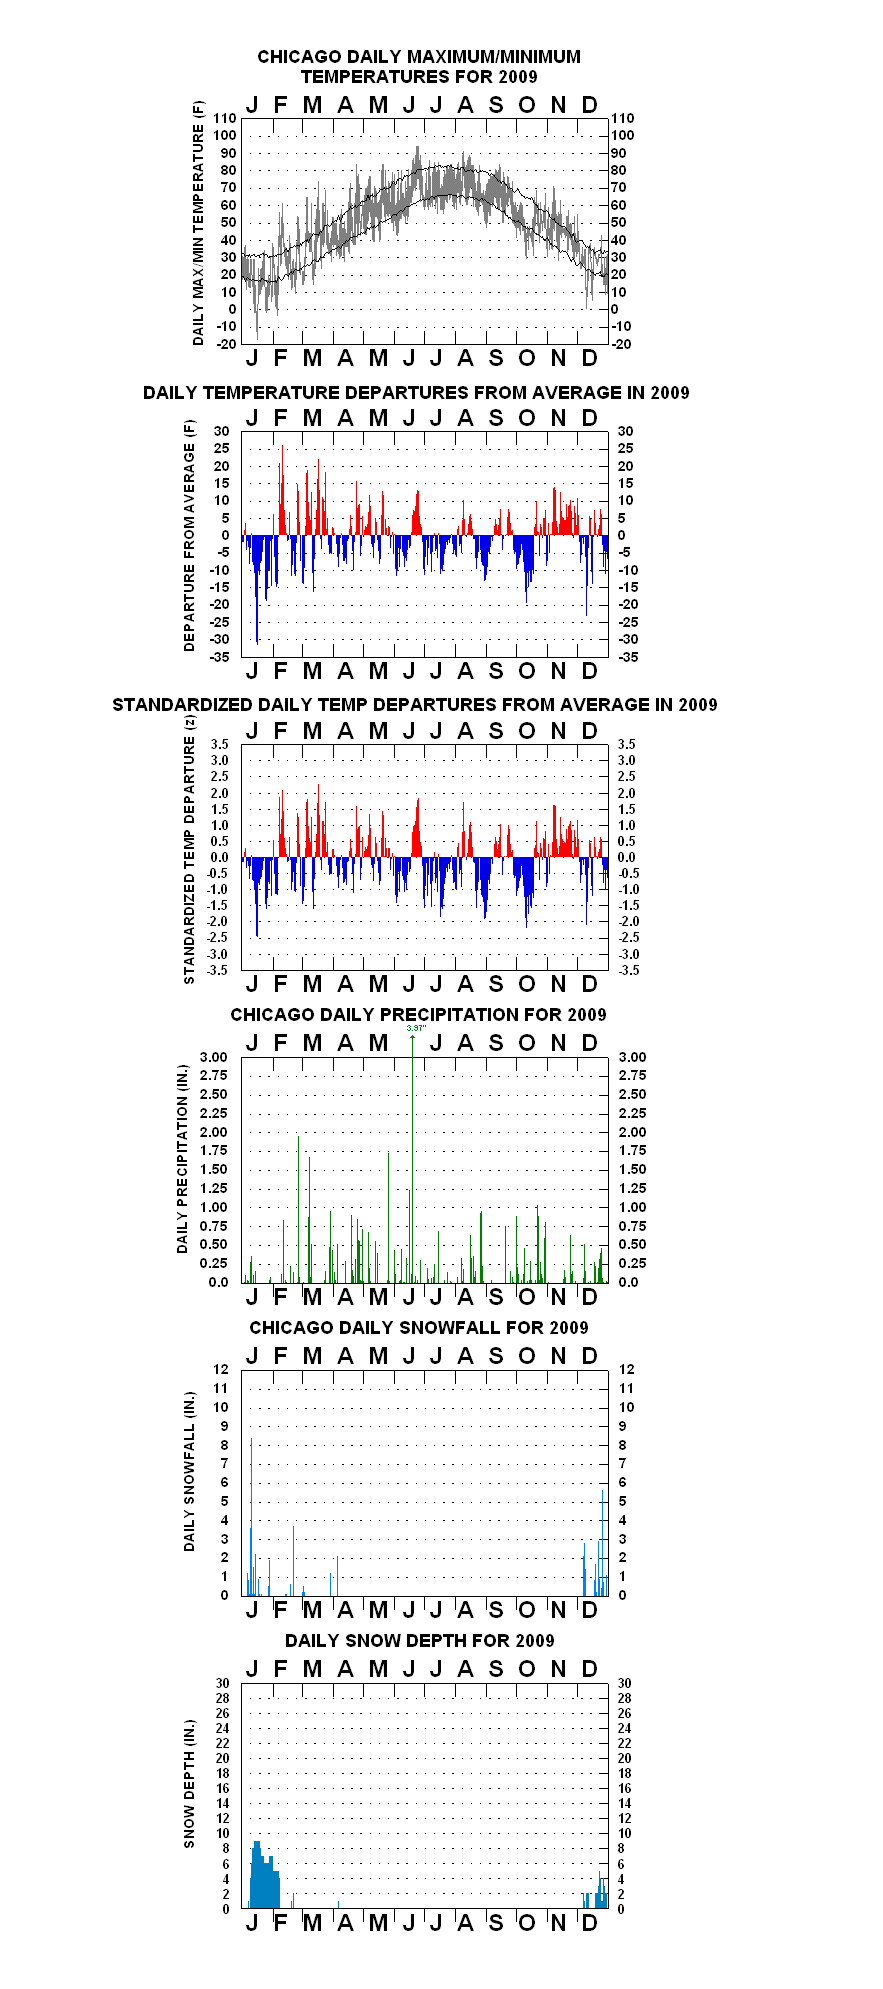
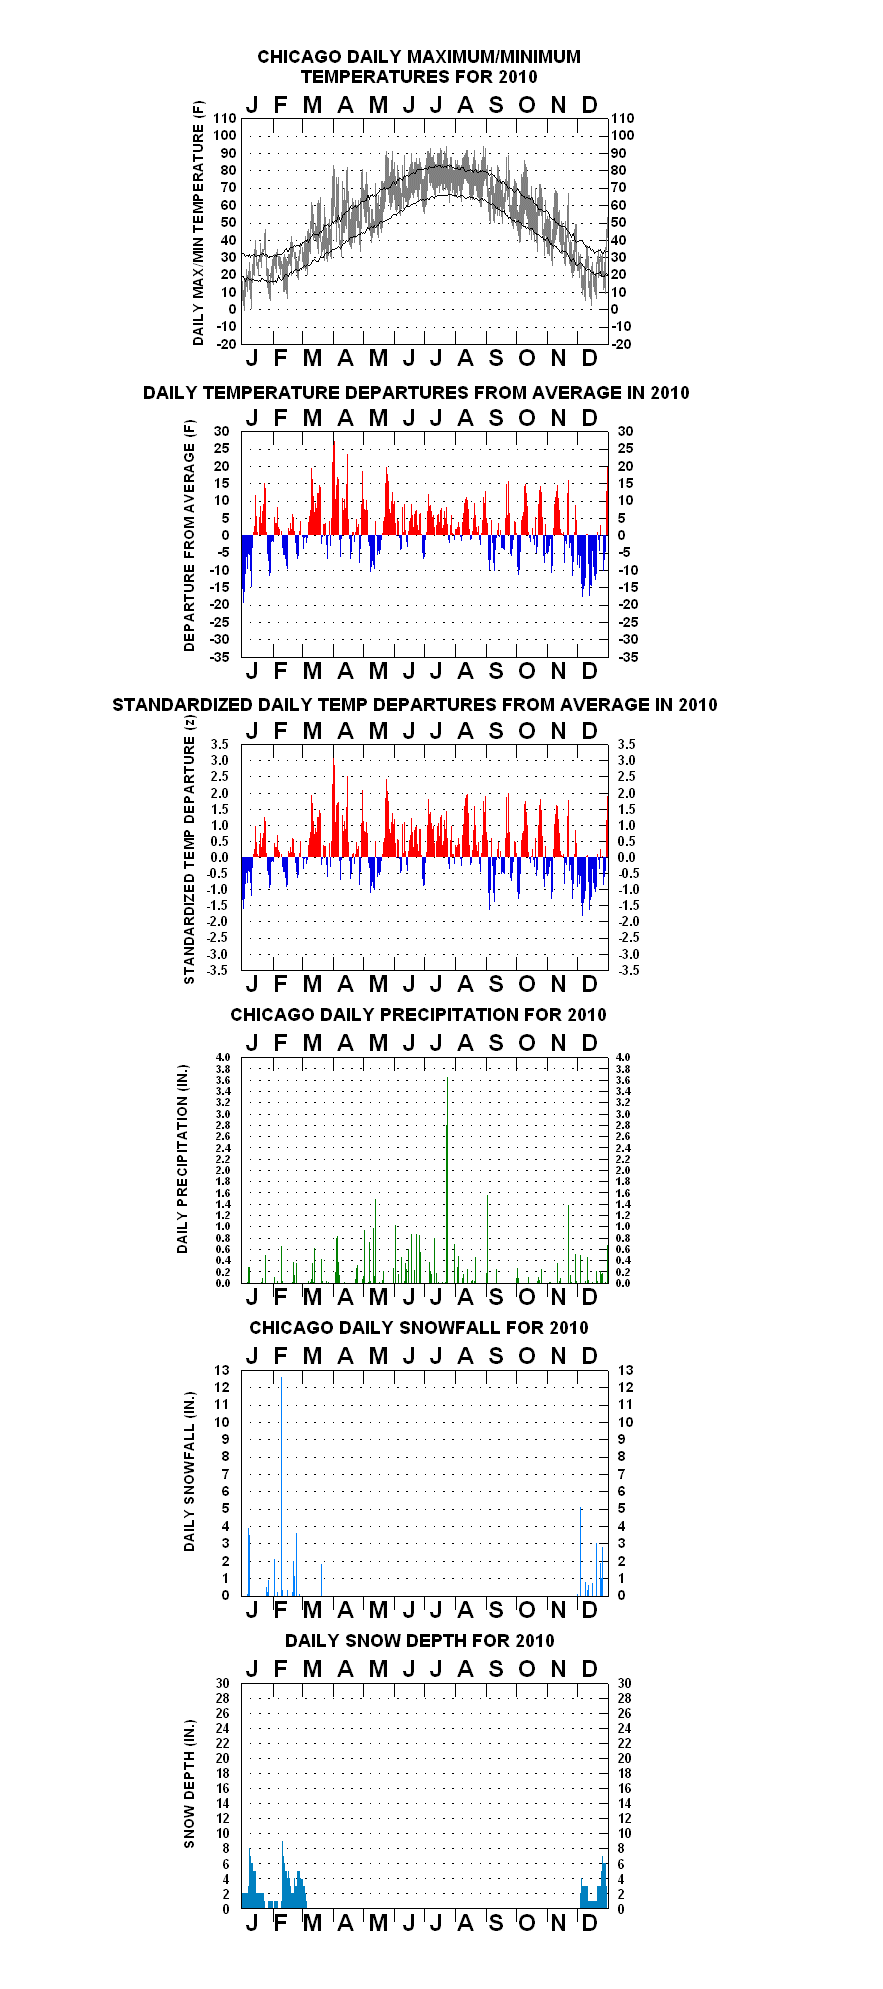
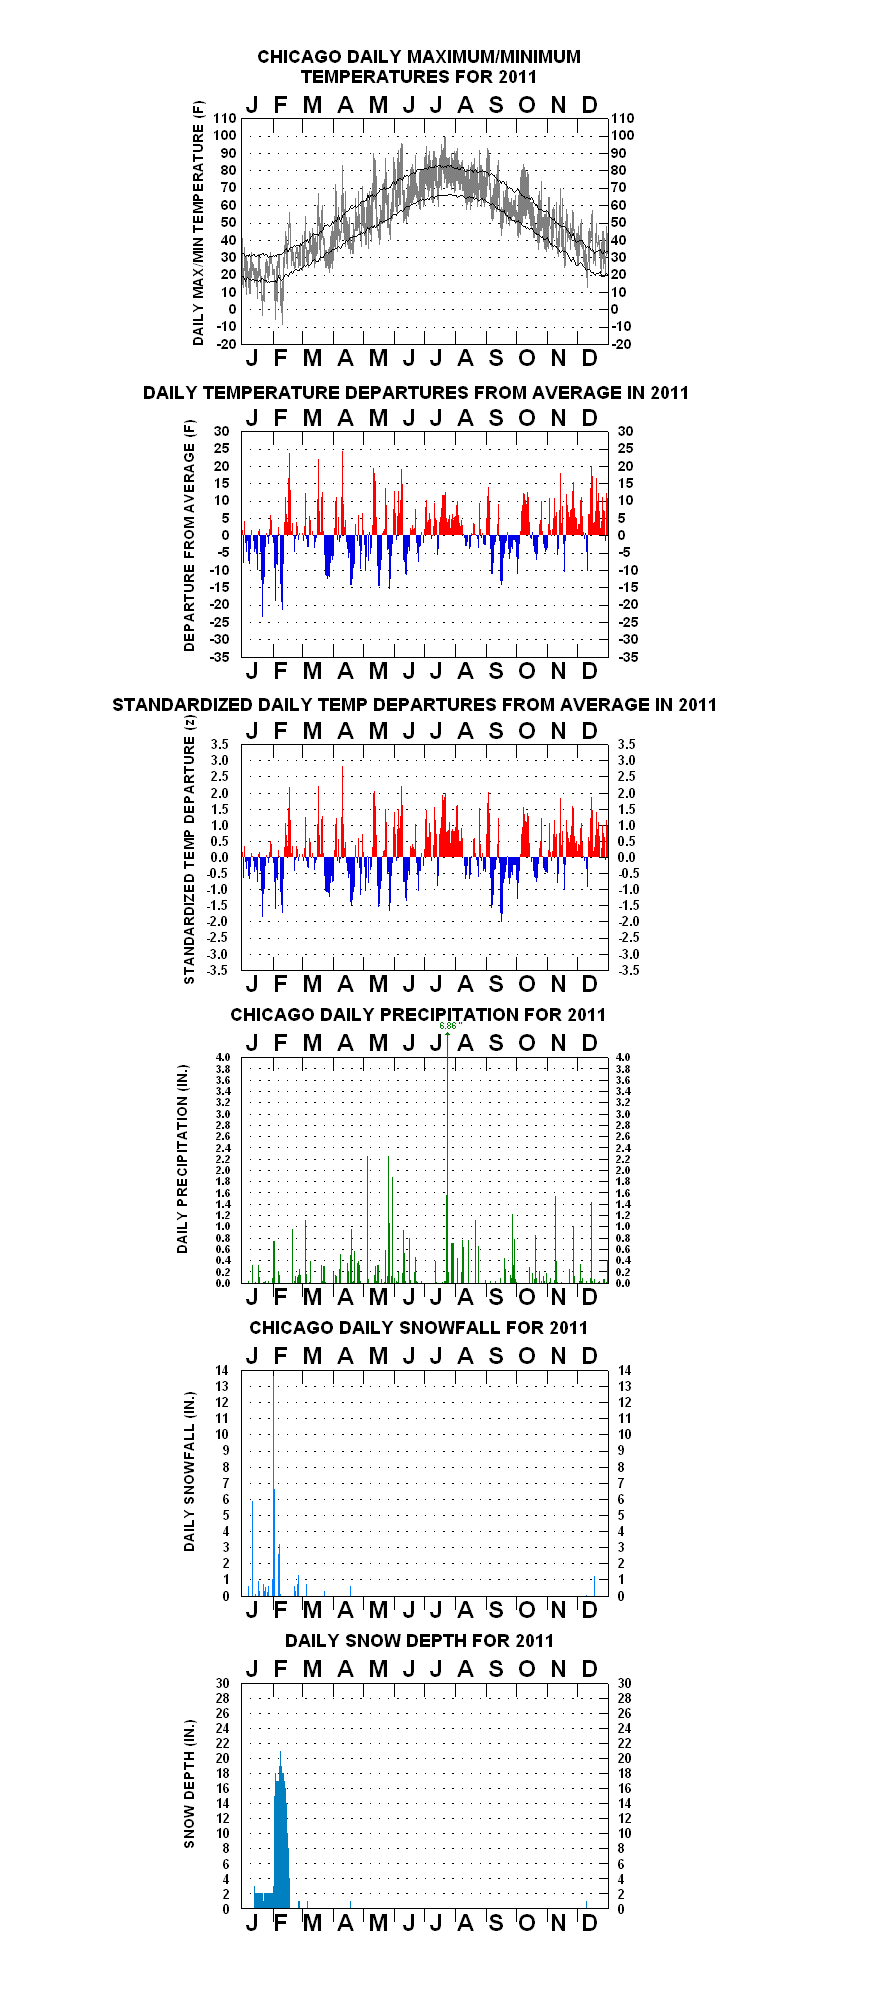
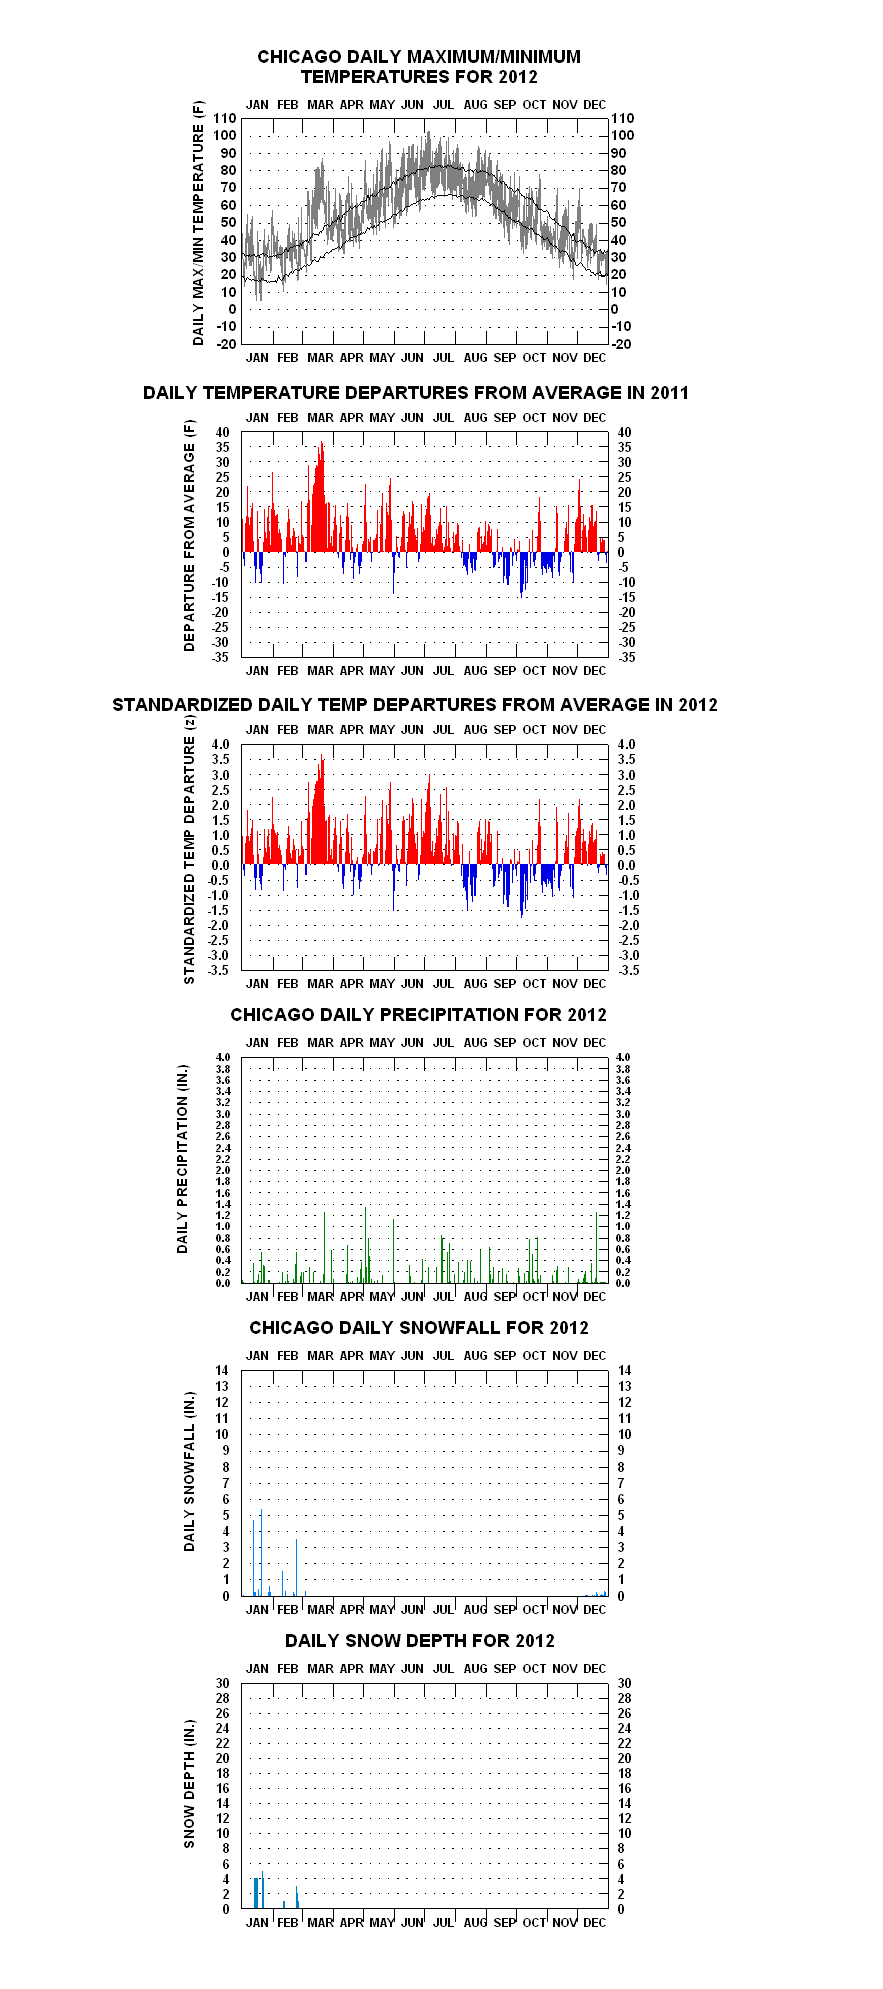
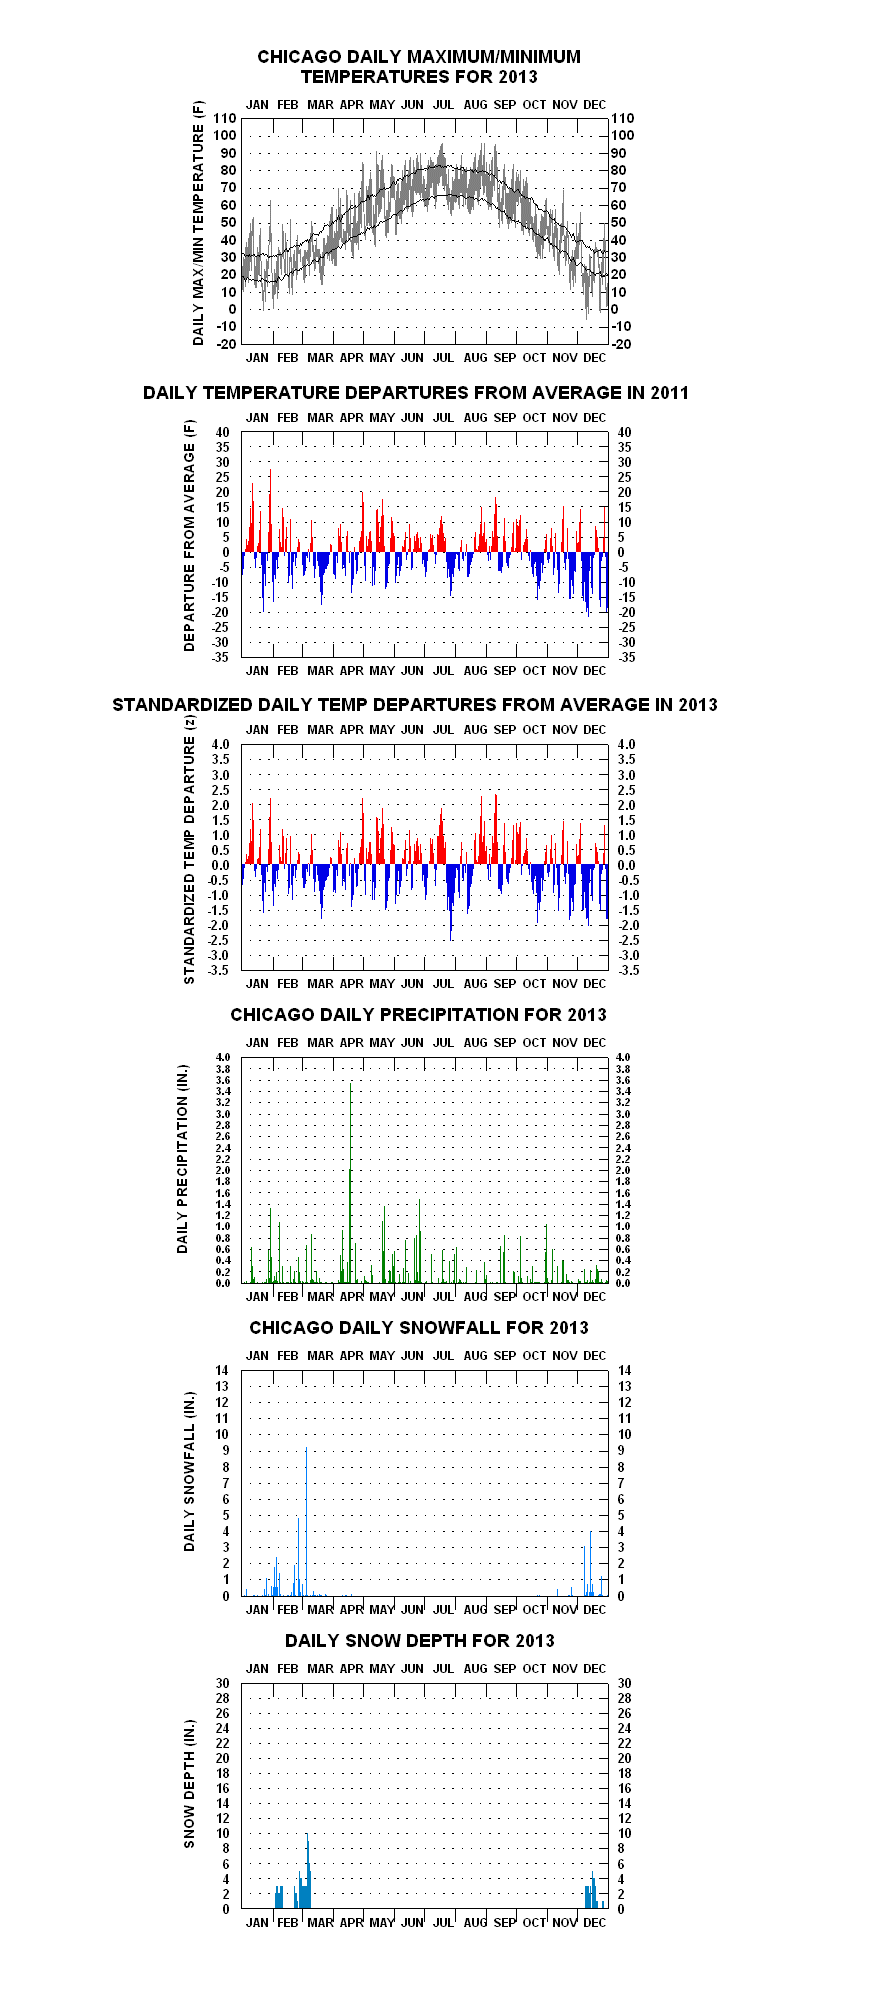
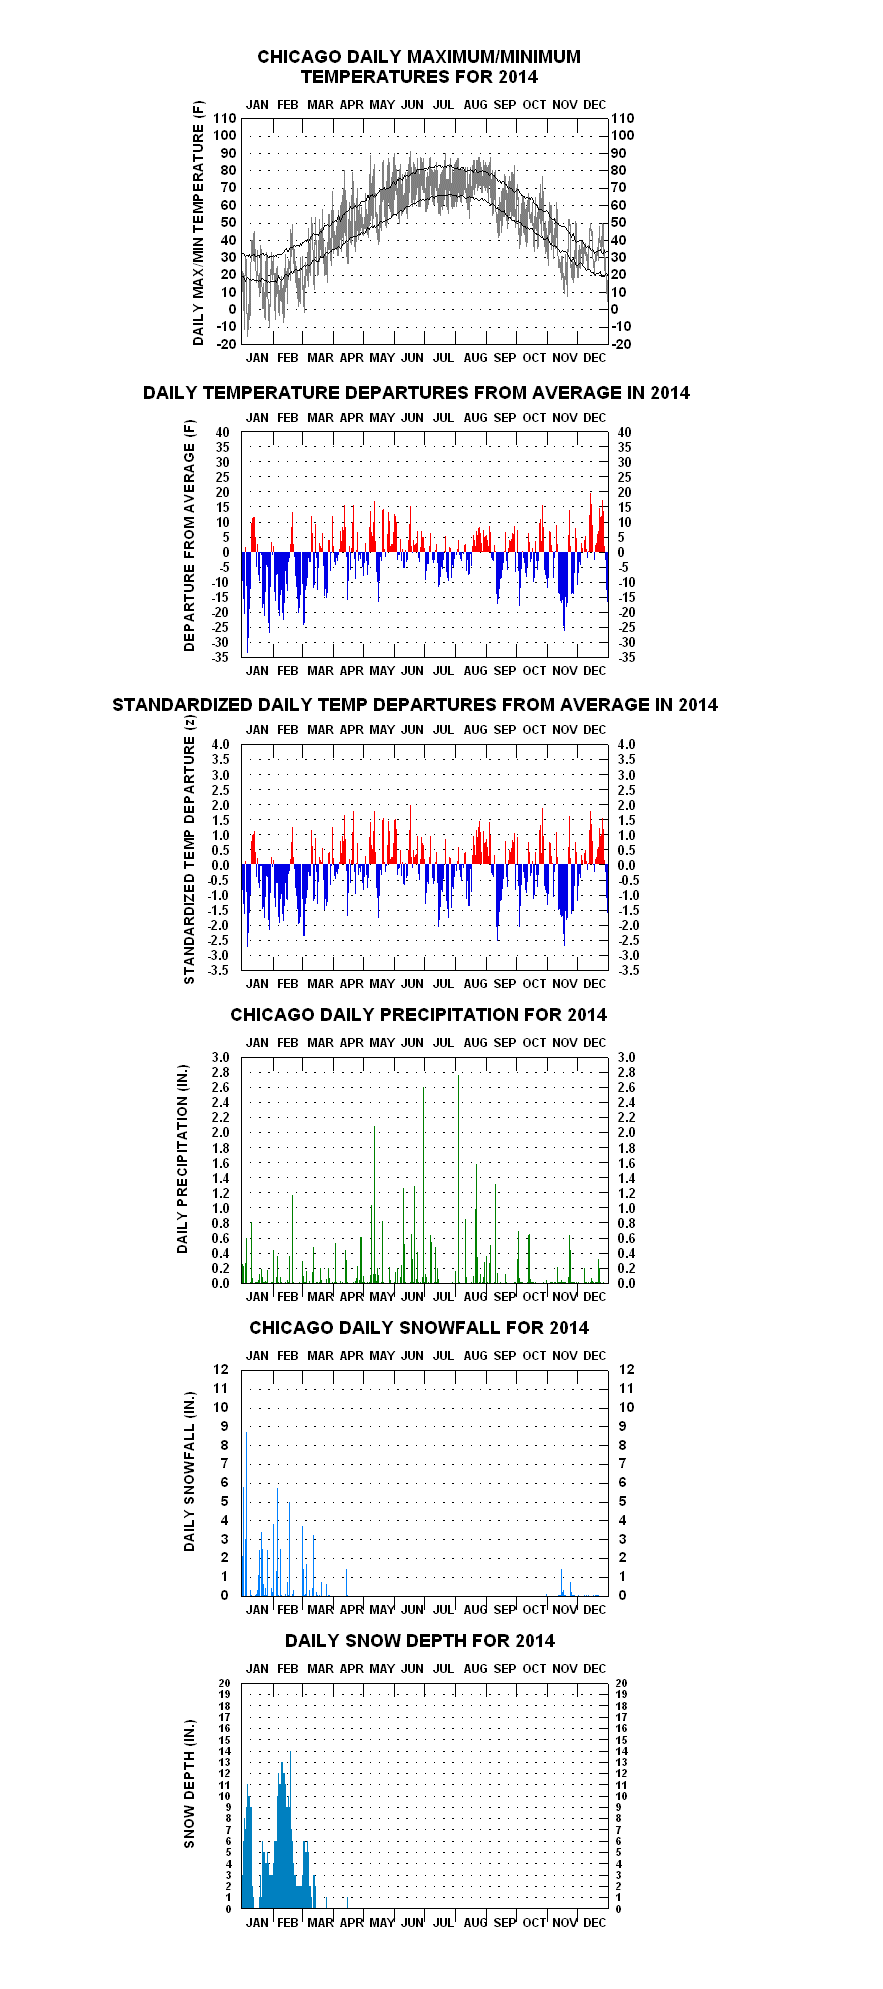
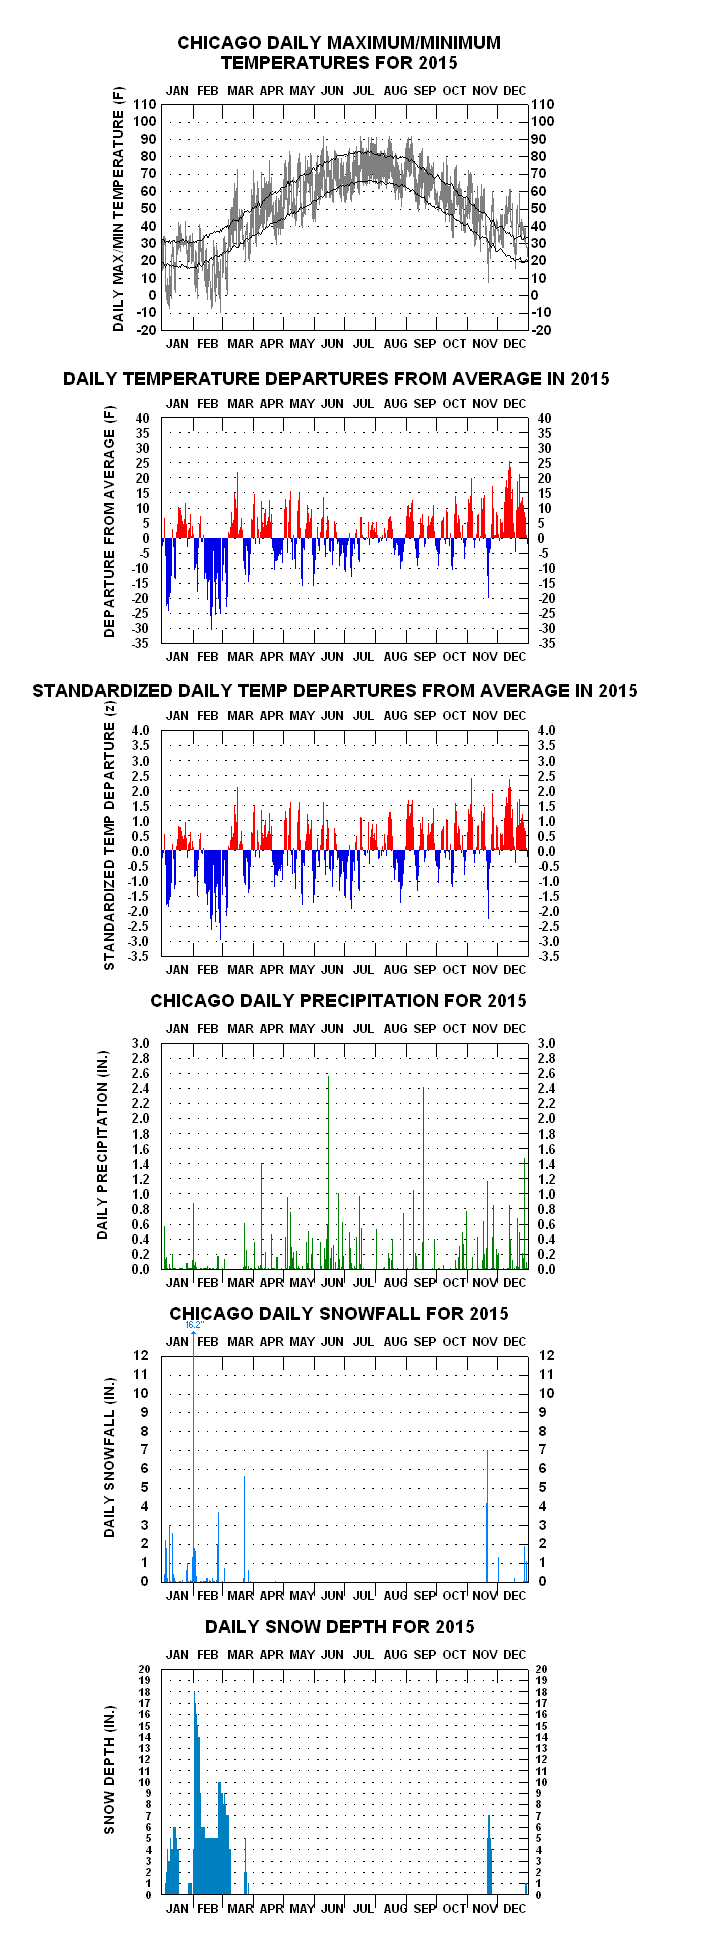
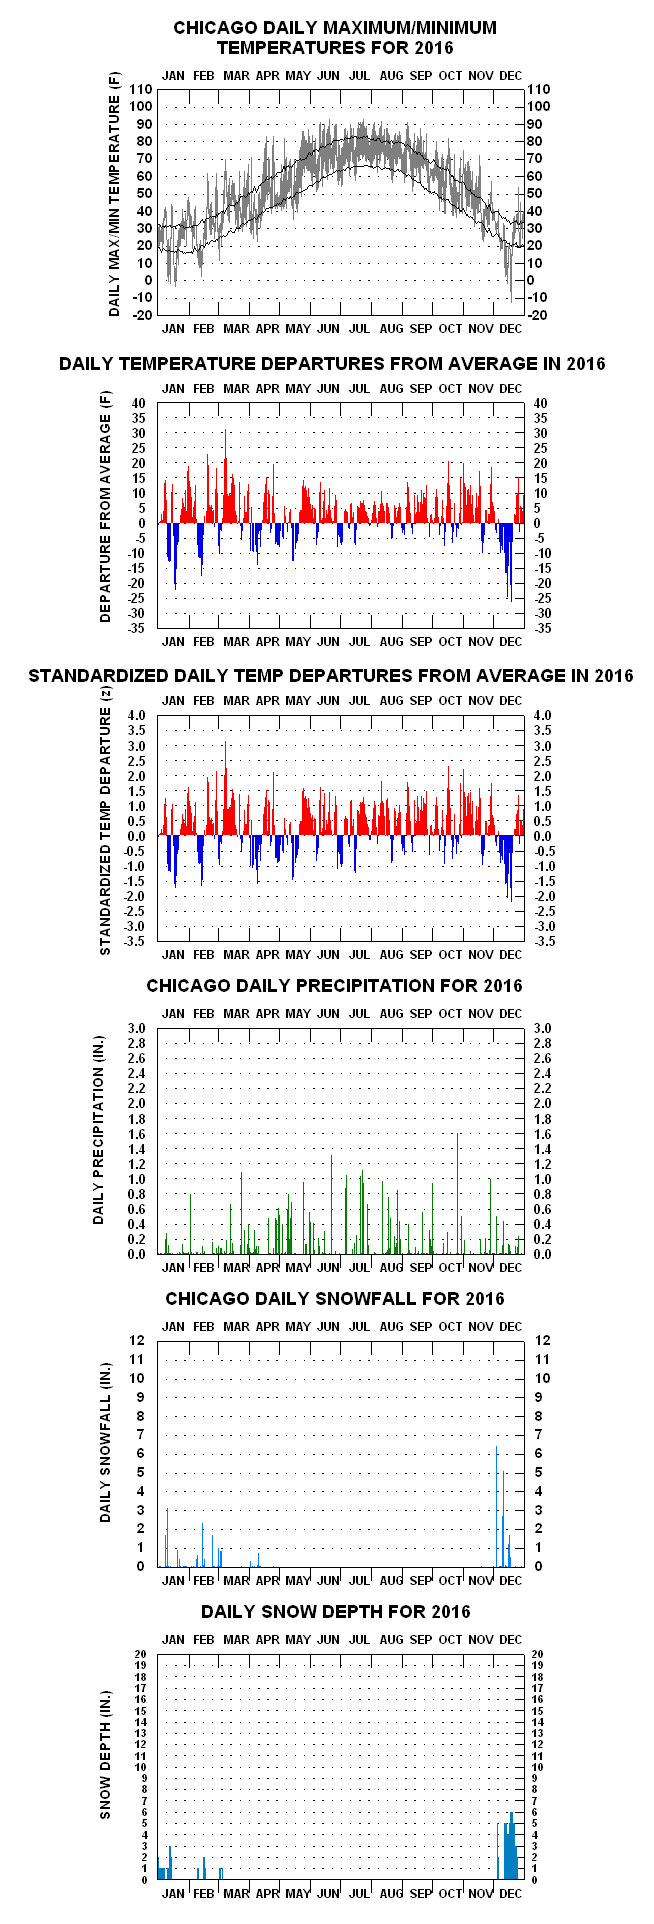
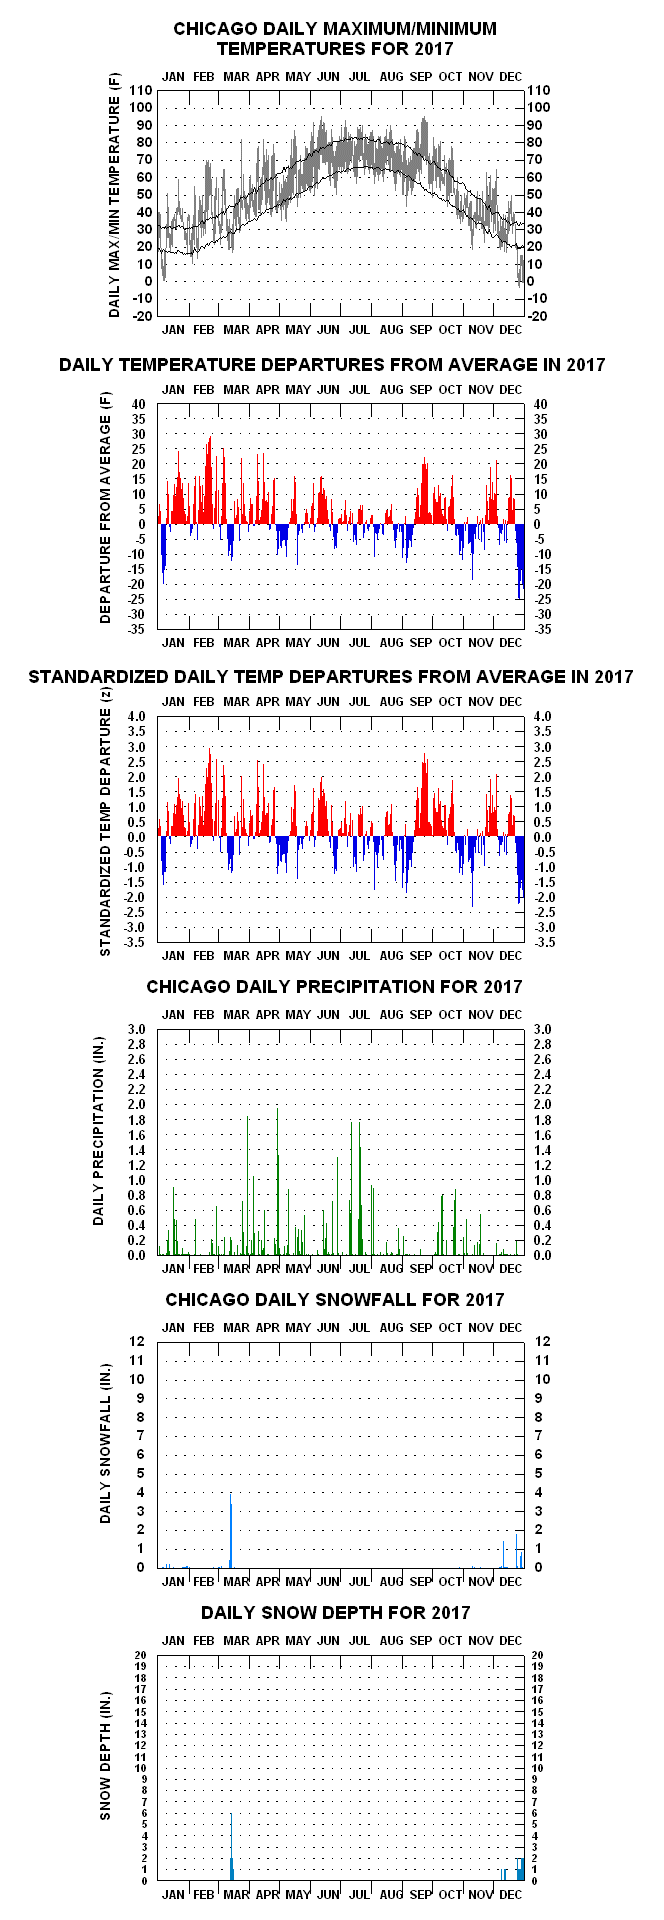
Repeat Links to Some of the More Interesting Year-to-Year Graphs, with Accompanying Notes
Prelude to Great Fire of 8-10 October, just 3.70” precipitation between 4 July and 8 October, 35% of average and driest such calendar period in all history down to present.
Minus 23 on 24 December, coldest December temperature in Chicago until –25 F in 1983 (also on Dec 24th).
Coldest year in all Chicago history down to present, also coolest Summer (June-August) and Fall (September-November).
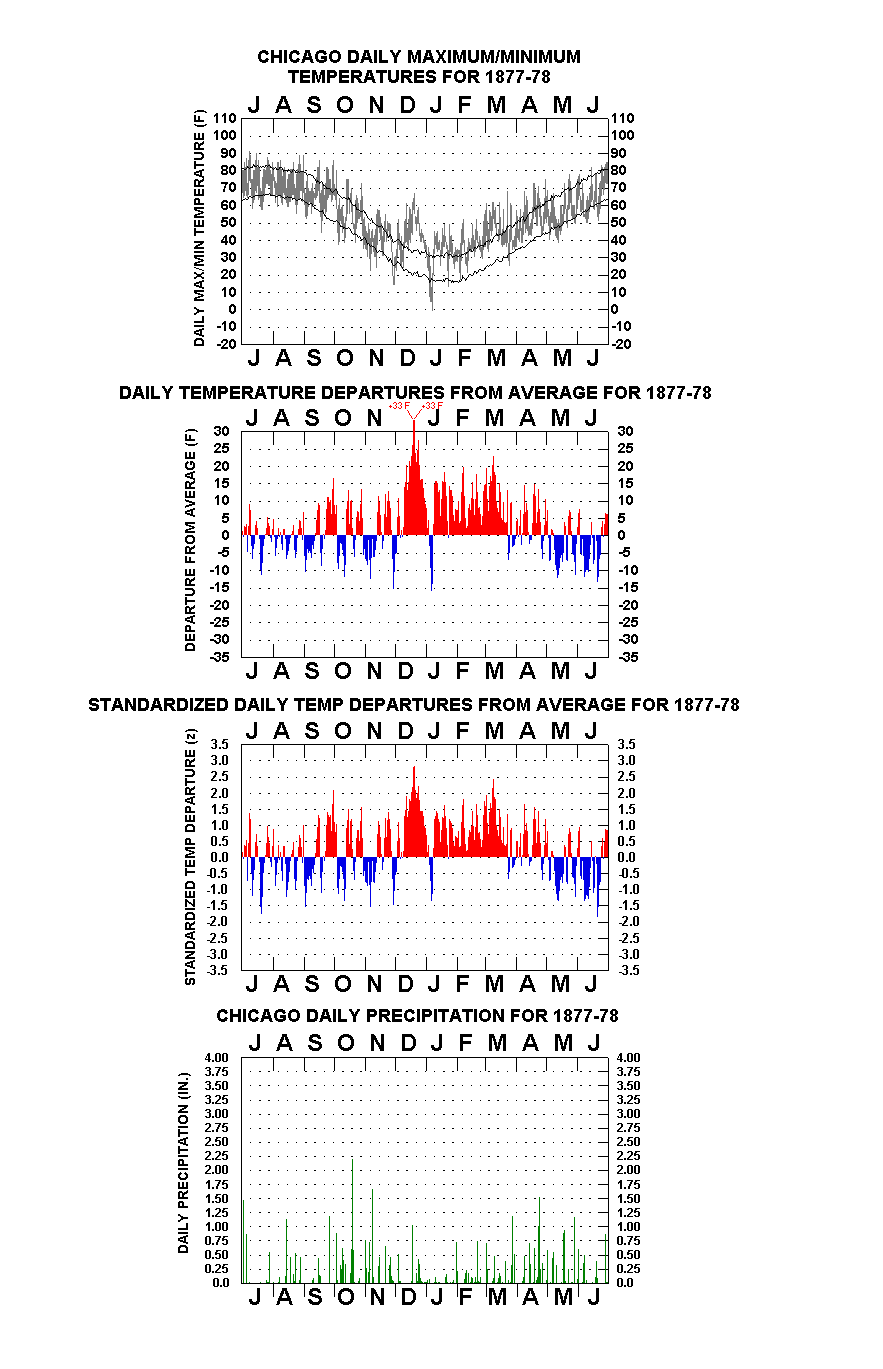
“Year Without a Winter” – Warmest winter (December-February) in all Chicago history down to present by 1.5 F, and warmest December-March by nearly 3 F.
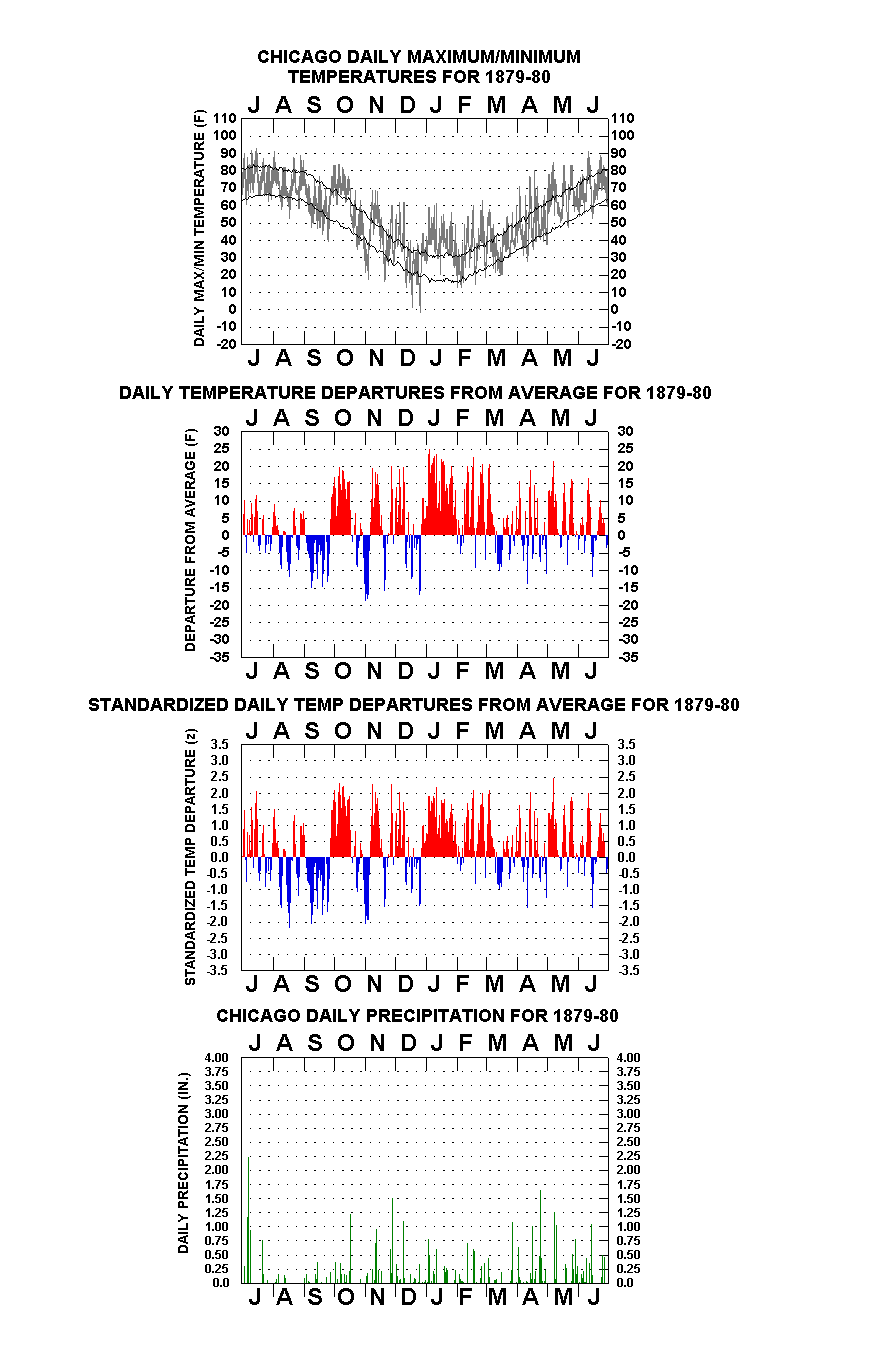
Great gyrating warm and cold spells from late-September through year-end 1879. January 1880 the warmest in Chicago history down to the present day (by more than 3 F).
Cool Summer followed by much above normal September, warmest calendar month of the year. Only such September in entire Chicago climatic history with this distinction.
Thirteen out of fourteen consecutive days with measurable rainfall in June. Wettest June (10.58”) in Chicago history.
Snowiest February in Chicago history (27.8”), but very forward April and May
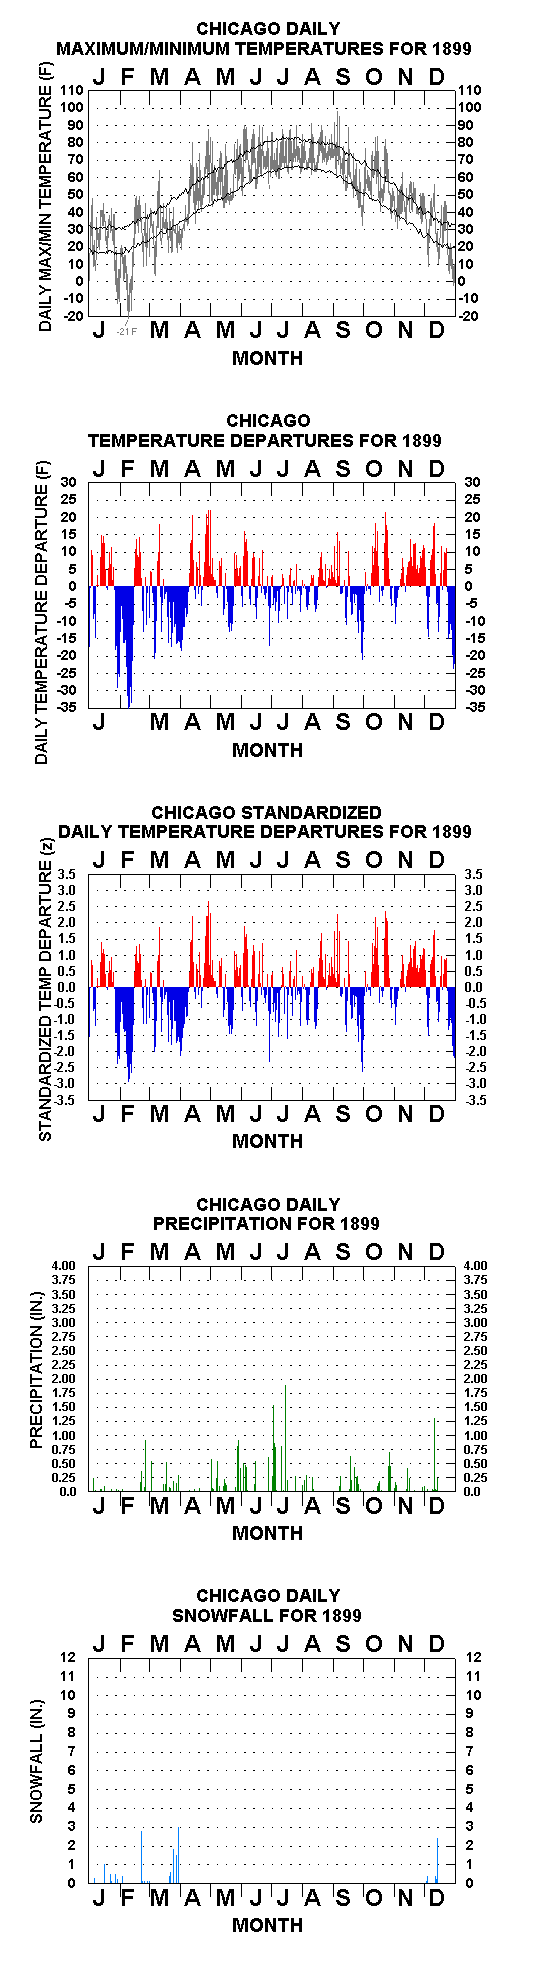
February cold wave drops mercury to –21 F on 9th.
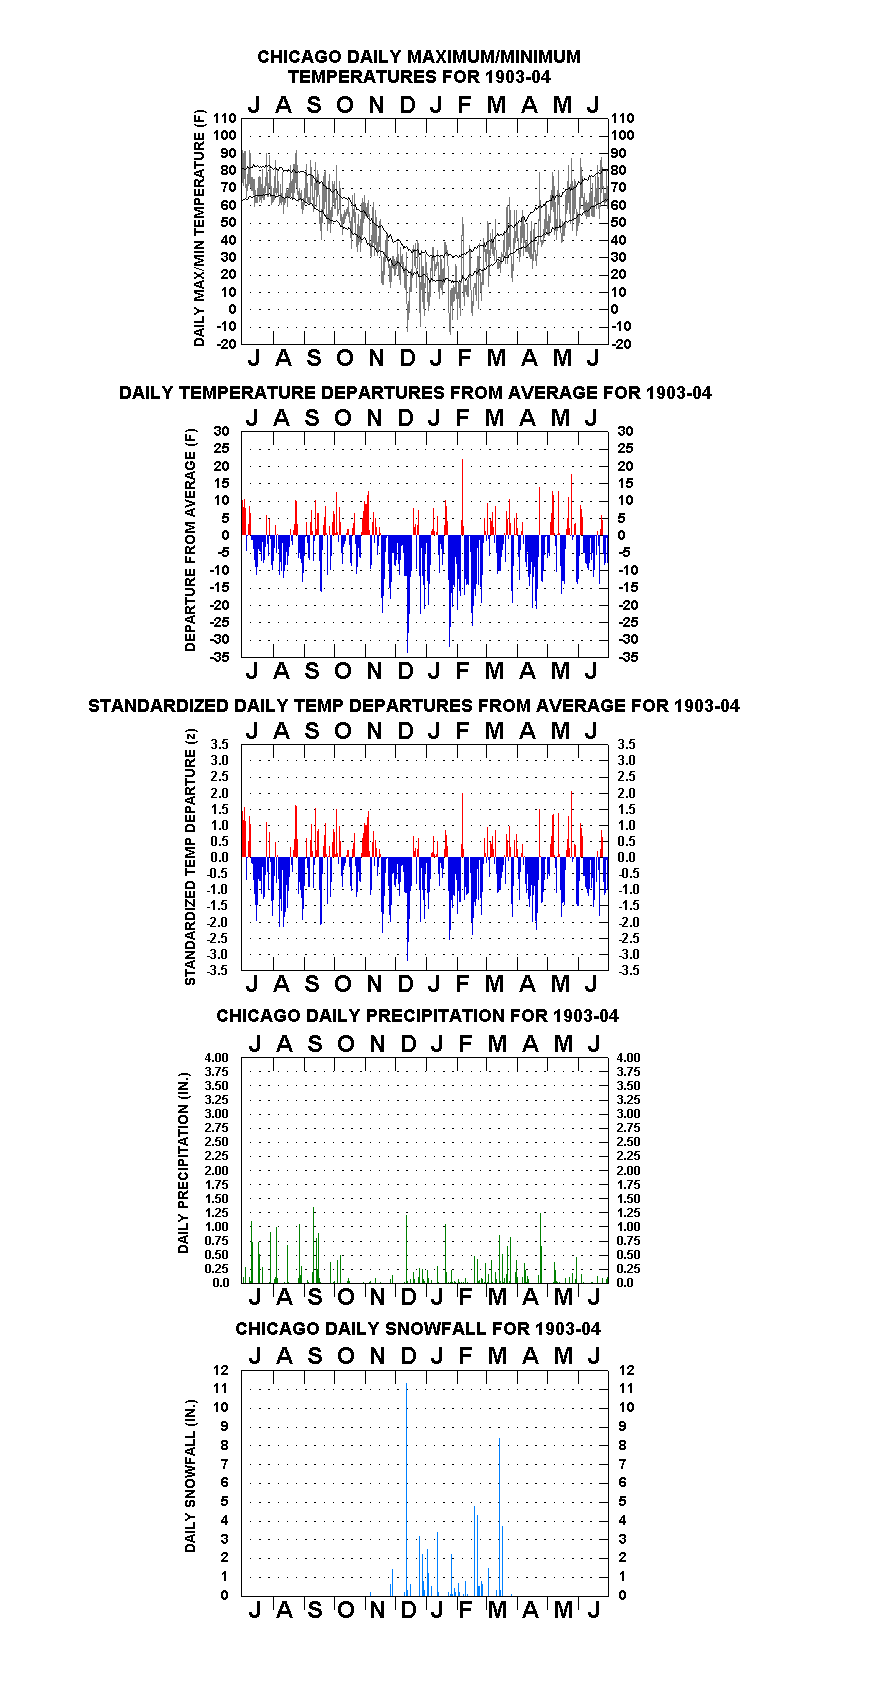
Coldest winter (December-February) in all Chicago history down to present.
Persistent above normal warmth over November and December.
Warmest April on record up to this time; but May 2 F colder than April. Second coolest Summer (June-August) in all Chicago climatic history.
42.5” snow in January, most ever for single calendar month in Chicago history. Snow depth 25” on 13 January, deepest on record until 1967.
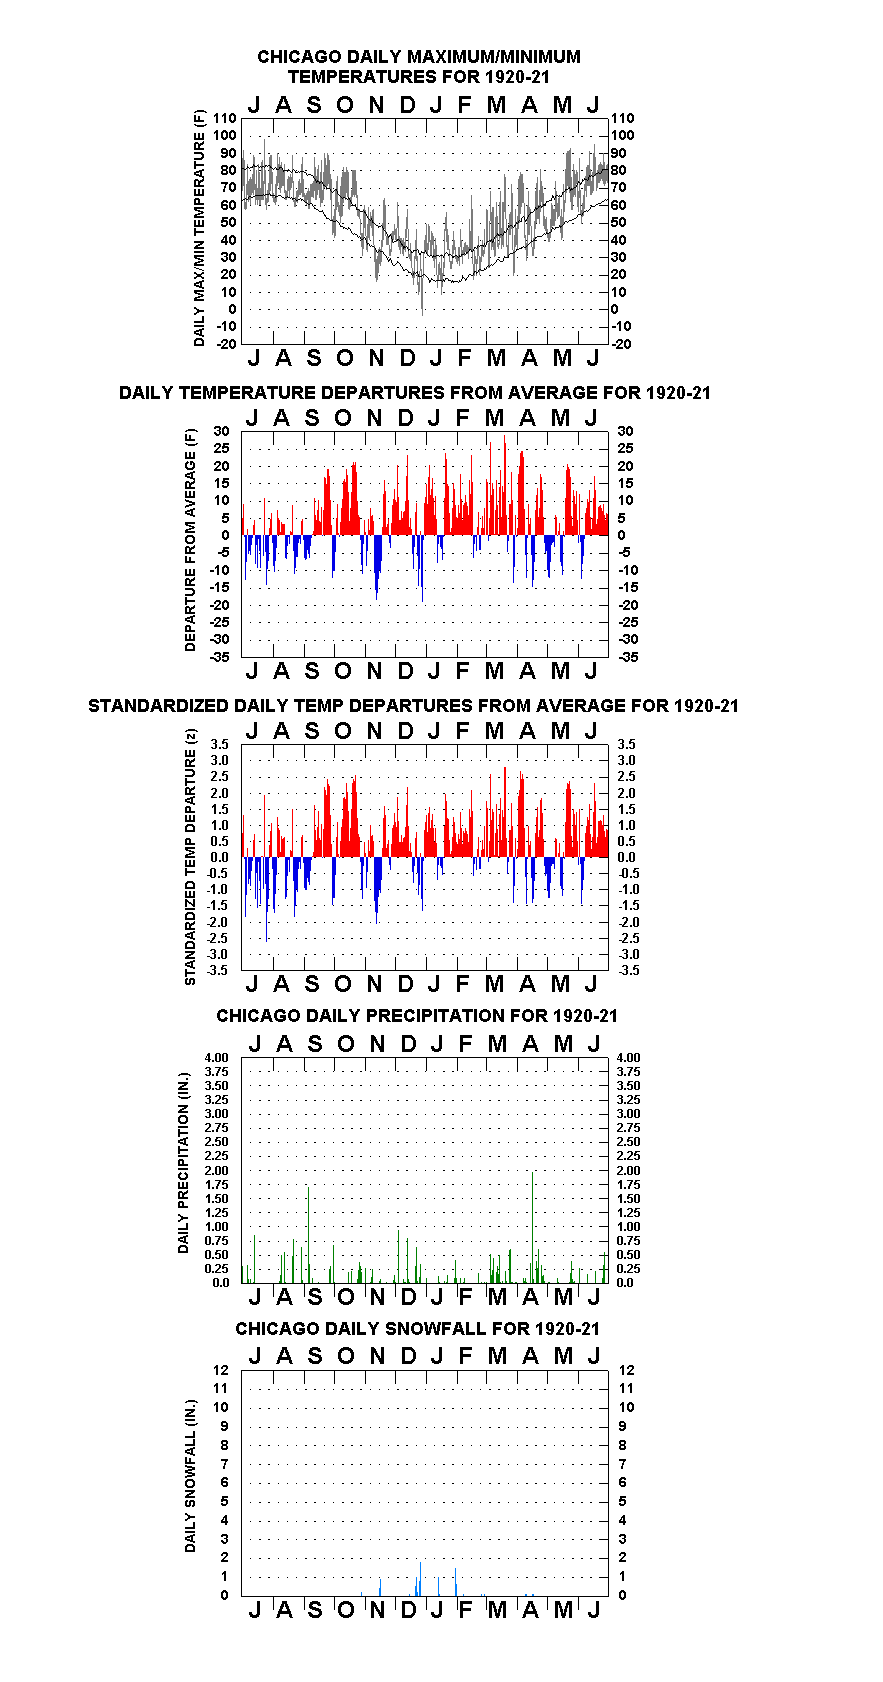
Most snow-free winter in all Chicago history (9.8” total).
Snowiest March on record in Chicago (23.6”), most of it received near month-end; 10-inch snow depth on 3 April.
Following a cool Summer, quasi-periodic much above normal temperature spells in September, October, & November.
90 F on 10-11 April, earliest 90 F daily maxima ever recorded in Chicago; 75 F on 19 November, warmest ever so late in season.
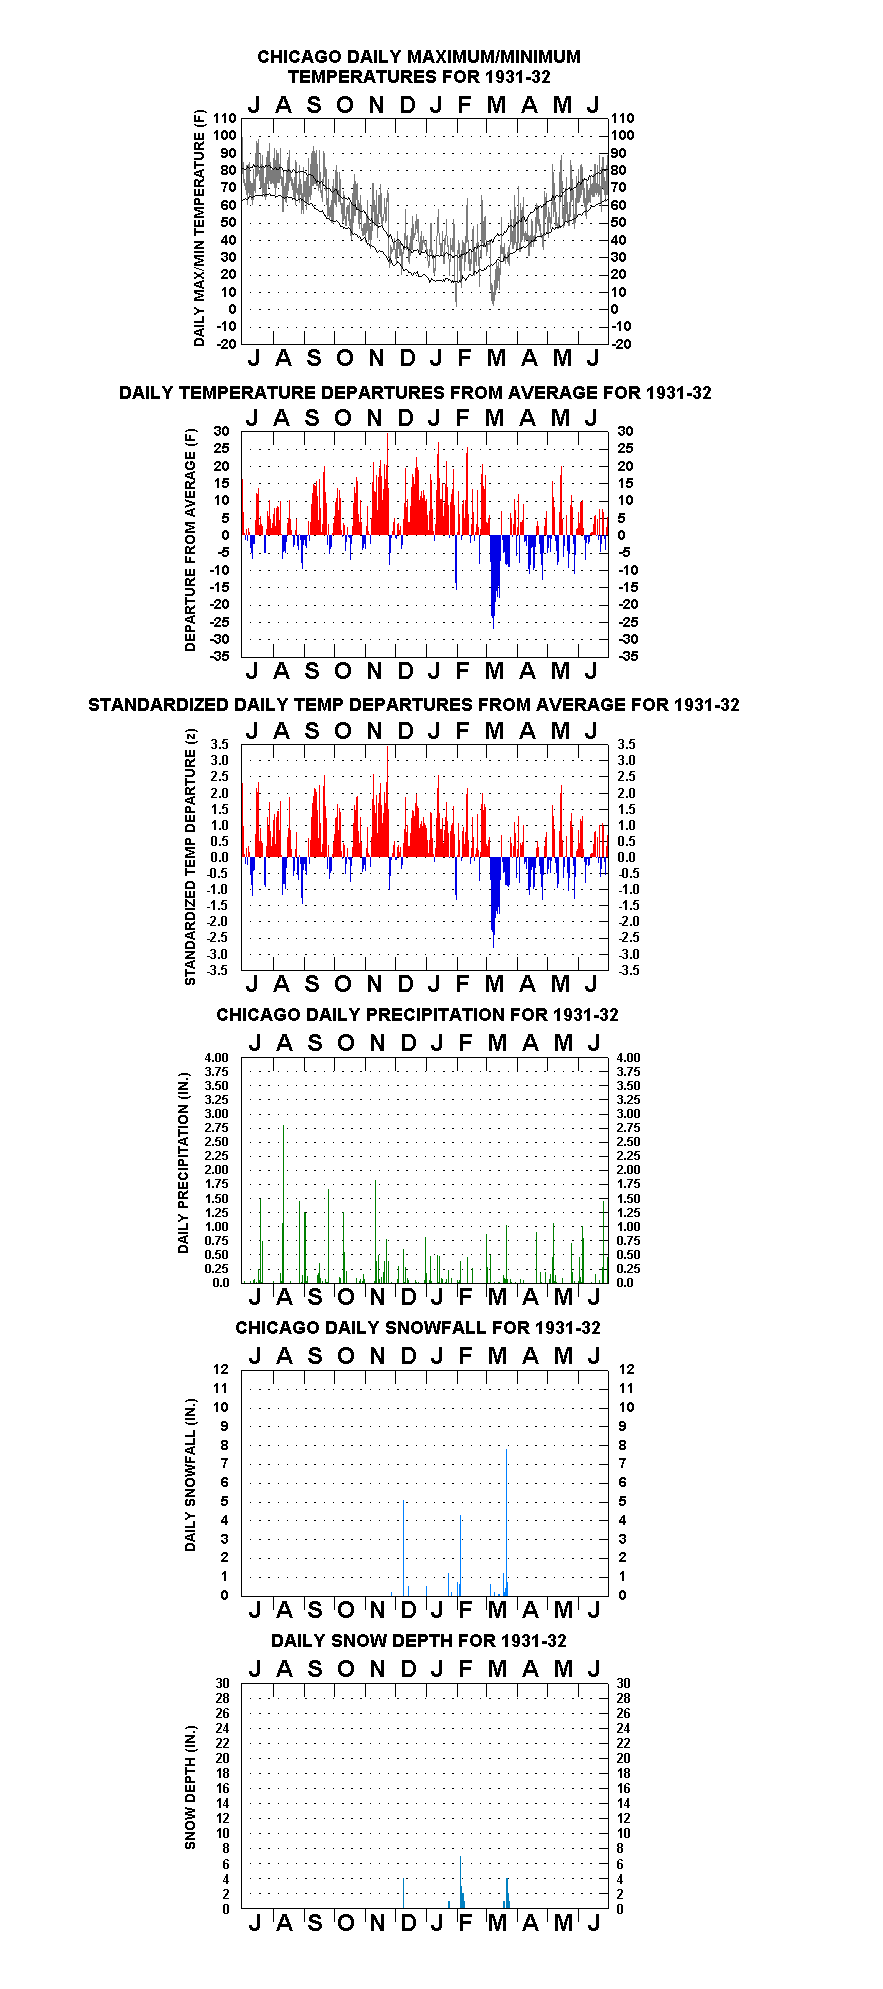
Following an almost complete absence of below normal temperatures over November to February, unseasonable cold sets in during March, coldest month of the ’31-’32 winter season by nearly 3 F.
102 F on 31 May; 105 F on 24 July (highest ever recorded at Chicago ‘official’ station).
Long cold siege from late January through most of February. Hot early July – 102 F on 10th.
13.6” total snowfall for April (snowiest in history).
Snowiest November (14.8”) in Chicago history.
Wettest April (8.33”) and warmest August in all Chicago history down to present.
67 F on 25 January, highest ever in calendar month January. Also 84 F on Halloween and 81 F on 1 November, but –1 F and –2 F on 23-24 November, respectively, earliest subzero readings in Chicago history.
Snowiest December (33.3”) in Chicago history down to present.
Quasi-periodic much above normal temperature spells over late-August through mid-November: 101 F on 1-2 September, 99 F on 29 September, 87 F on both 21-22 October, and 71 to 74 F readings over November 15th to 19th, inclusive.
Eleven-day run of 90 or higher daily maxima in June. More than 12” rain in October (wettest October in Chicago history.
Warmest summer (June-August) in all Chicago history down to present; also warmest calendar month (July: 81.3 F). April also warmest in Chicago climatic history.
Coldest March in all Chicago history down to present by more than 3 ½ F. 1961 – More than 14” rain in September.
Driest year (22.22”) in Chicago history down to present.
Coldest January since 1912, warmest October in all Chicago history down to present.
Great 23-inch snowstorm over 26-27 January; 27-inch snow depth in early February.
80 F on 3 March, earliest 80 F degree temperature ever recorded in Chicago.
75 F on 27 February, highest ever so early in season in Chicago.
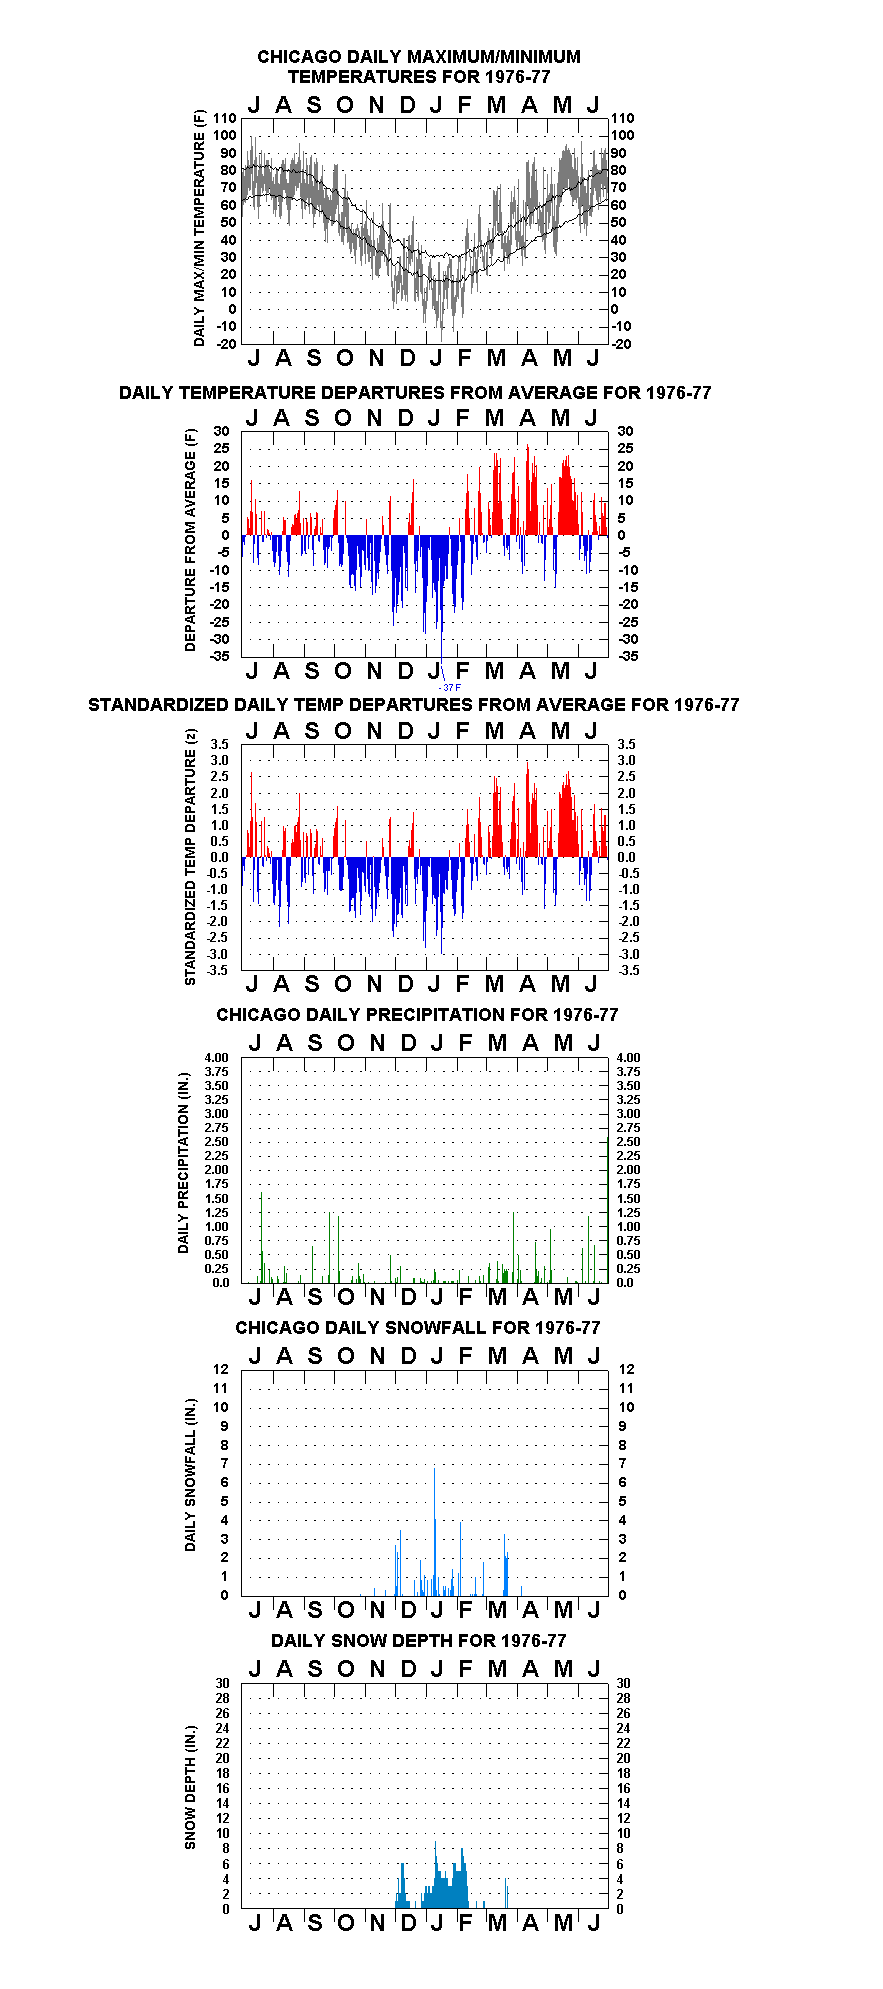
Great thermal anomaly “flip-flop” between successive four-month periods: October-January coldest such period on record, February-May the warmest on record. January coldest calendar month in Chicago history (10.1 F).
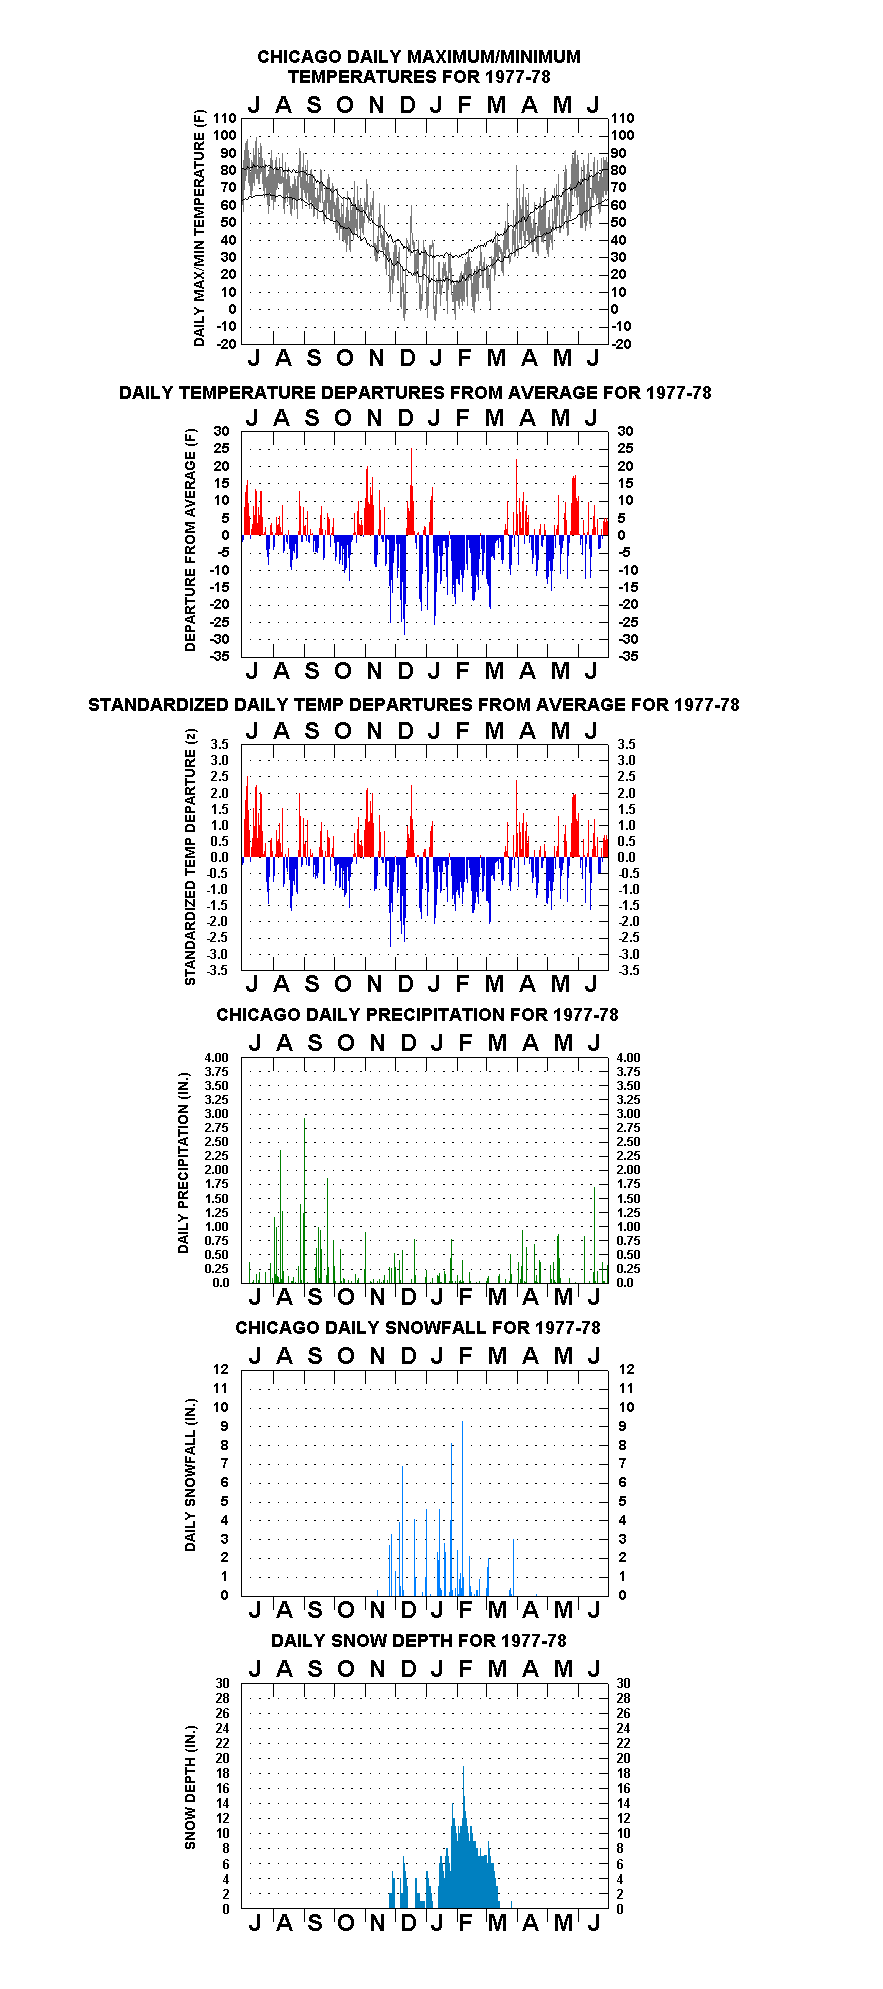
Snowiest season in Chicago history up to this time (85.3”).
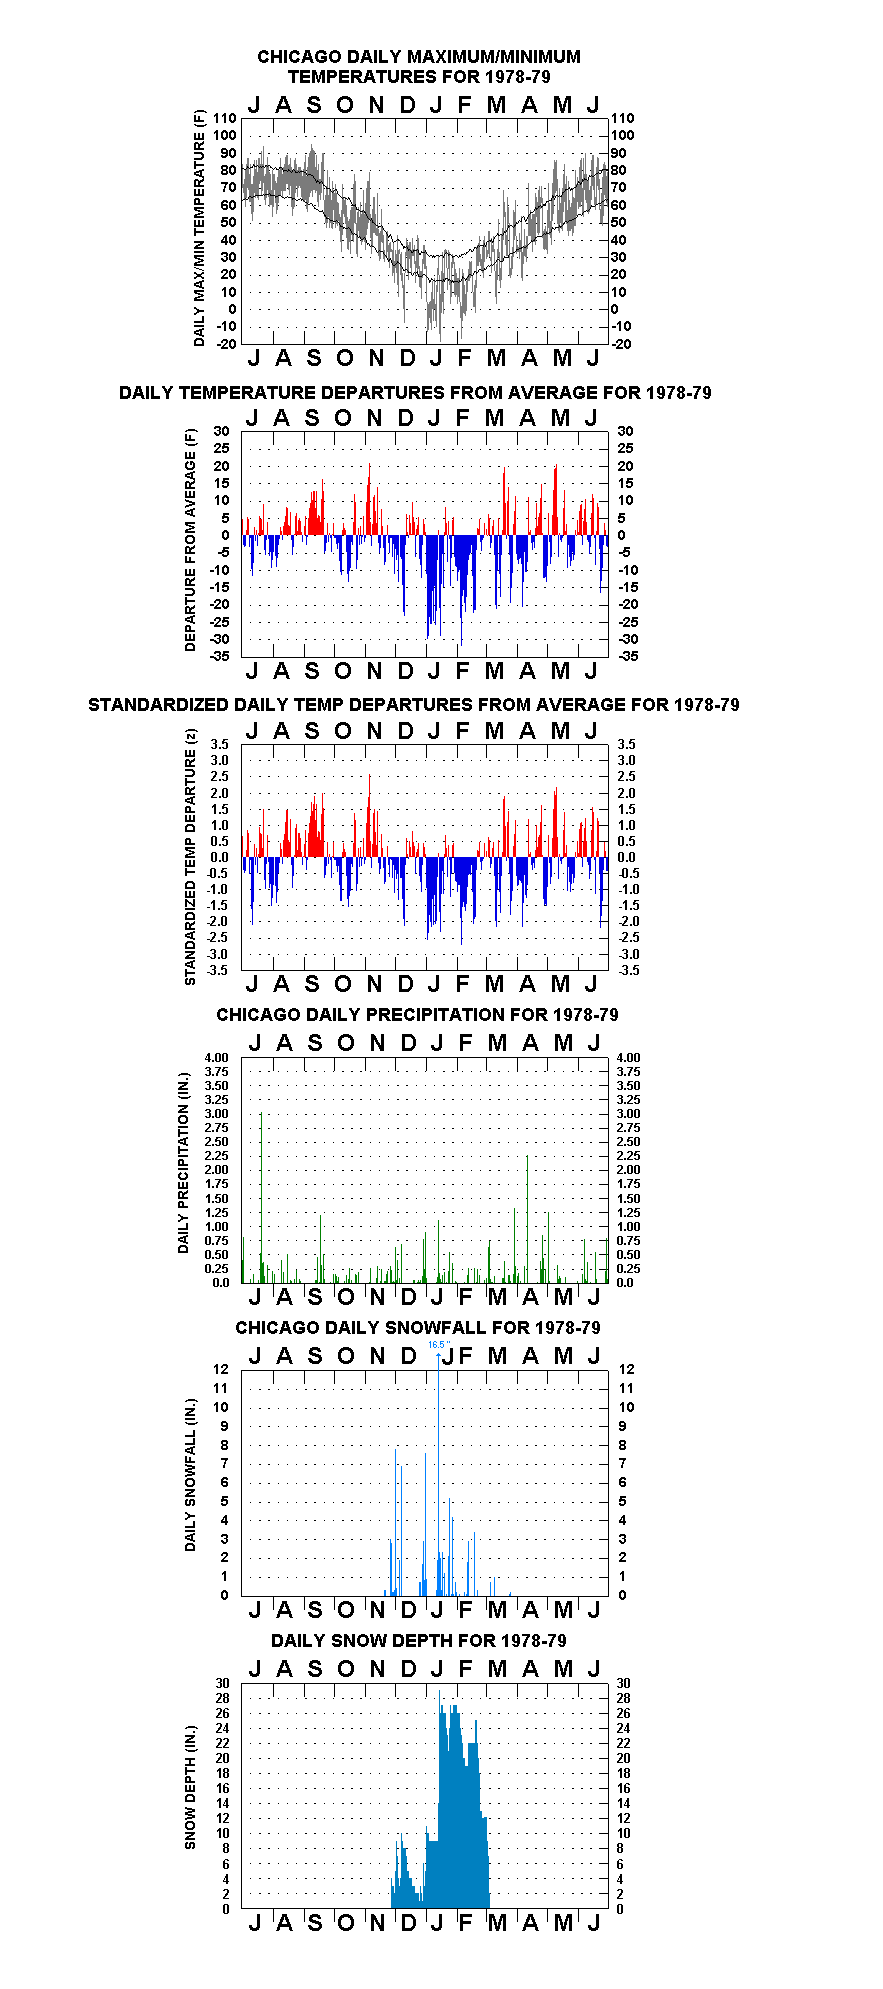
Heaviest snow season record broken for Chicago (89.7”) after just one year. Ninety-eight consecutive days with measurable snow cover (27 Nov to 4 Mar). Record all-time snow depth on 14 Jan (29 inches).
September driest calendar month in Chicago history (0.01”).
Minus 26 on 10 January; Minus 25 on 16 January. Wettest December (8.56”) in Chicago history; 71 F on 2 December.
Great El Nino year. Wettest calendar year in Chicago history (49.35”) up to this point. Coldest December, -25 F on 24th.
Coldest year since 1917. Minus 27 recorded on 20 January – coldest temperature in all Chicago history down to present. Wettest November (8.22”) in Chicago history.
88 F on 29 March, highest ever so early in season in Chicago.
August wettest calendar month in Chicago history (17.10”).
104 F on 20 June, 103 F on 25 June, but coldest October since 1925.
6.3” snow in October, cold December.
33 F on 27-28 May, 38 F on 21 June – all coolest so late in season marks. Coolest Summer (June-August) since 1915.
Second warmest summer (76.3 F) on record (to 1955’s 76.4 F); 104 F on 13 July. But 32 F on 22 September, earliest 32 F or lower temperature on record.
The other great El Nino year of the 20th century. Warmest year in Chicago since 1931.
18.6” snow on 2 January, all-time Chicago heavy snow record for individual calendar day; 70 F on 11 February.
Exceptionally mild late February to early March: 72 F on 25 Feb, 78 F on 6 and 7 March. Second coldest December in Chicago history.
Driest calendar year in Chicago (24.09”) since 1962 (22.22”).
Mildest January in Chicago since 1933.
Wettest calendar year in Chicago history (50.86”).
Warmest March in history by nearly 5 F
16.2" Snow on 1 February
Late September Heat Wave - Seven straight 90+ F days.
*Member, American Meteorological Society
Data Collection 07Analytics
Sample Regimes, PCA Modes, PDFs & Extremes+
Temperature+
Regimes+
Sample analysis: group years by recurring temperature patterns for Chicago, then compare transitions between common, unusual and persistent regimes. This is sample Analytics content for layout and workflow testing. Replace it with the station’s verified analysis when the final material is ready.
Extremes+
Sample analysis: review the upper and lower tails of the heat and cold record for Chicago and identify years that merit detailed chart interpretation. This is sample Analytics content for layout and workflow testing. Replace it with the station’s verified analysis when the final material is ready.
Wind+
PCA Modes+
Sample analysis: demonstrate how leading modes can separate broad wind variability variability from shorter-lived anomalies at Chicago. This is sample Analytics content for layout and workflow testing. Replace it with the station’s verified analysis when the final material is ready.
Extremes+
Sample analysis: review the upper and lower tails of the high-wind events record for Chicago and identify years that merit detailed chart interpretation. This is sample Analytics content for layout and workflow testing. Replace it with the station’s verified analysis when the final material is ready.
Snow+
PDFs+
Sample analysis: compare the central distribution and tail behavior of seasonal snowfall observations at Chicago. This is sample Analytics content for layout and workflow testing. Replace it with the station’s verified analysis when the final material is ready.
Extremes+
Sample analysis: review the upper and lower tails of the snowfall record for Chicago and identify years that merit detailed chart interpretation. This is sample Analytics content for layout and workflow testing. Replace it with the station’s verified analysis when the final material is ready.
Continue Exploring
Compare Climate History Across Every Station
Browse domestic and international climate archives, long-term trends and original statistical visualizations.