

Station Overview
Graphical Climatology of Oxford, UK Temperatures, Precipitation, and Sunshine (1815–2025)
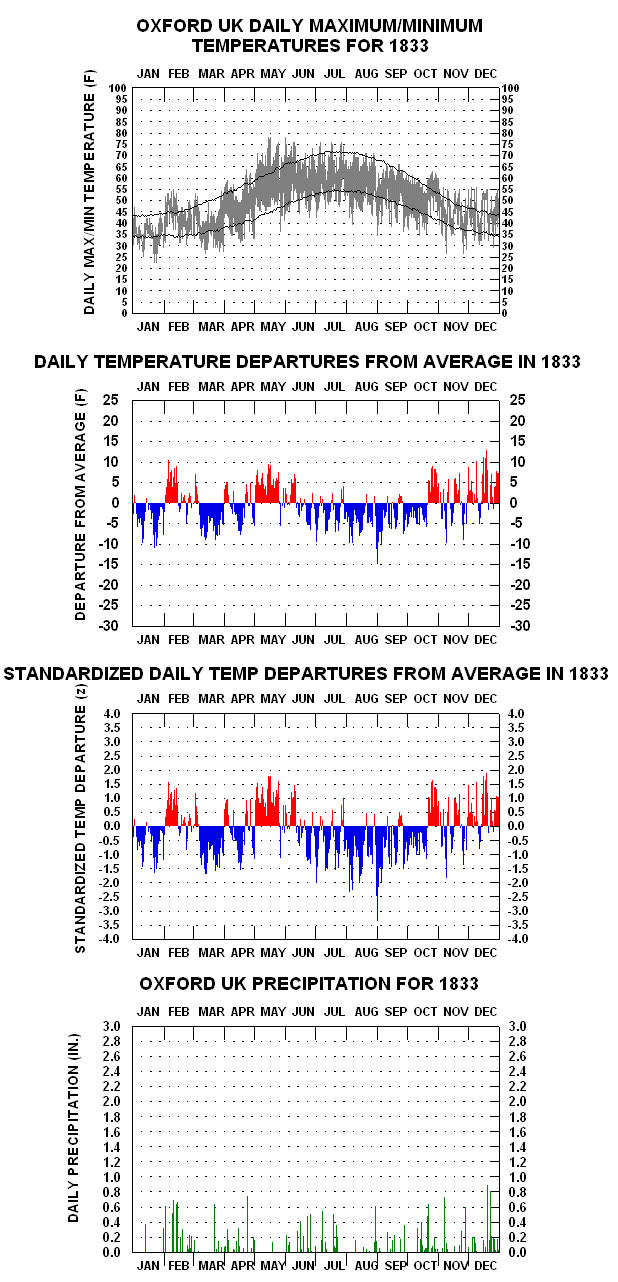
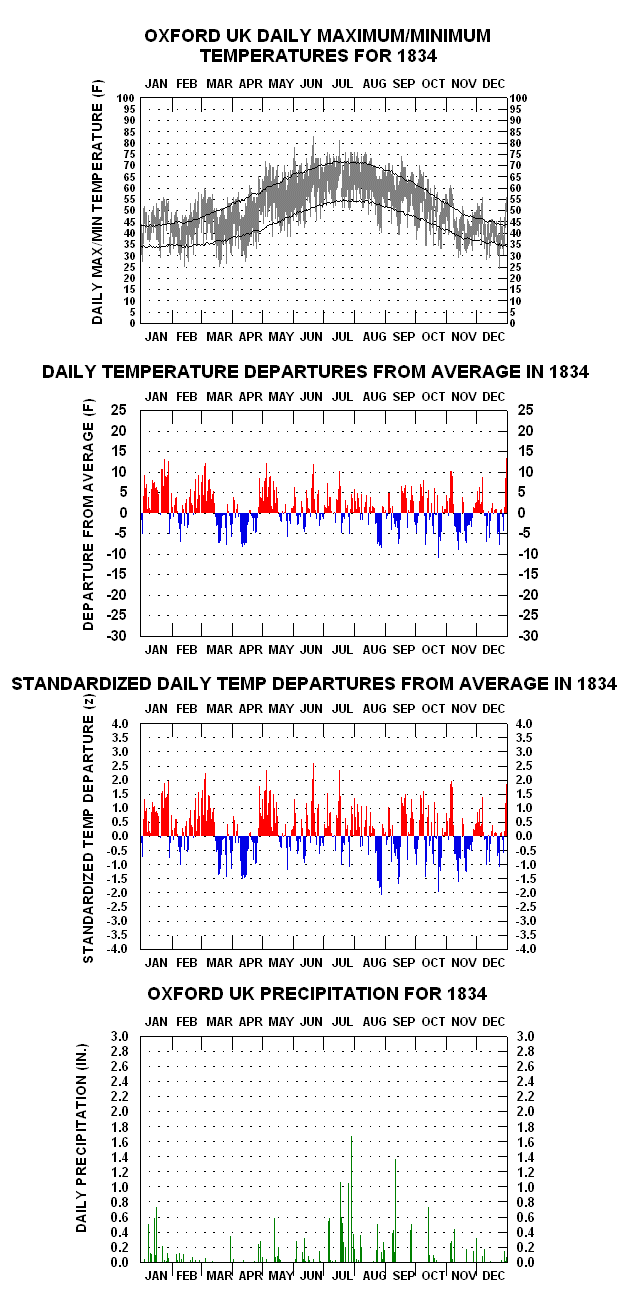
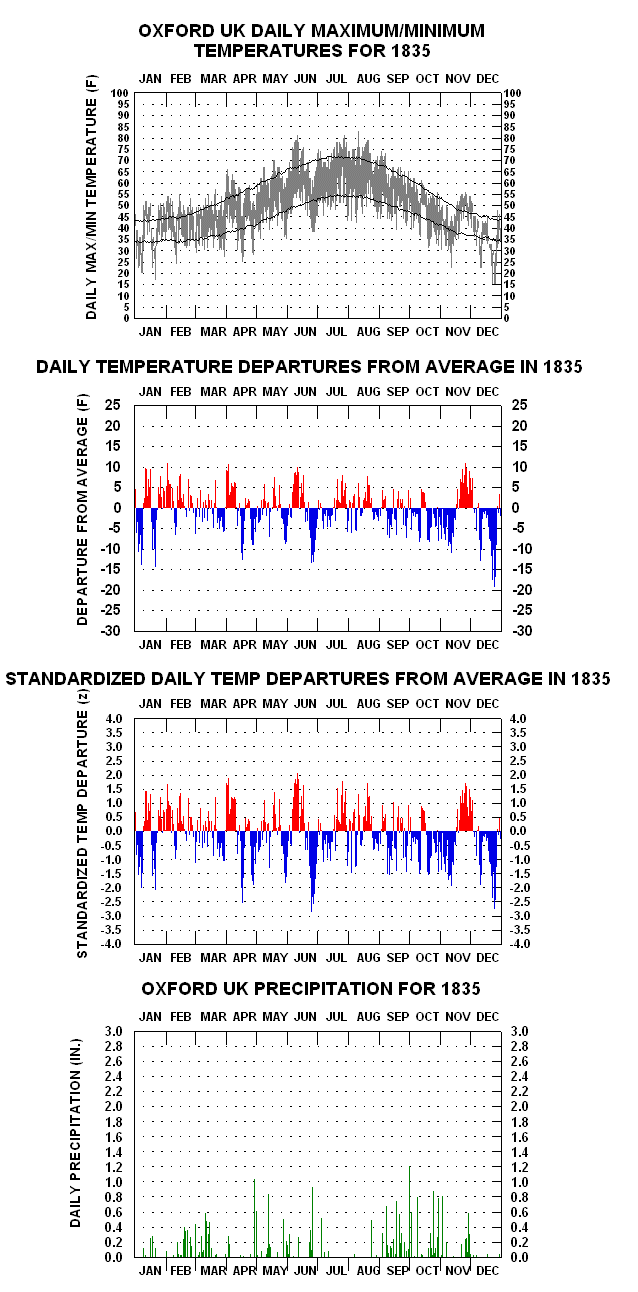
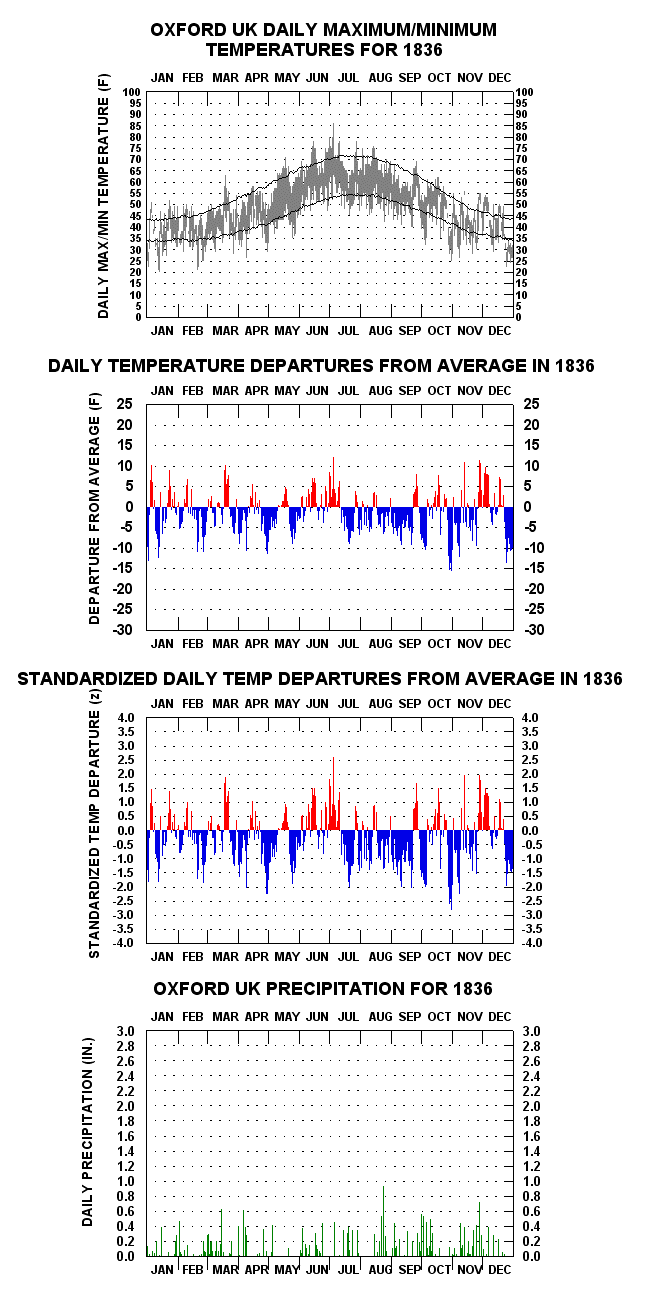
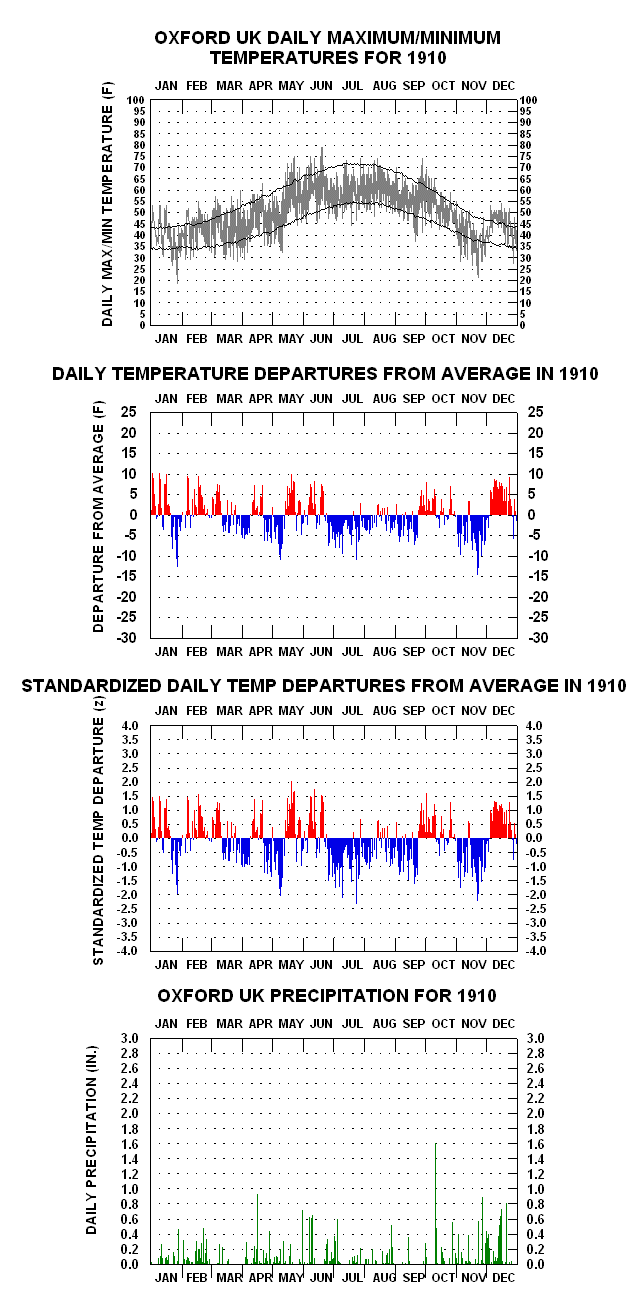
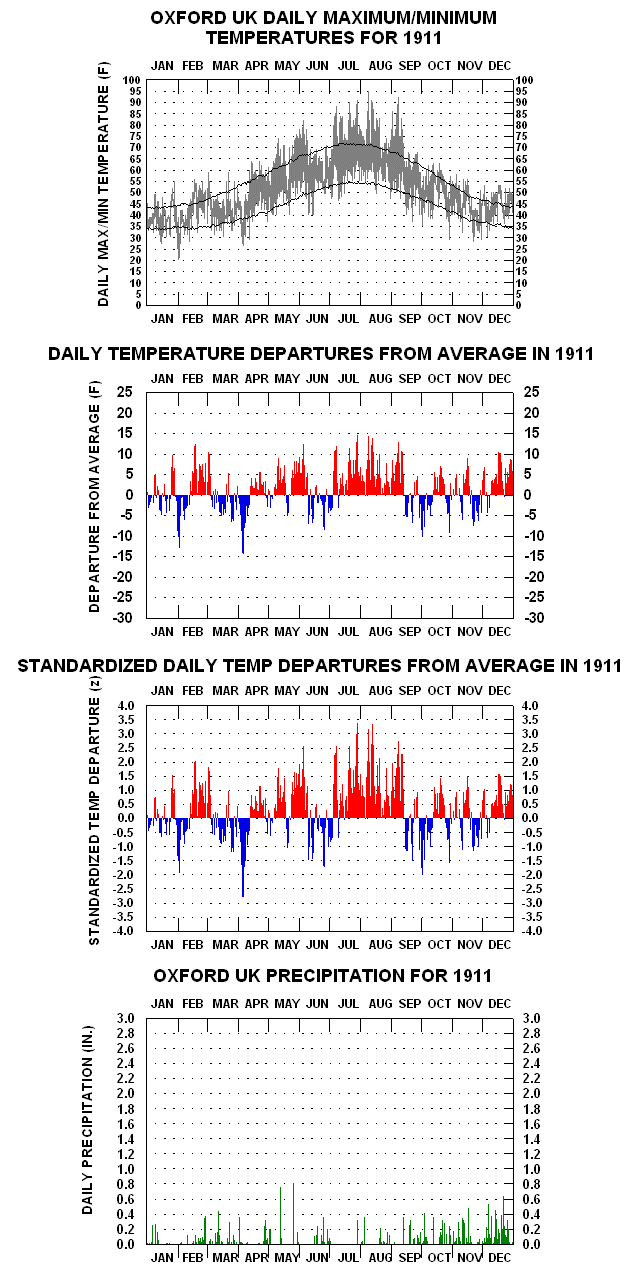
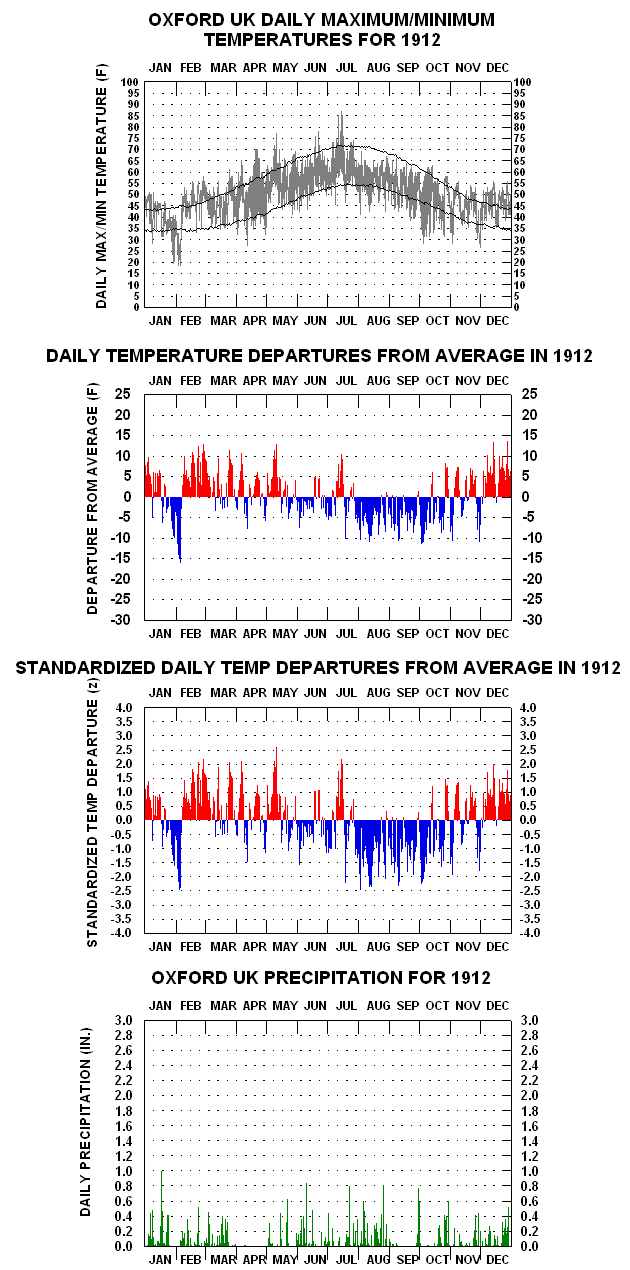
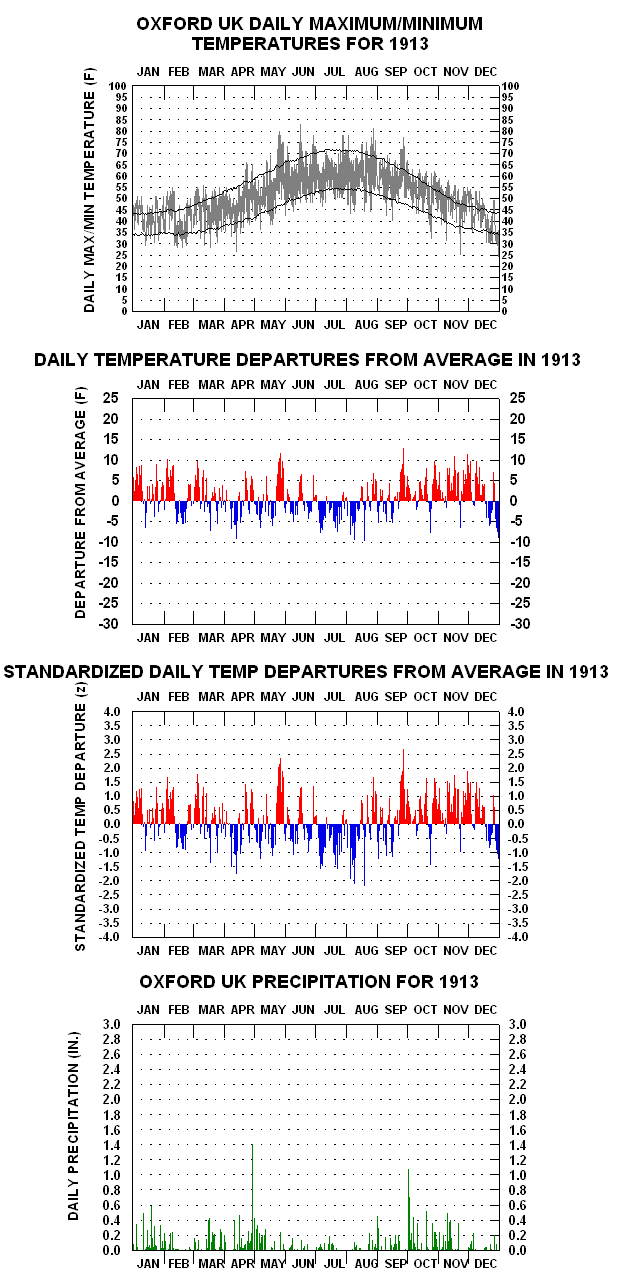
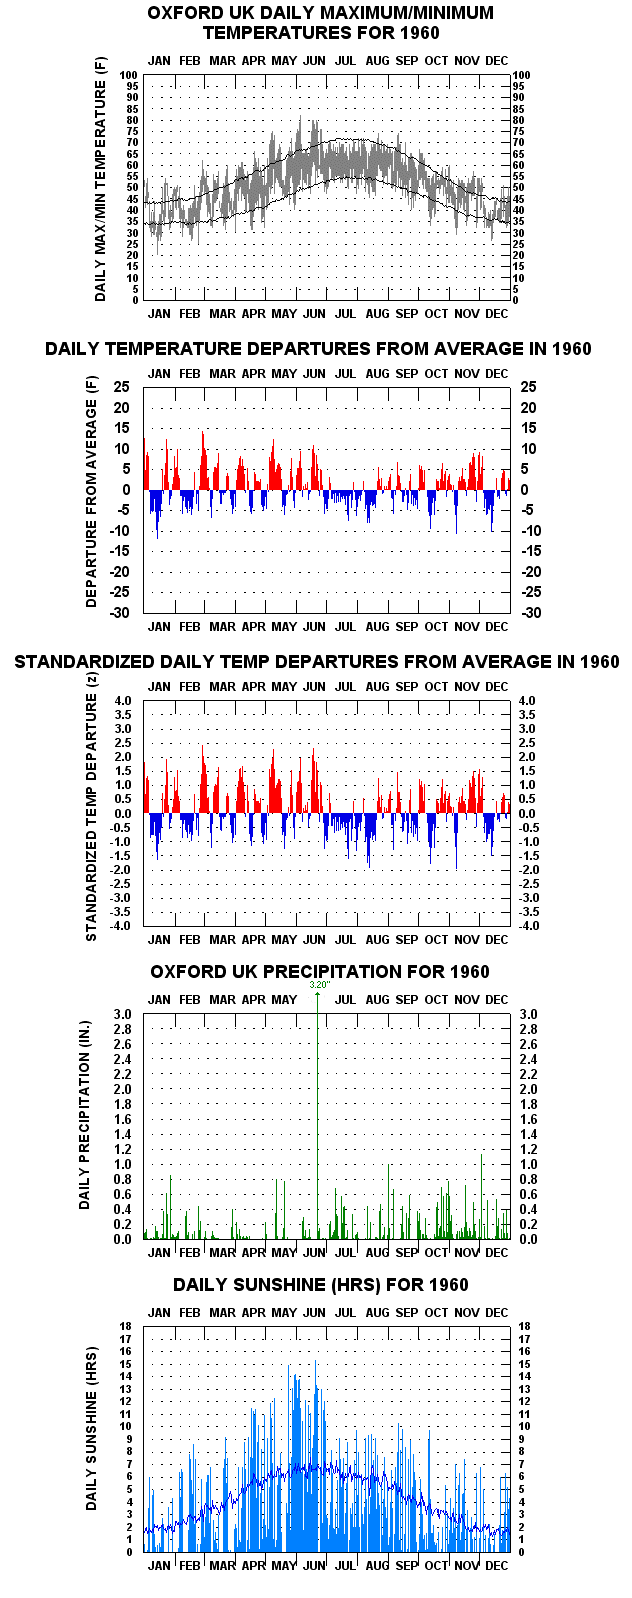
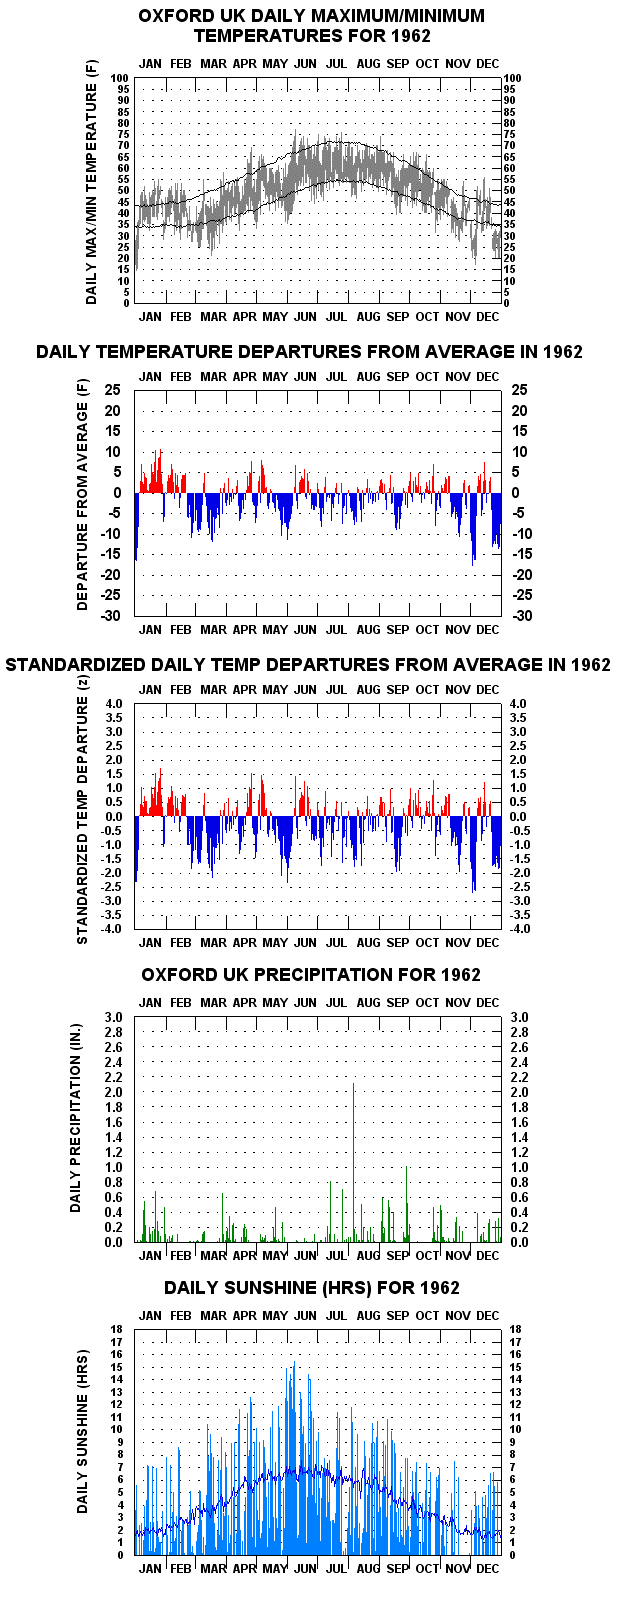
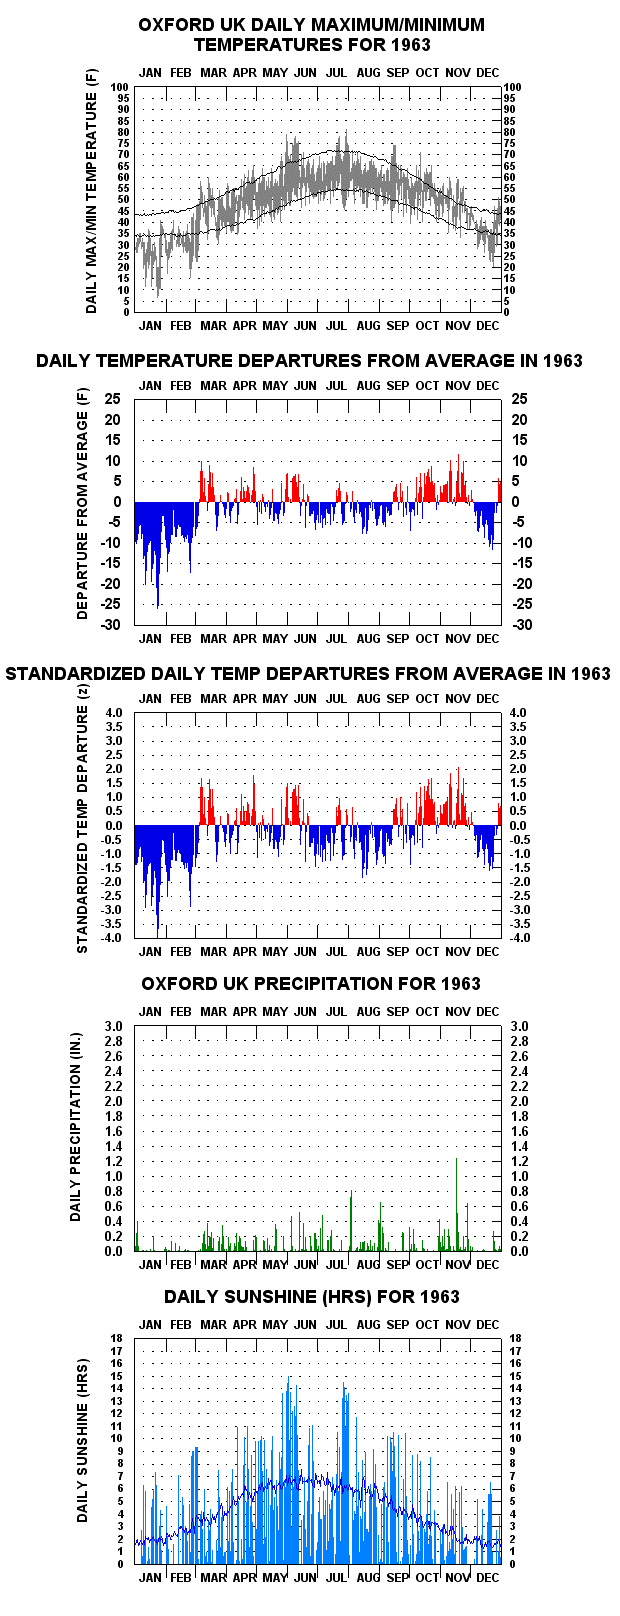
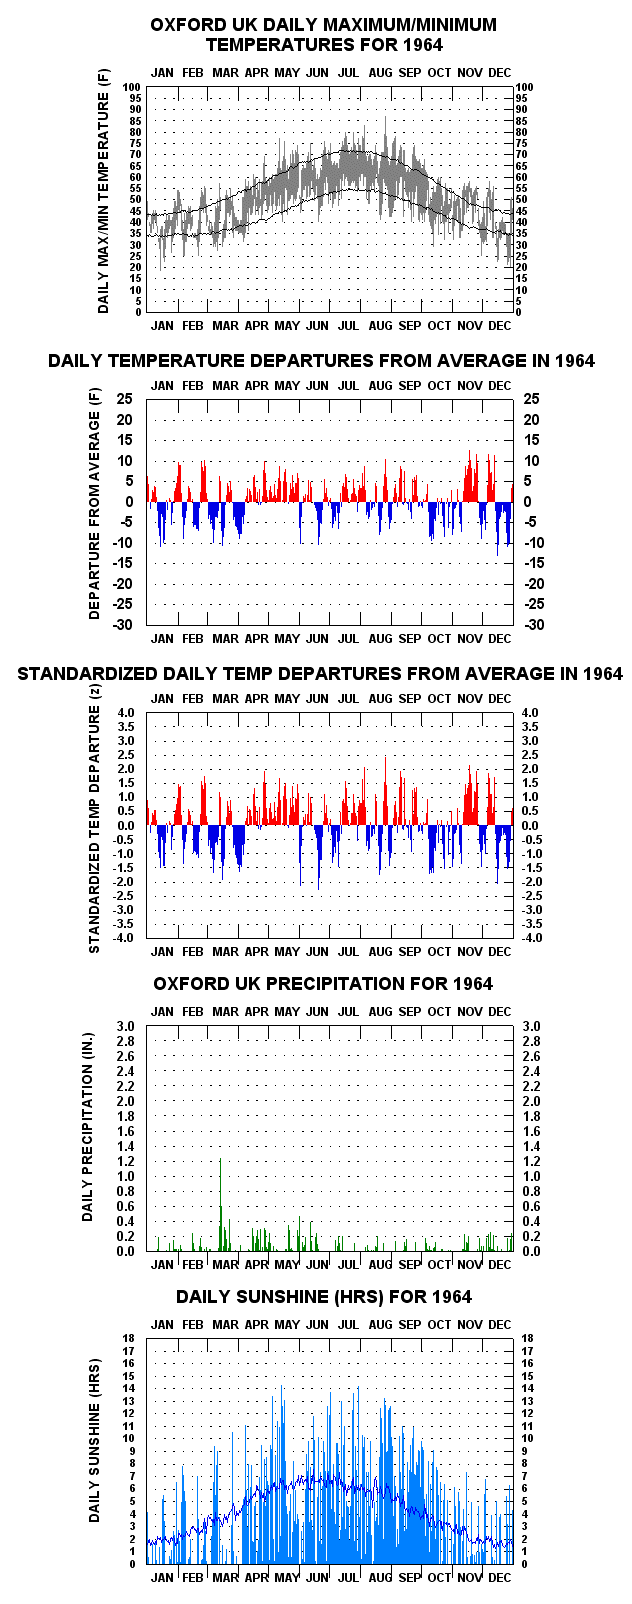
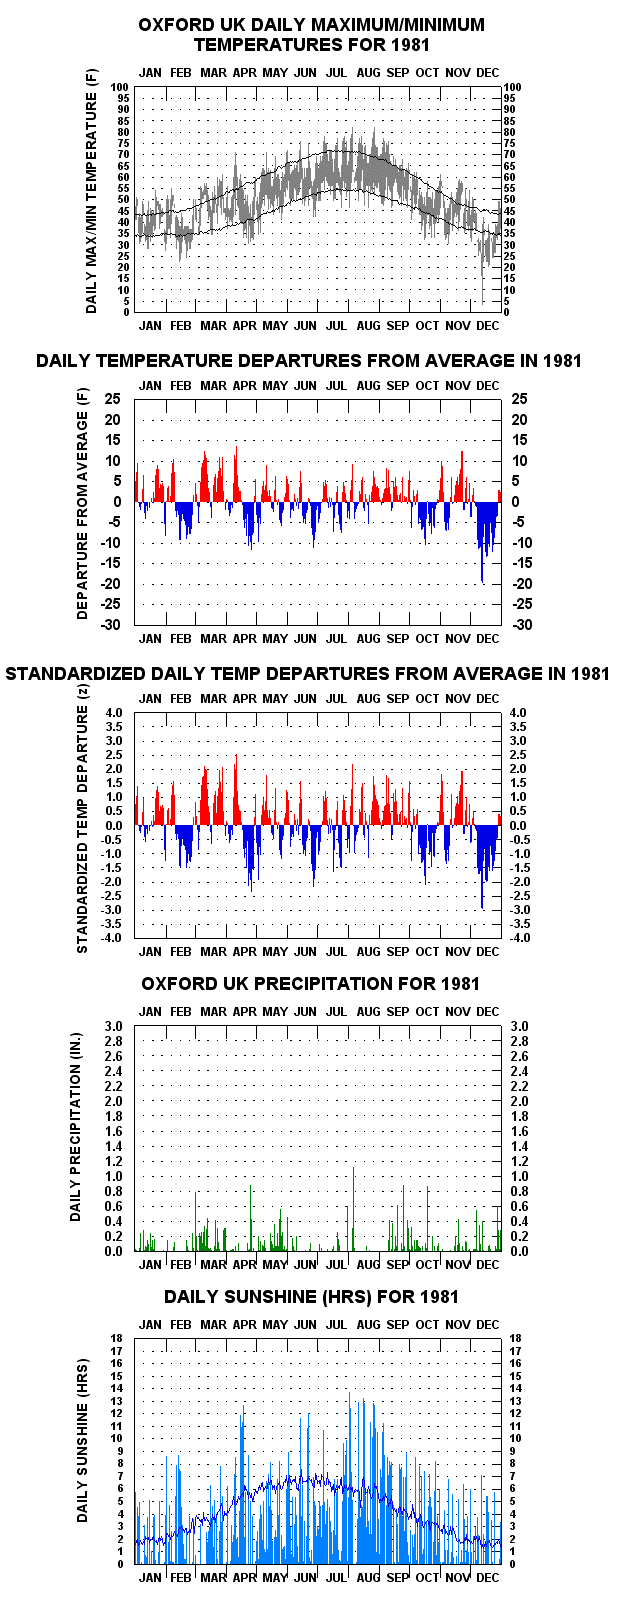
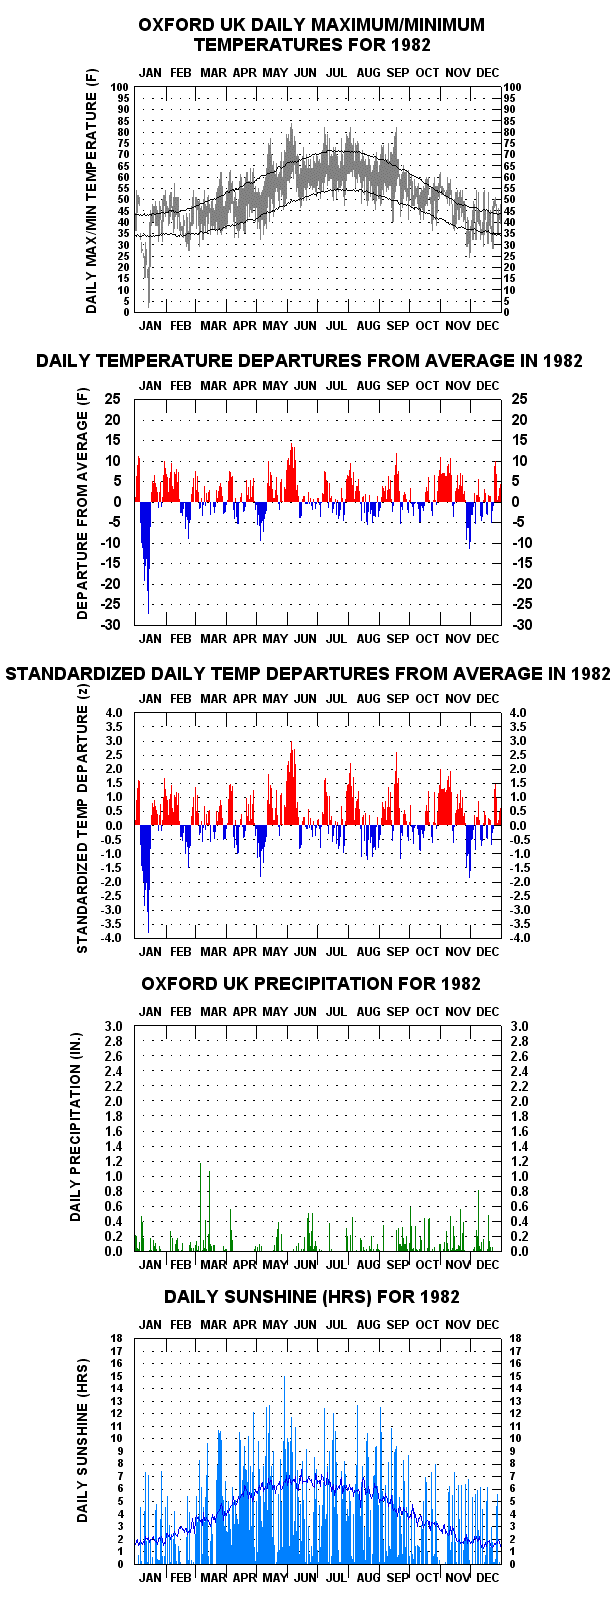
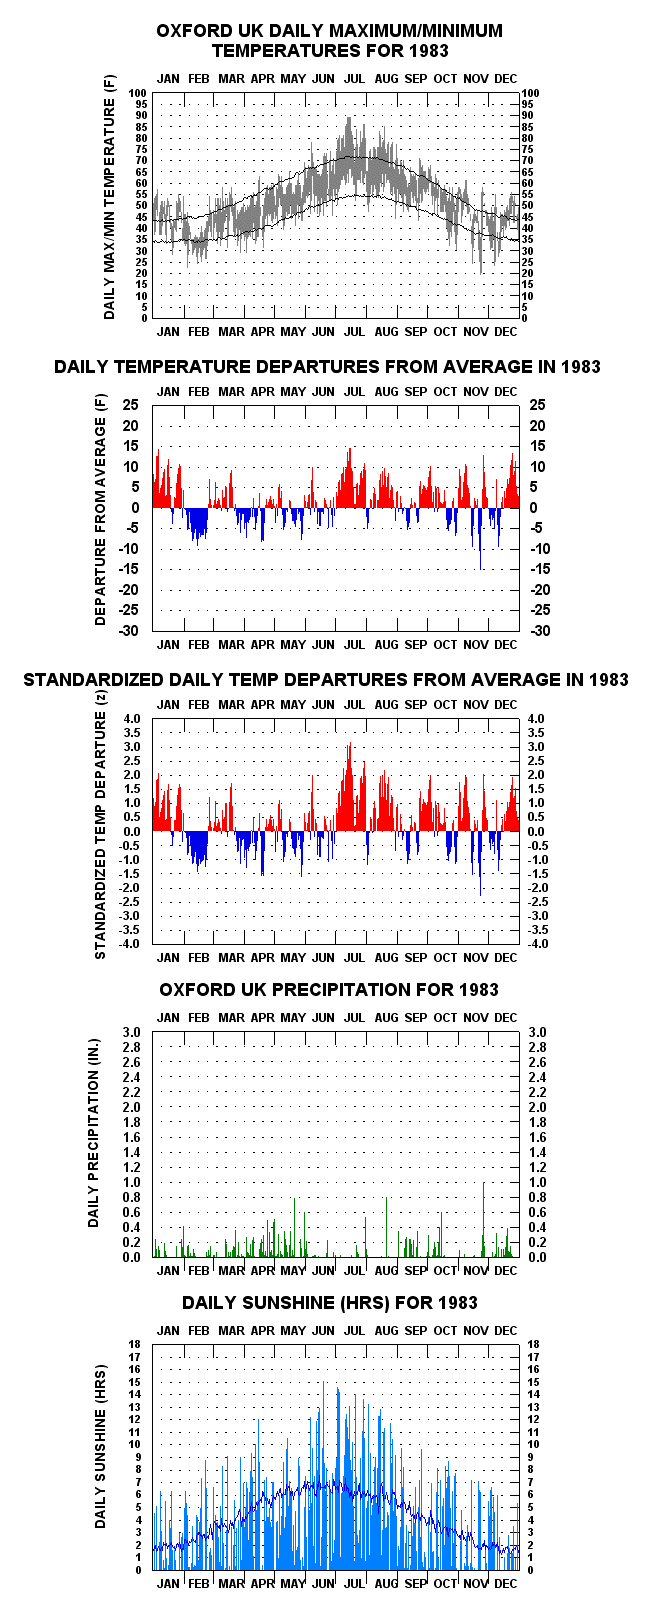
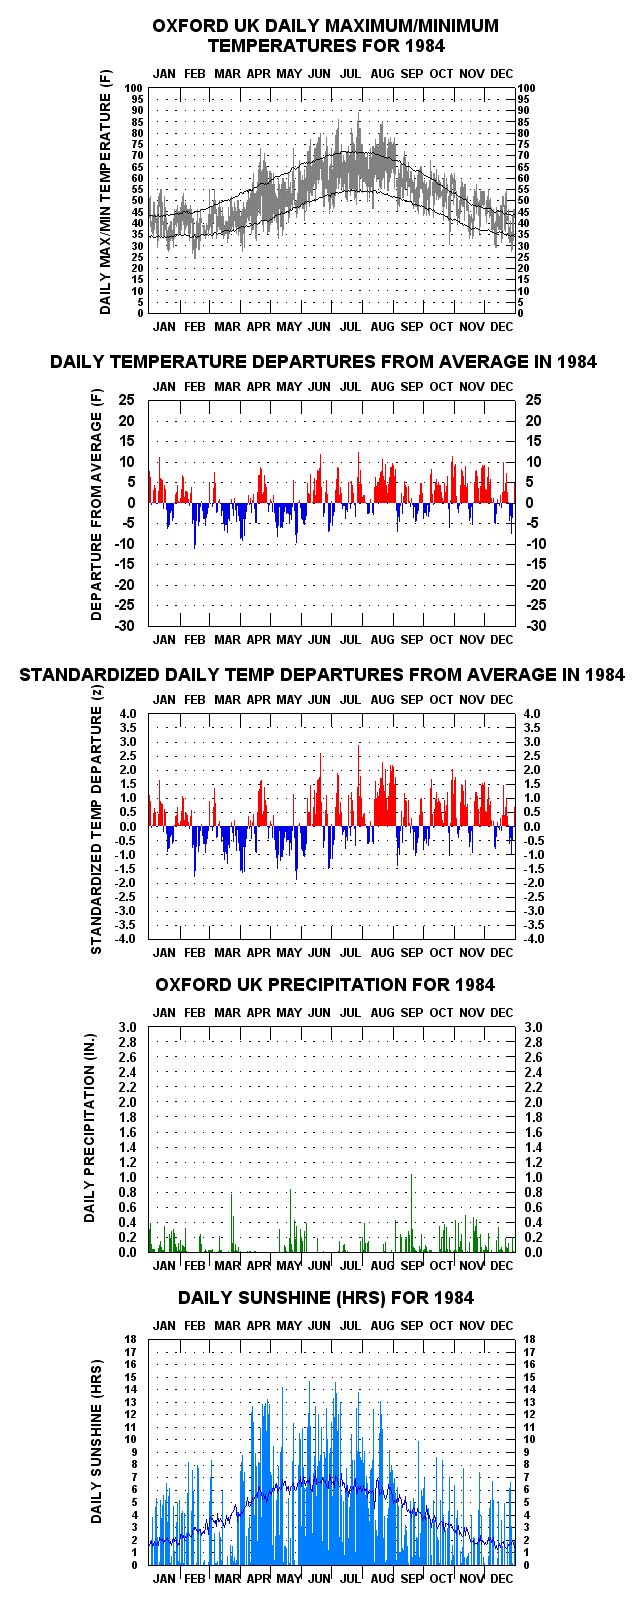
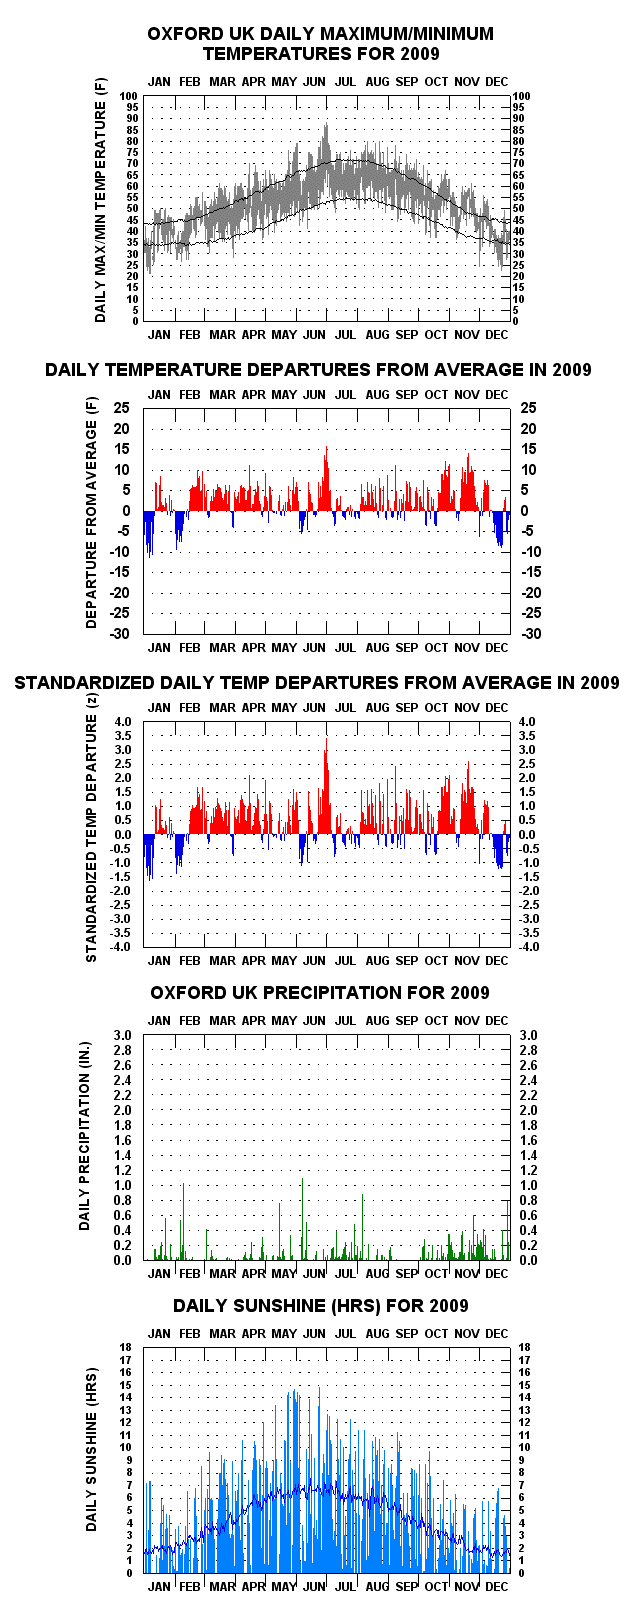
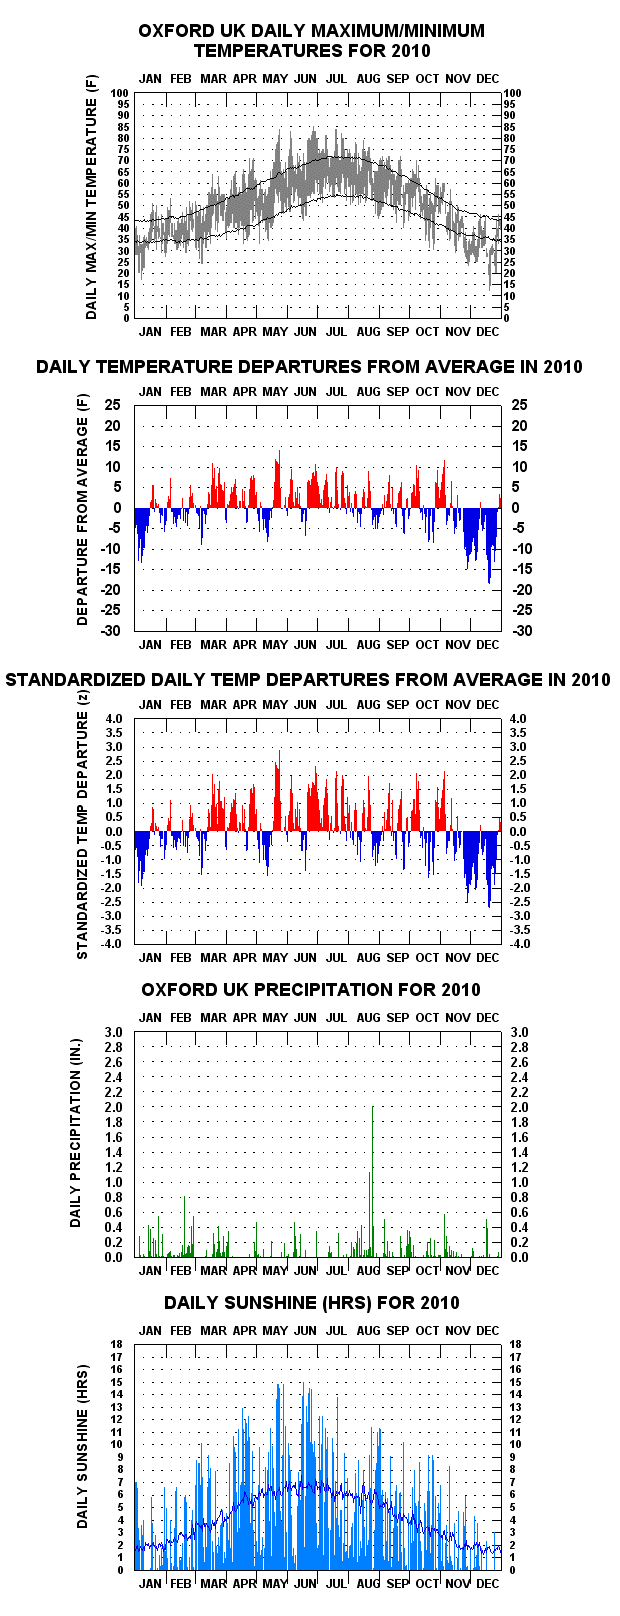
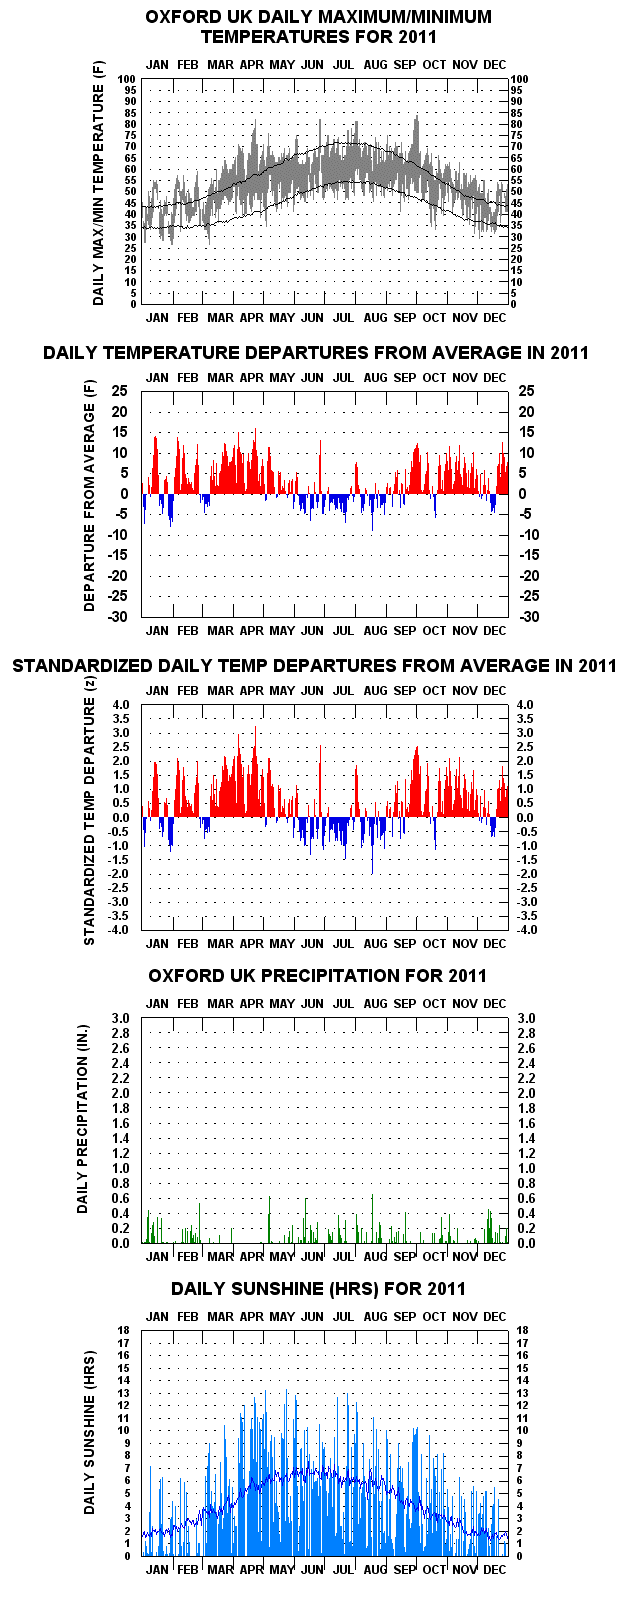
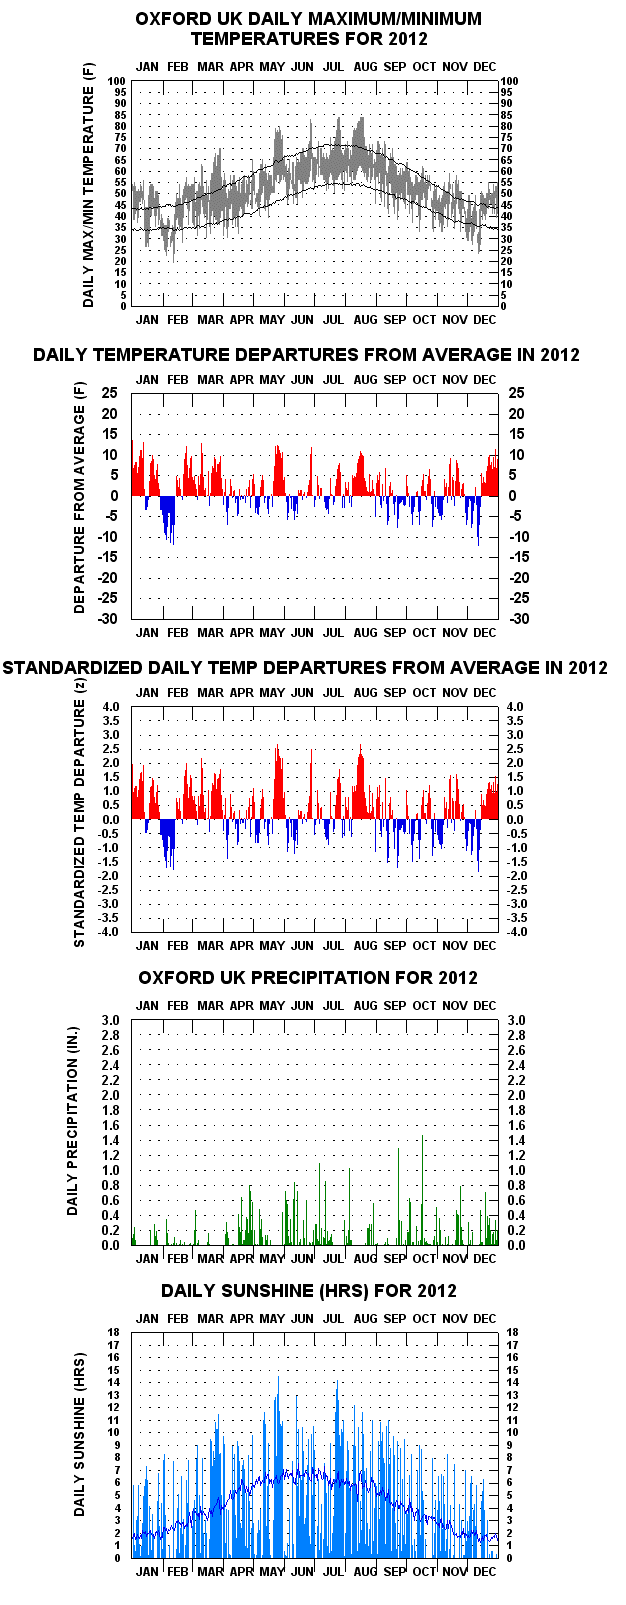
The following is a graphical climatology of Oxford, UK (Radcliffe station) daily temperatures, precipitation and sunshine, from the start of 1815 for temperature, from 1827 for precipitation, and from 1921 for sunshine, through 2025.
The Radcliffe station history is the longest continuous one of its kind in the United Kingdom and one of the longest in the world. As with the other stations on the site, it is intended as an encyclopaedic graphical resource. The wider Oxford record extends back to 1767, although the earlier data are available in monthly form. Temperature and precipitation data are presented in degrees Fahrenheit and inches, respectively.
The most recent online update produced at the Radcliffe station came at year-end 2025. Attribution: “Oxford Weather and Climate since 1767” by Stephen Burt and Tim Burt, Oxford University Press, 2019. Source data: University of Oxford Radcliffe Meteorological Station daily data.
Explore the Climate Data
Use these shortcuts to move directly to the principal charts, analyses and historical records.
Historical Series
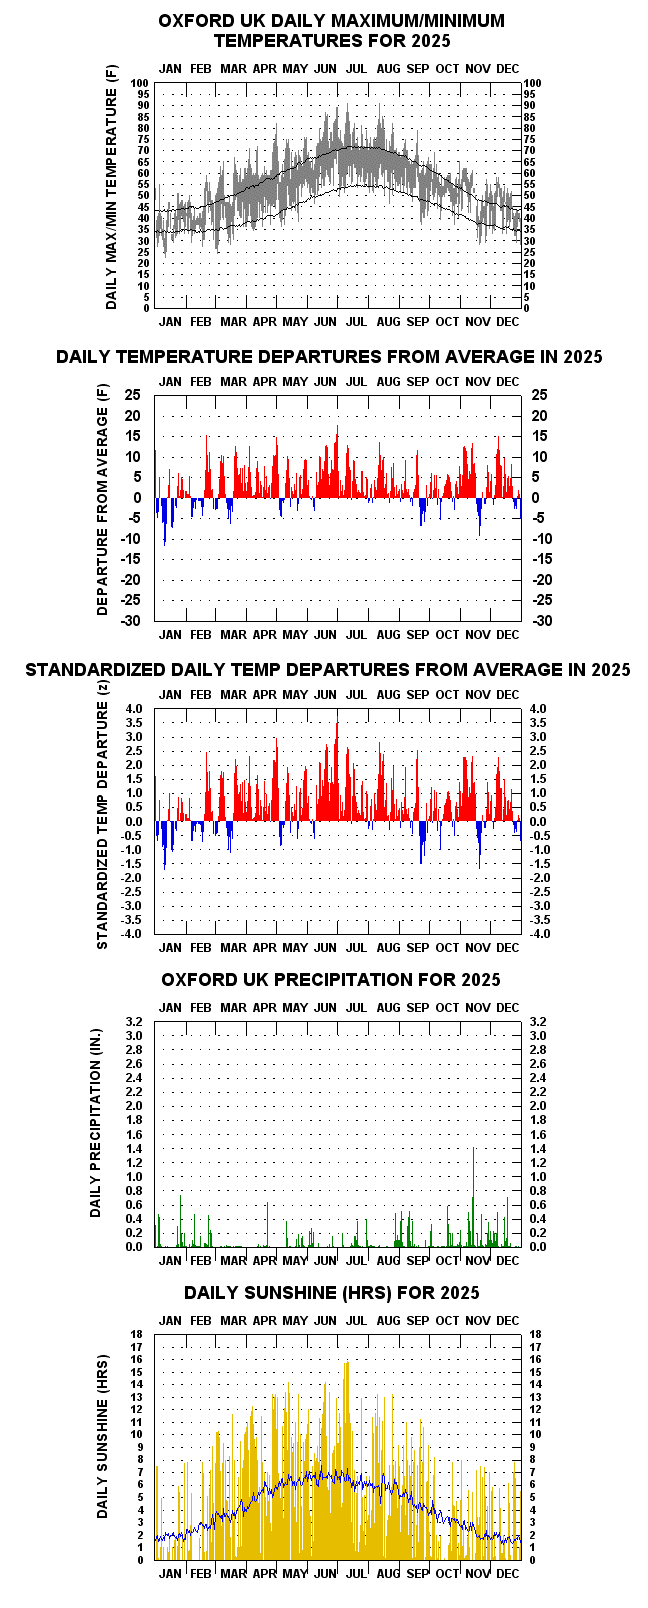
- Oxford Temps, Precipitation & Sunshine for 2025 New (5/3/26)
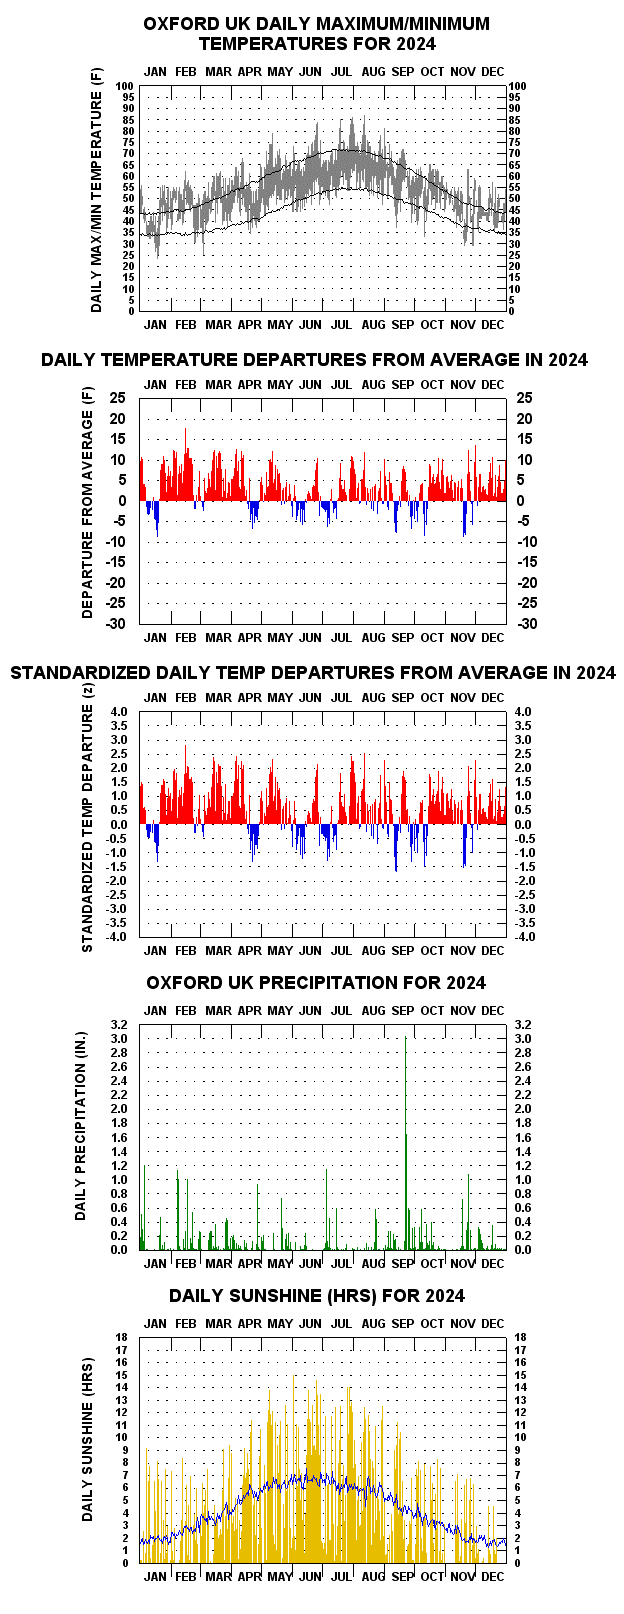
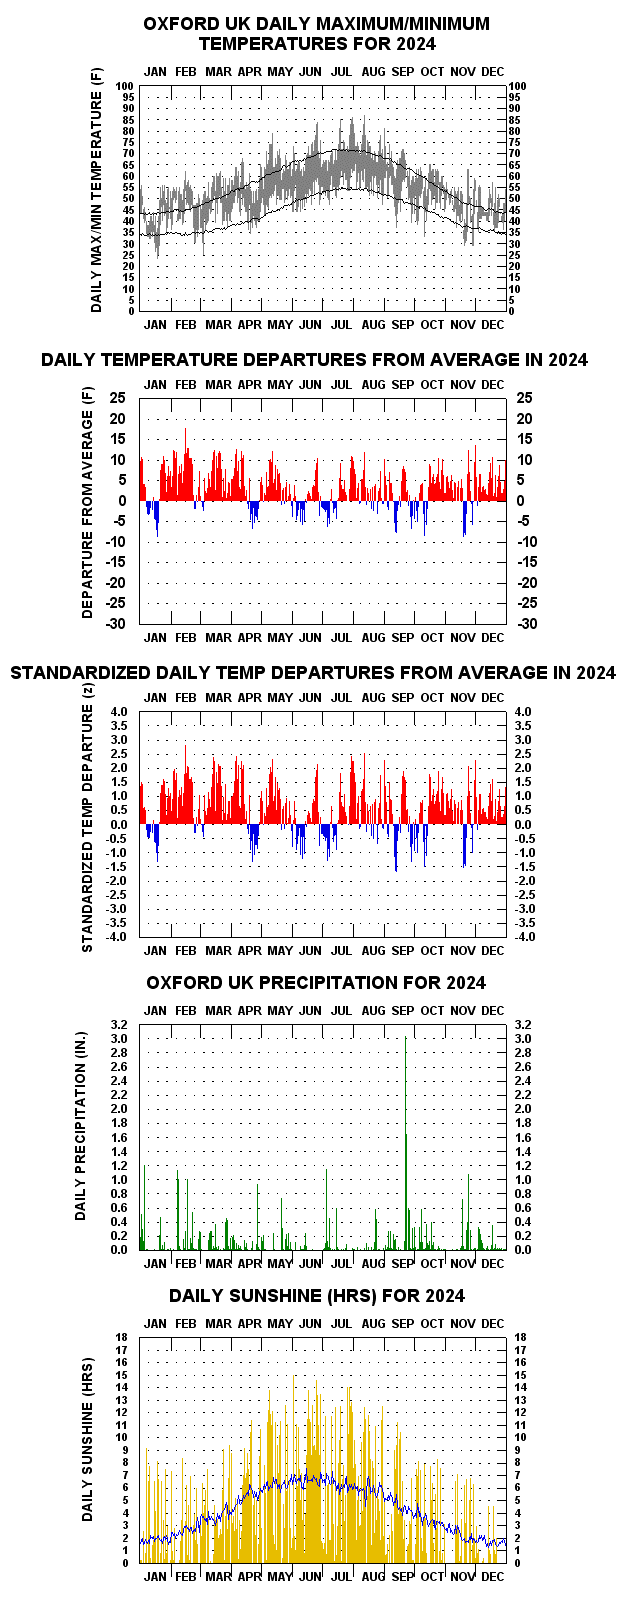
- Oxford Temps, Precipitation & Sunshine for 2024
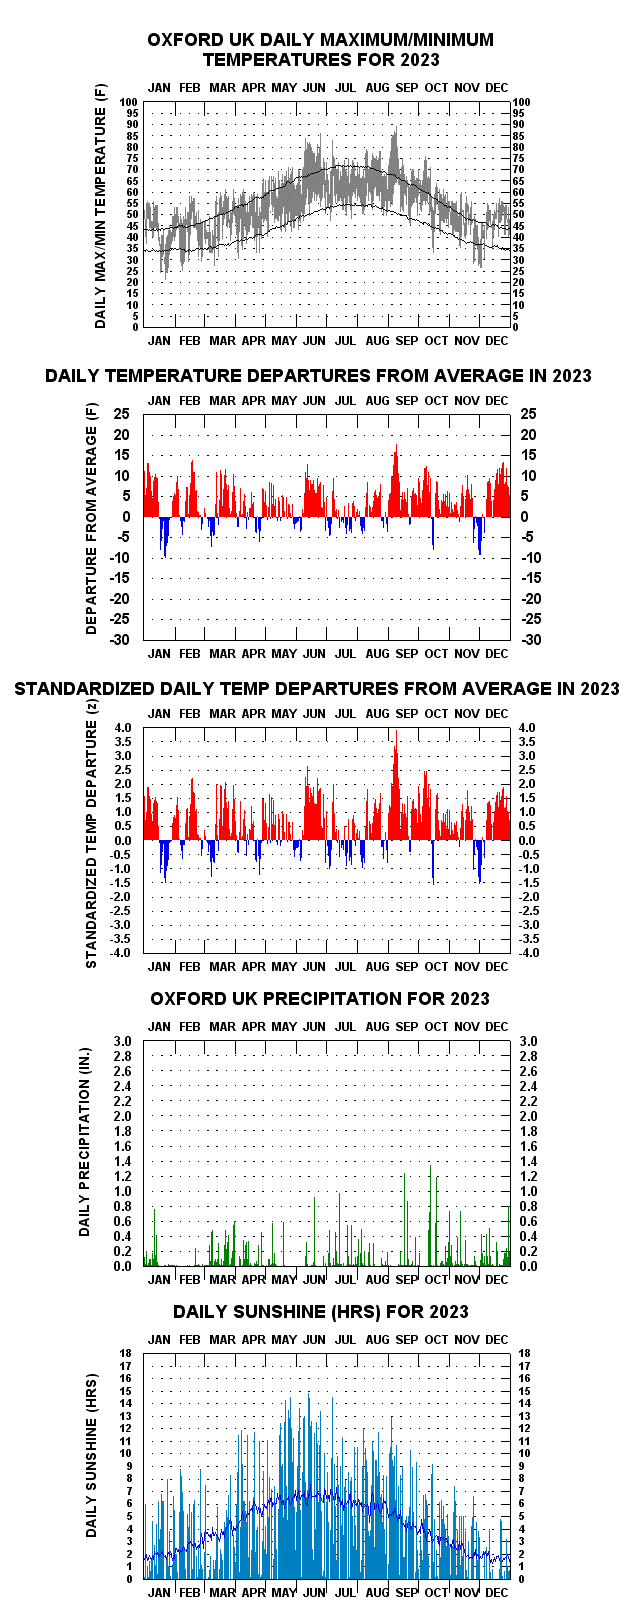
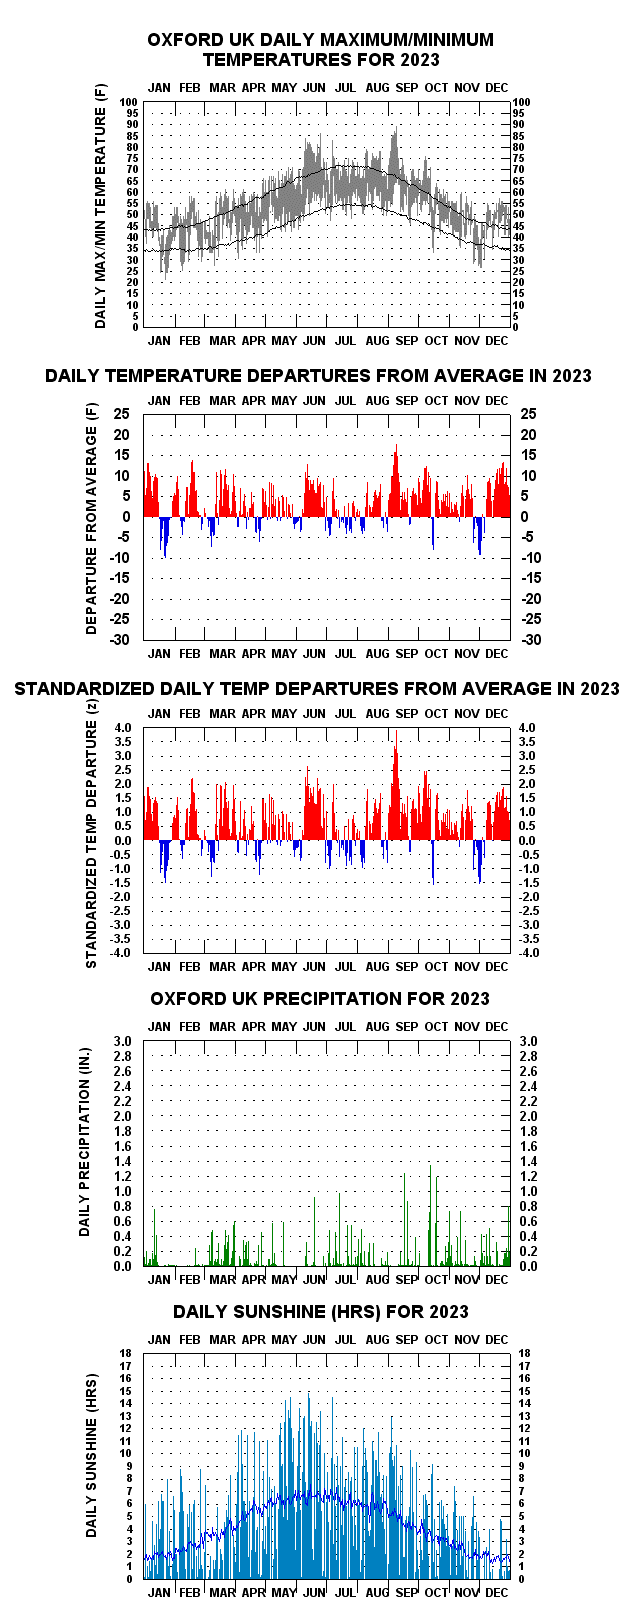
- Oxford Temps, Precipitation & Sunshine for 2023
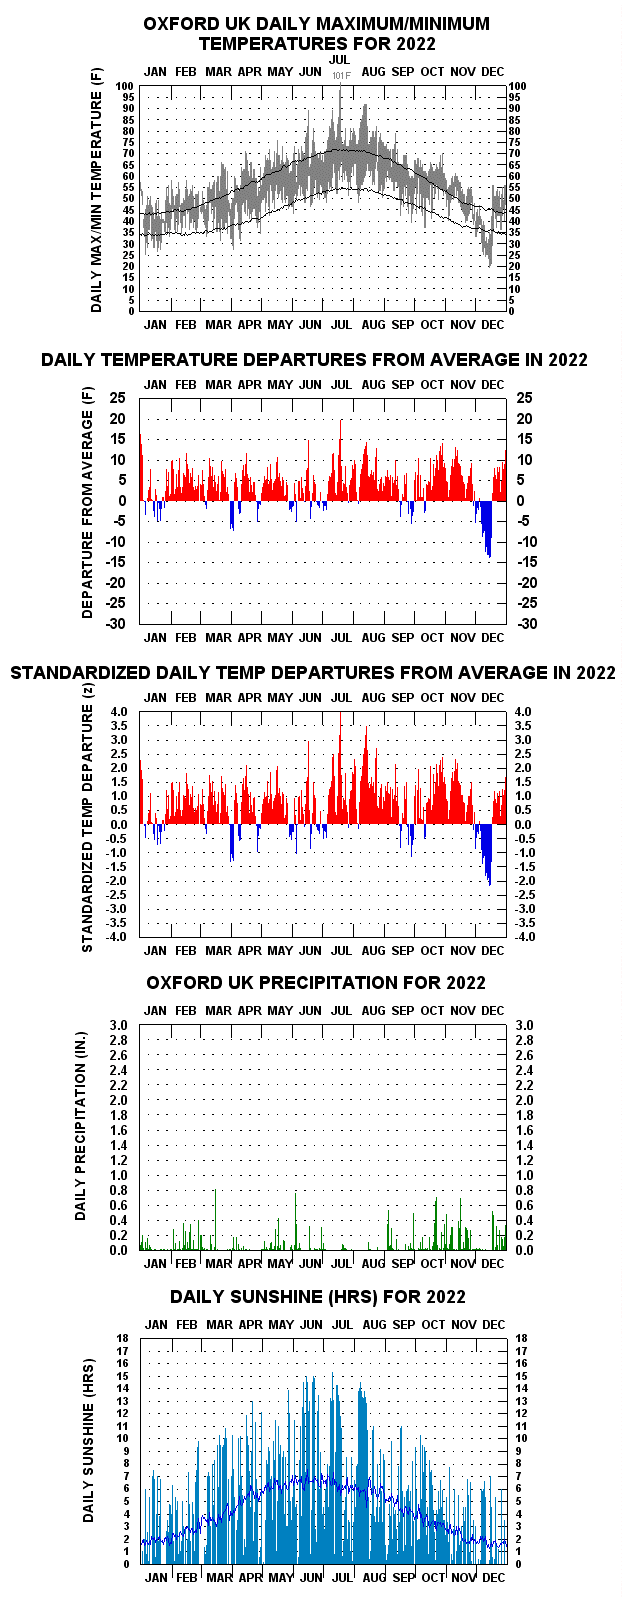
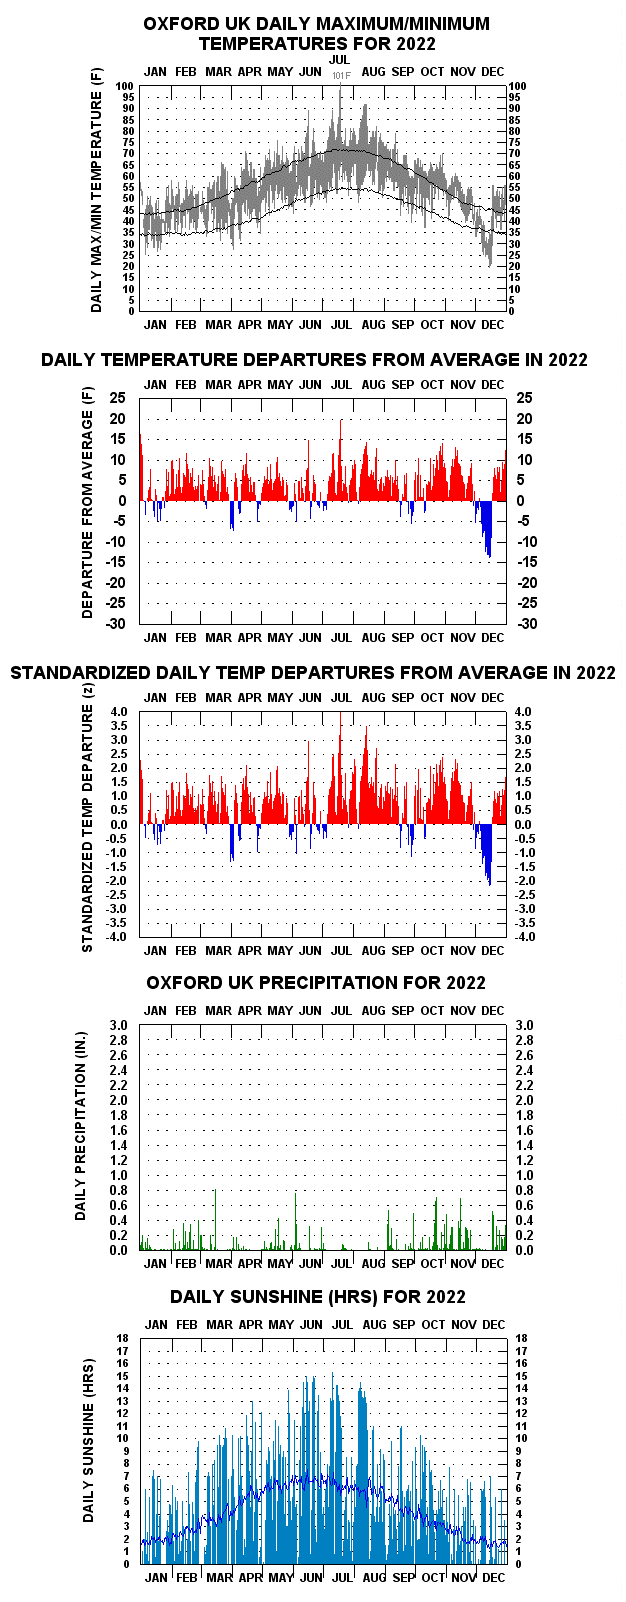
- Oxford Temps, Precipitation & Sunshine for 2022
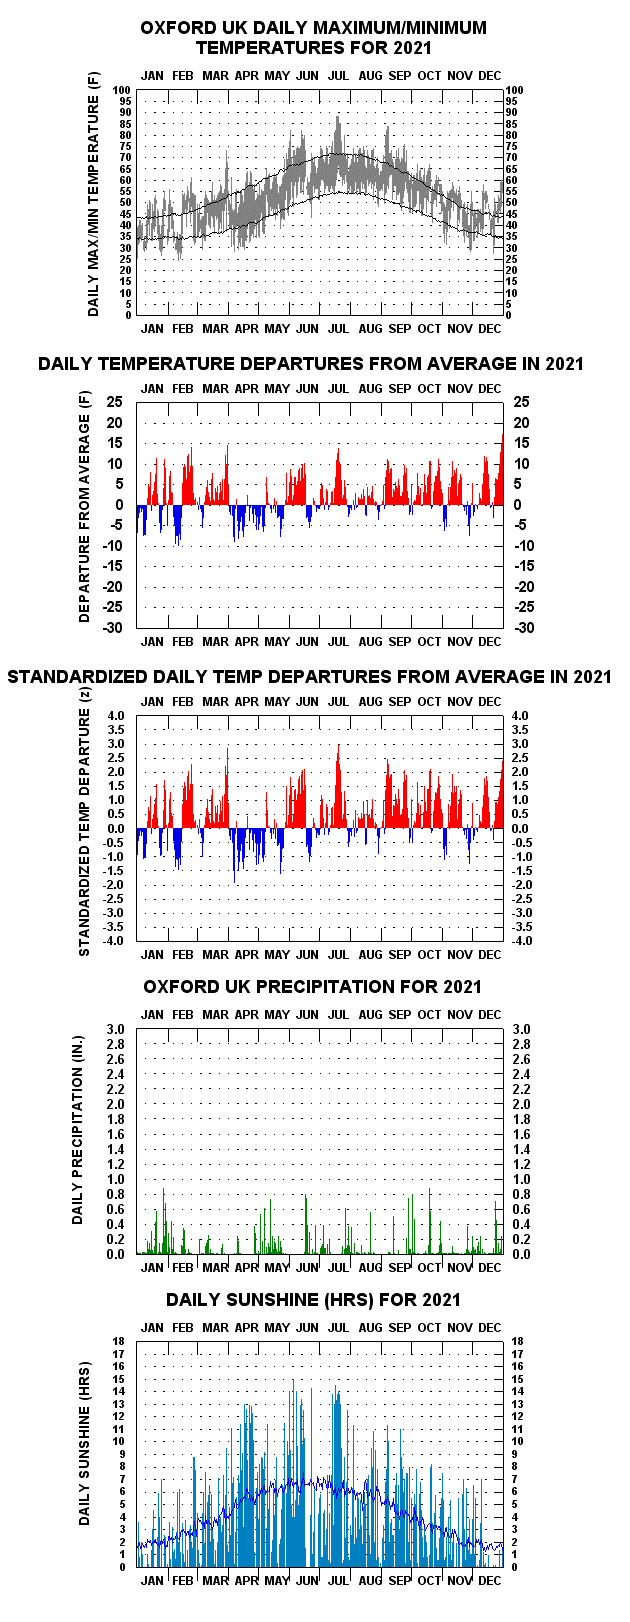
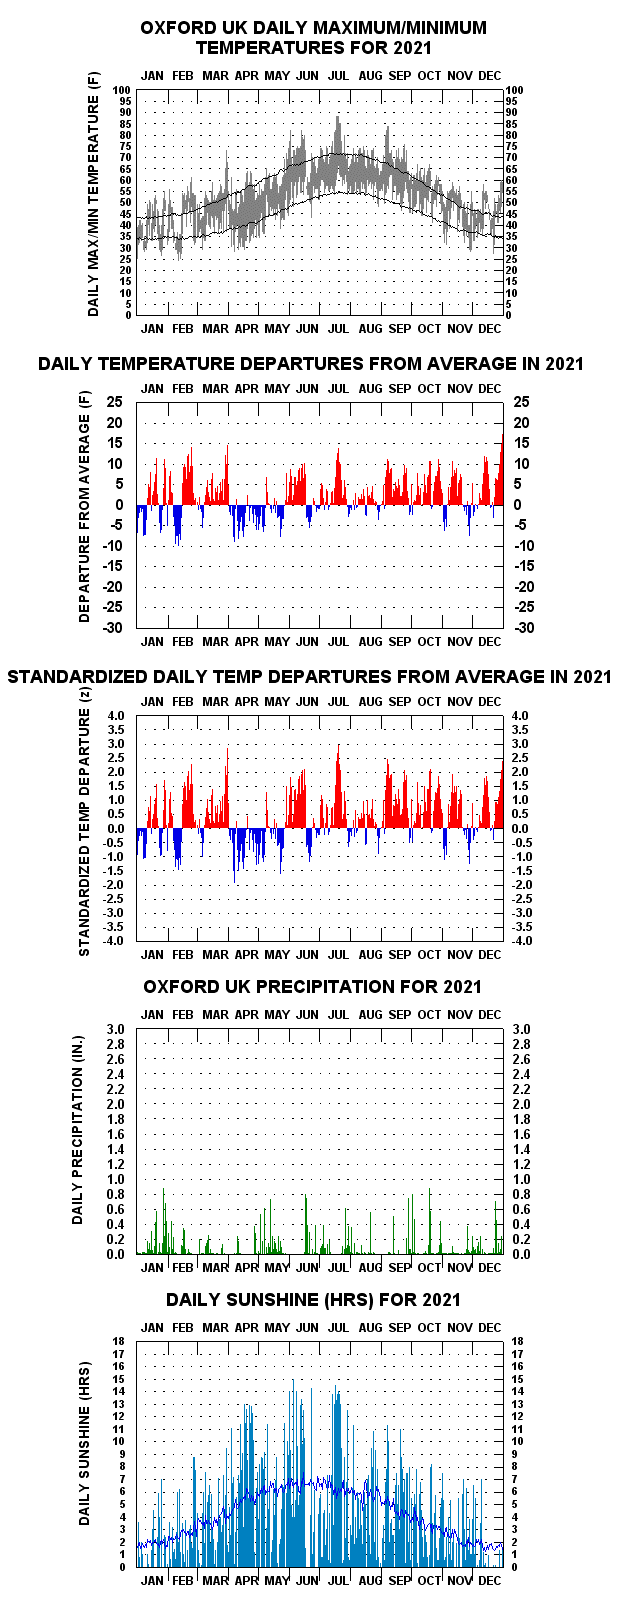
- Oxford Temps, Precipitation & Sunshine for 2021
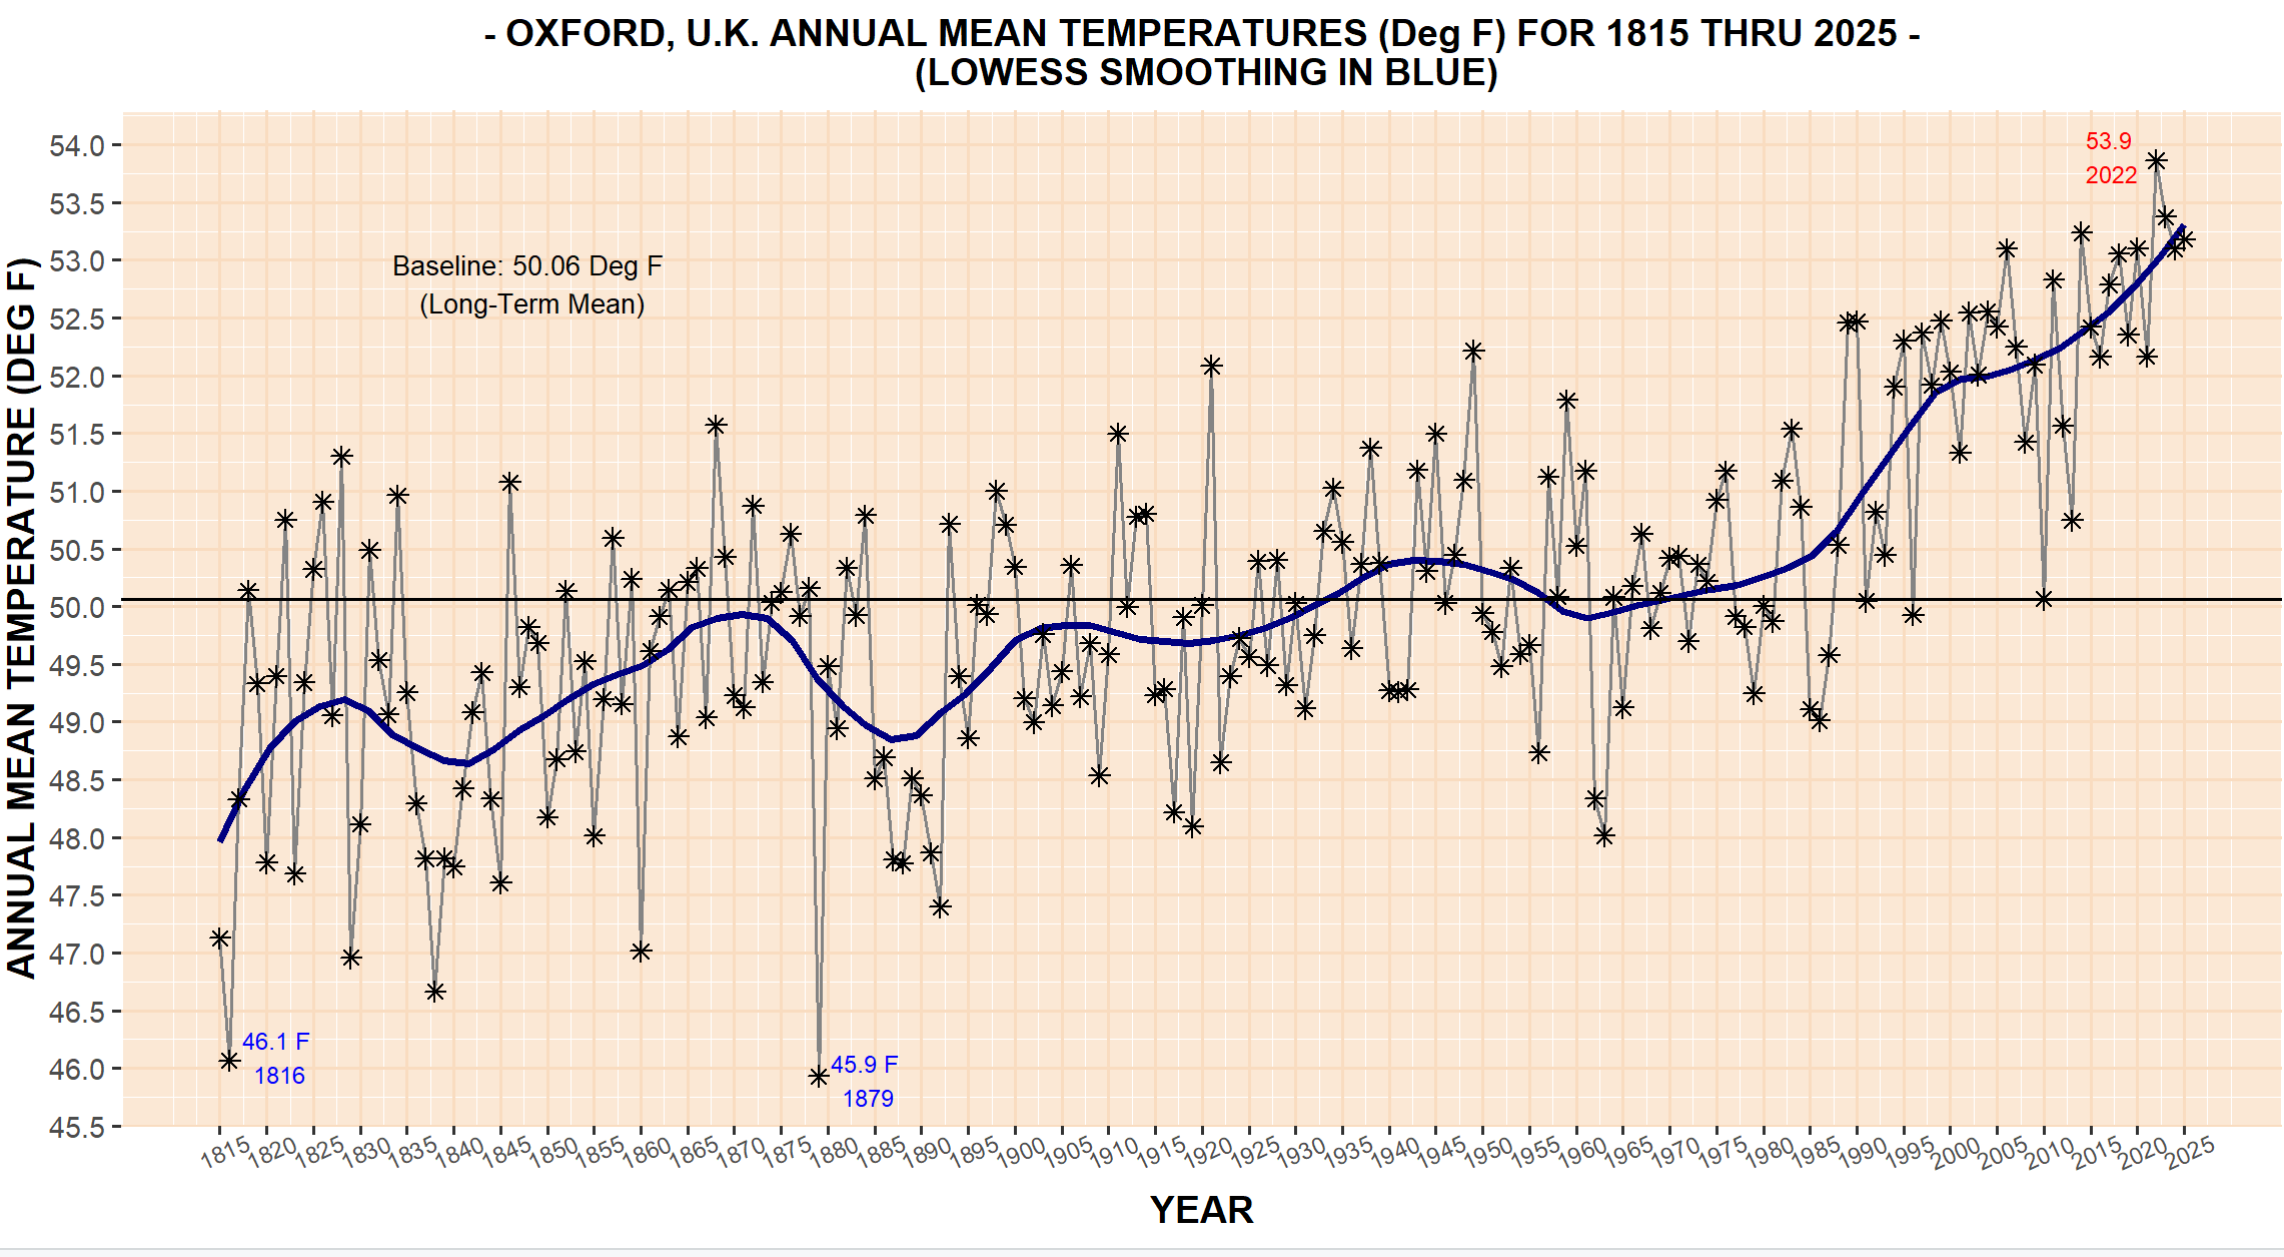
- Oxford Annual Mean Temperature History (1815–2025) New (5/3/26)
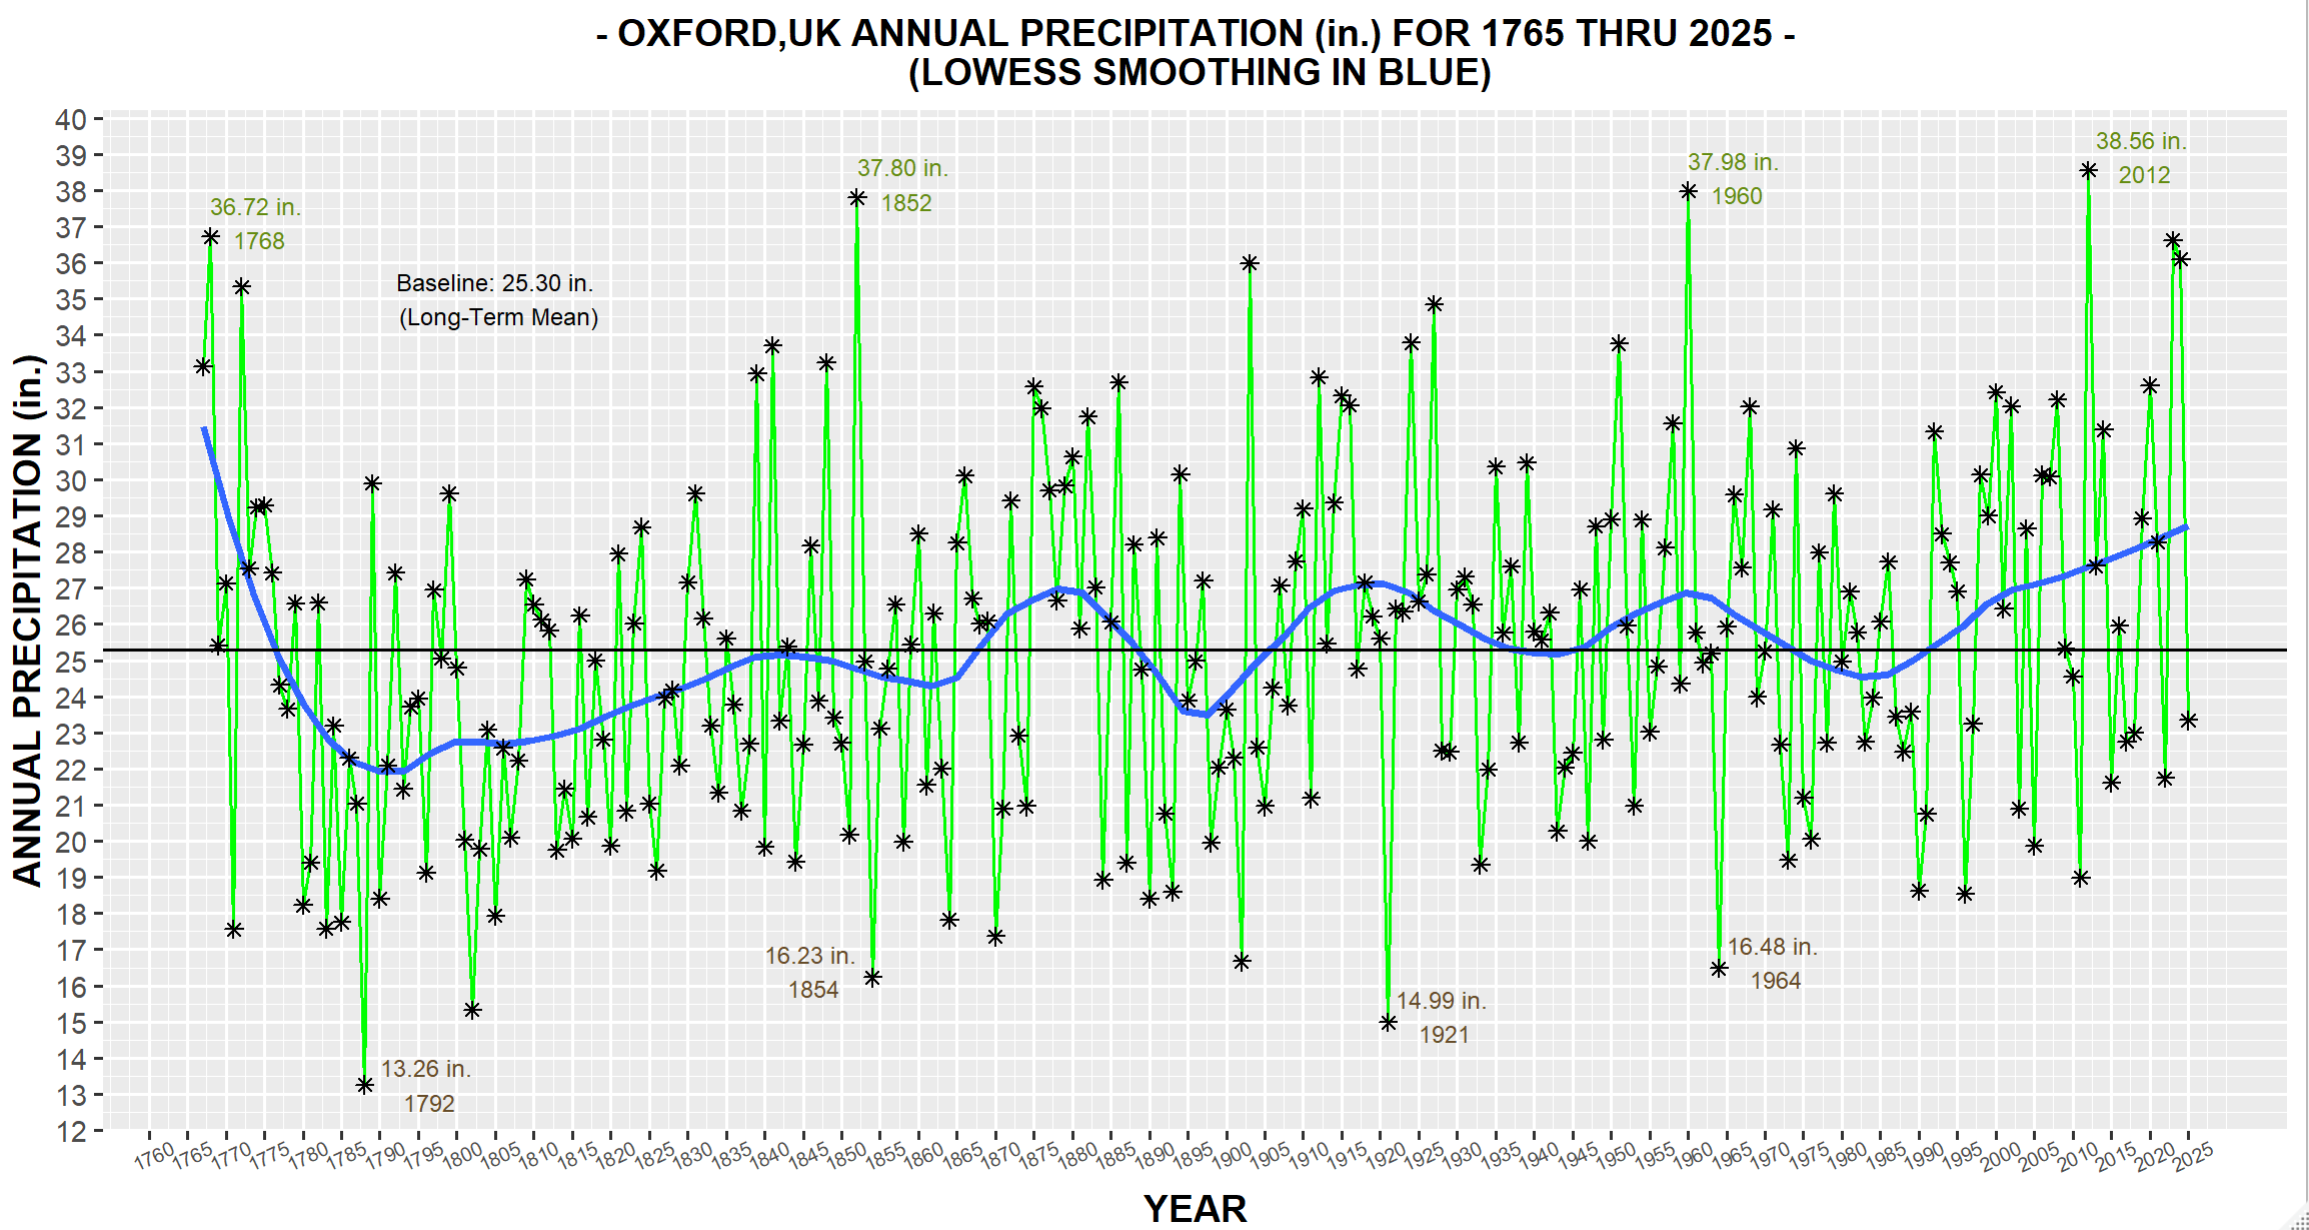
- Oxford Calendar Year Precipitation History (1767–2025) New (5/3/26)
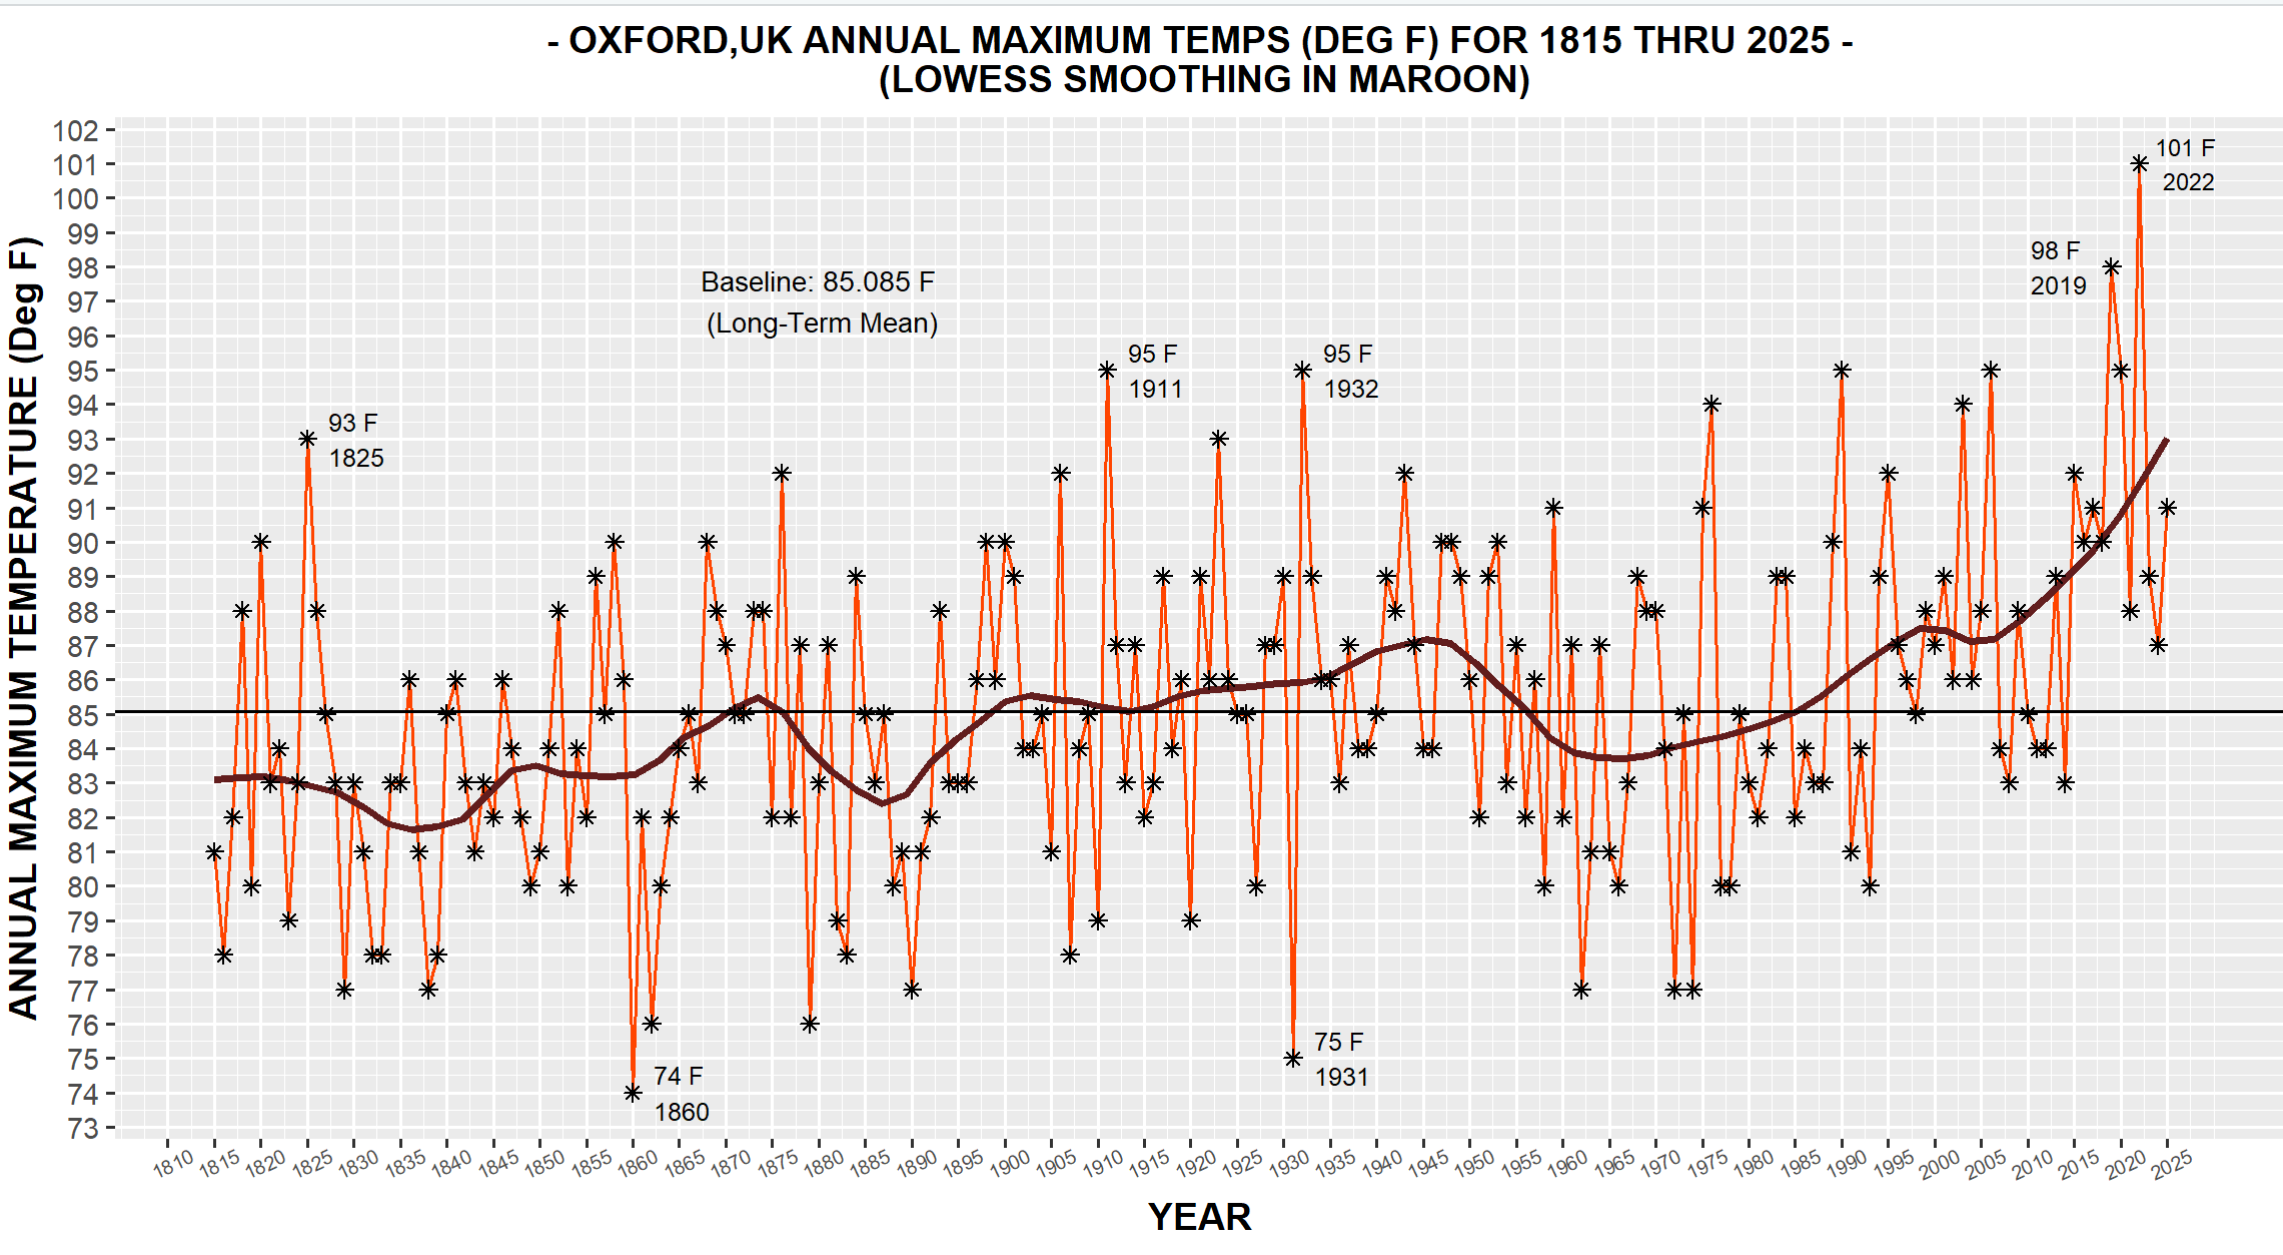
- Oxford Annual Maximum Temperatures (1815–2025) New (5/3/26)
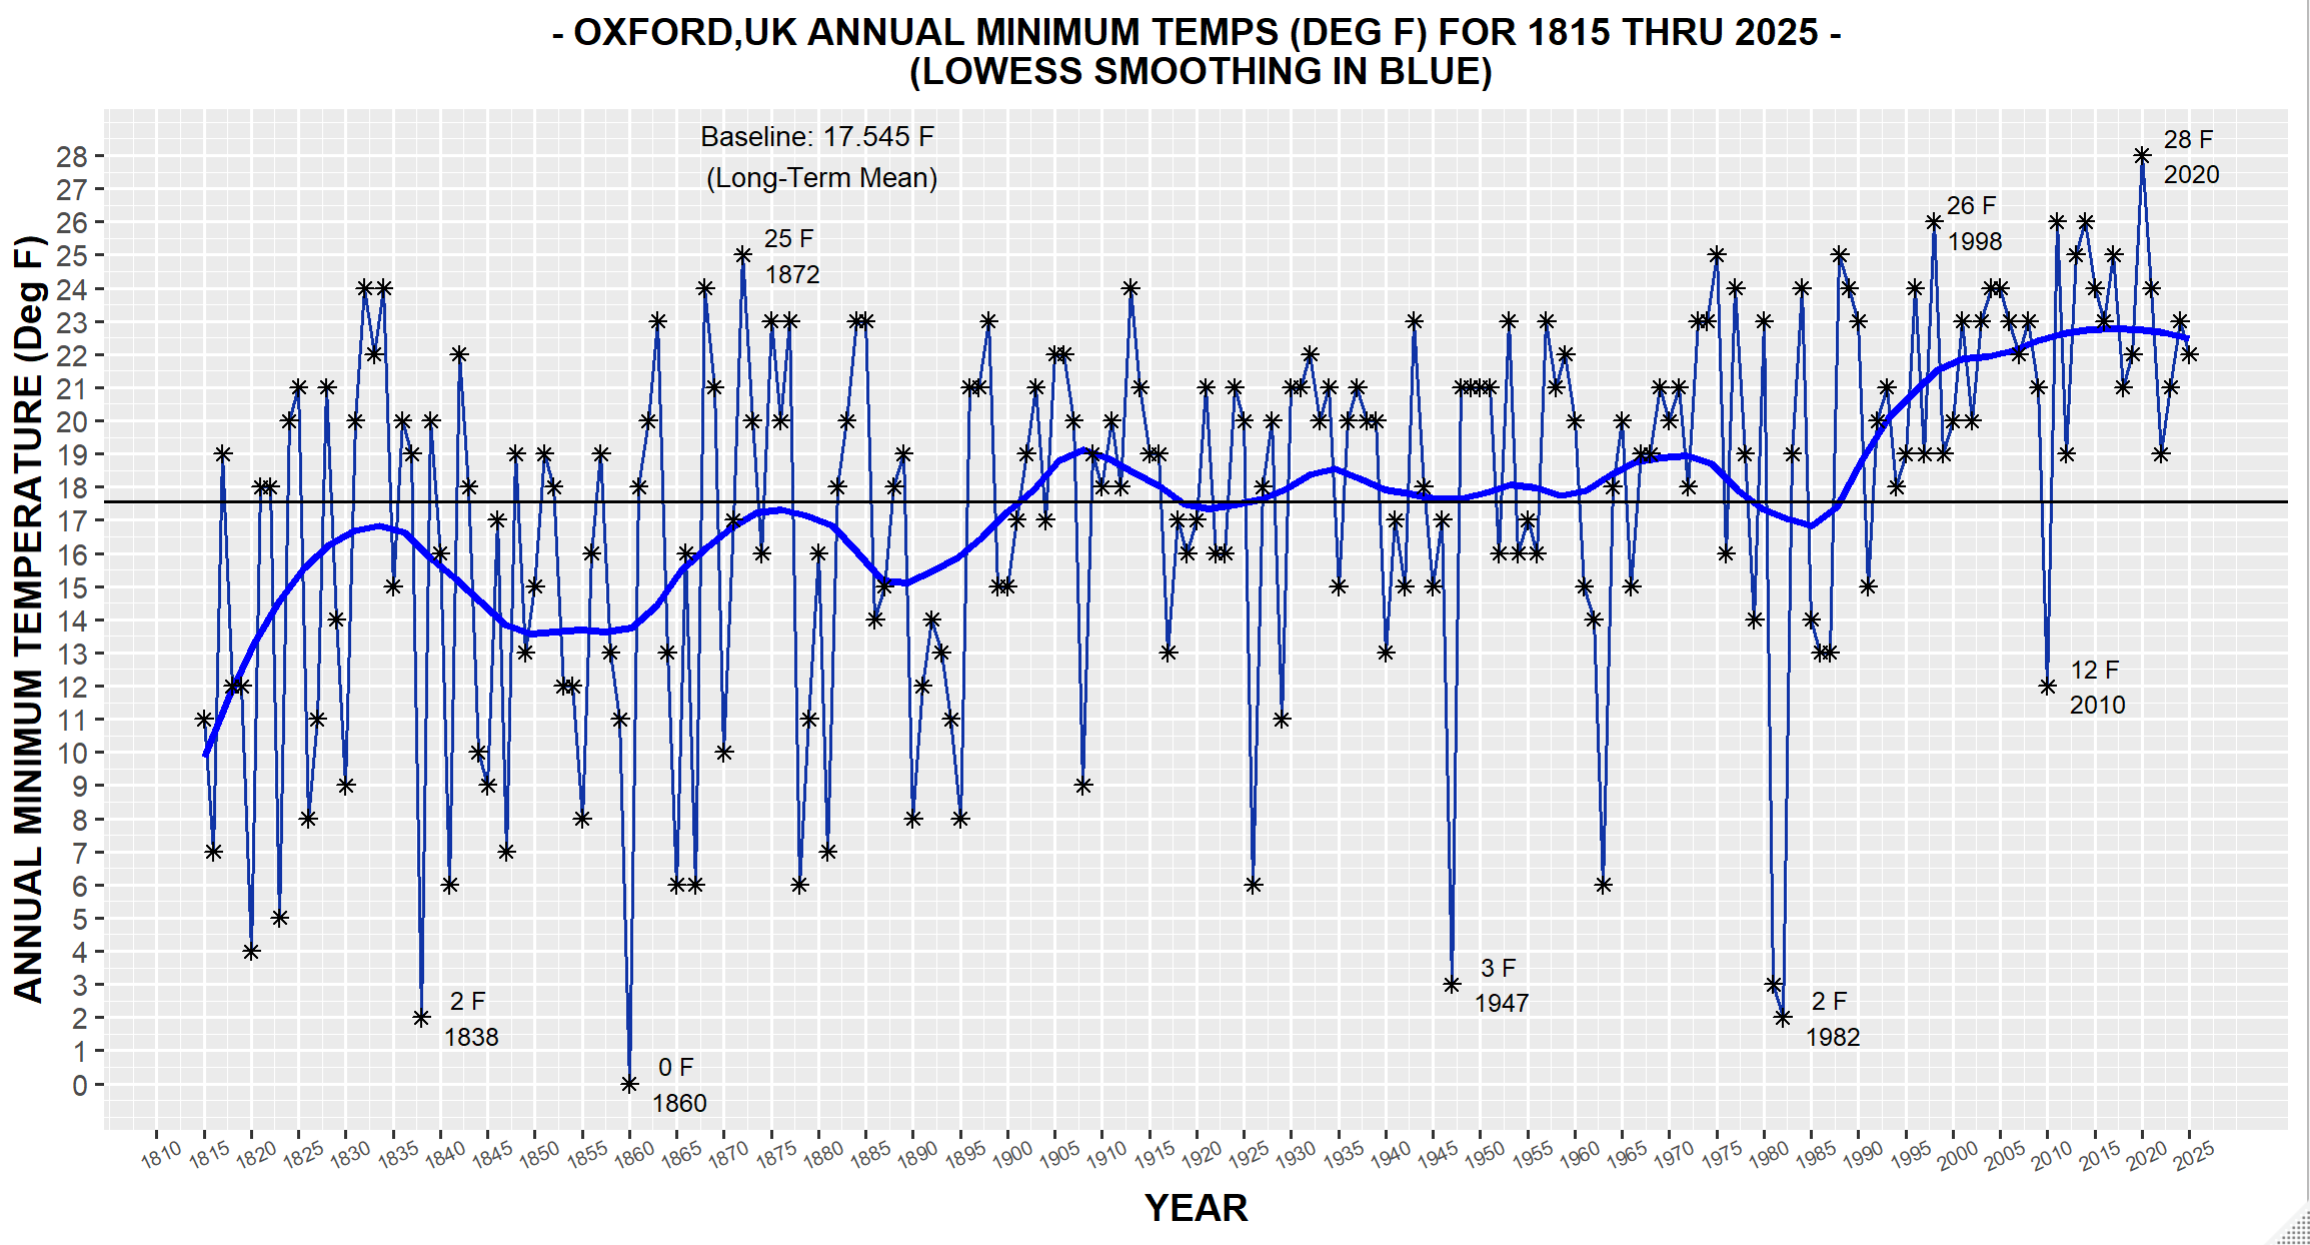
- Oxford Annual Minimum Temperatures (1815–2025) New (5/3/26)
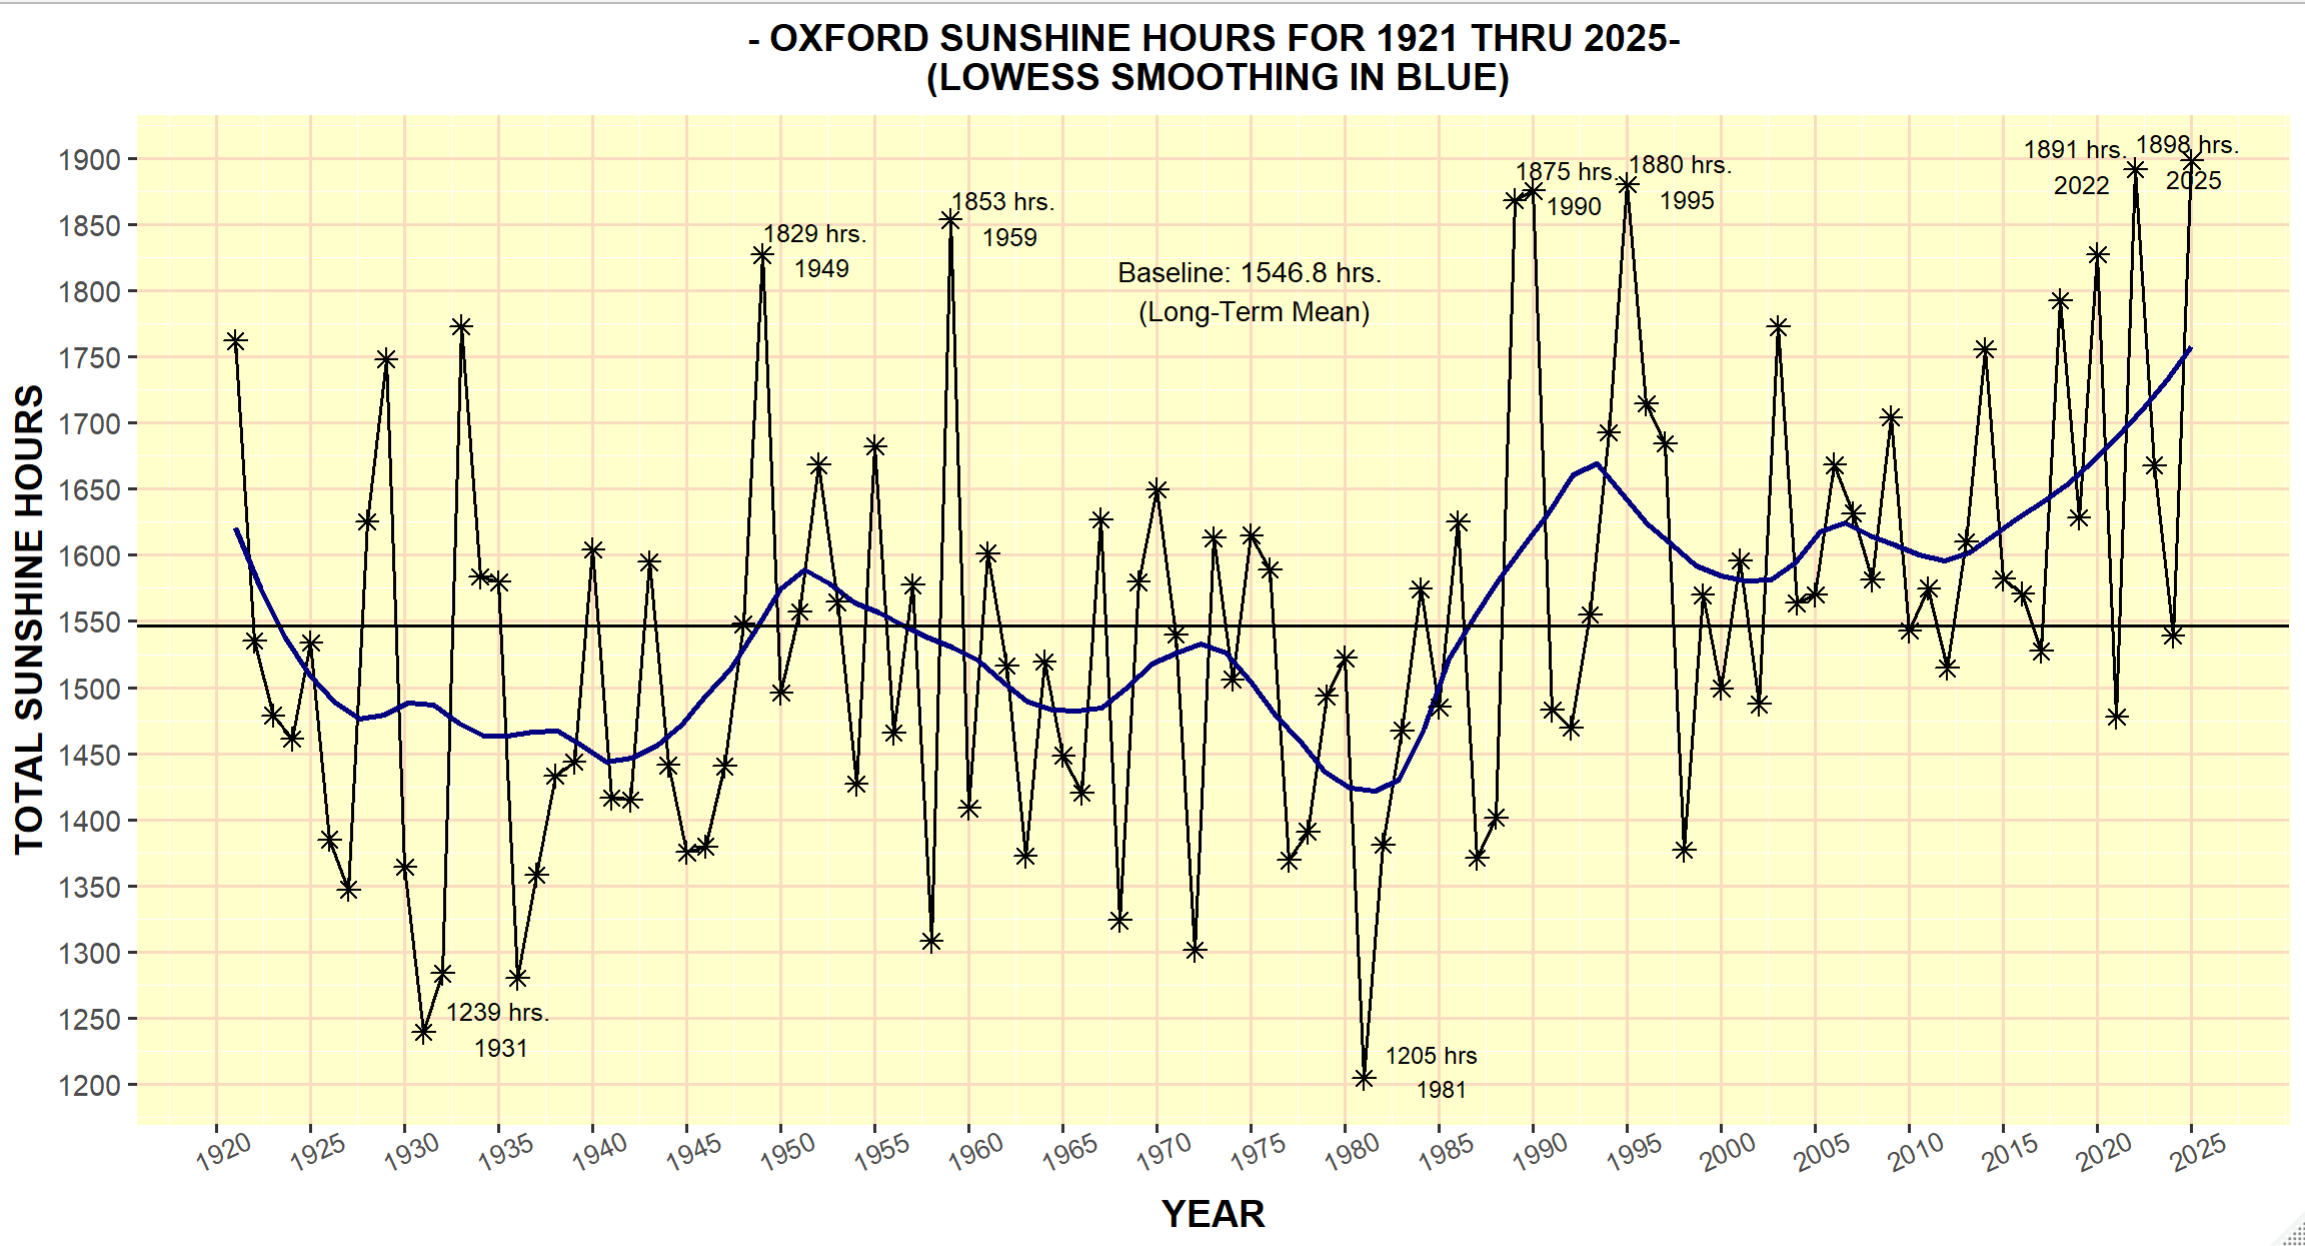
- Oxford Annual Total Sunshine Hours (1921–2025) New (5/3/26)
Climate Overview Charts
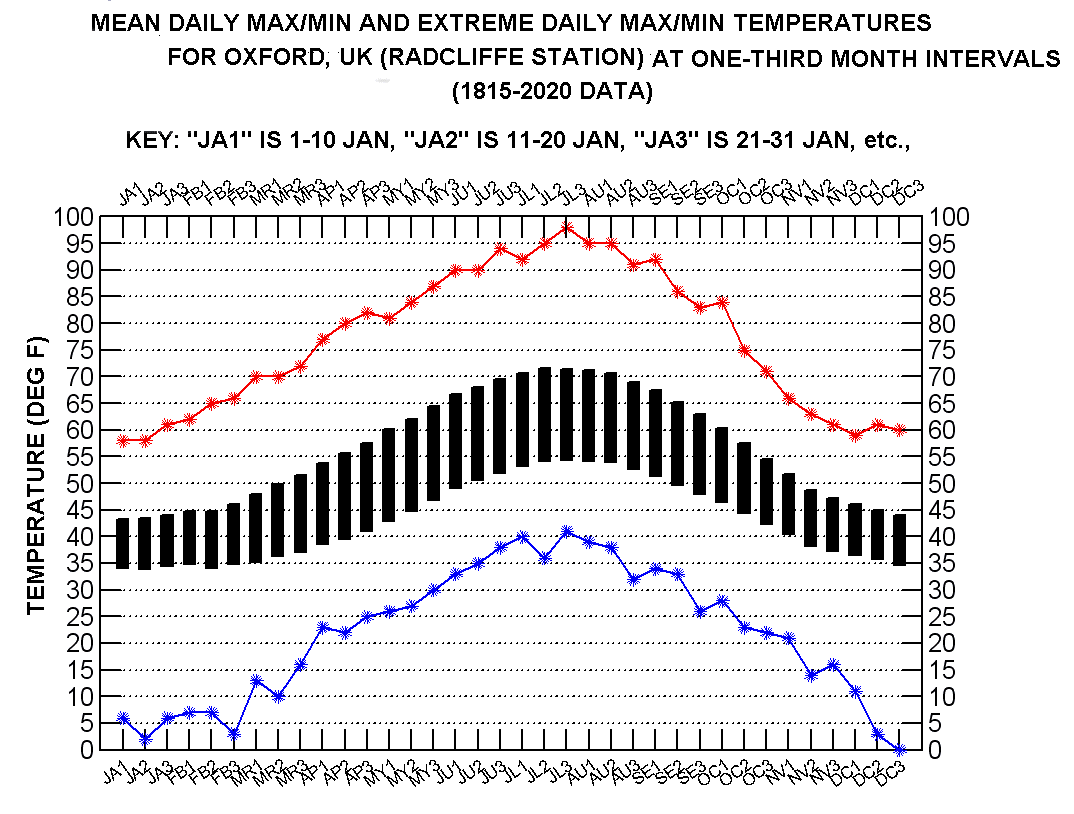
- Oxford Mean & Extreme Daily Max/Min Temperatures at One-Third Month Intervals (1815–2020 Period of Record)
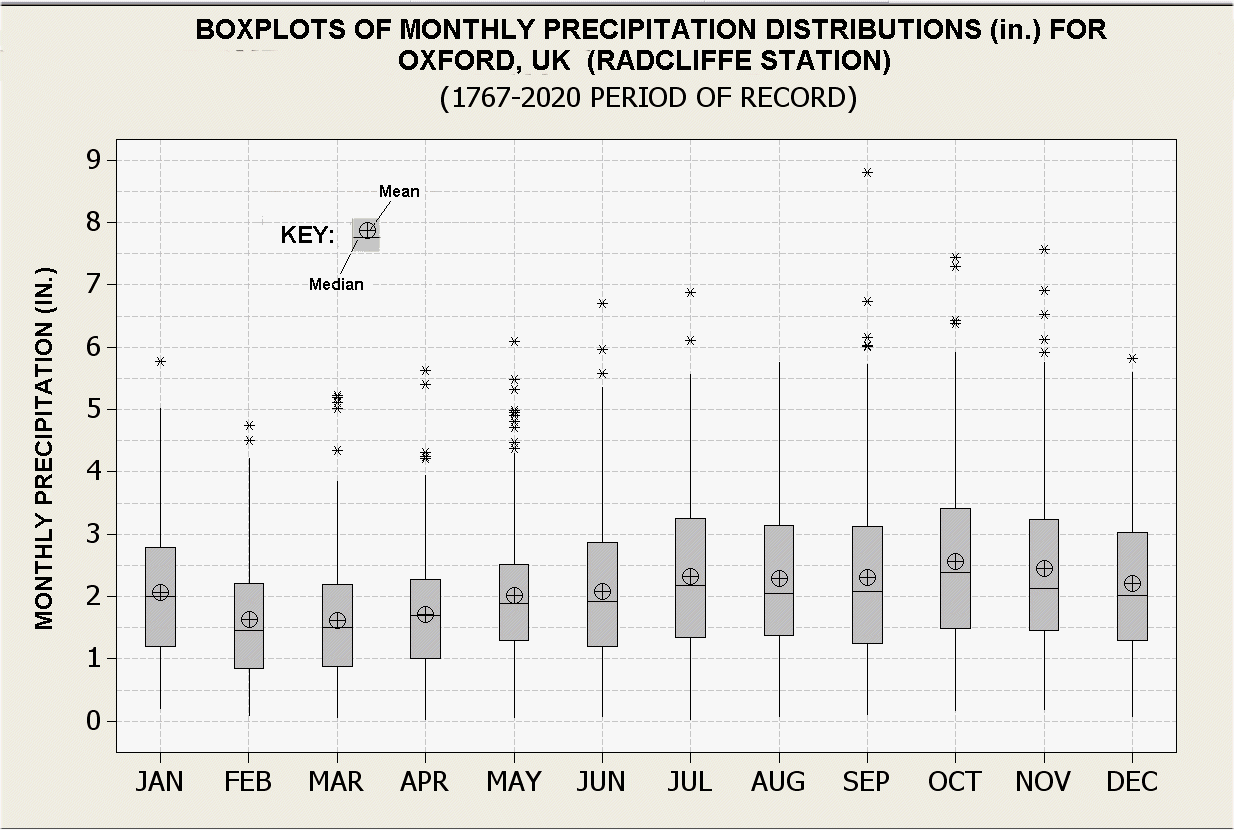
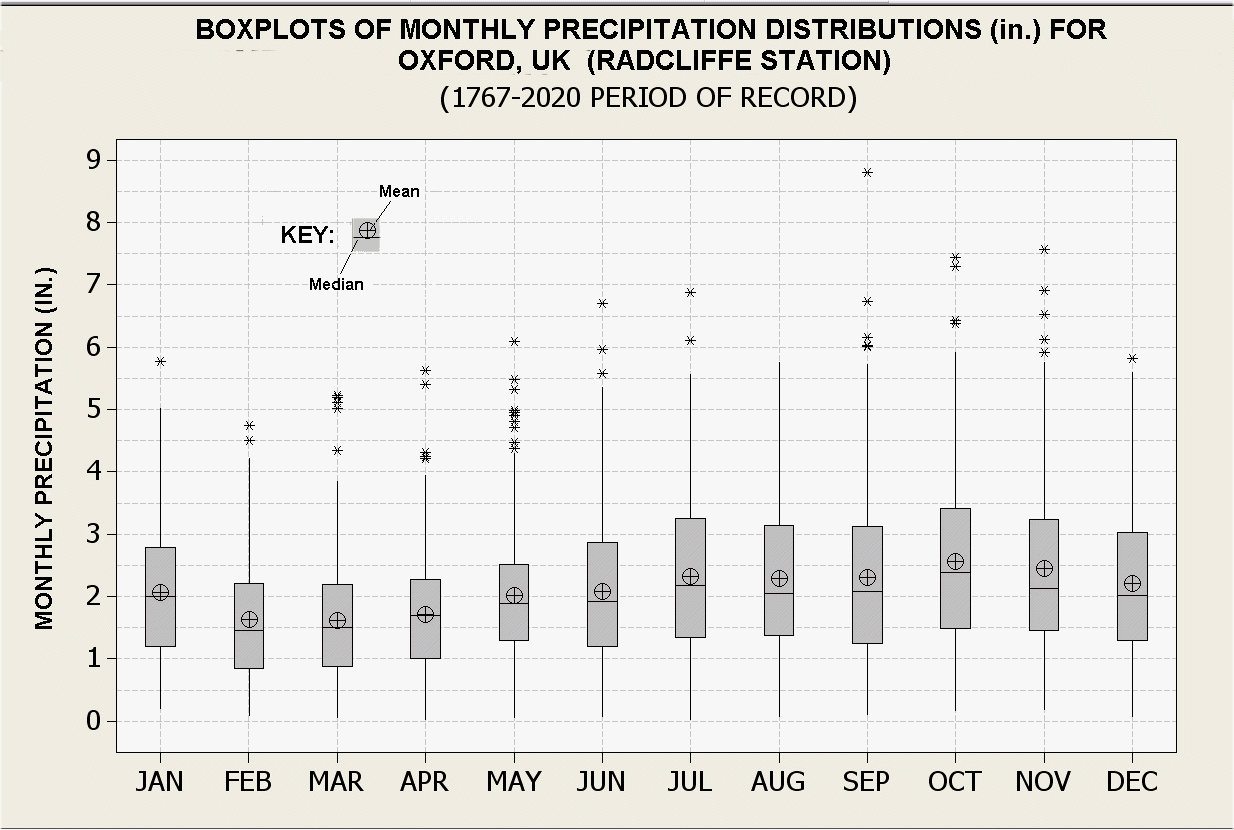
- Boxplots of Oxford Calendar Month Precipitation Distributions (1767–2020 Period of Record)
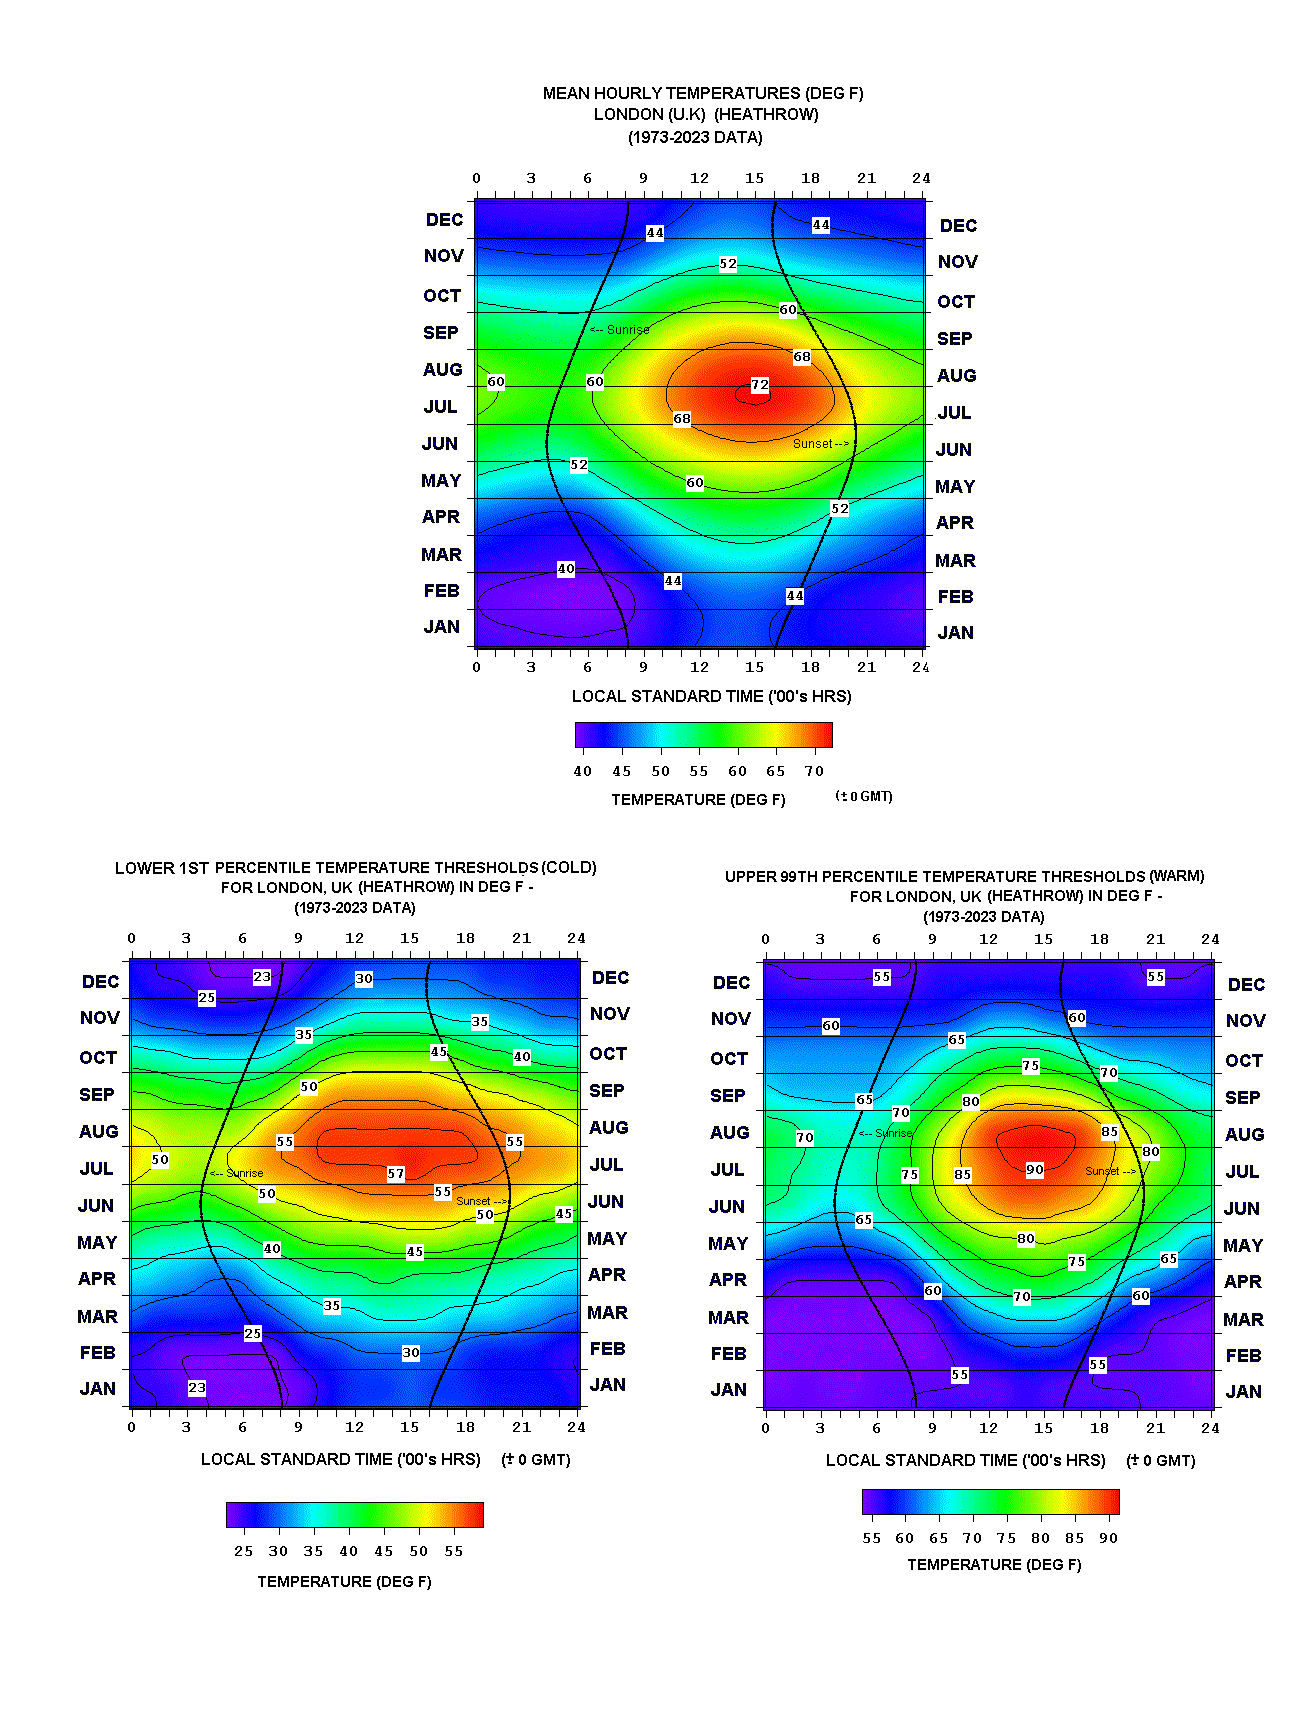
- London (Heathrow) Hourly Mean & Extreme Temperatures
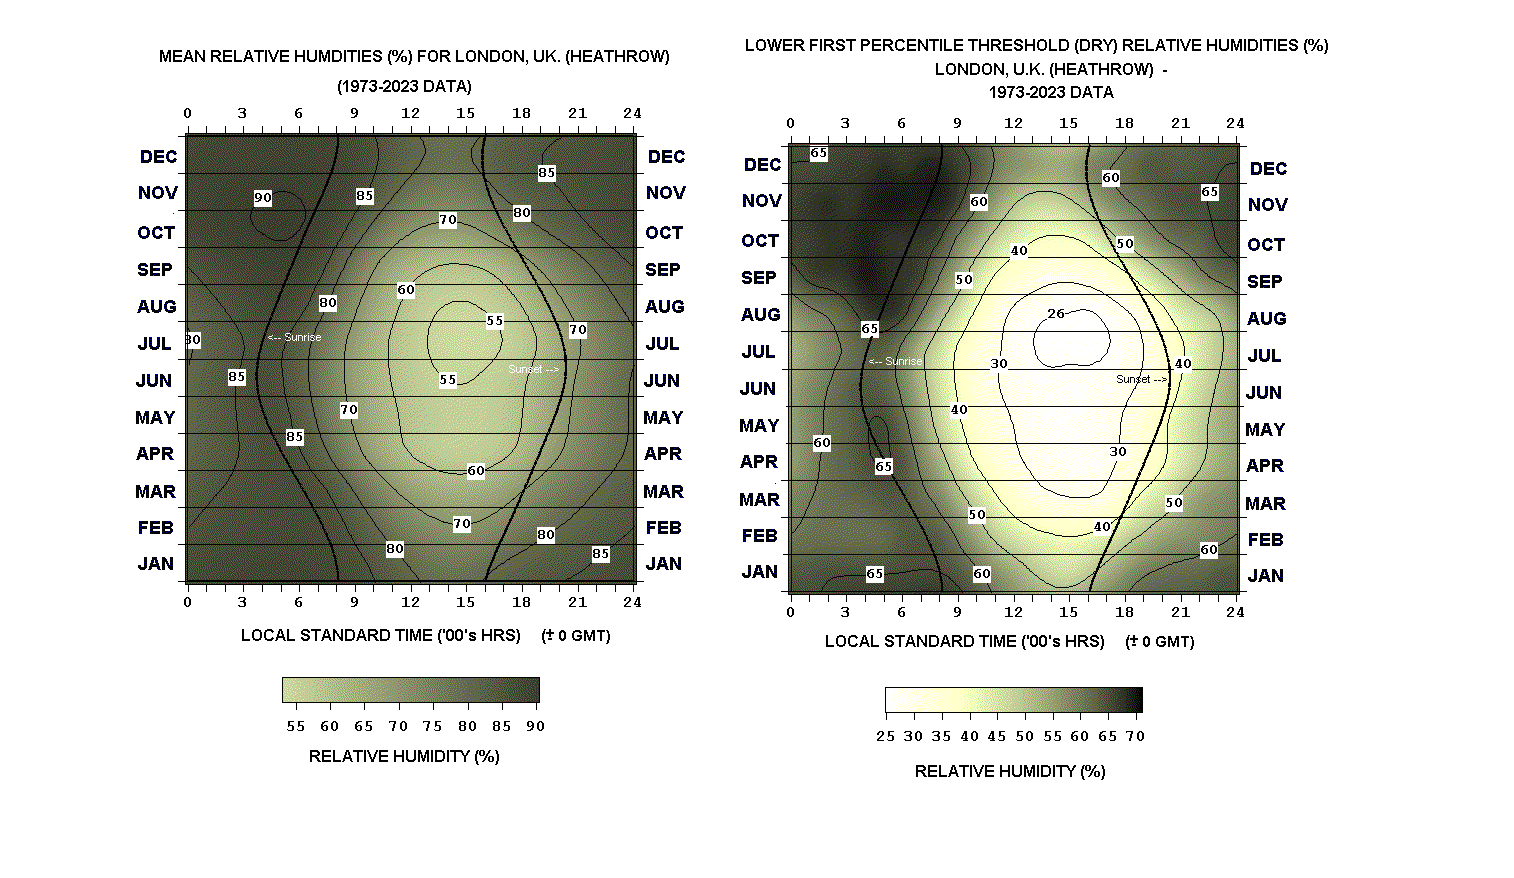
- London (Heathrow) Hourly Mean & Extreme Minimum Relative Humidities
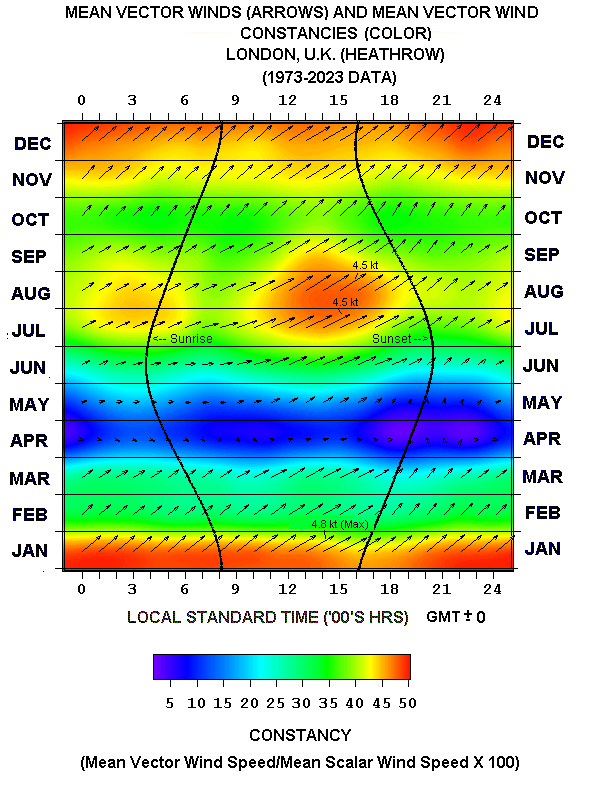
- London (Heathrow) Hourly Mean Vector Winds & Constancies
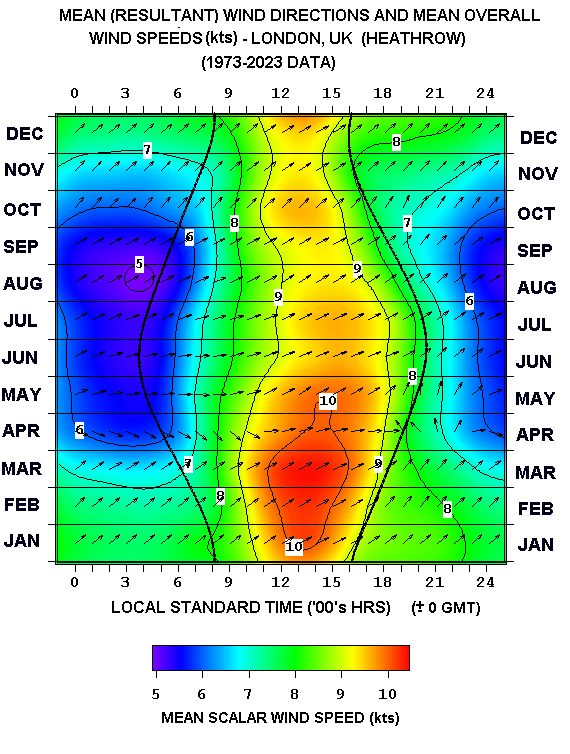
- London (Heathrow) Mean Hourly Wind Directions & Mean Hourly Speeds
Year-to-Year Graphs
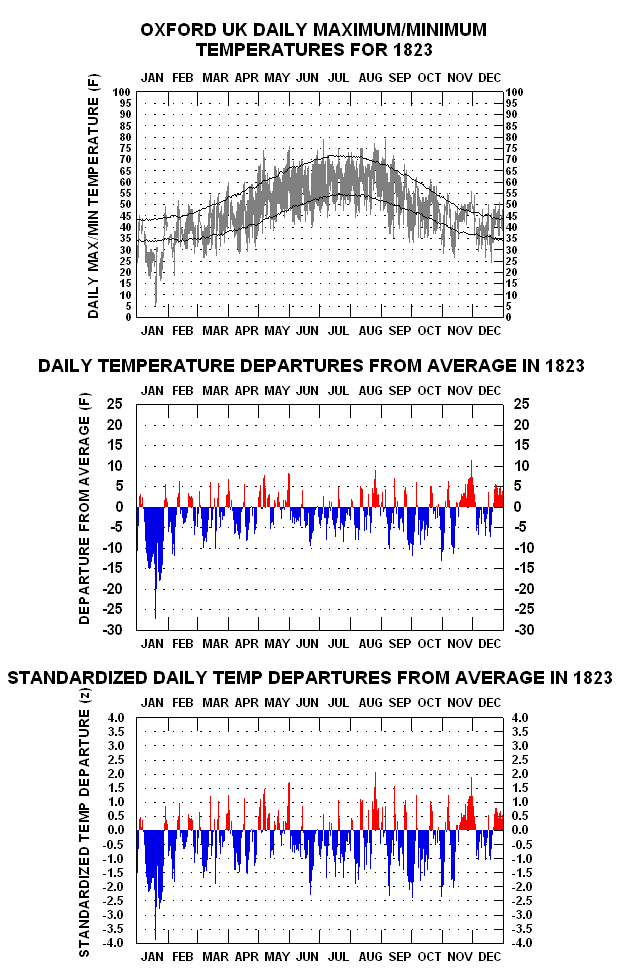
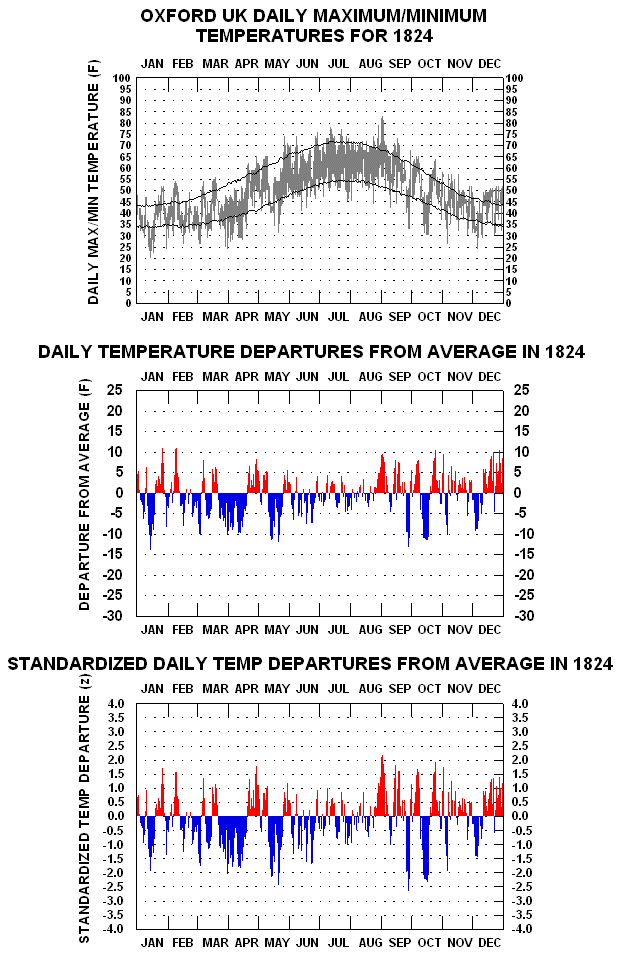
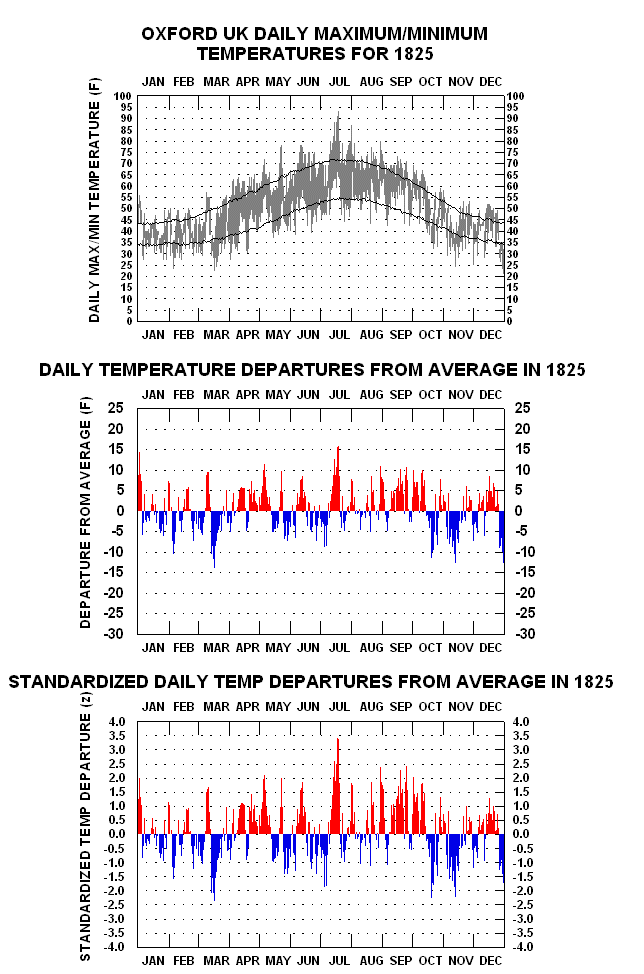
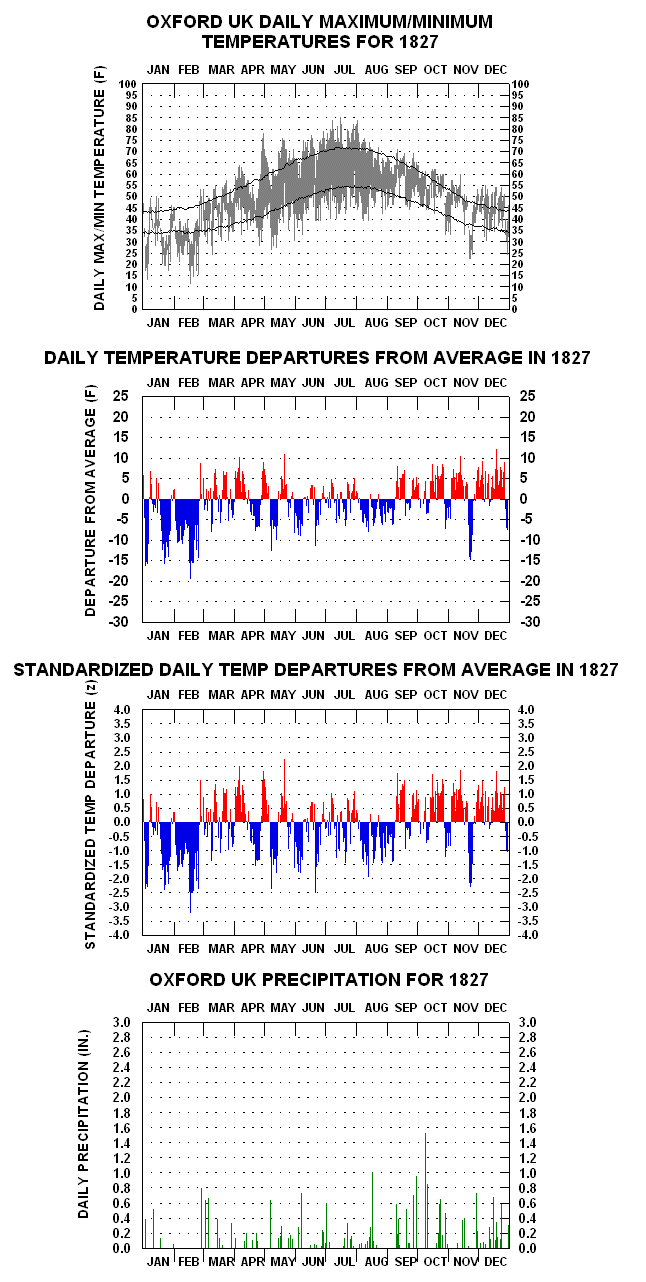
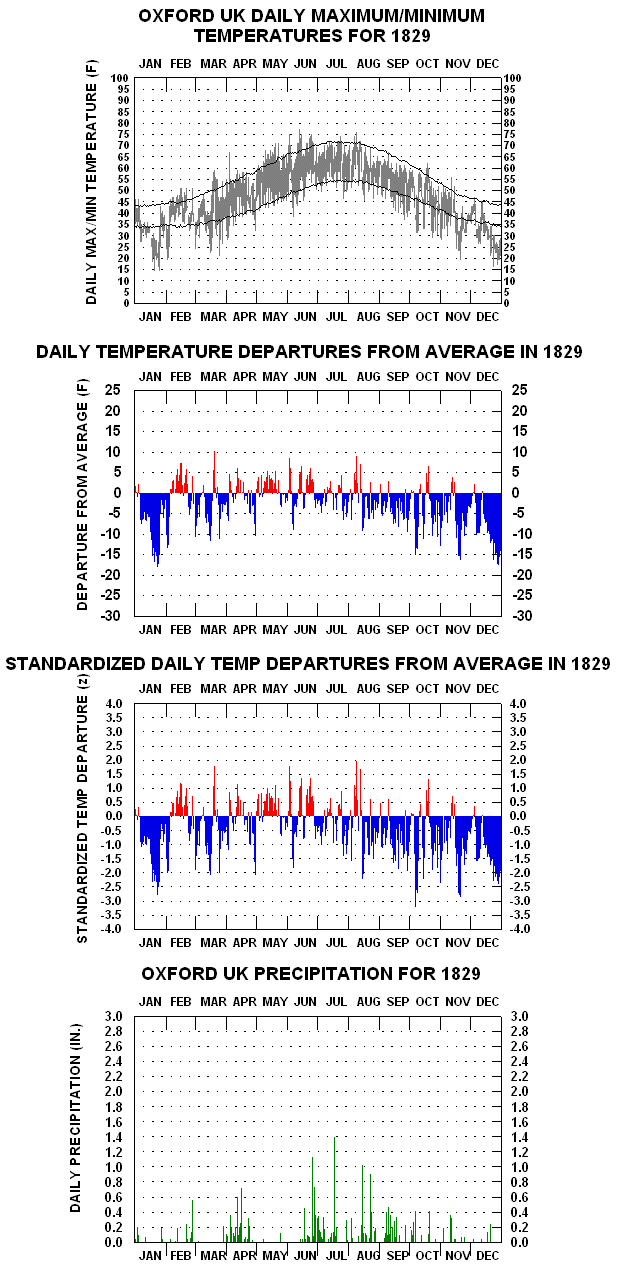
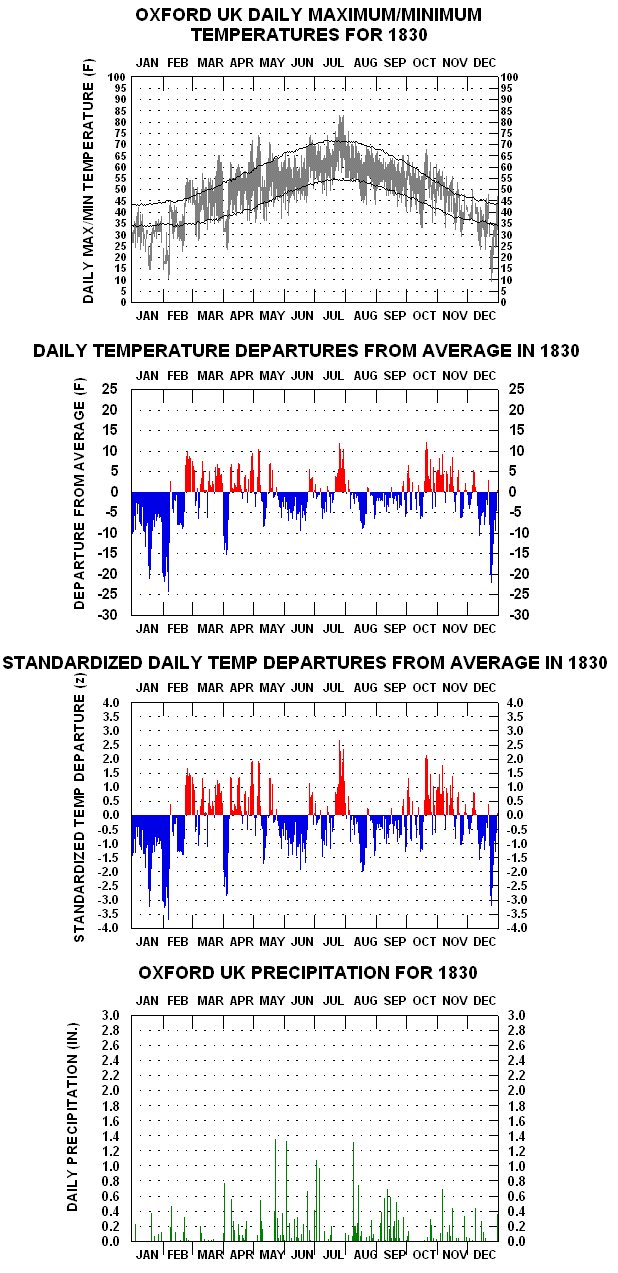
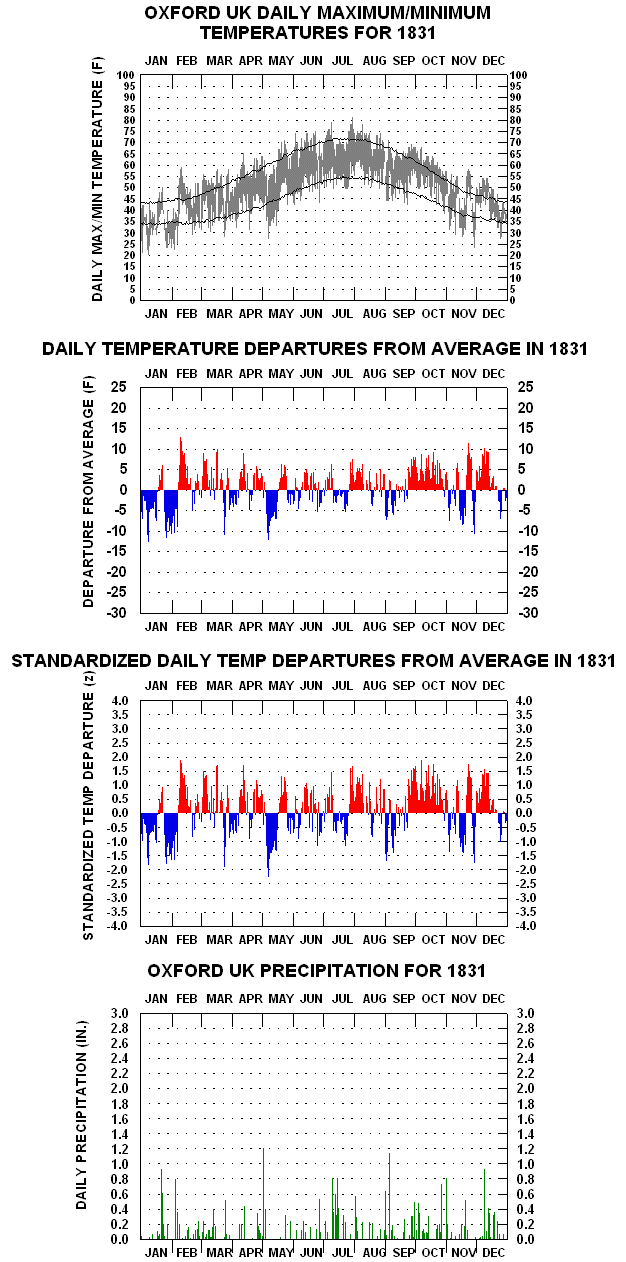
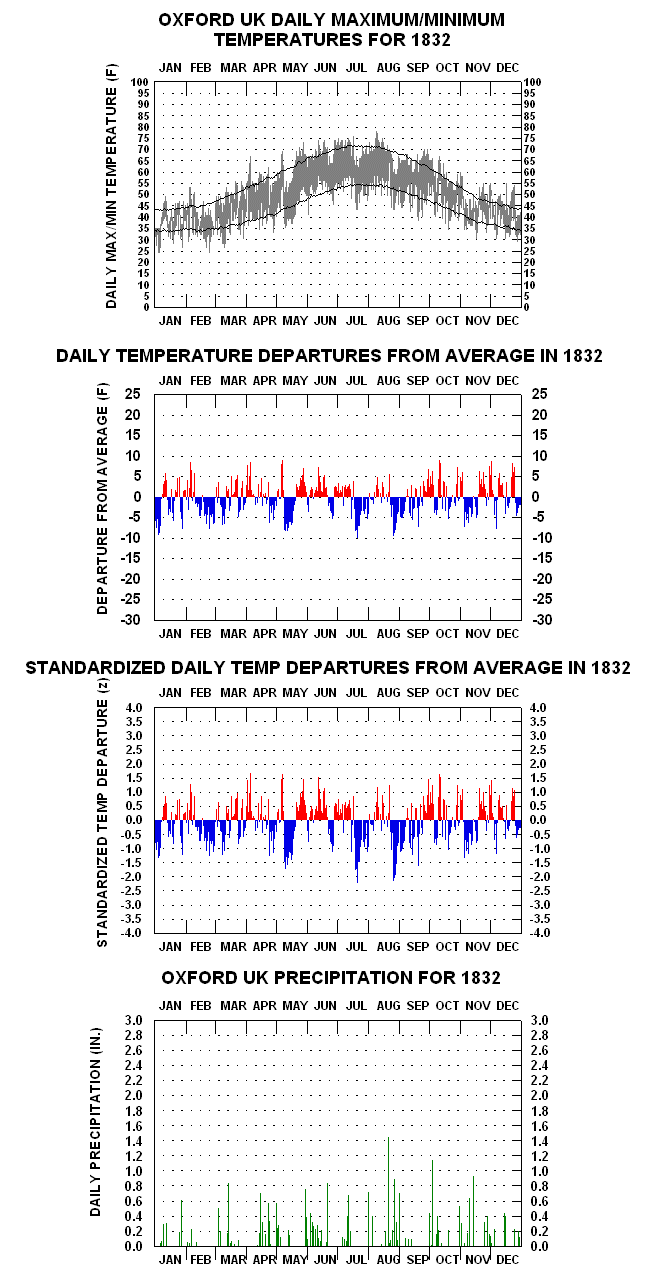
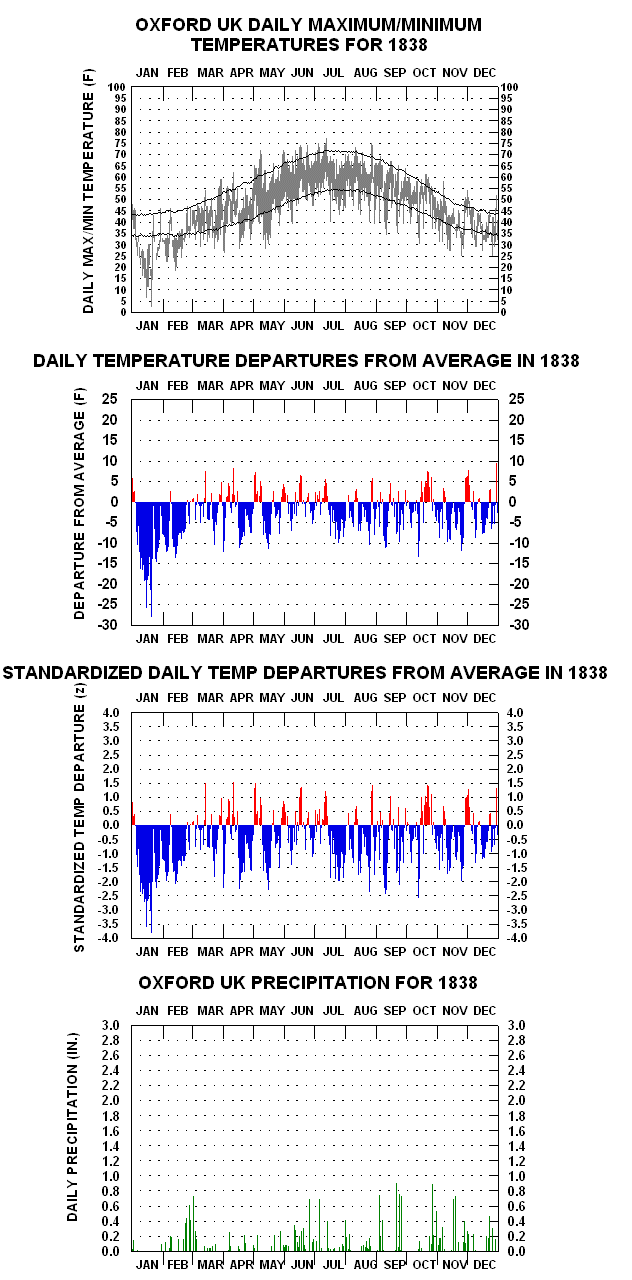
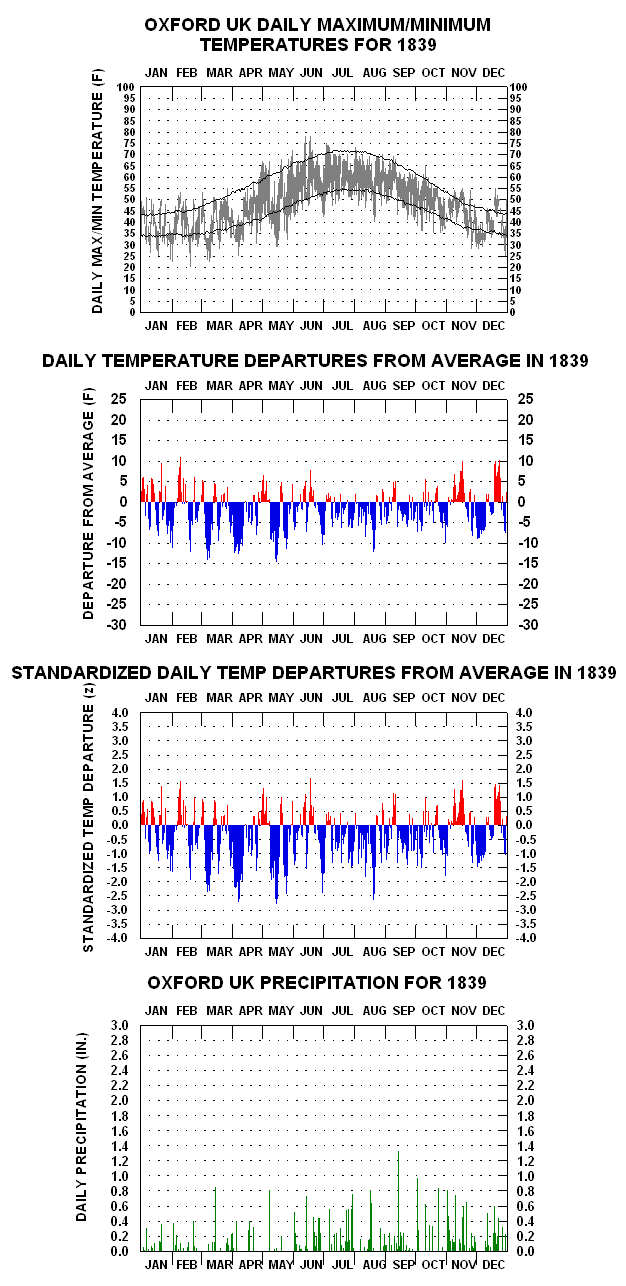
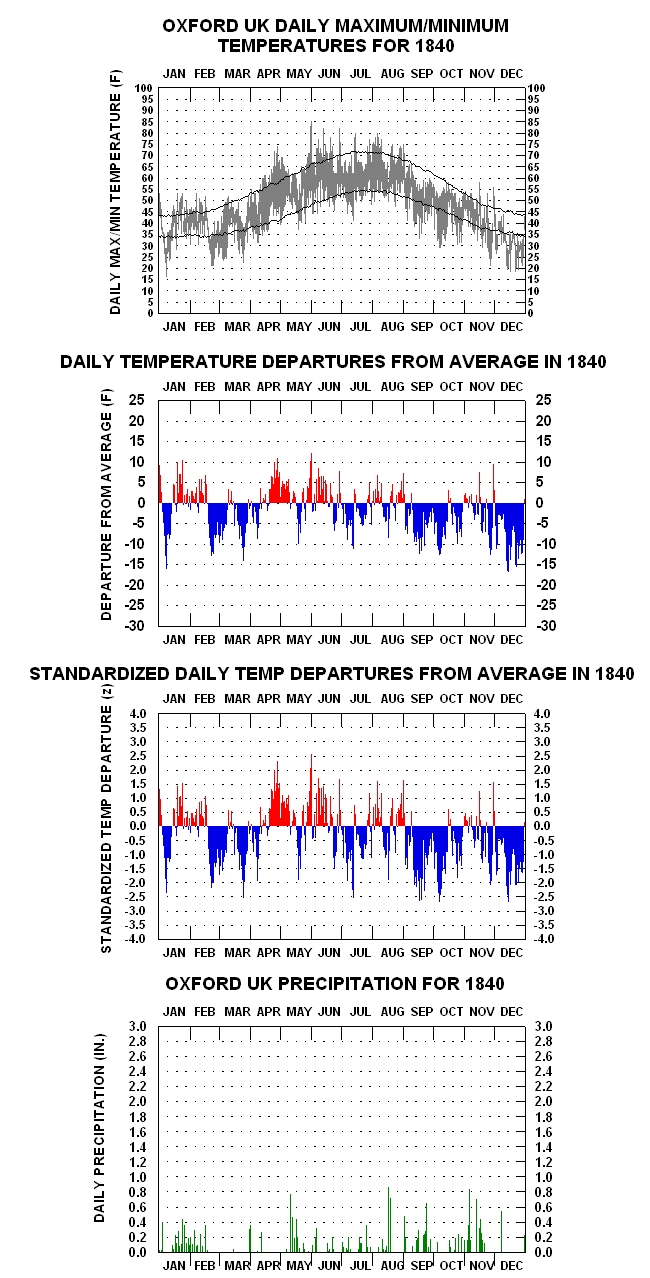
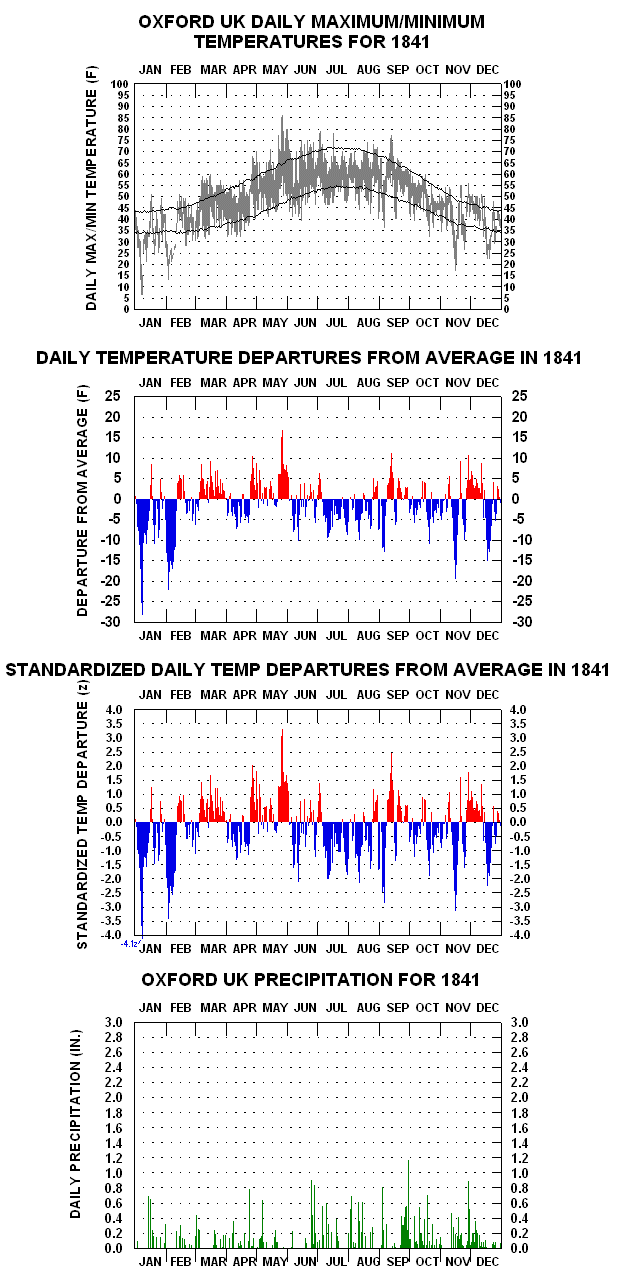
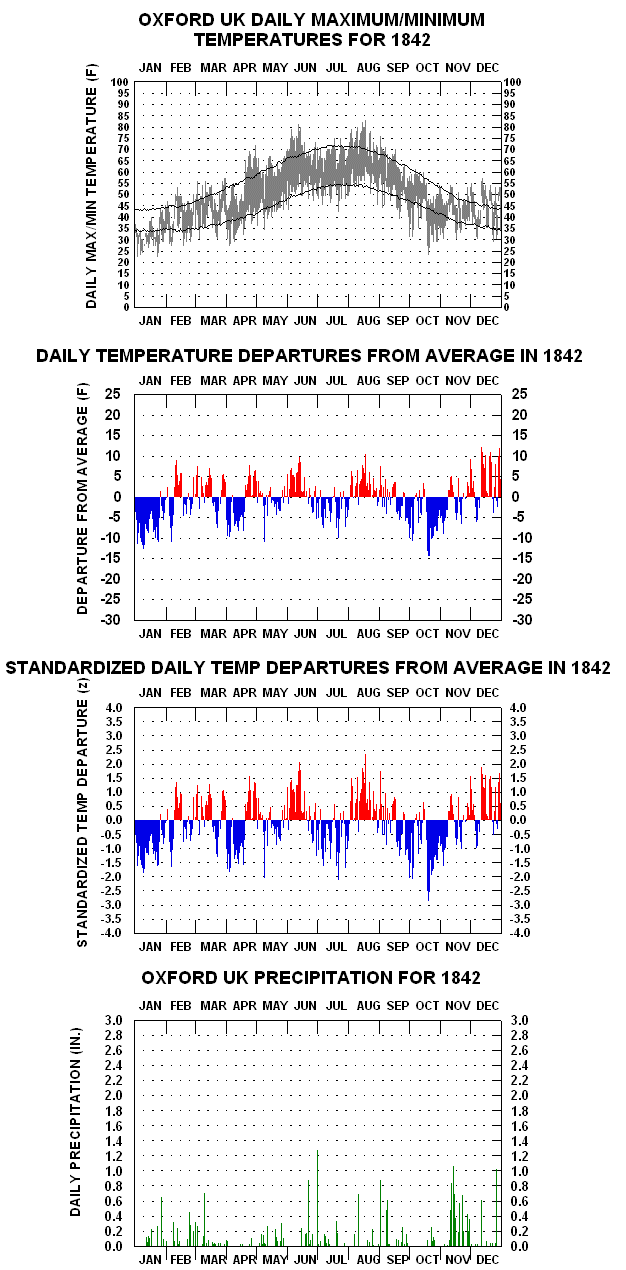
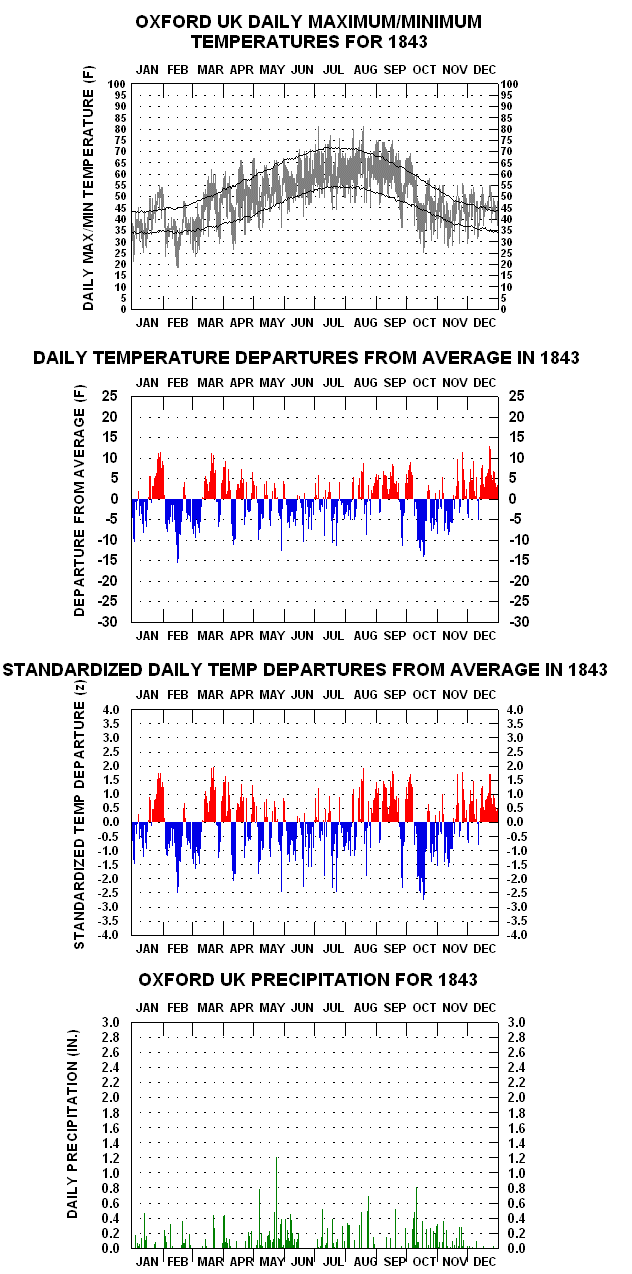
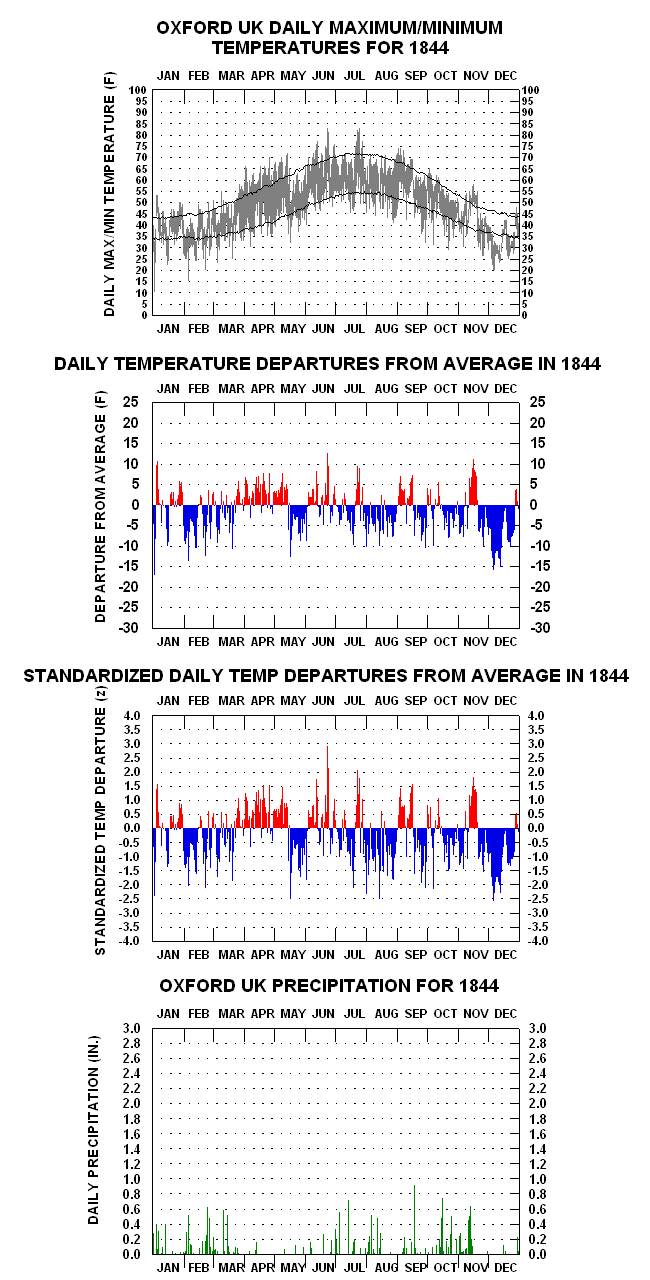
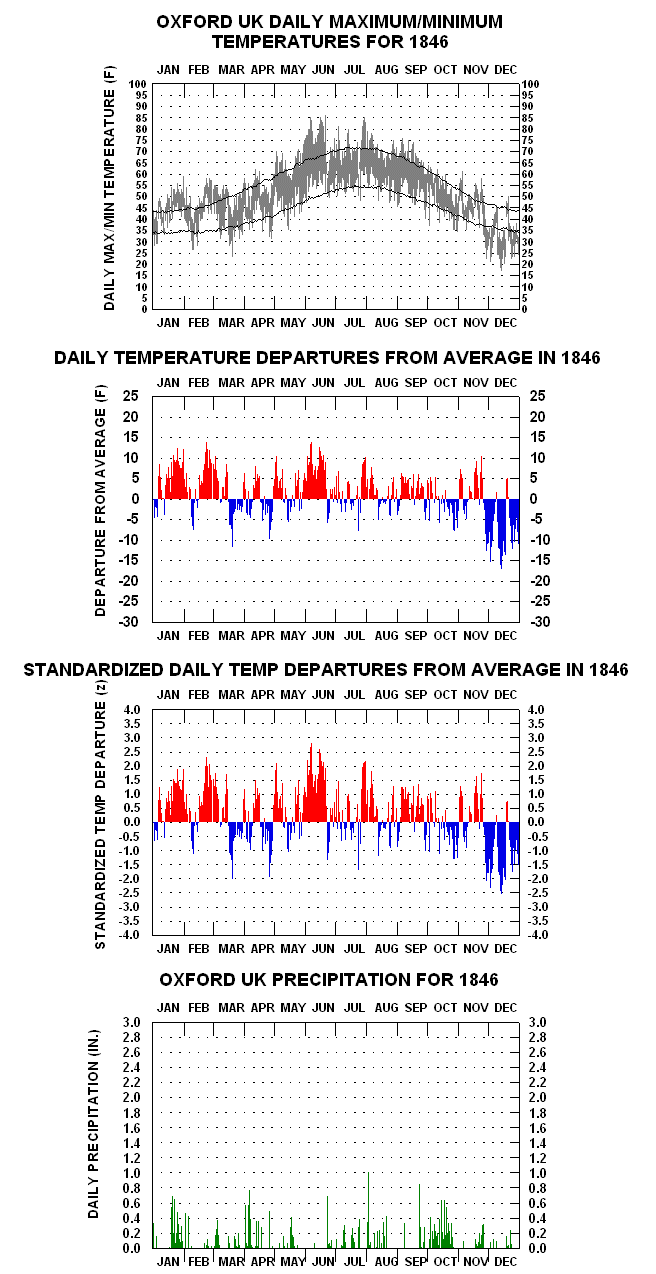
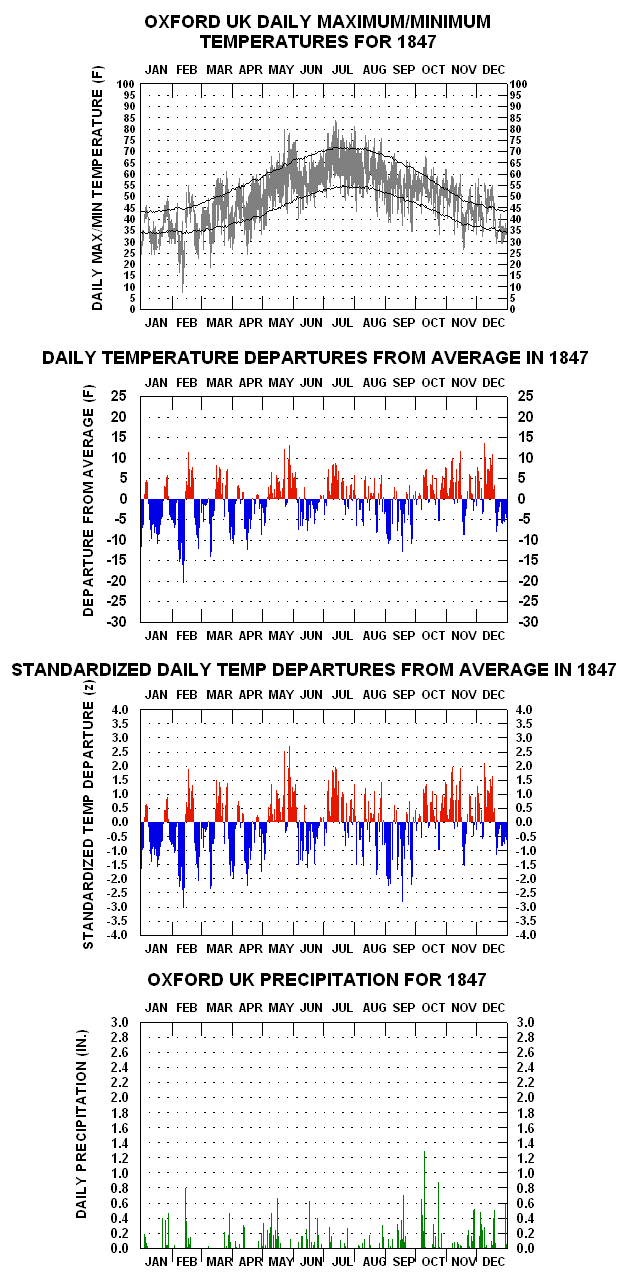
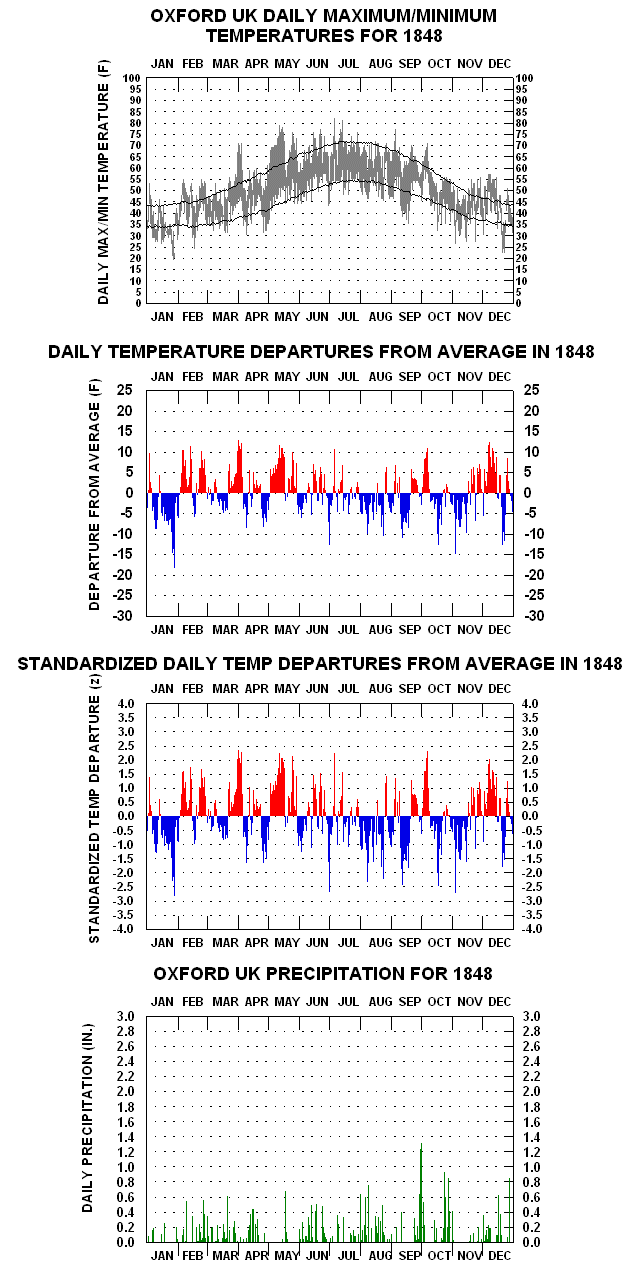
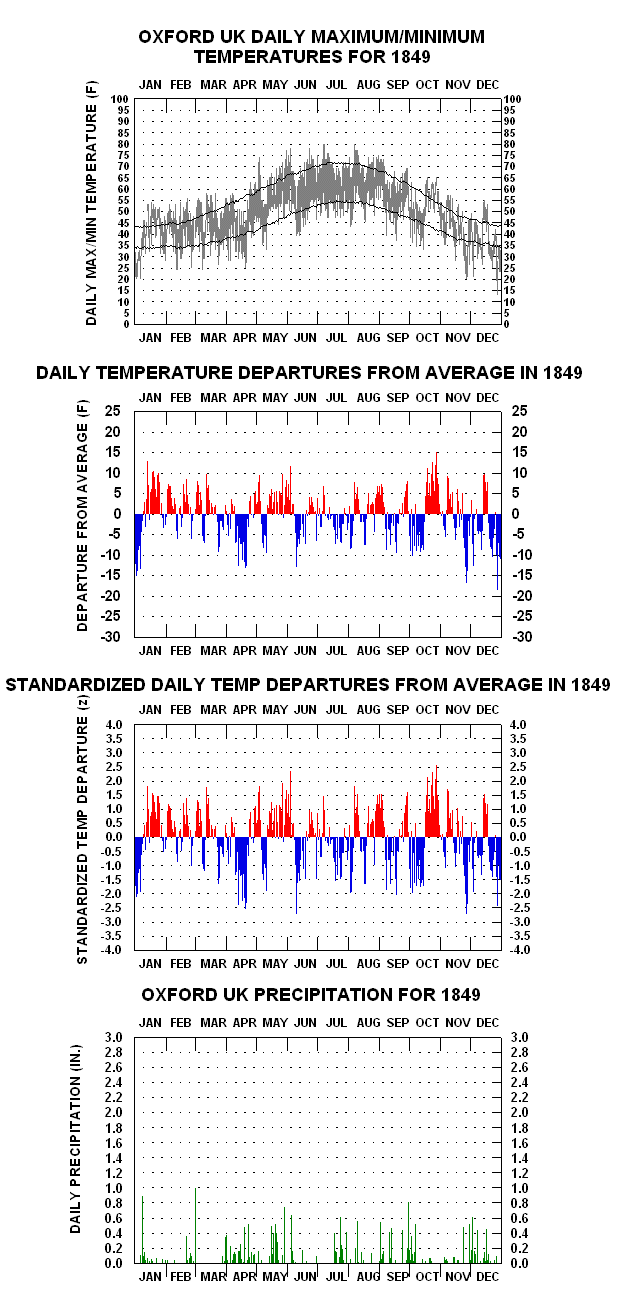
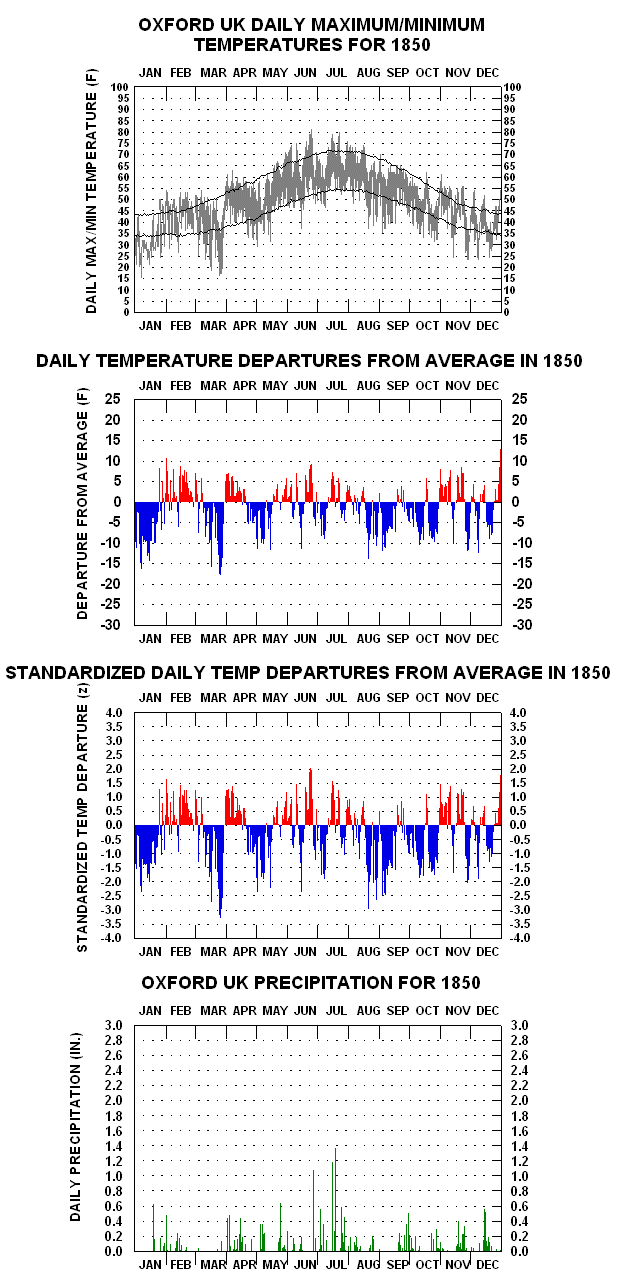
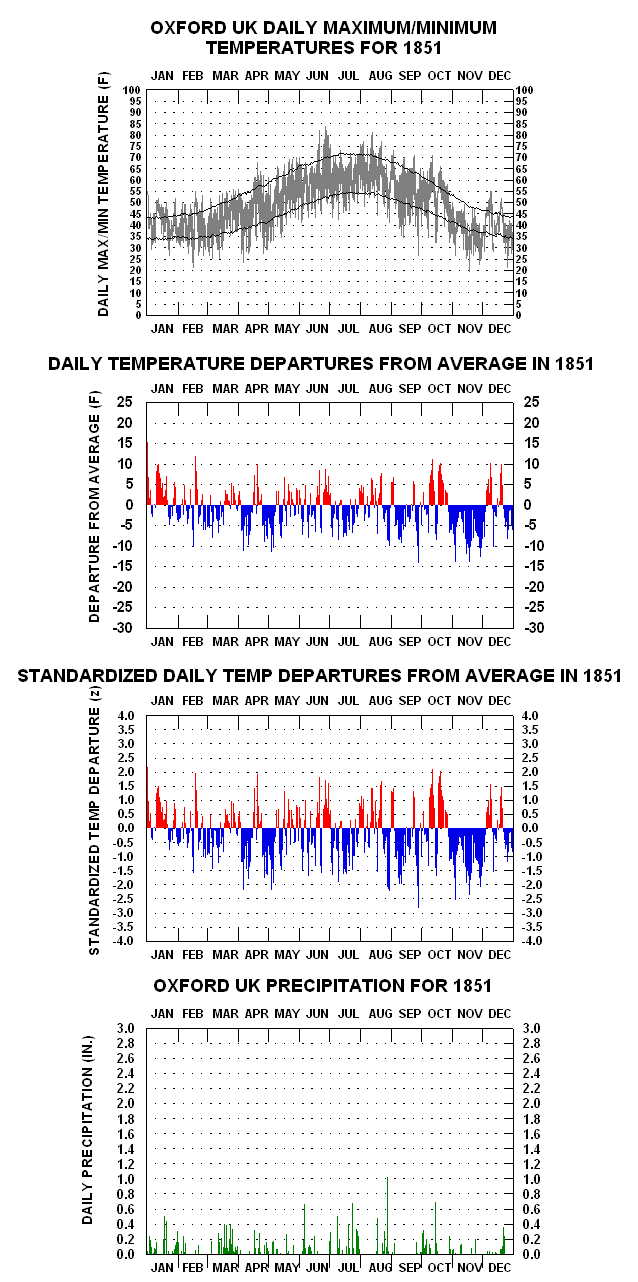
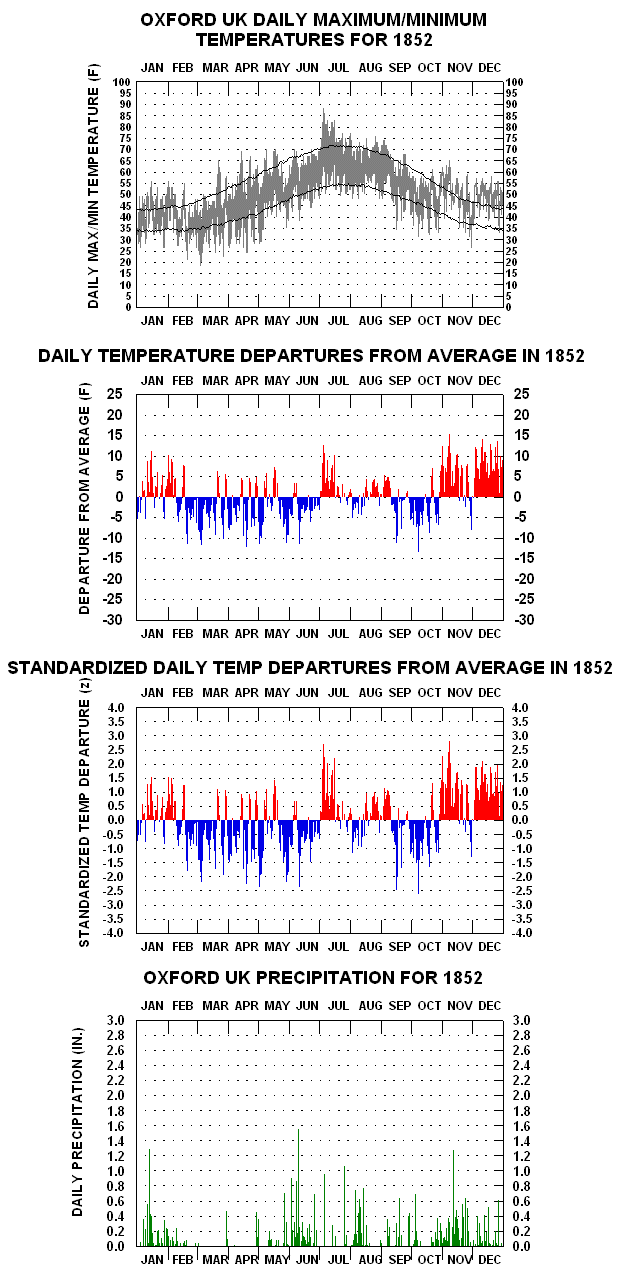
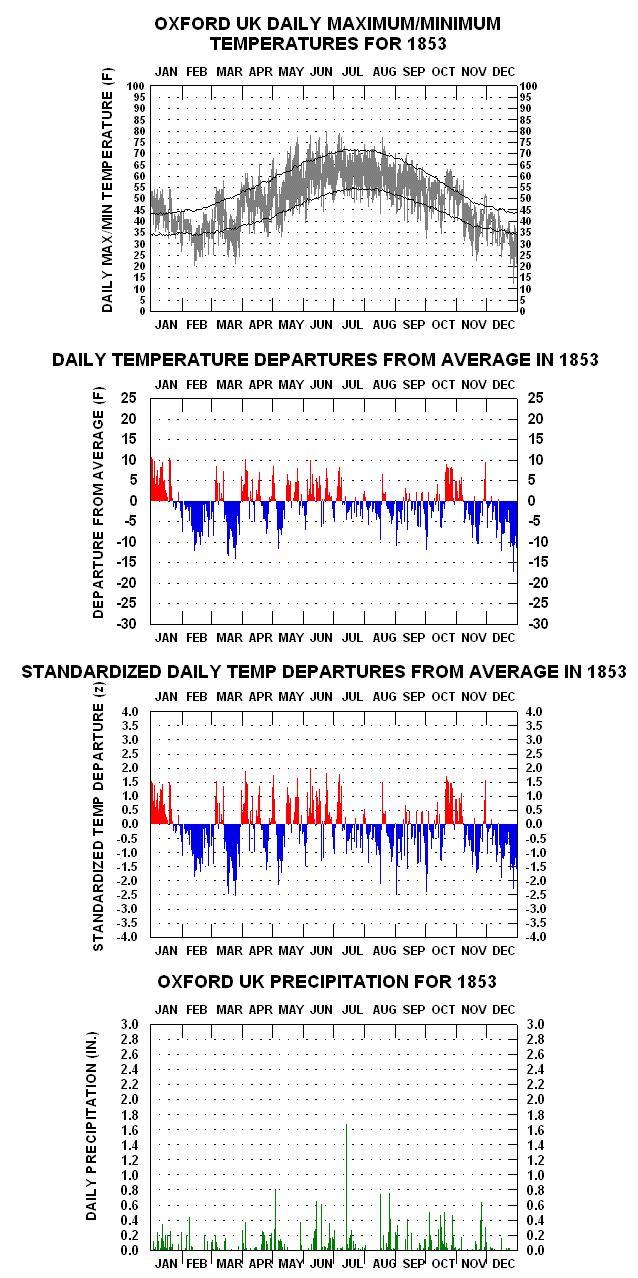
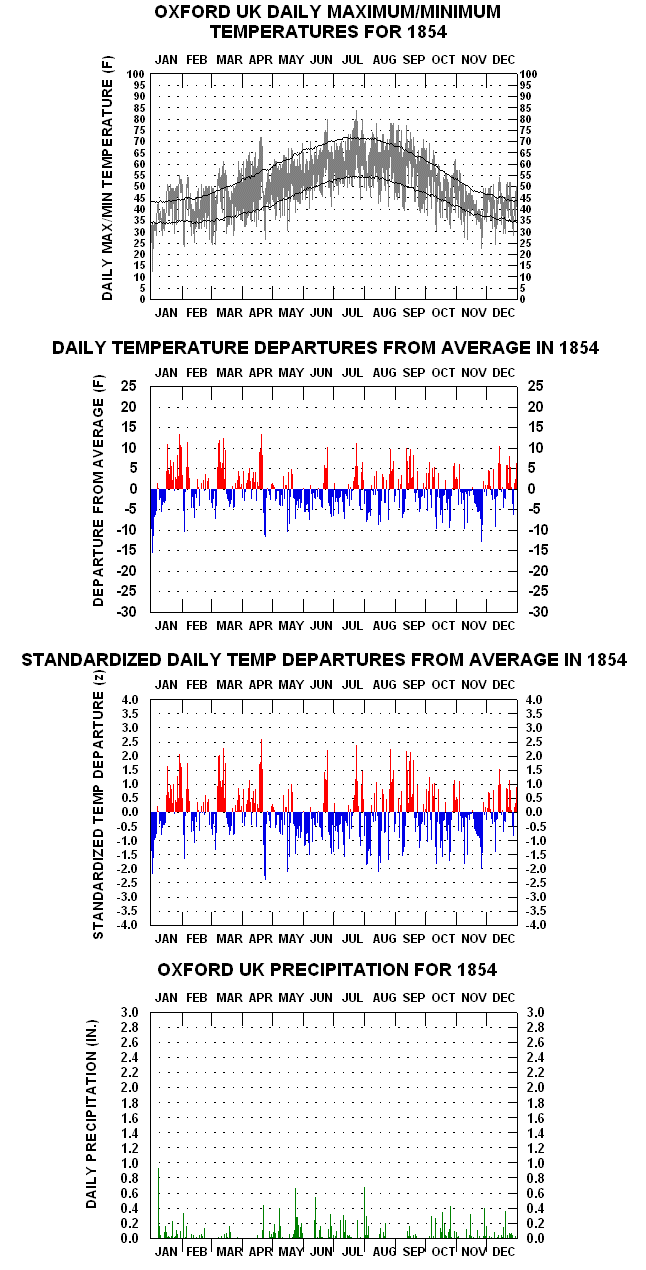
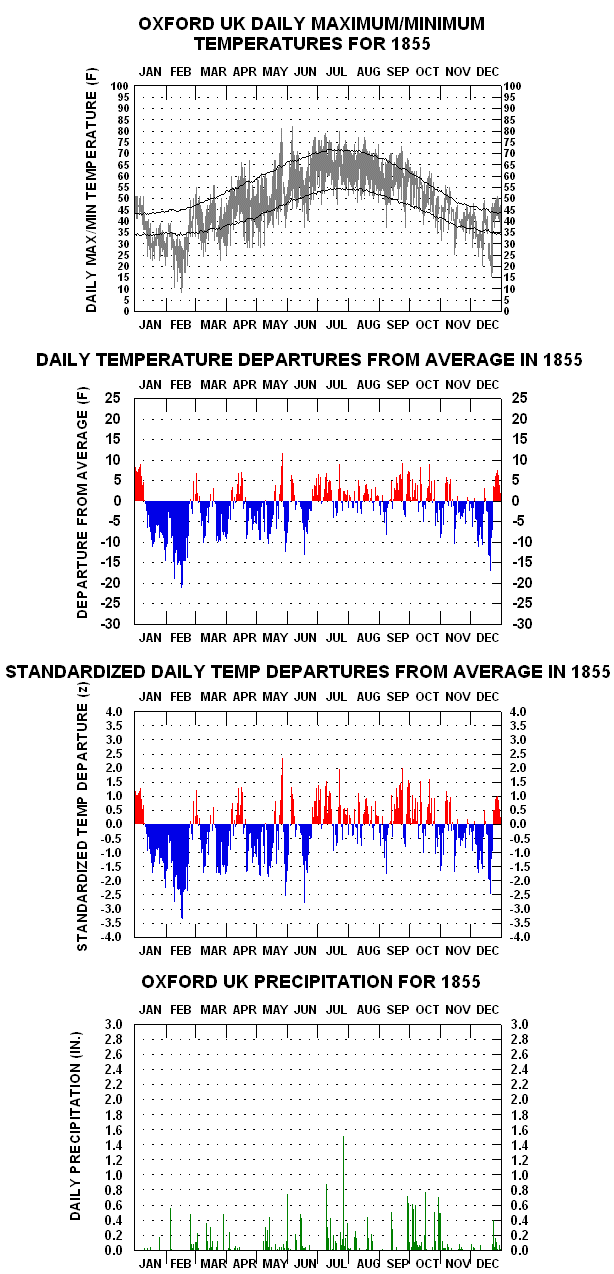
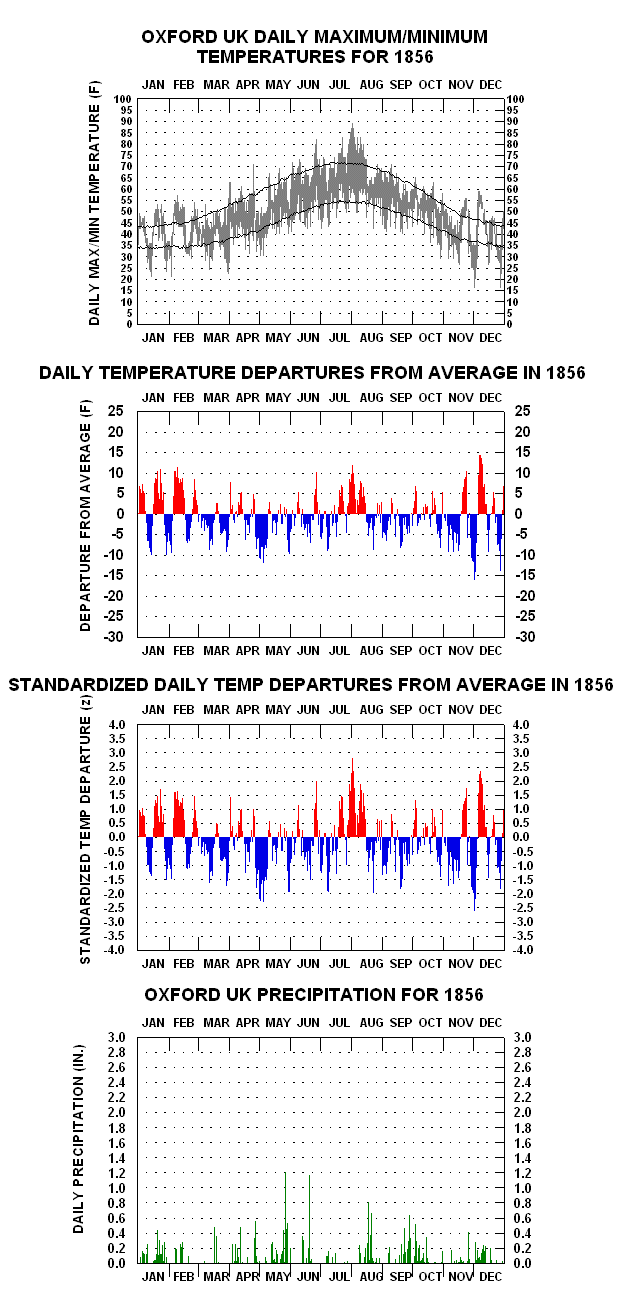
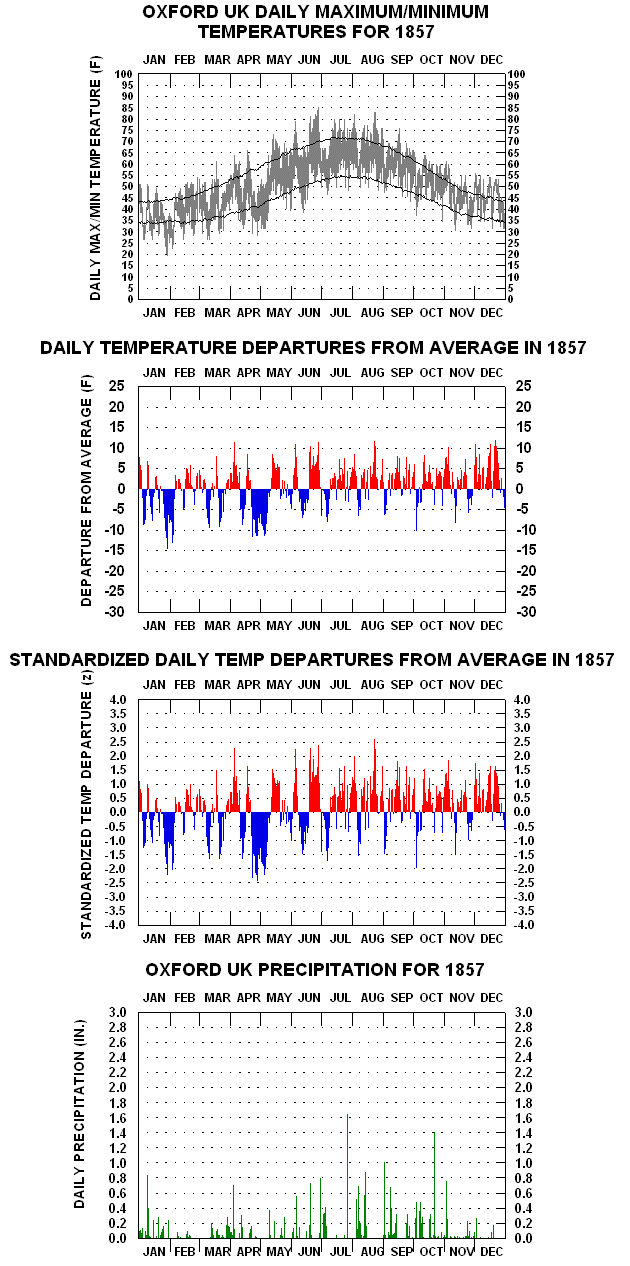
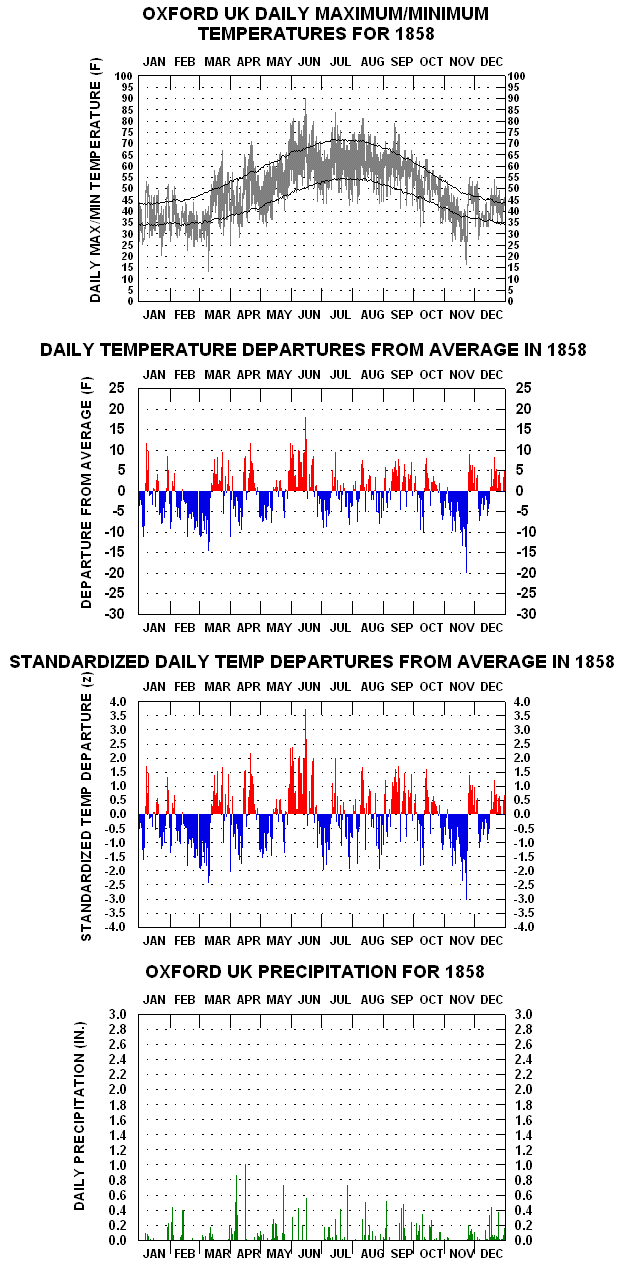
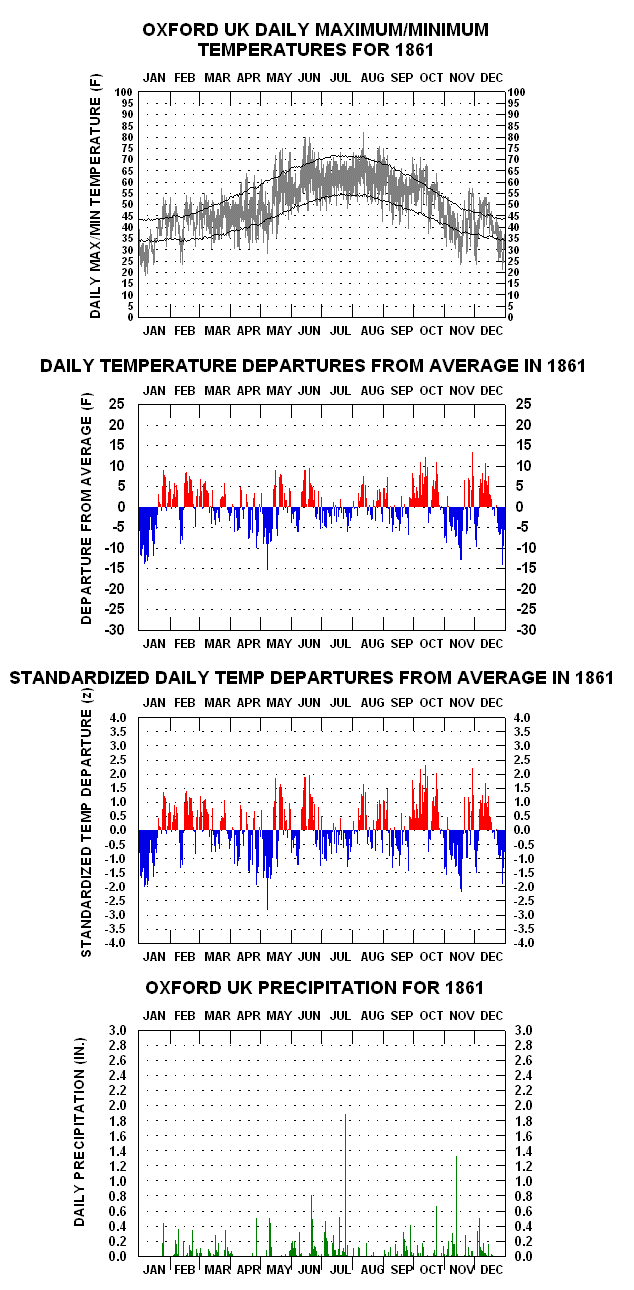
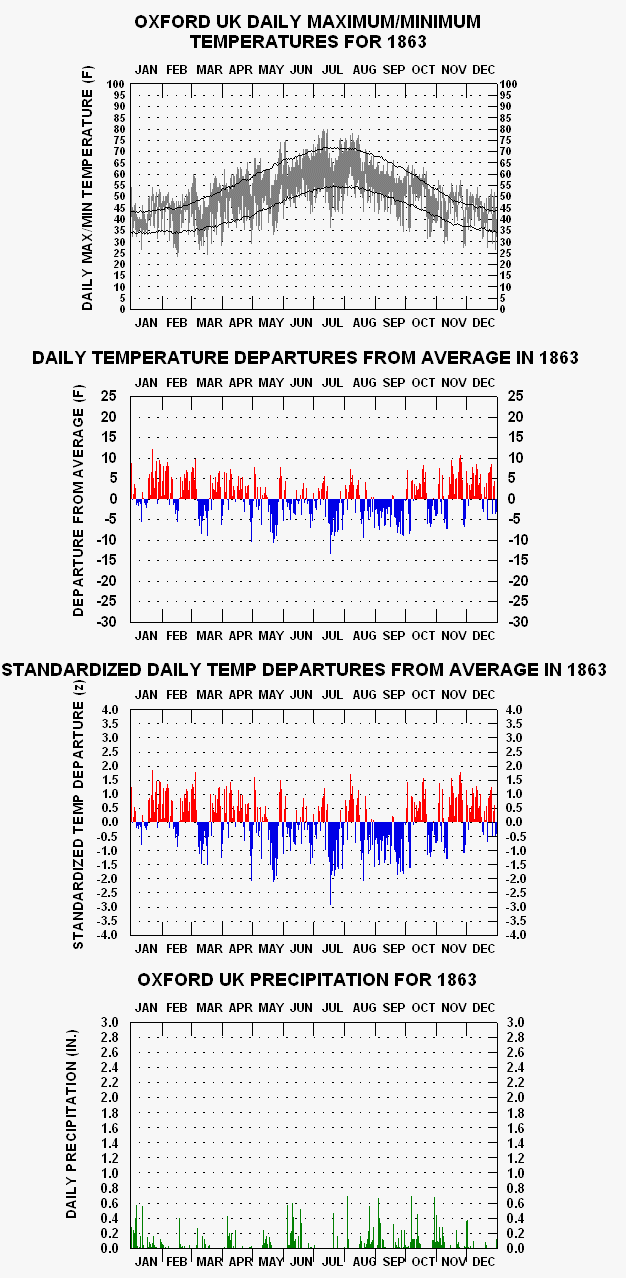
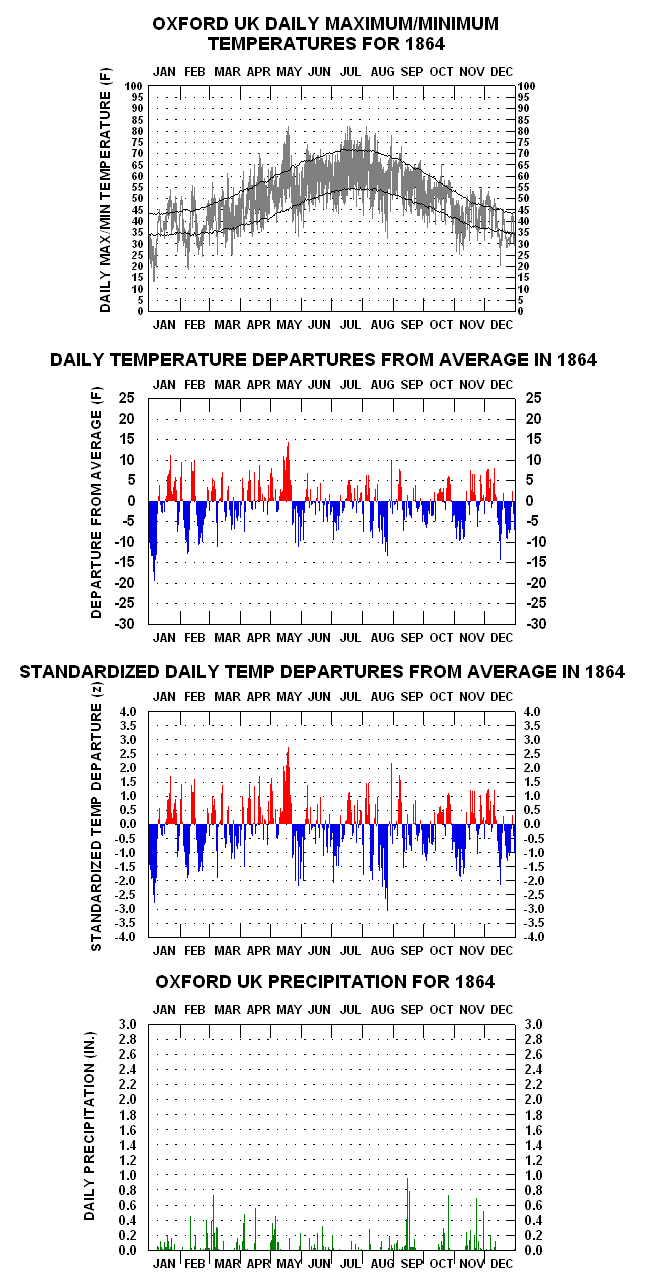
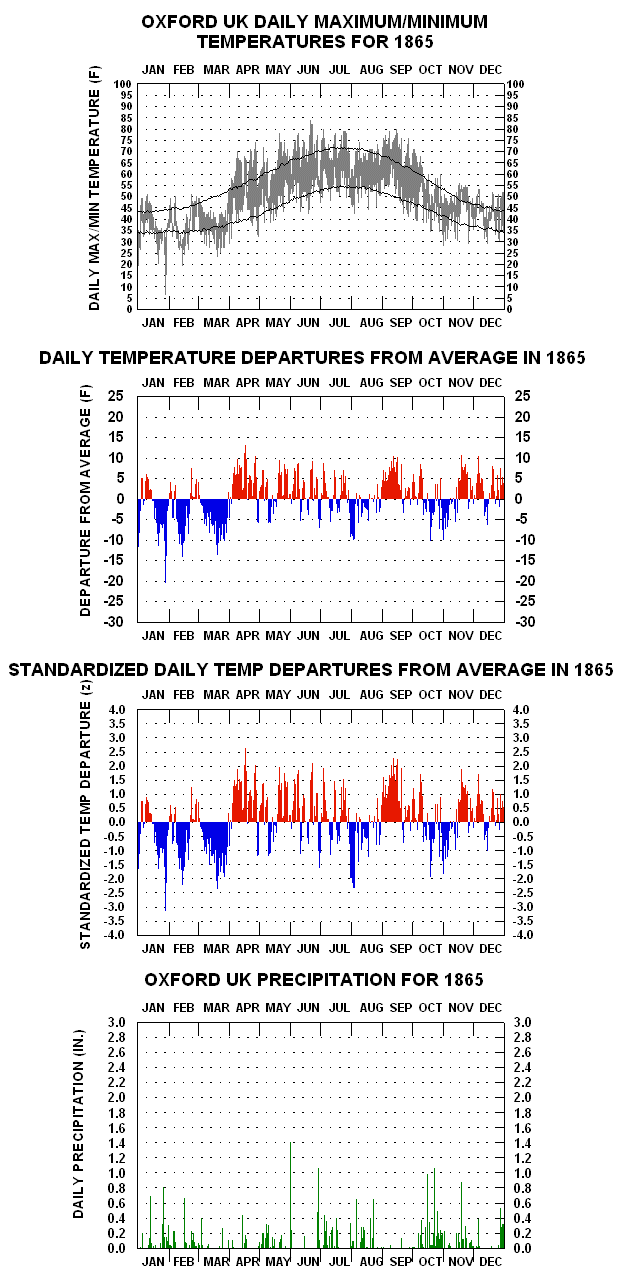
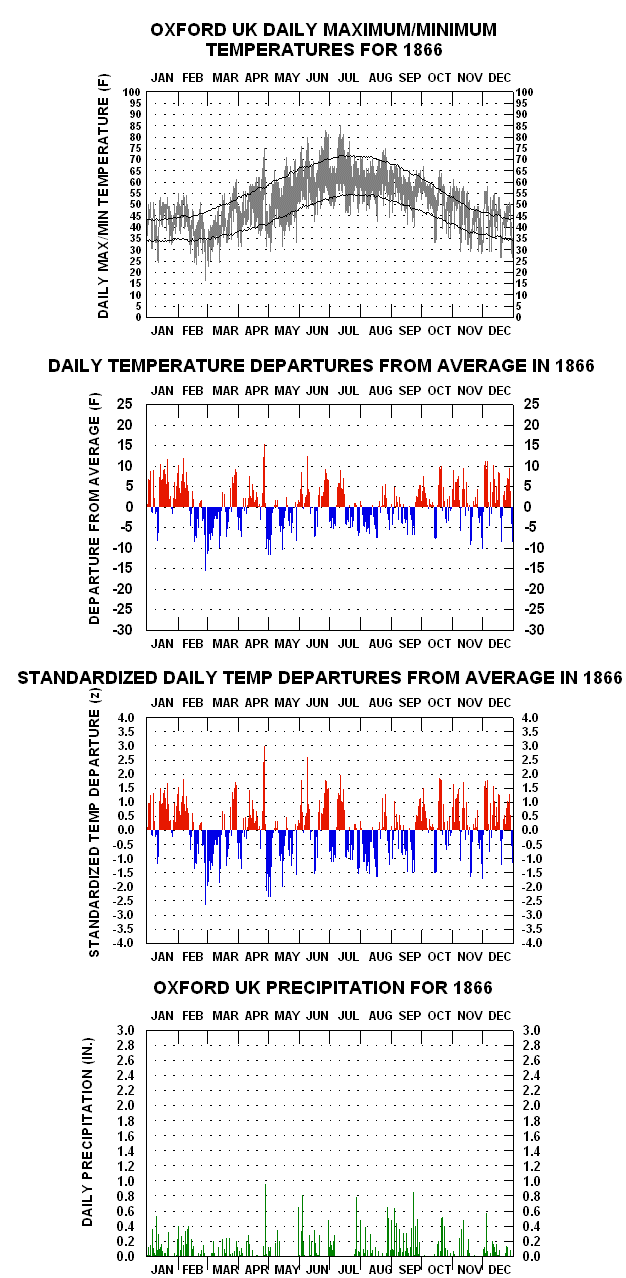
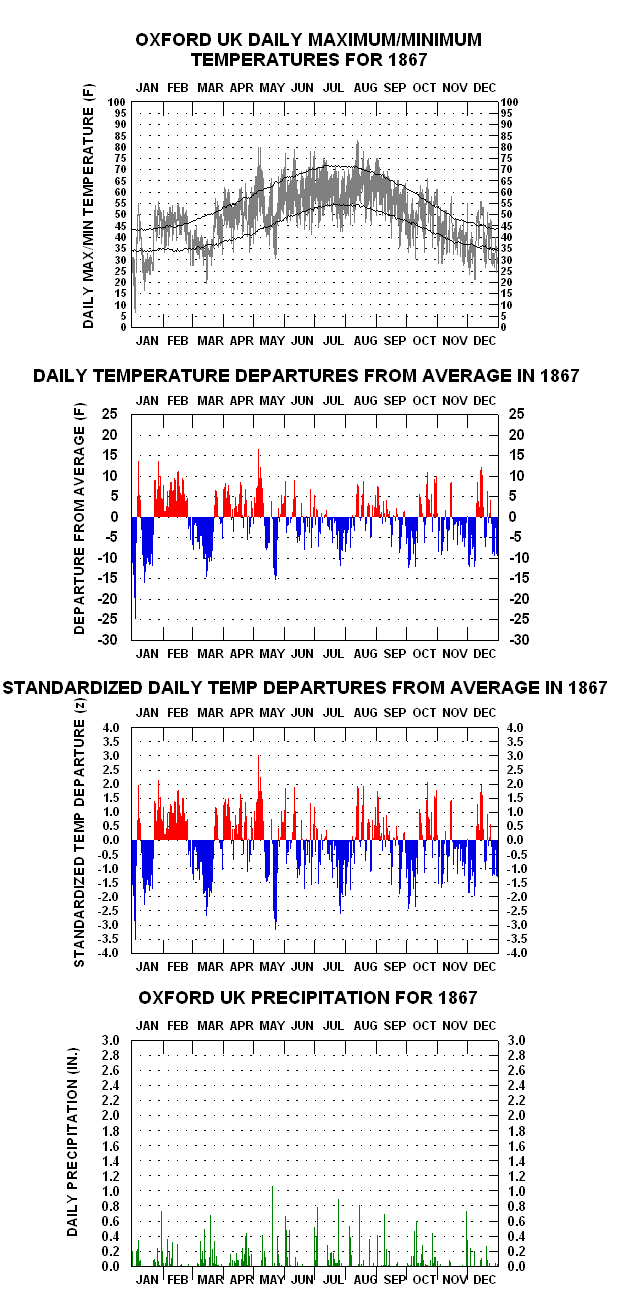
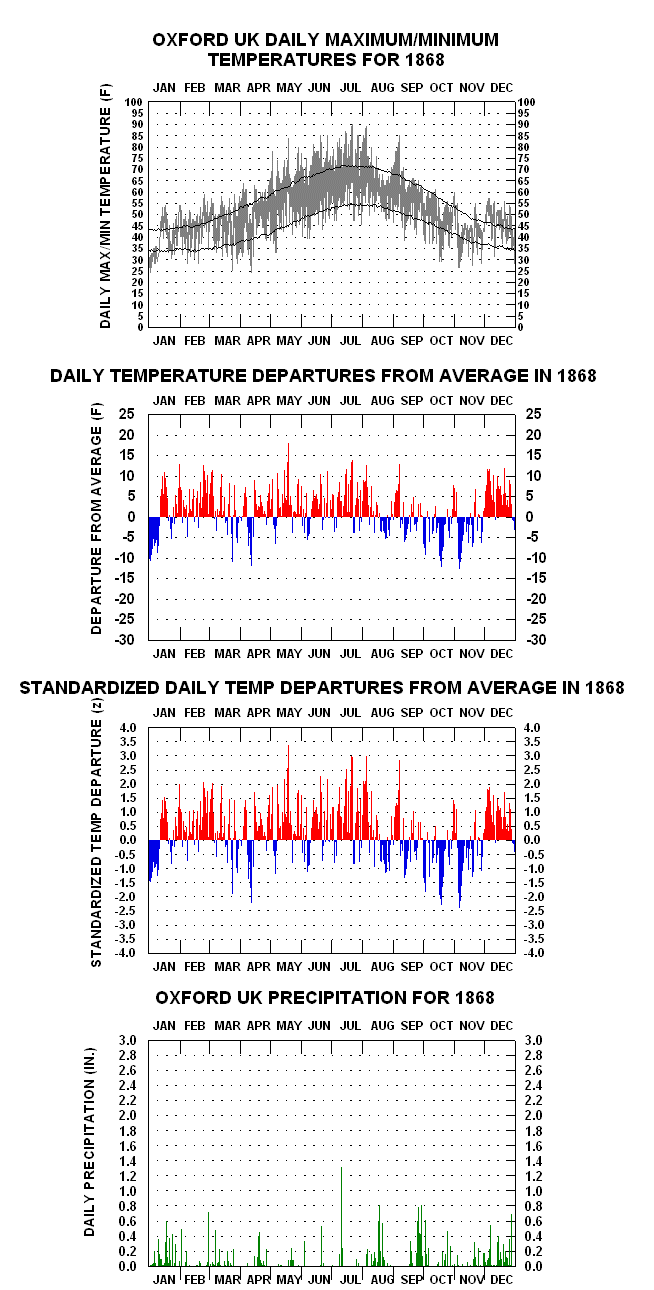
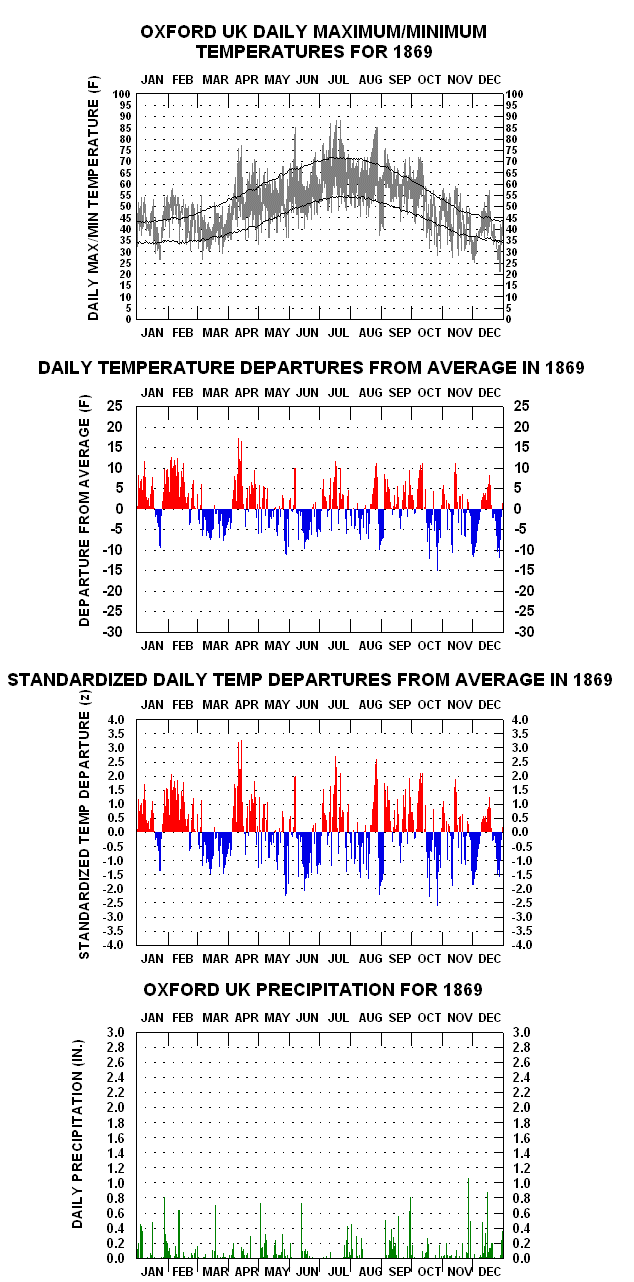
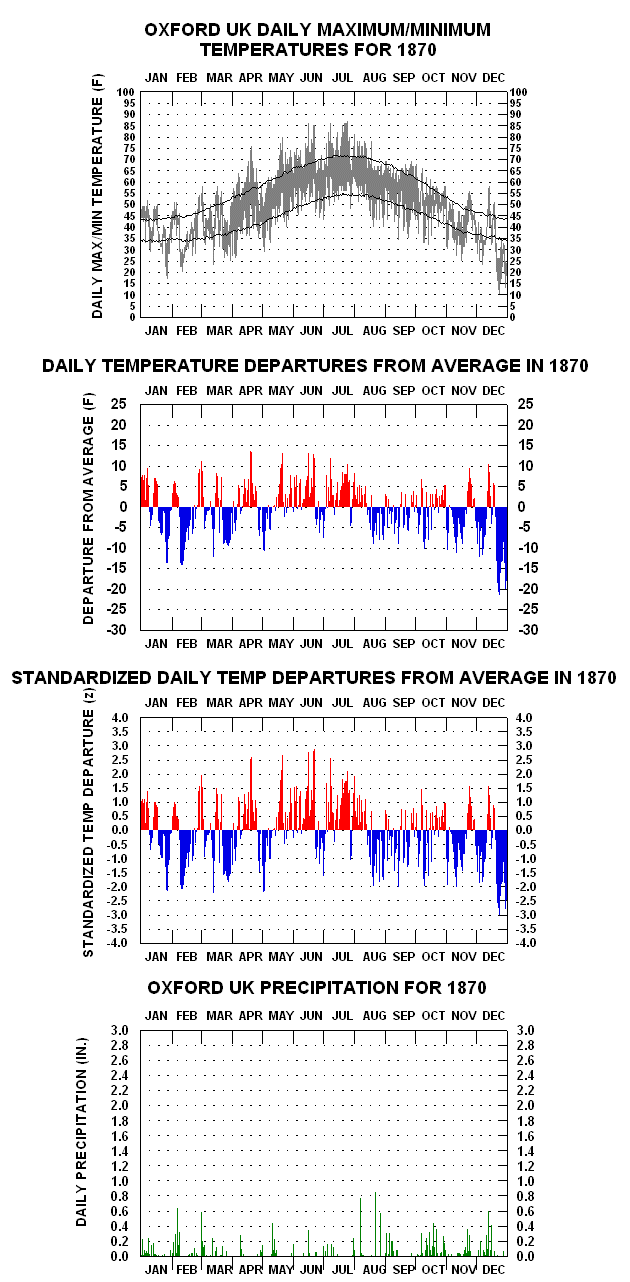
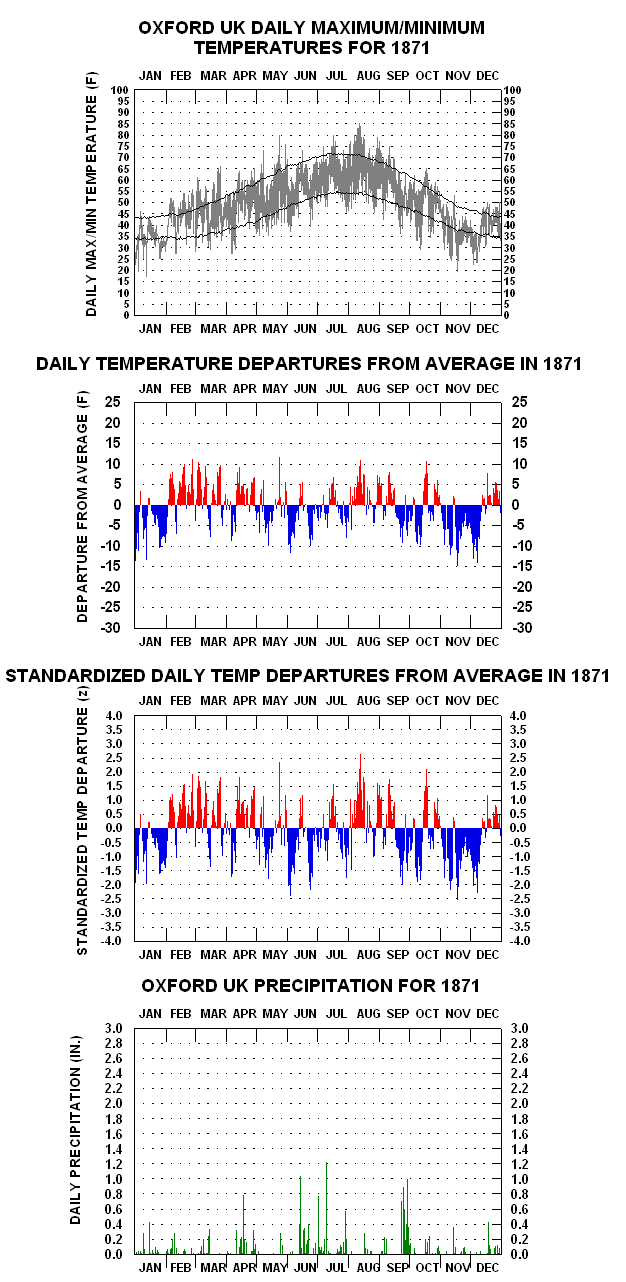
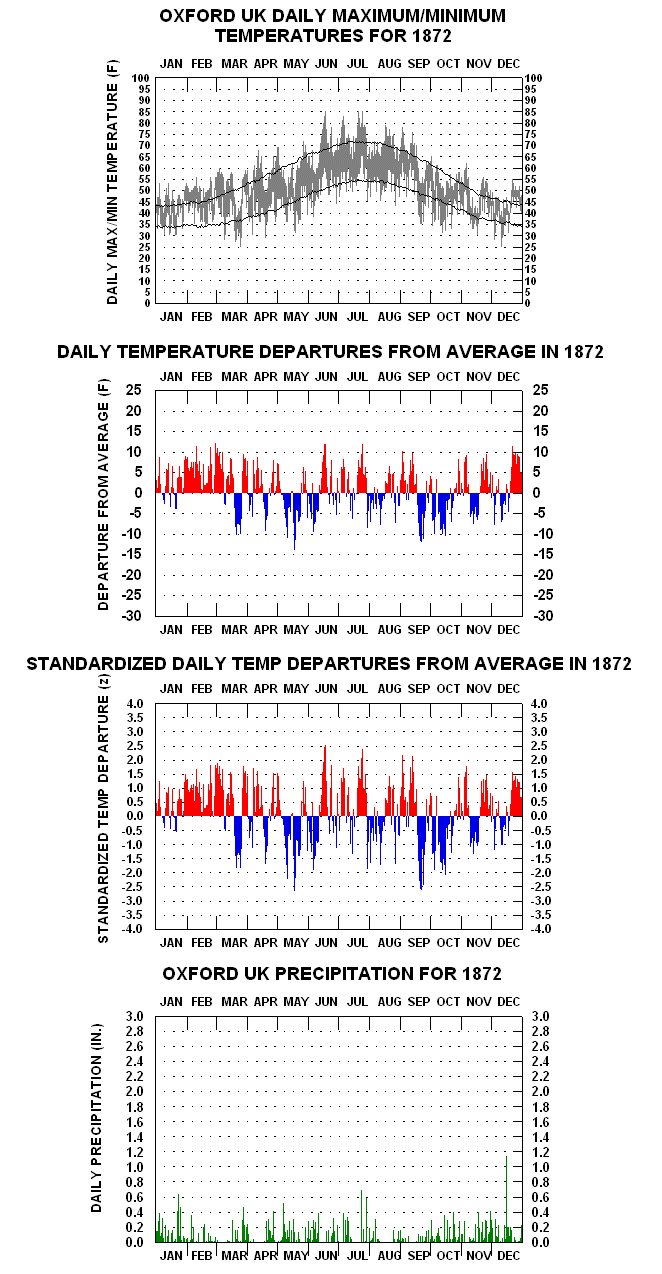
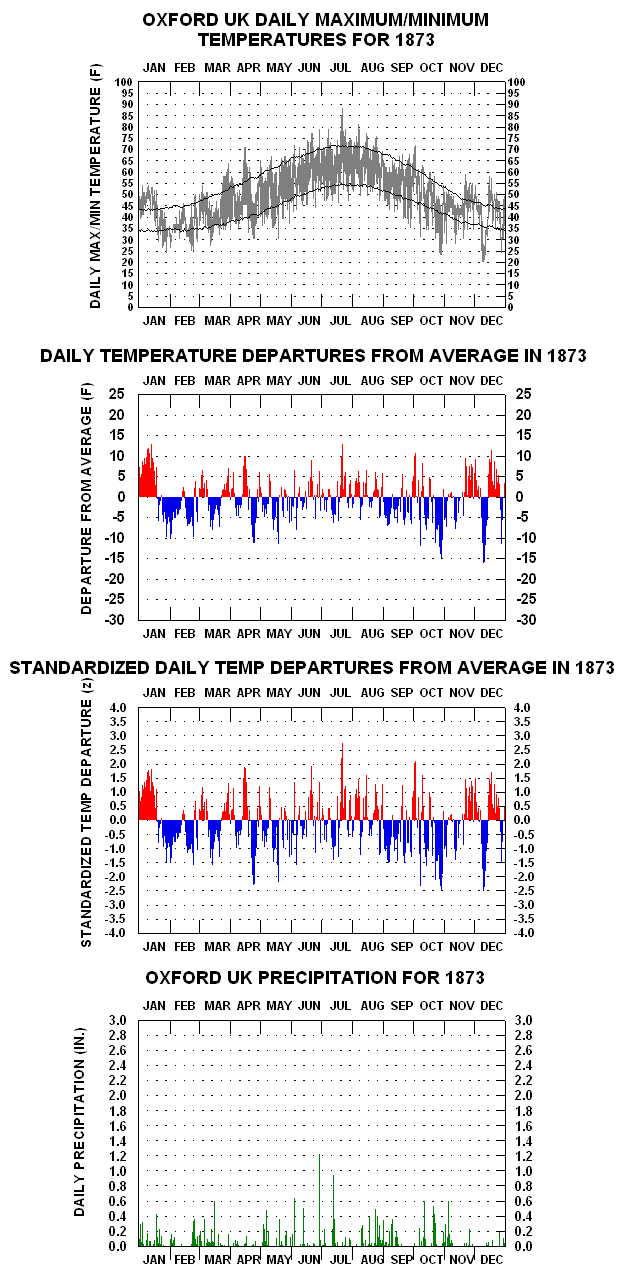
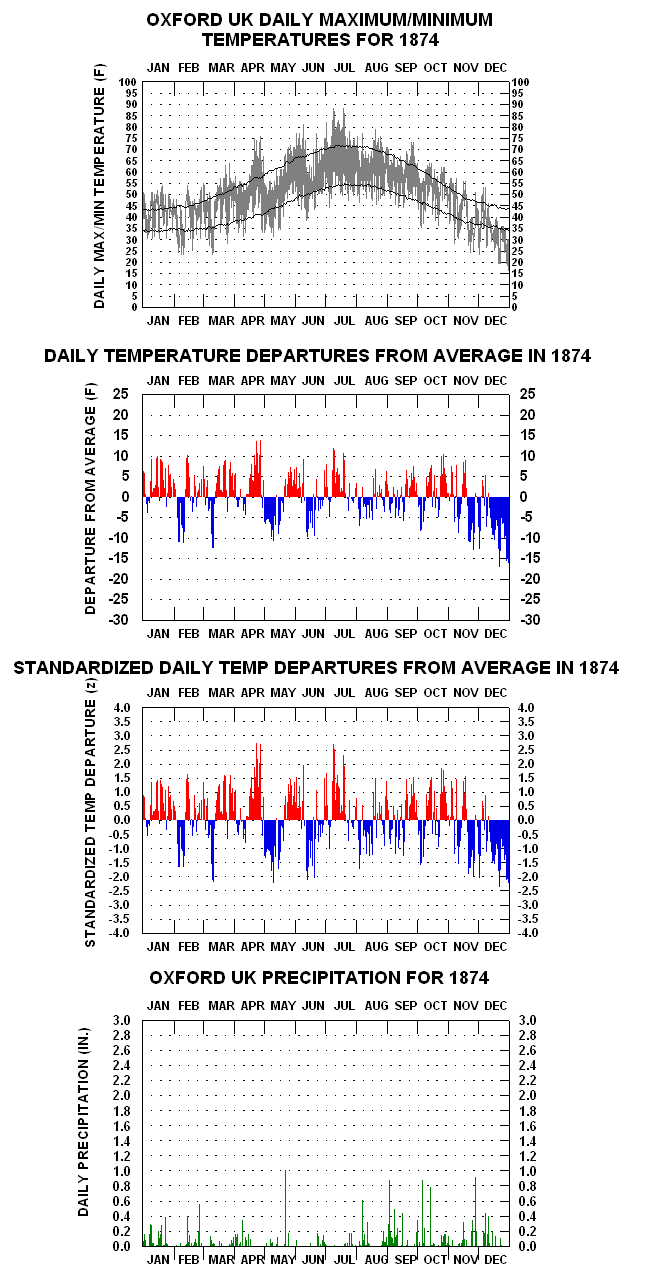
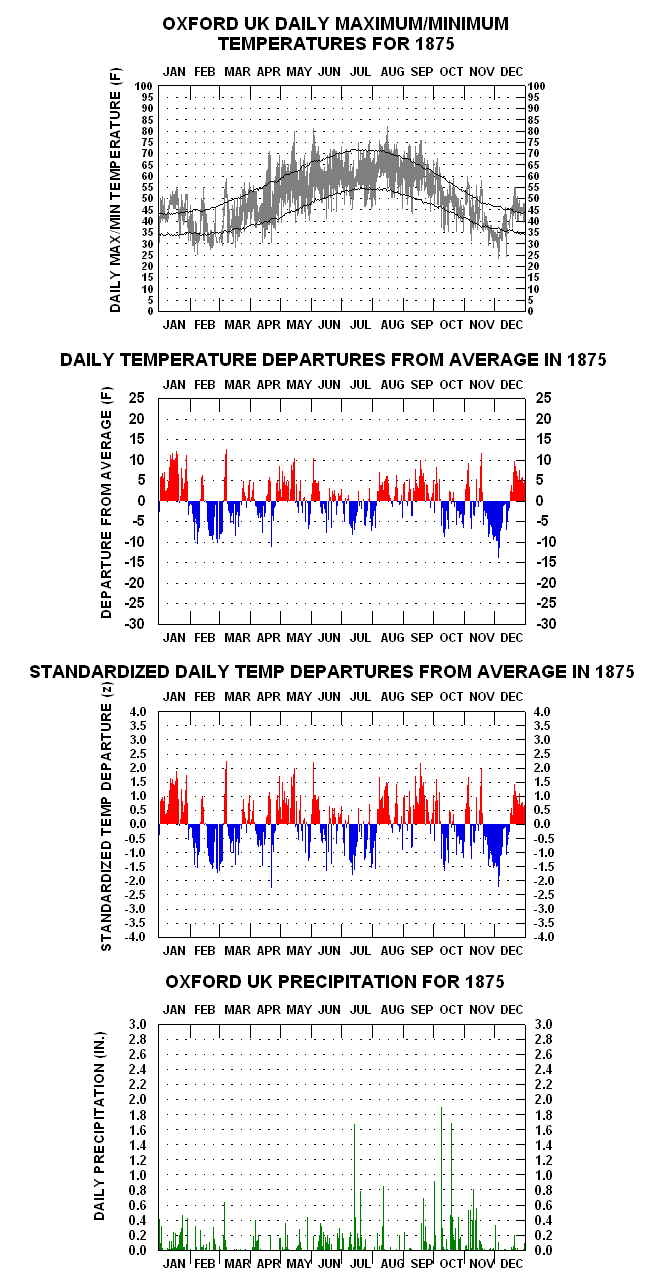
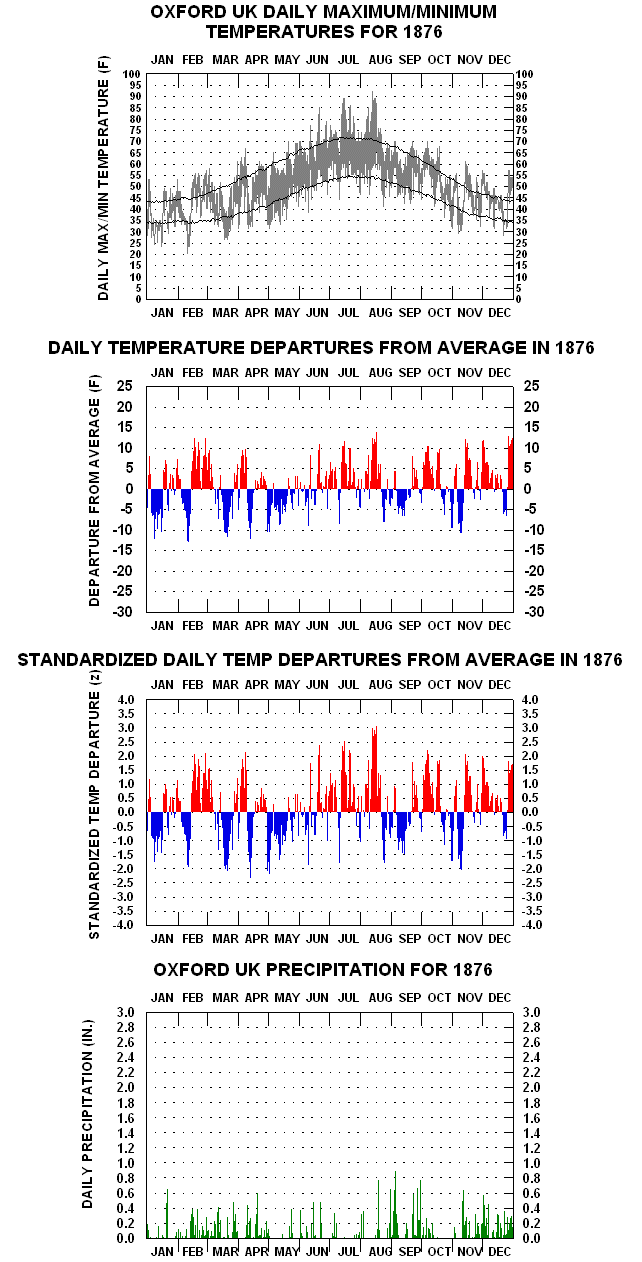
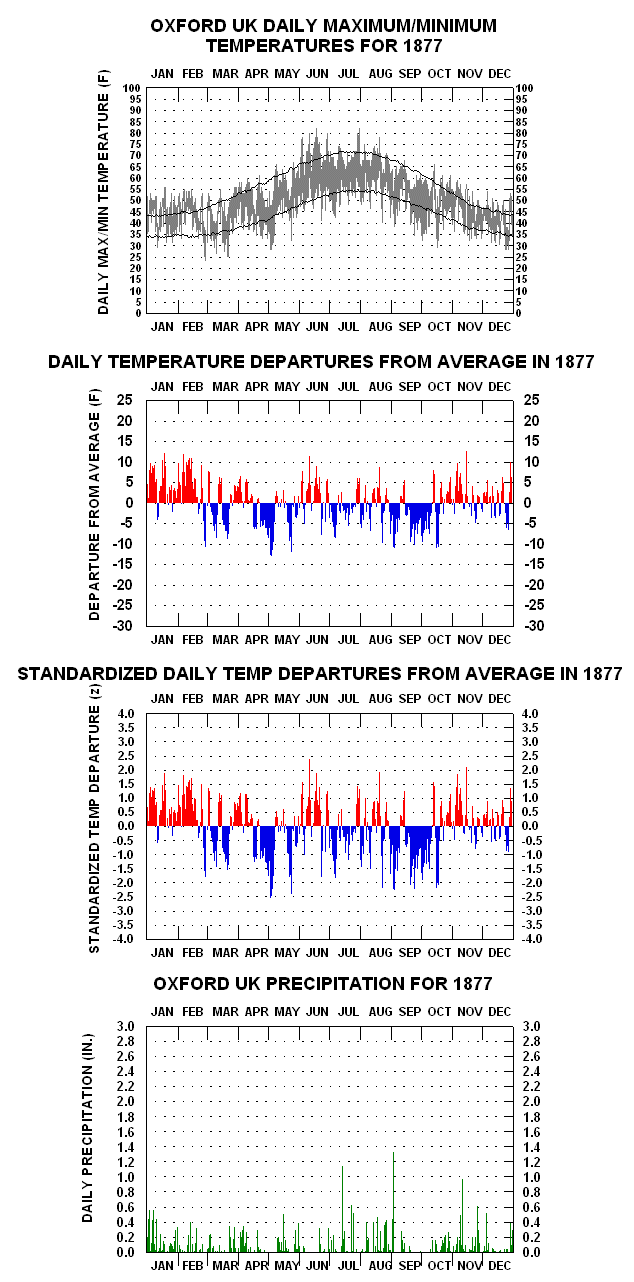
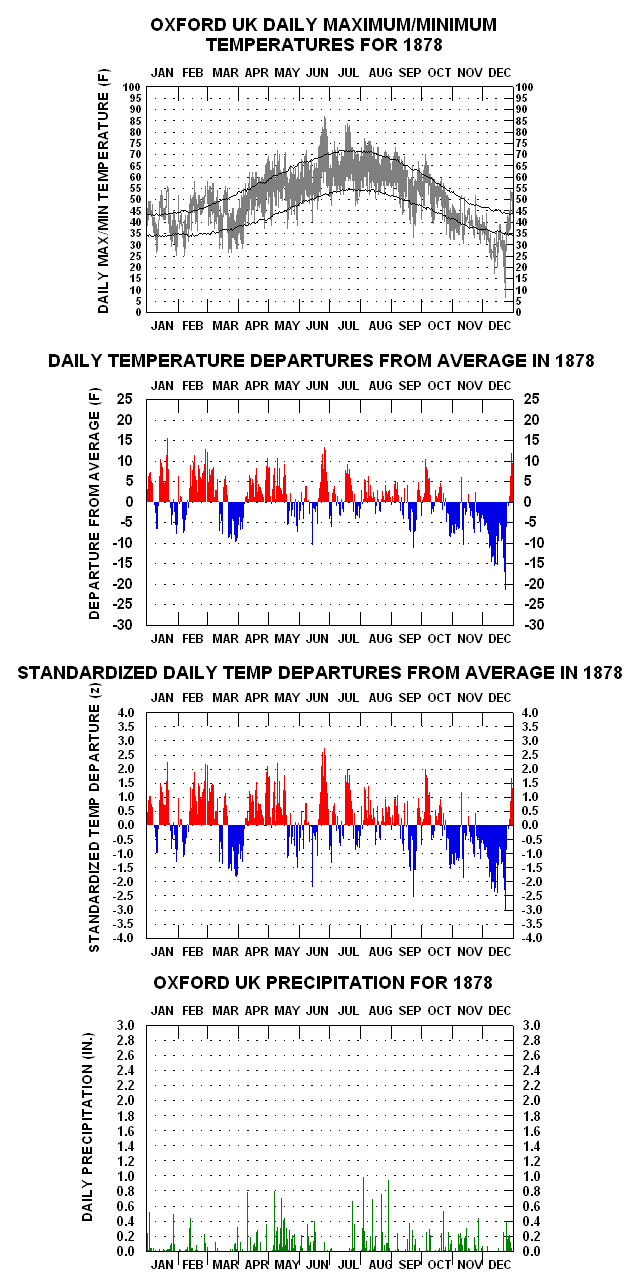
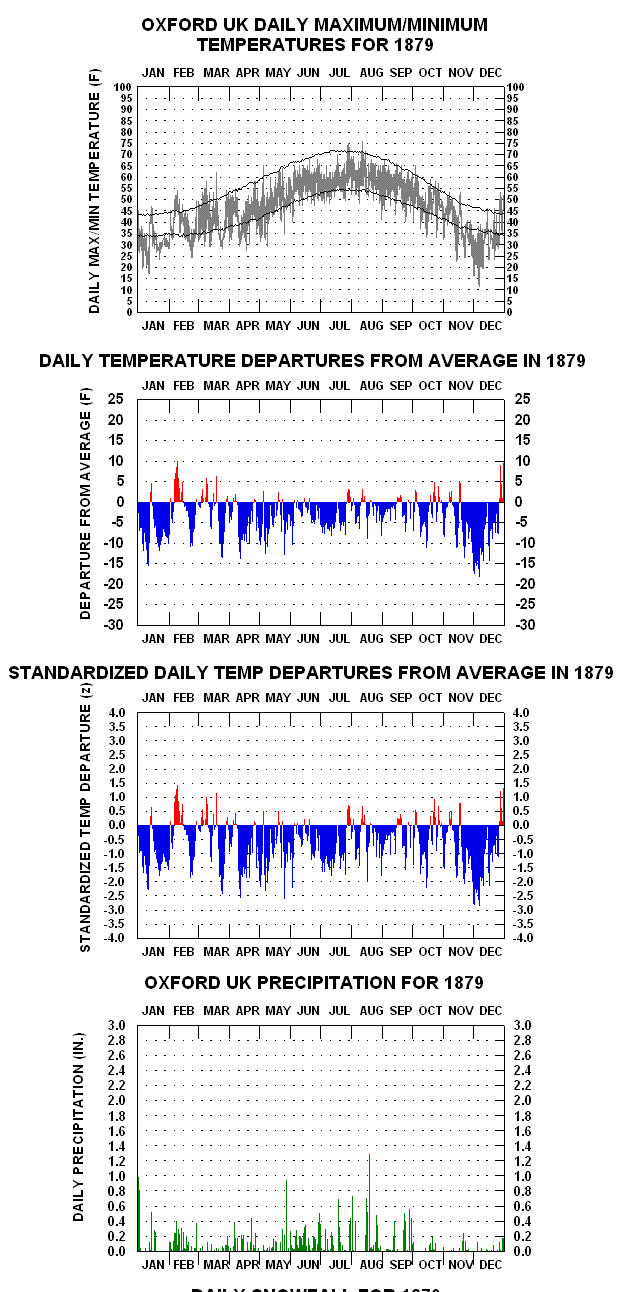
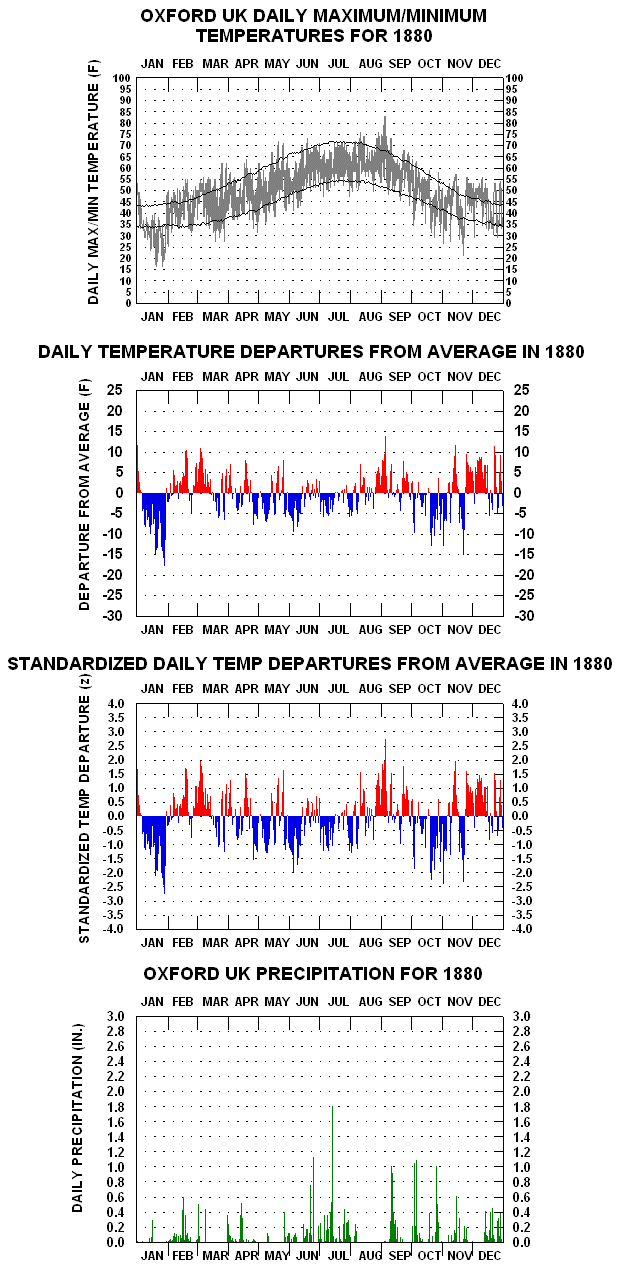
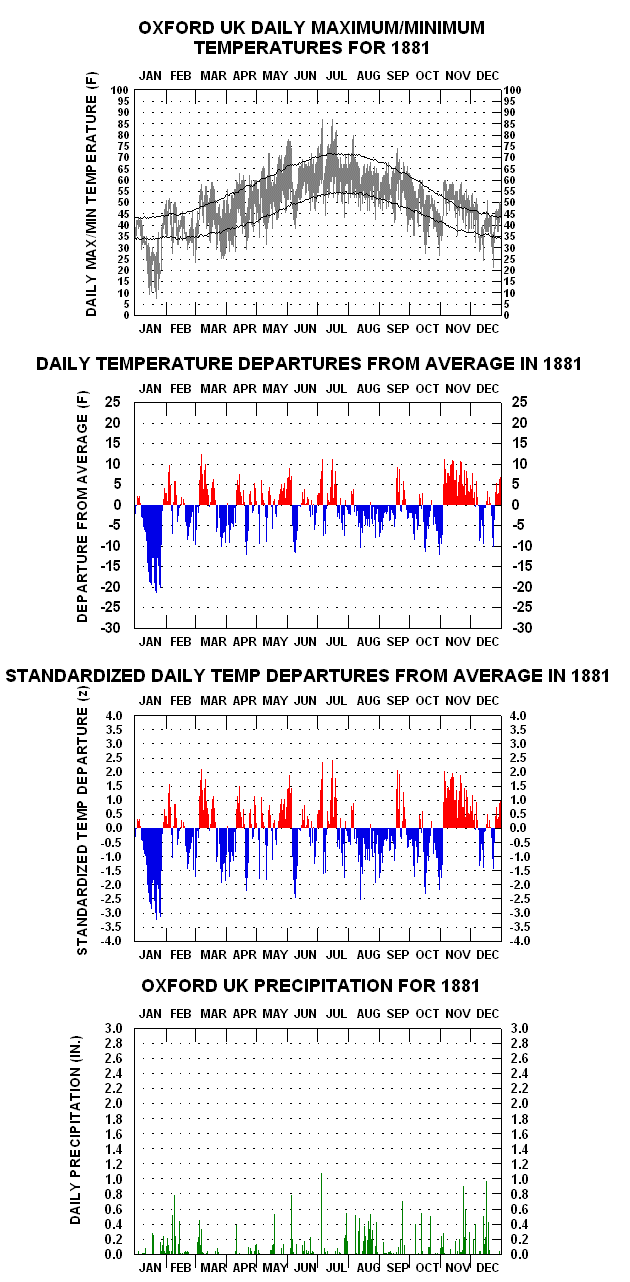
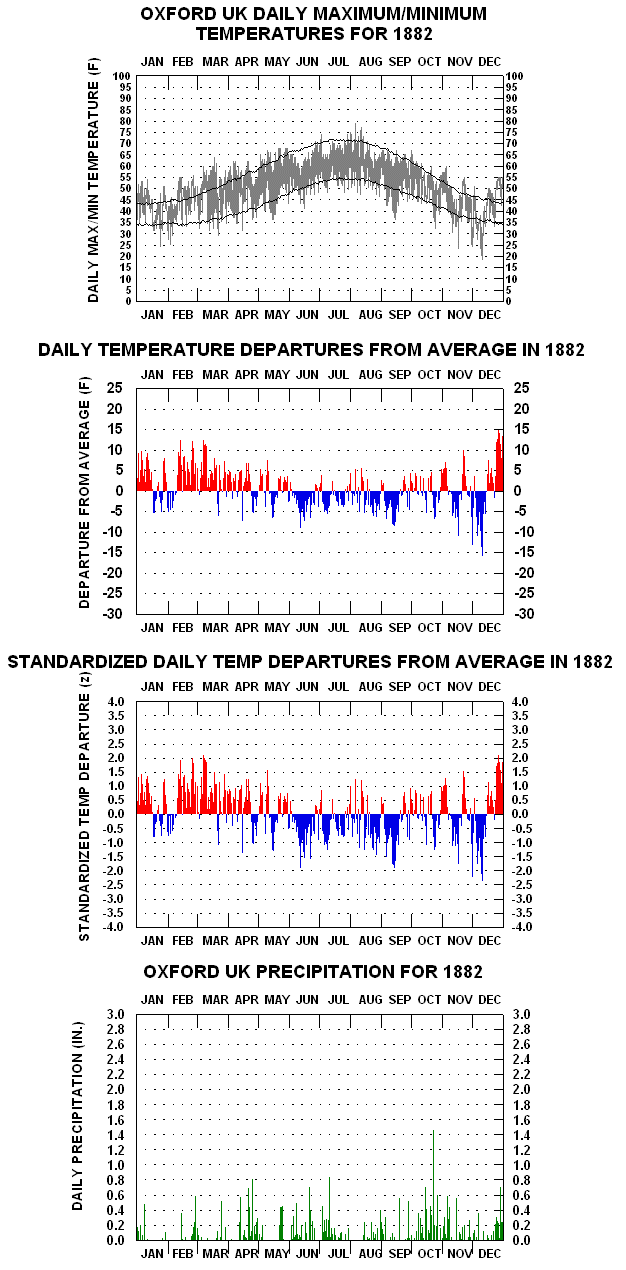
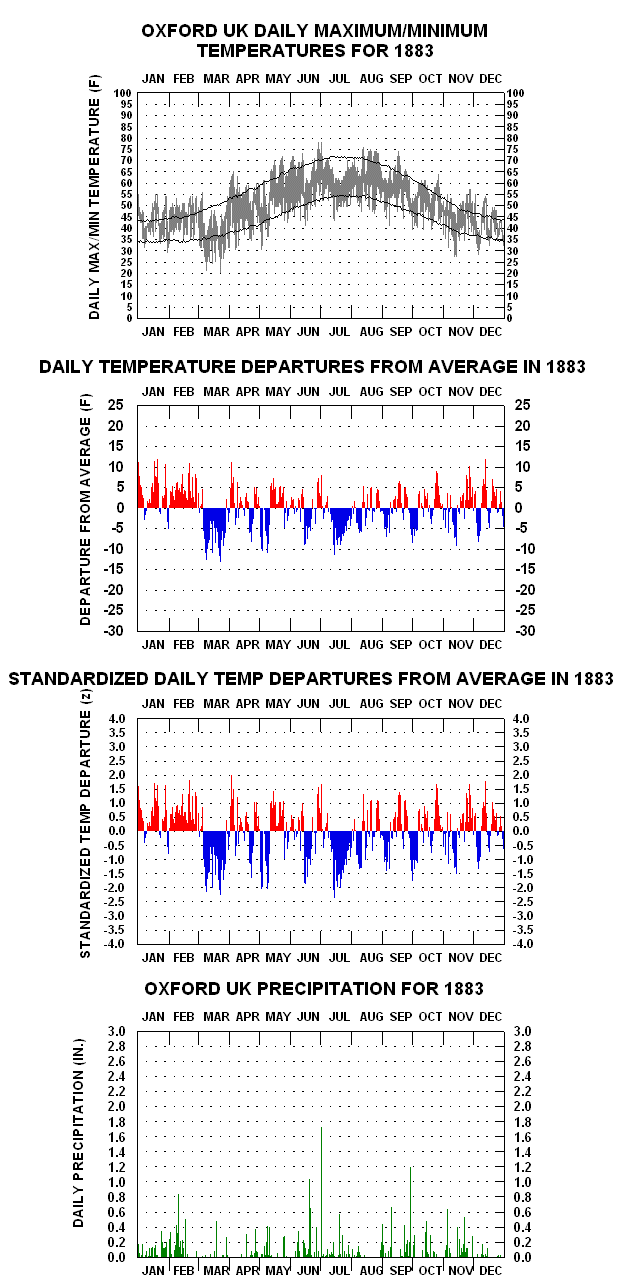
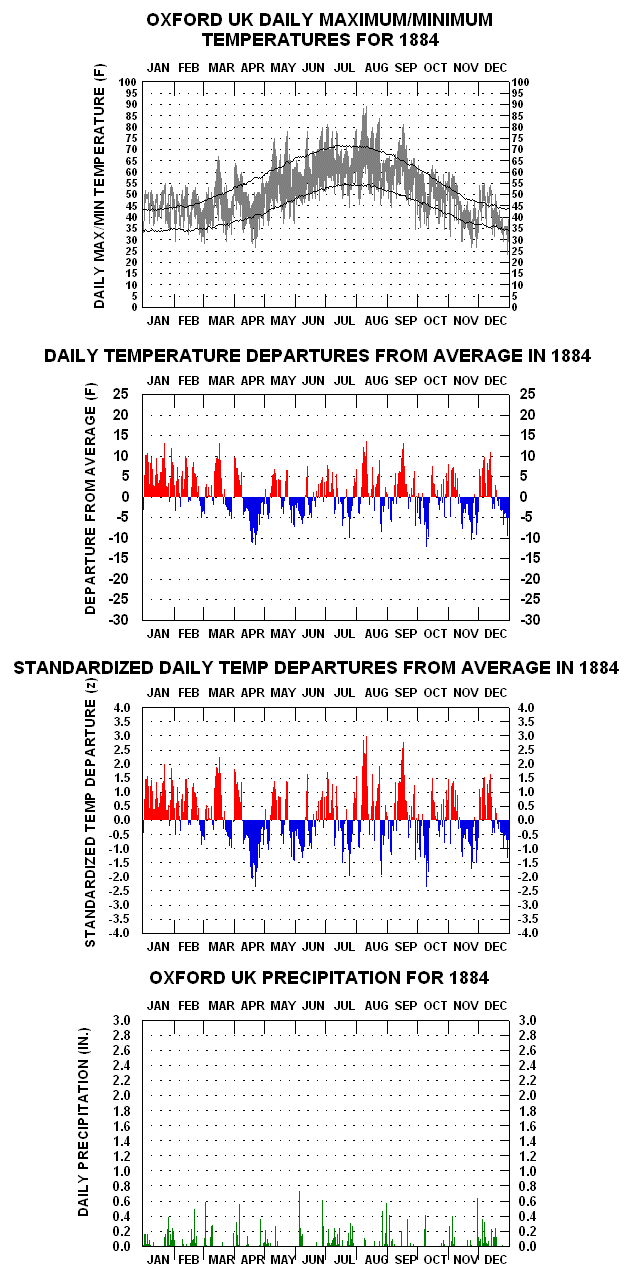
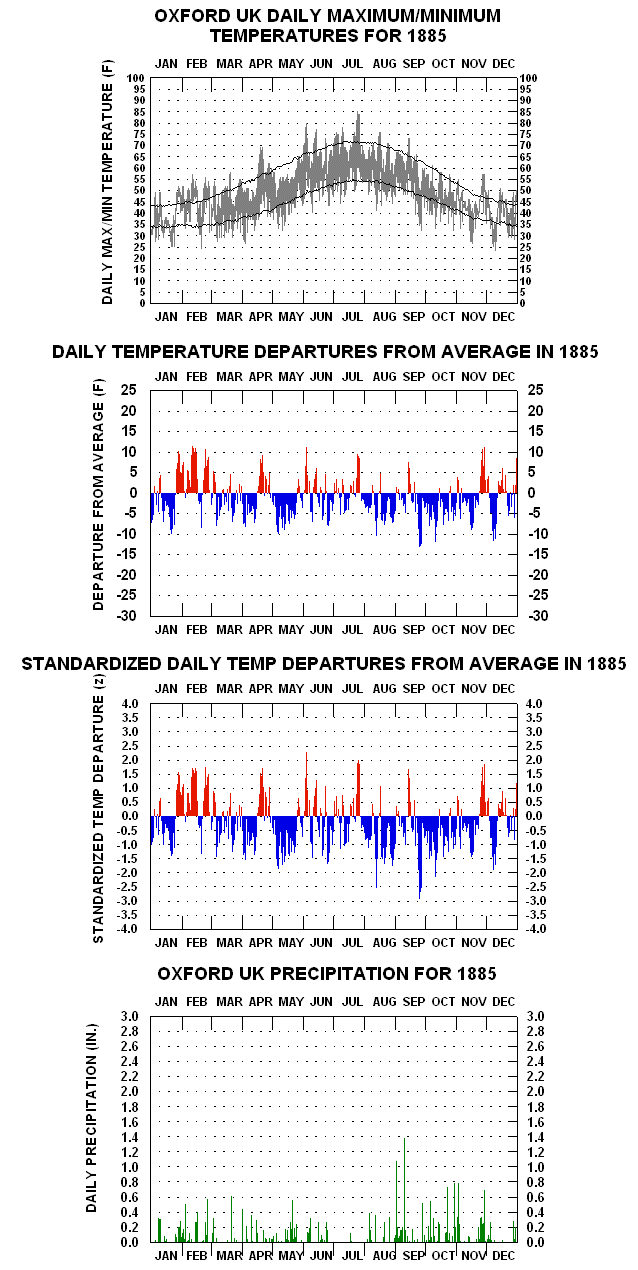
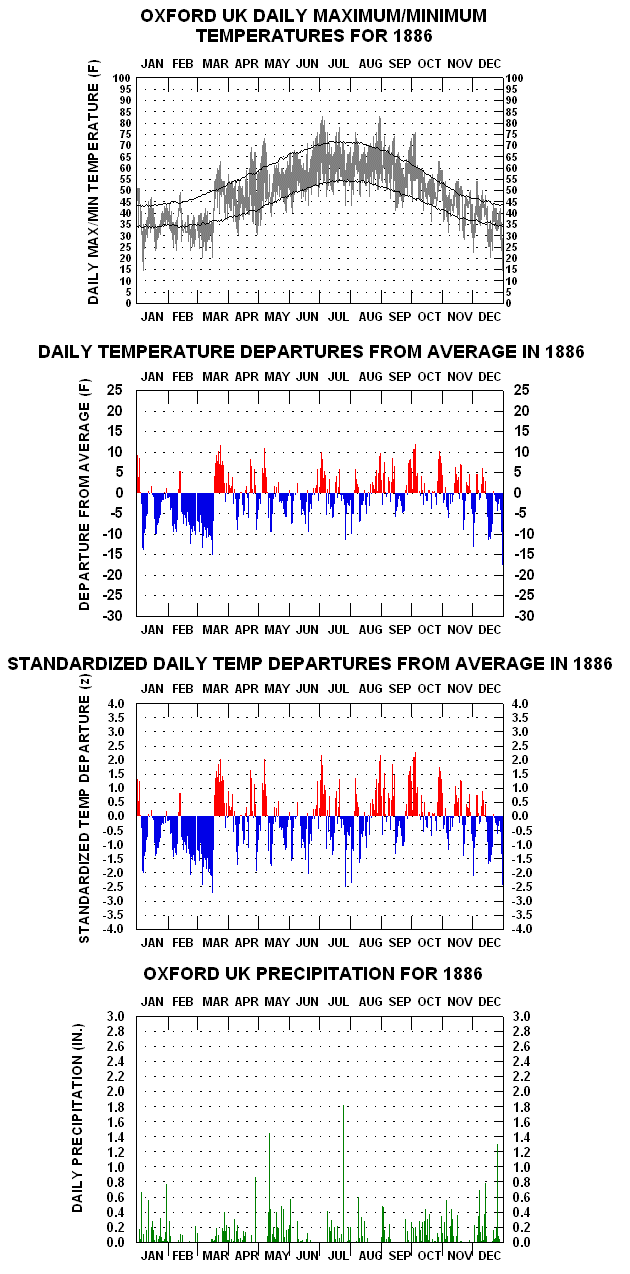
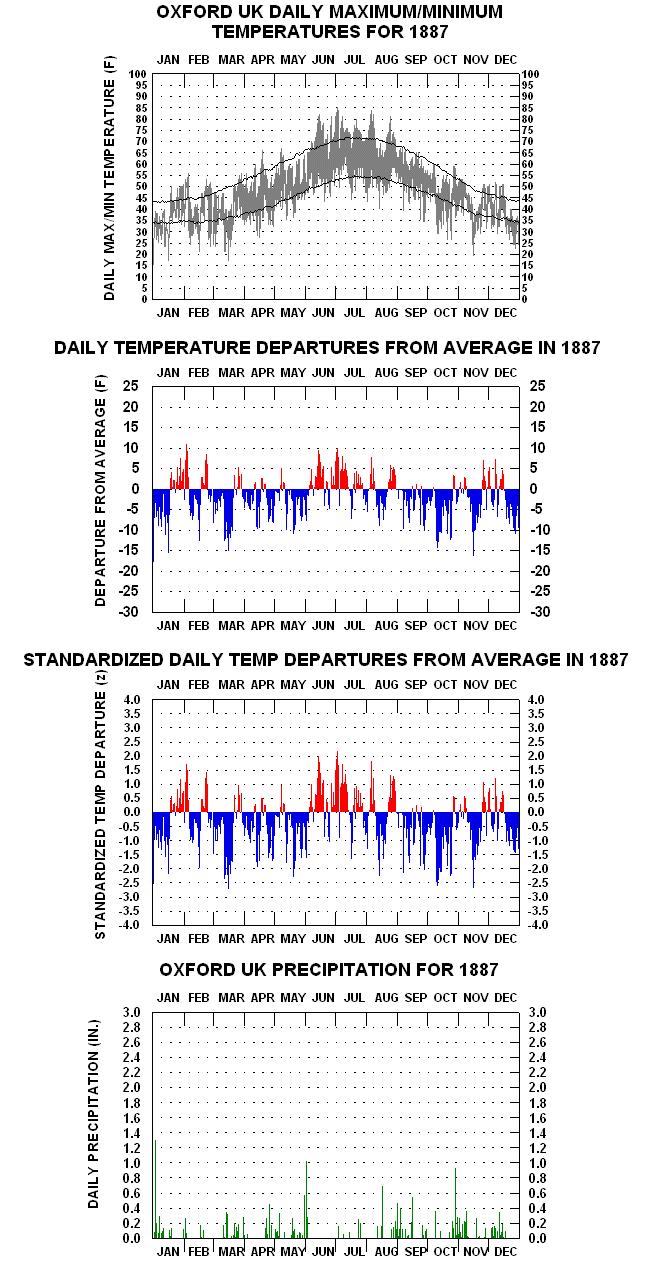
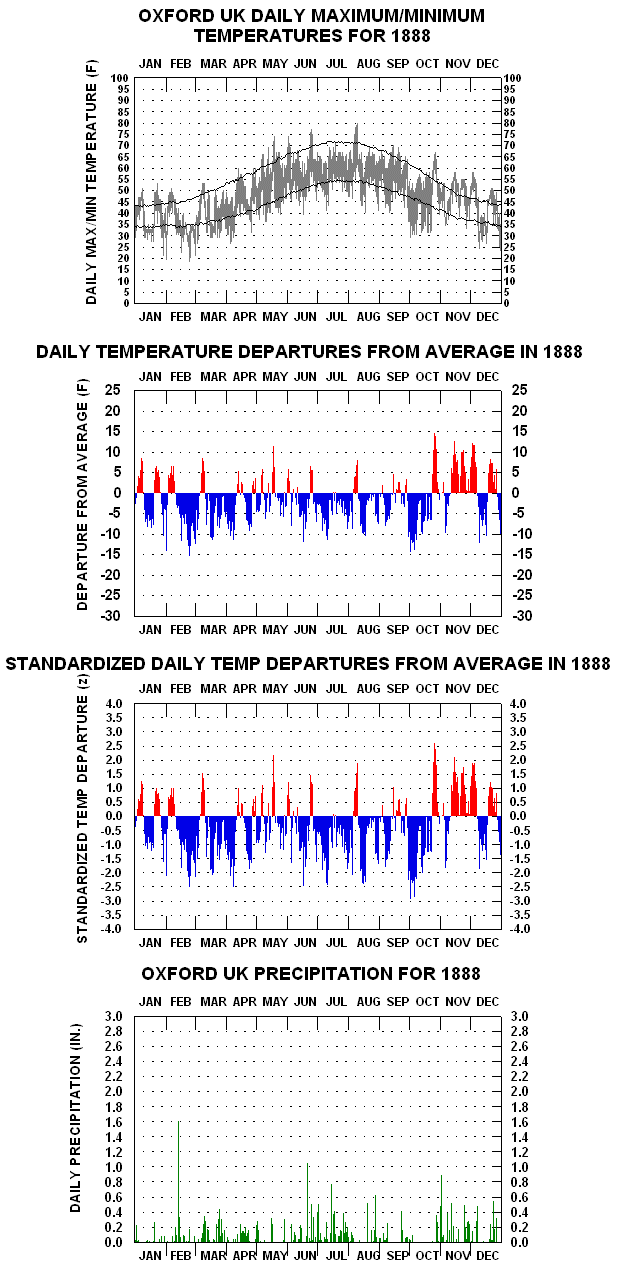
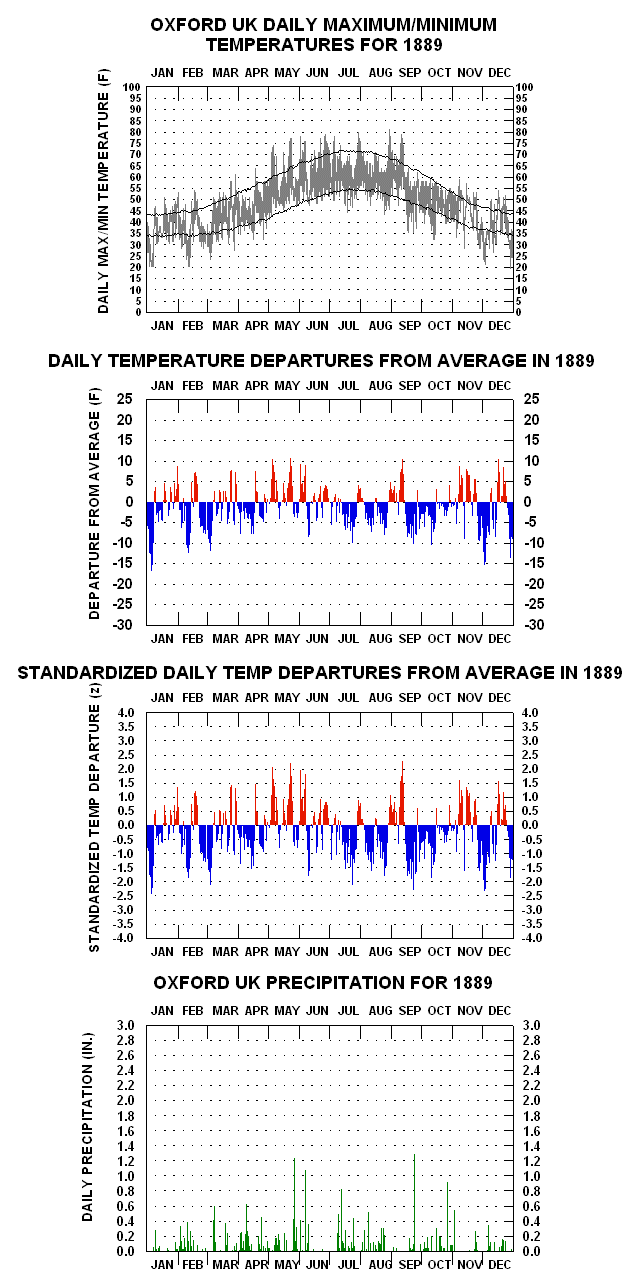
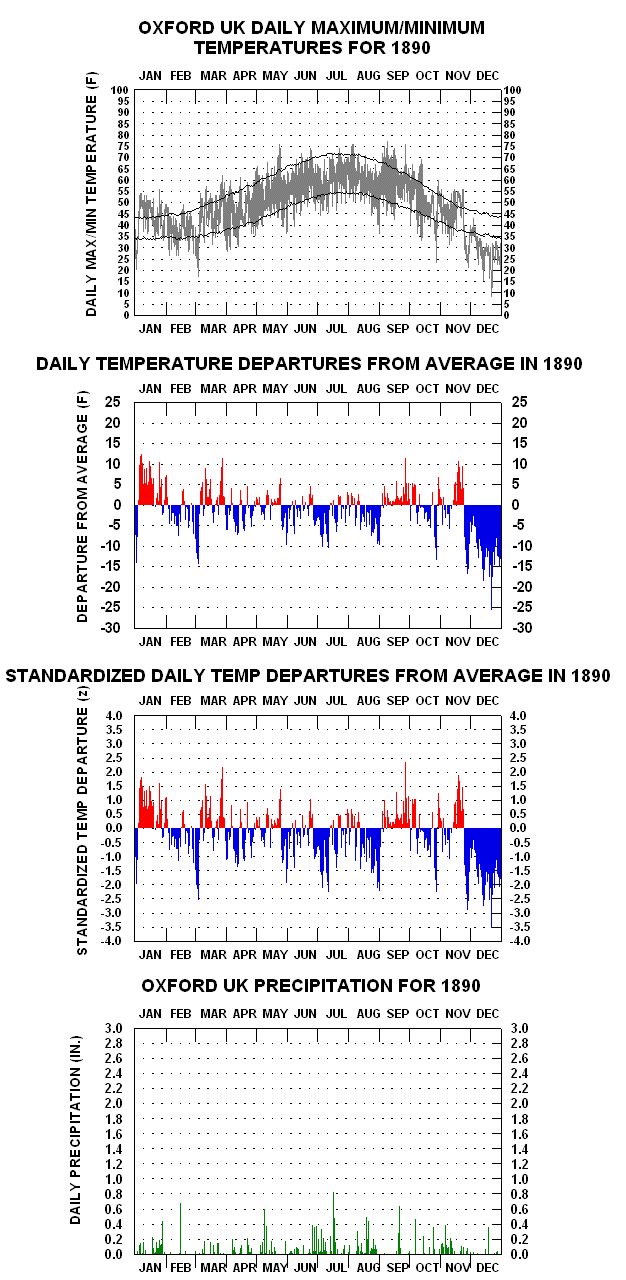
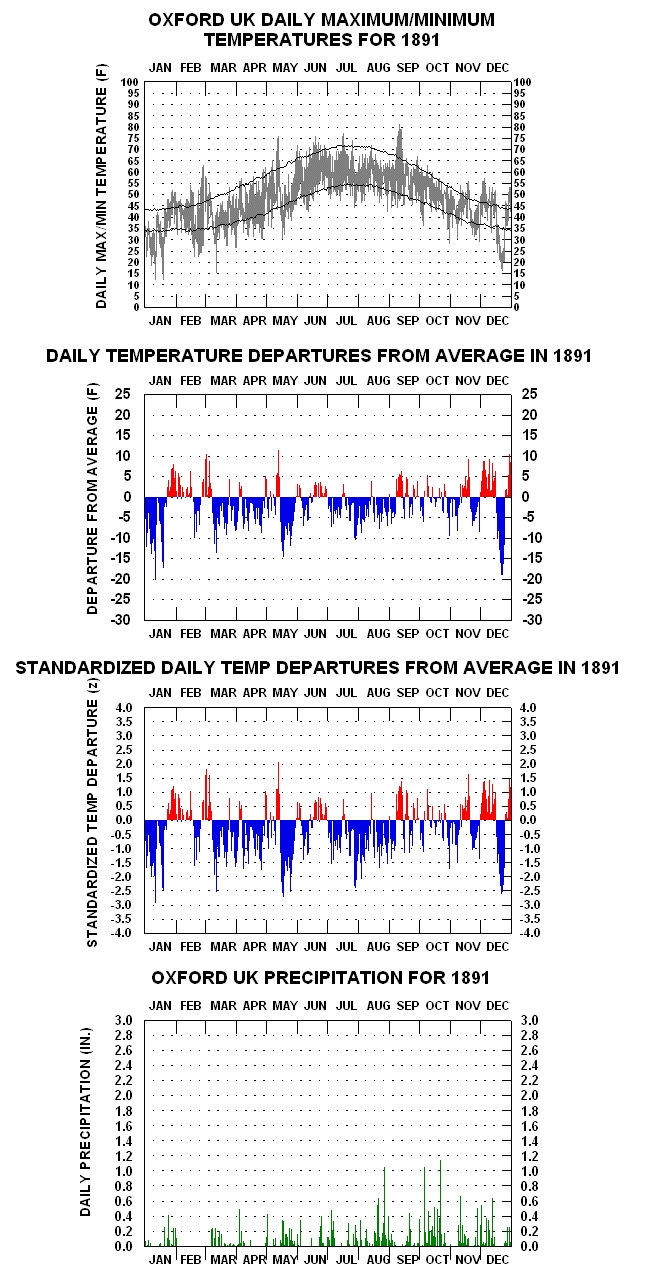
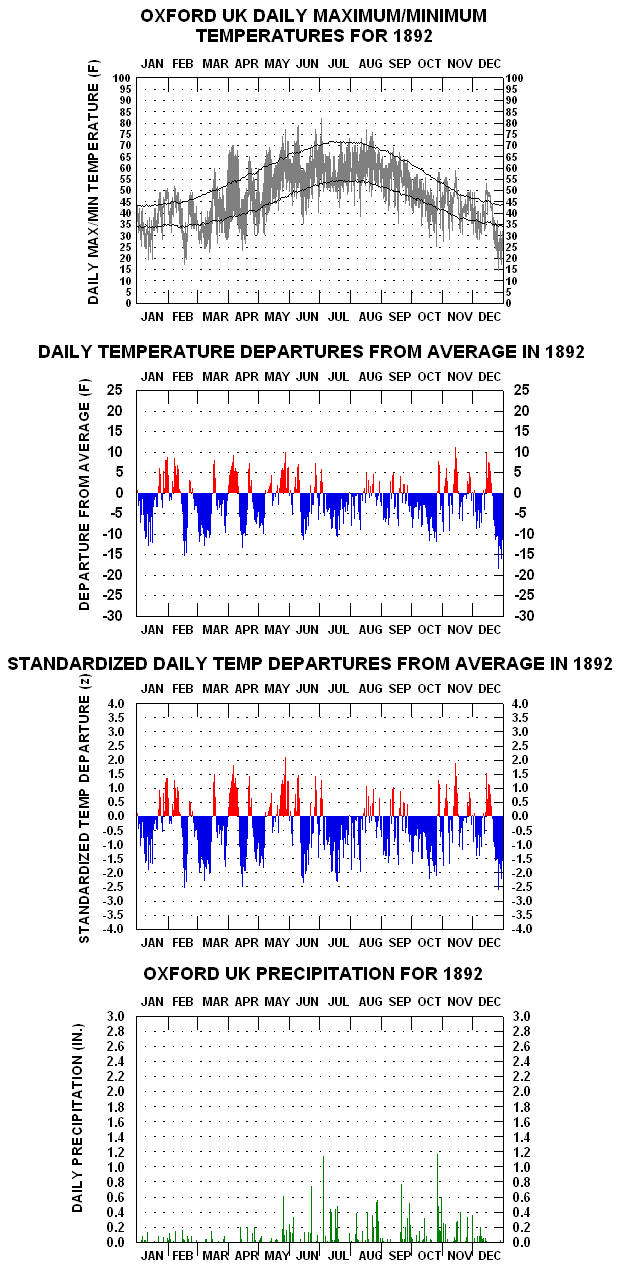
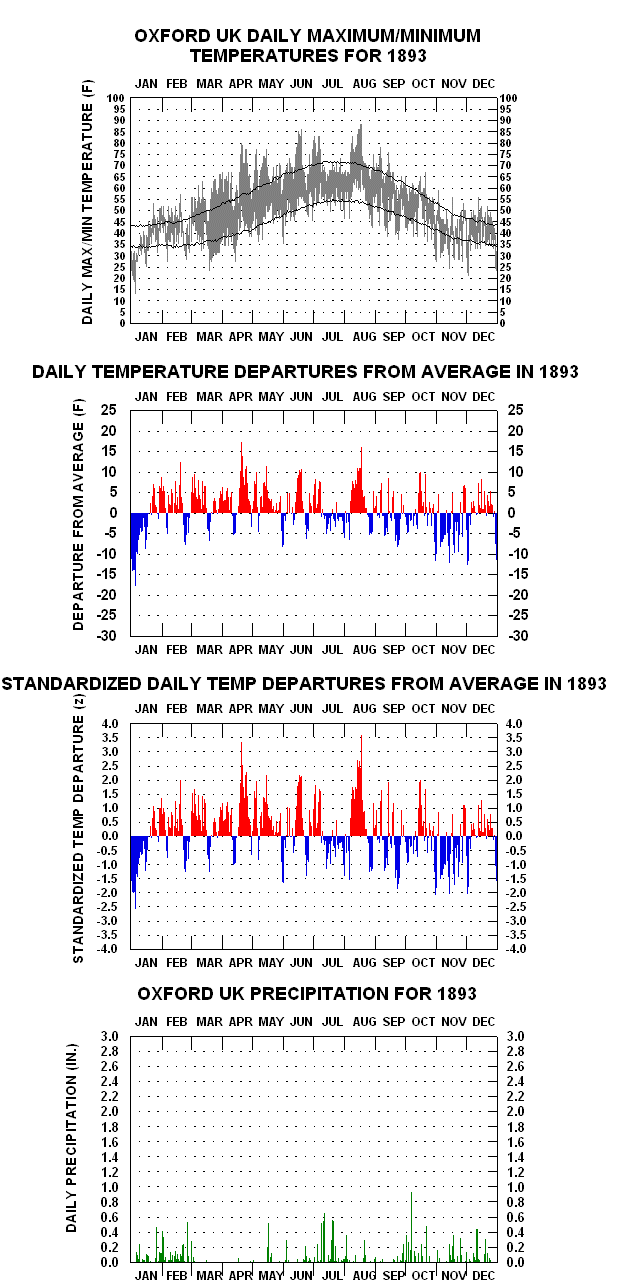
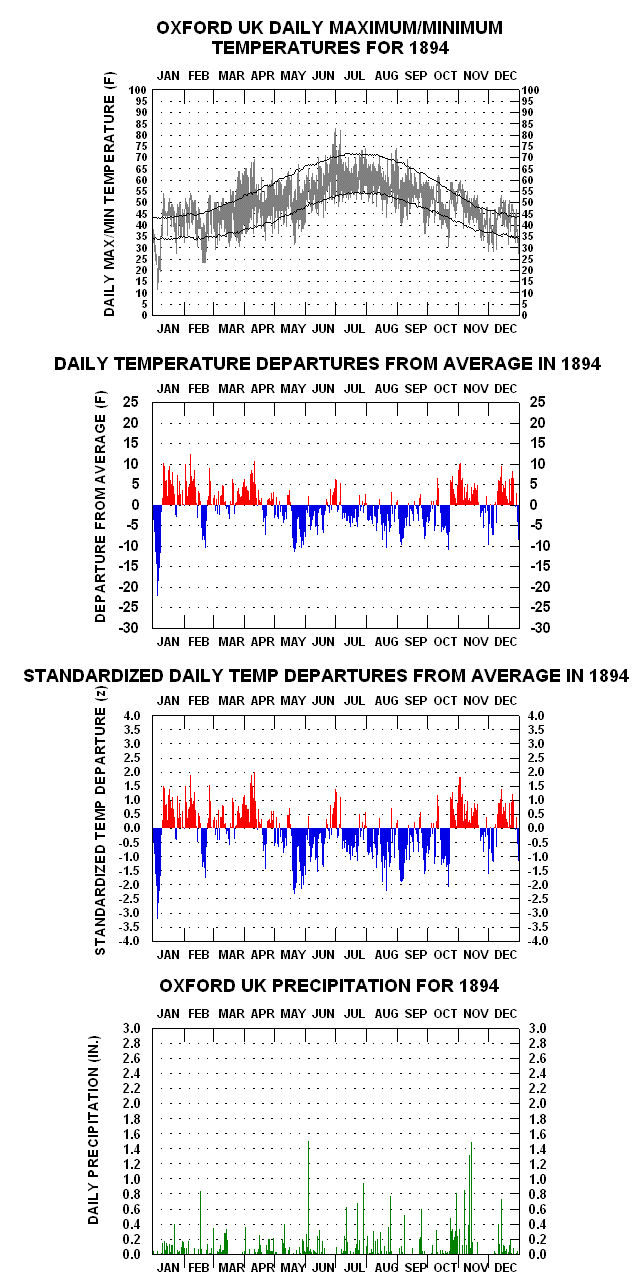
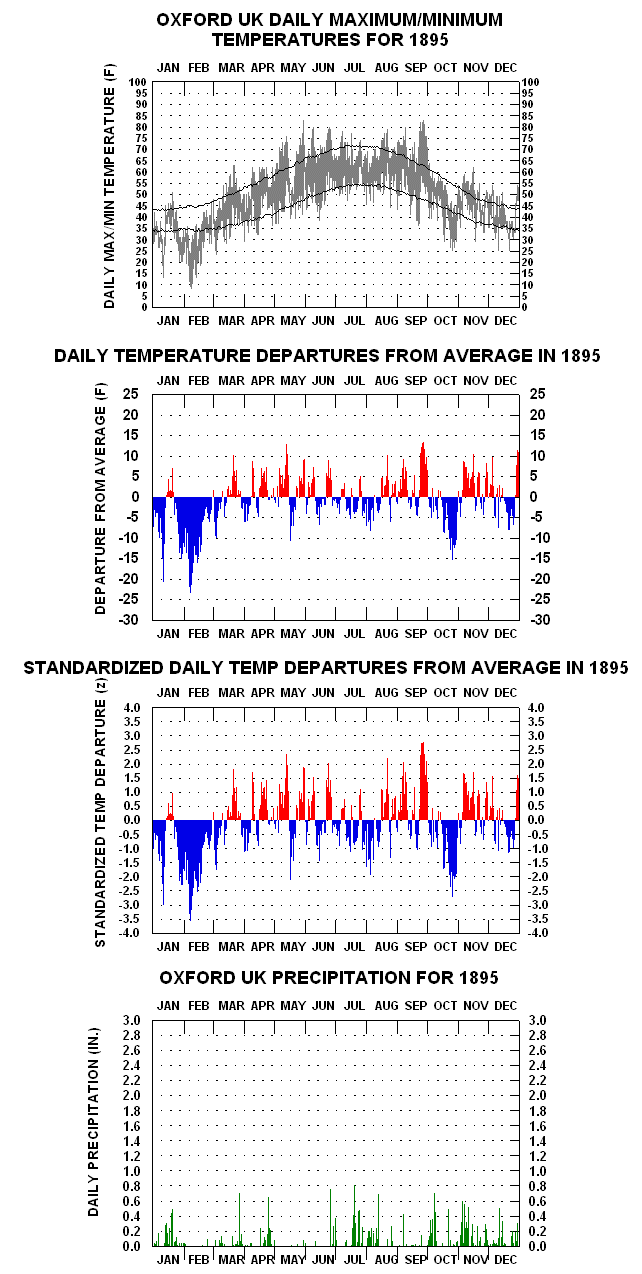
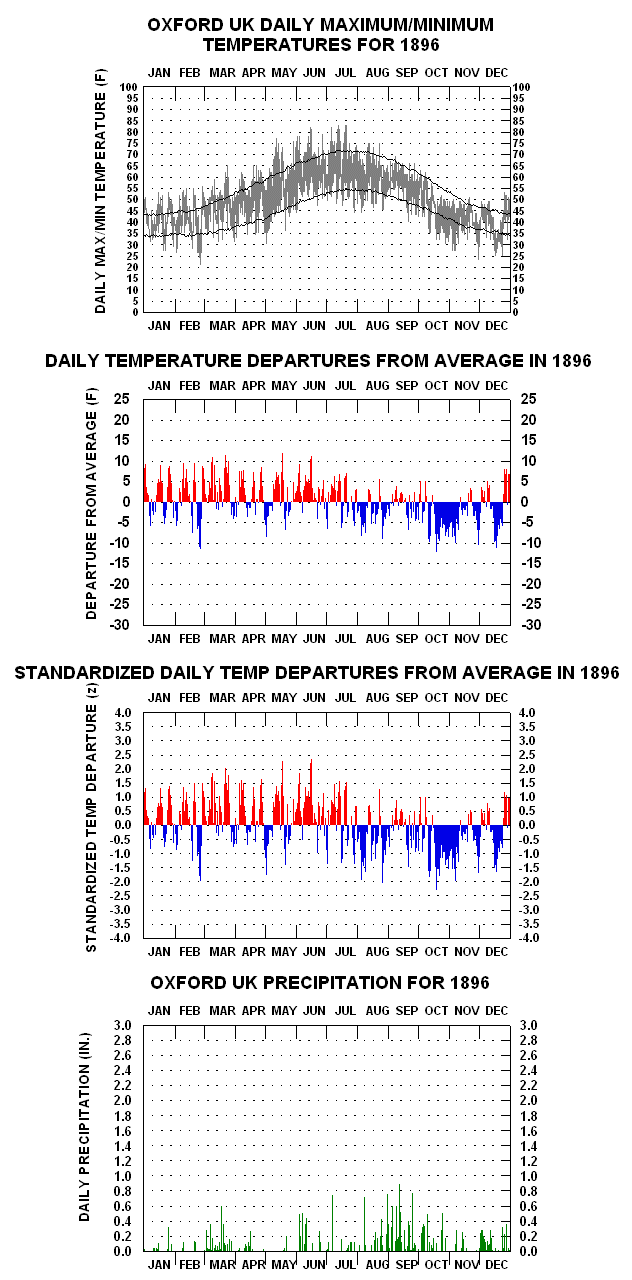
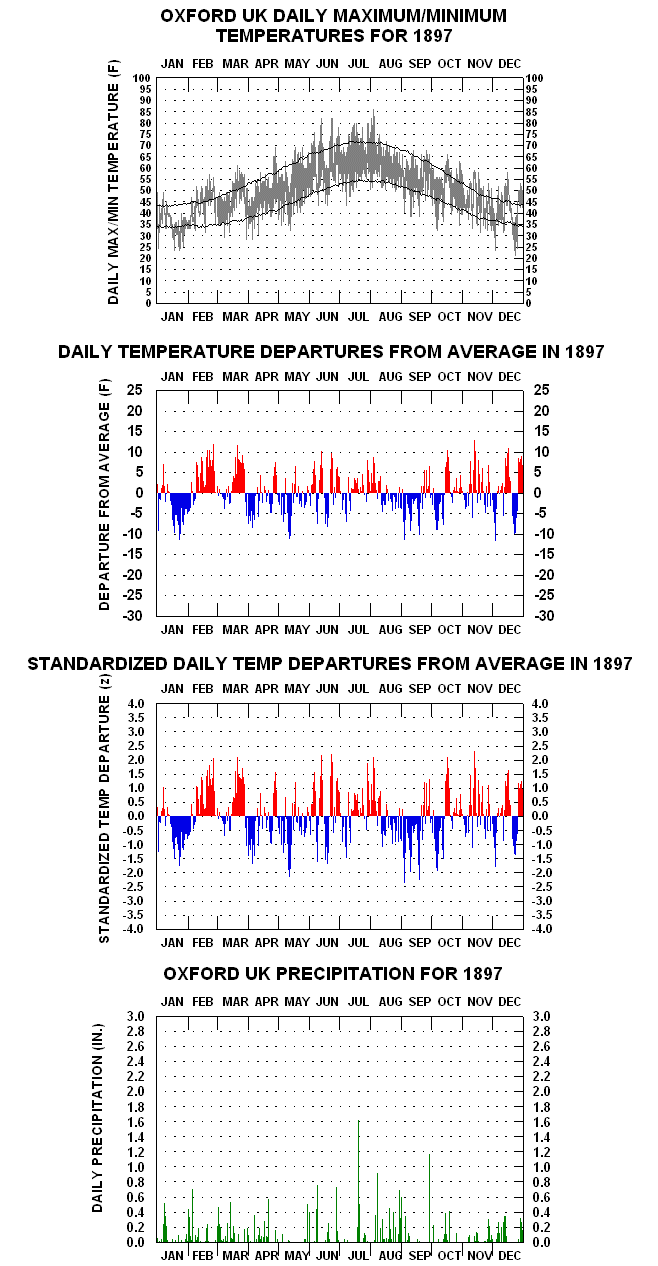
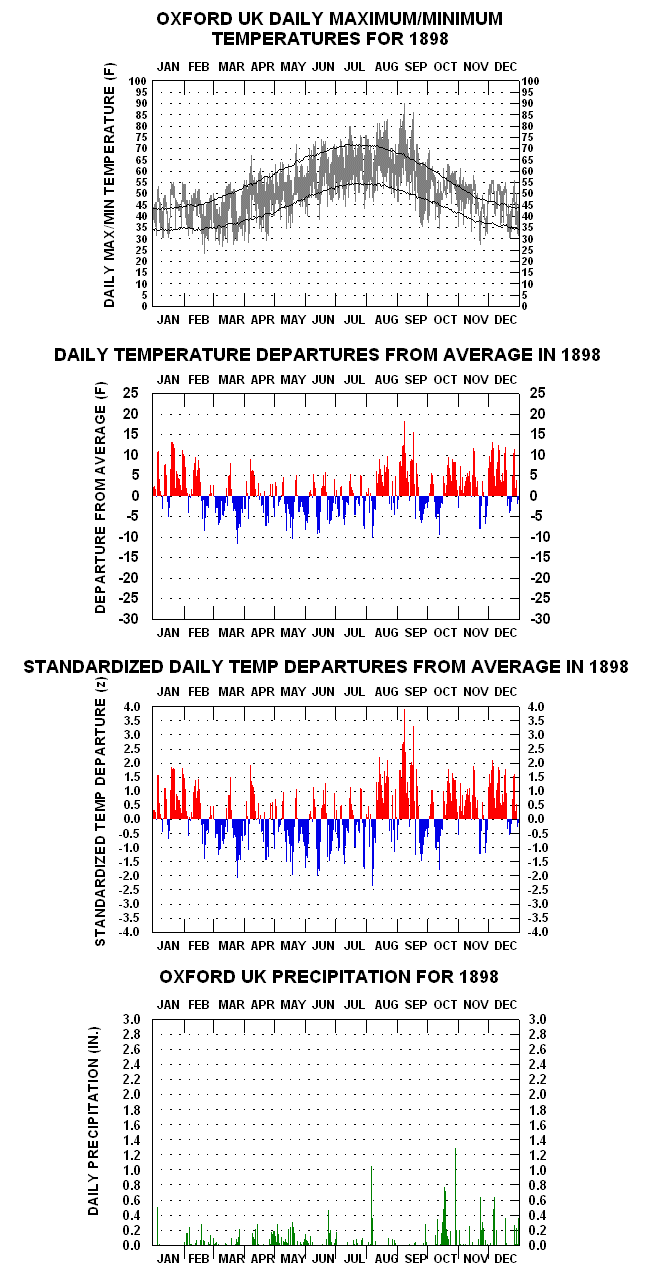
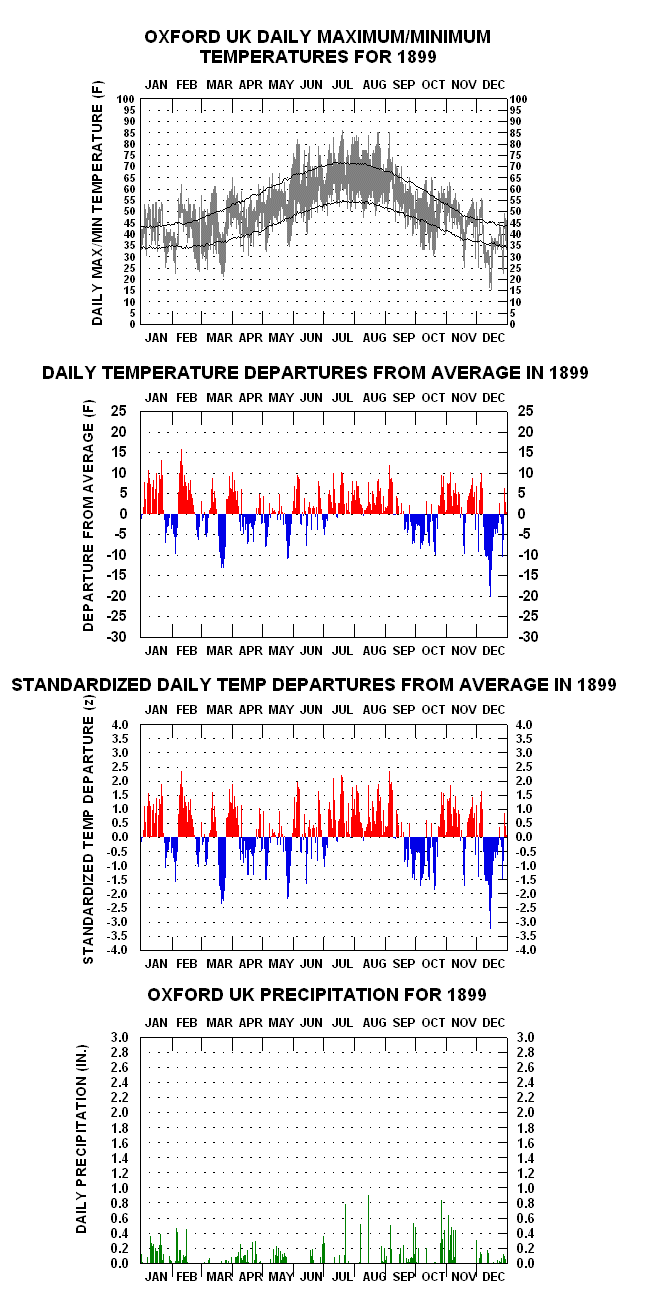
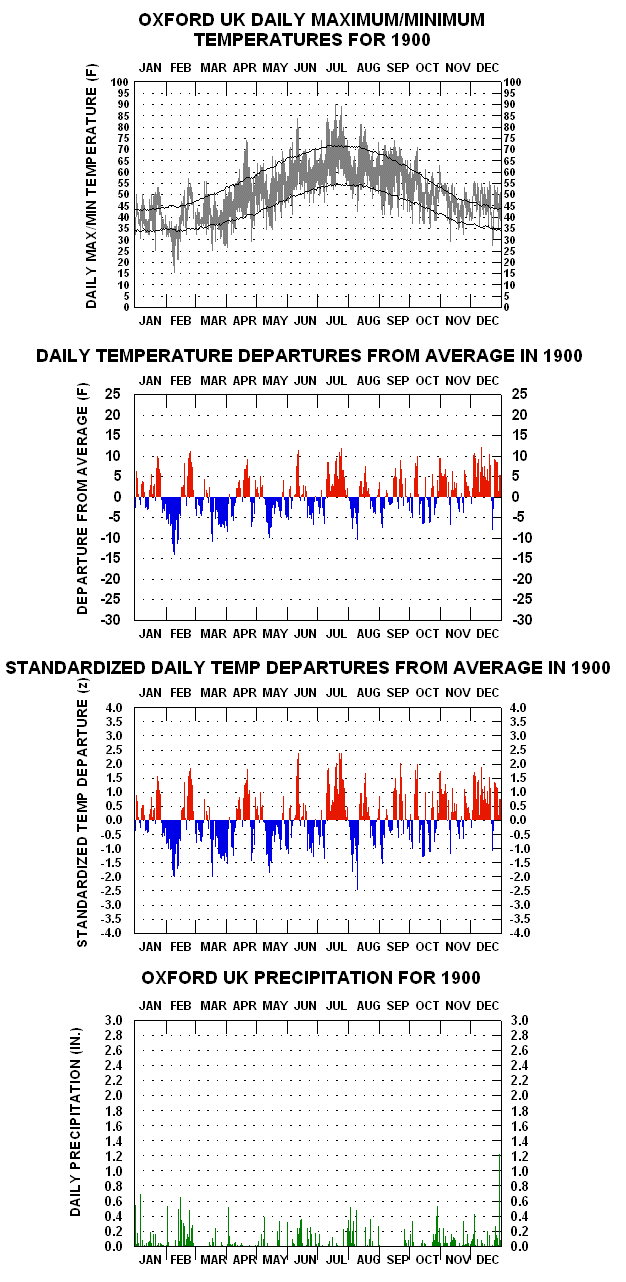
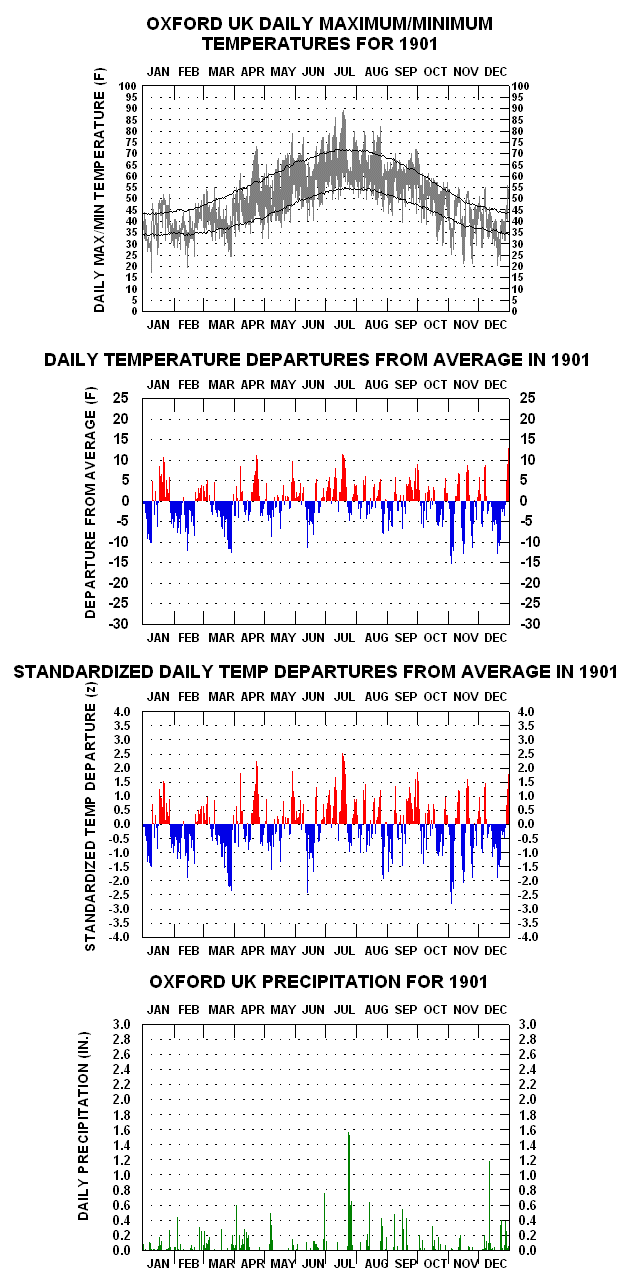
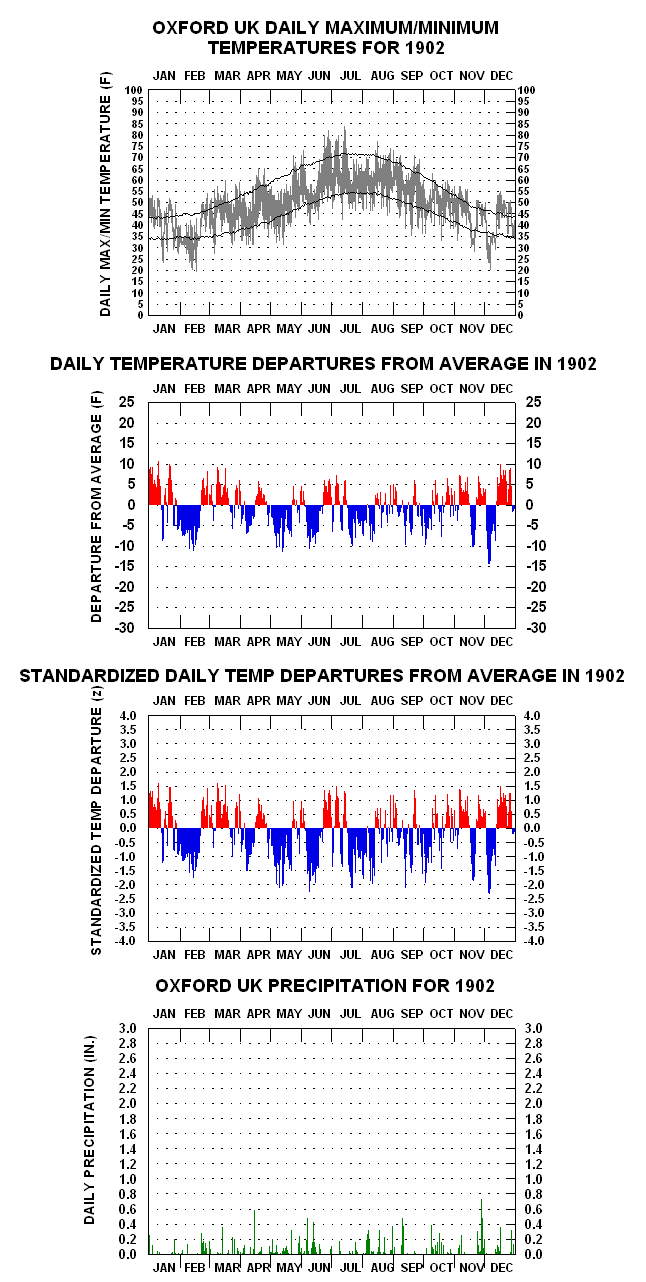
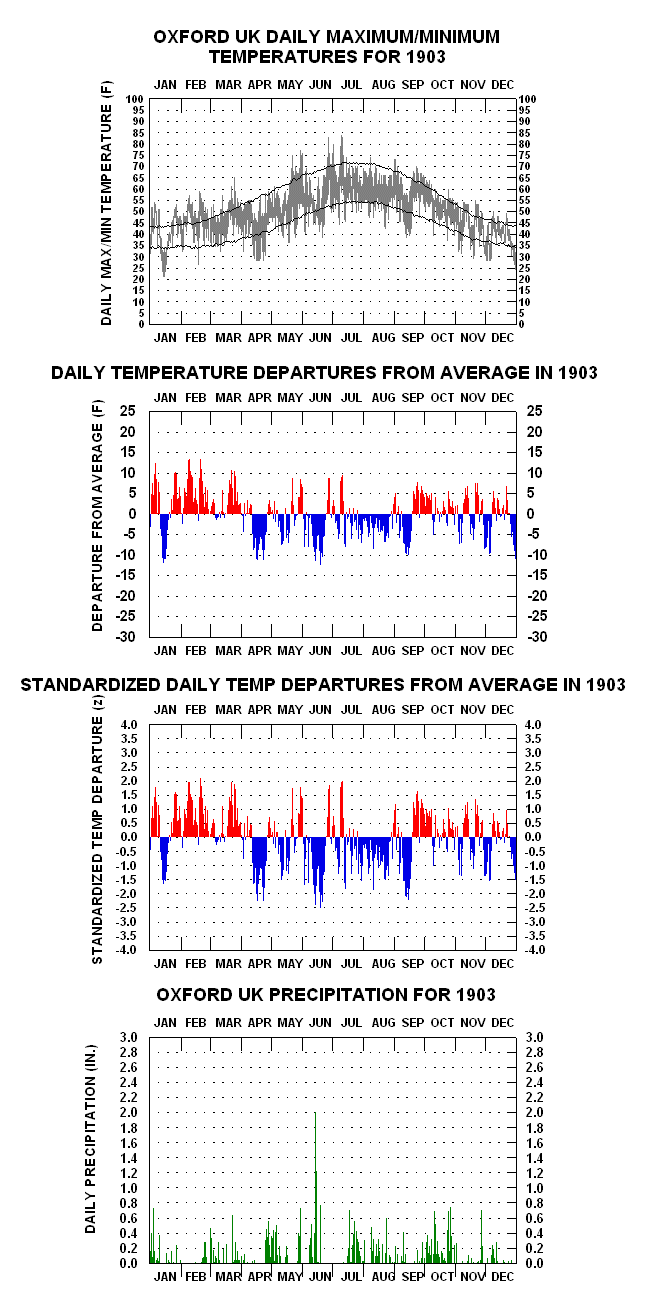
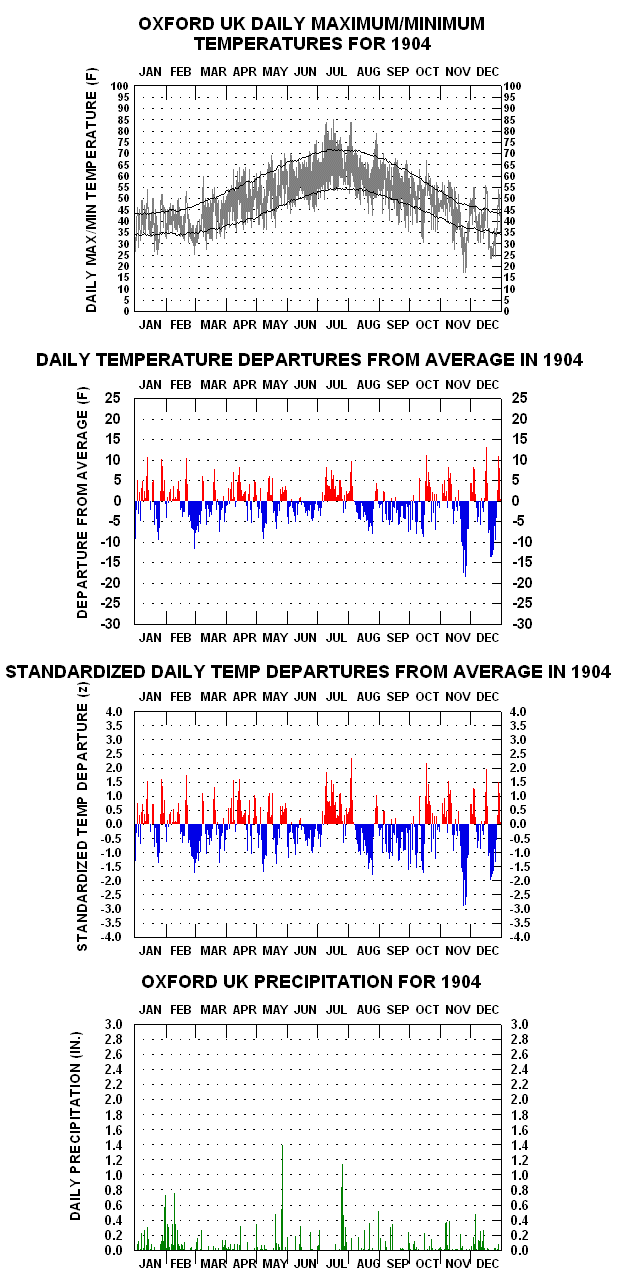
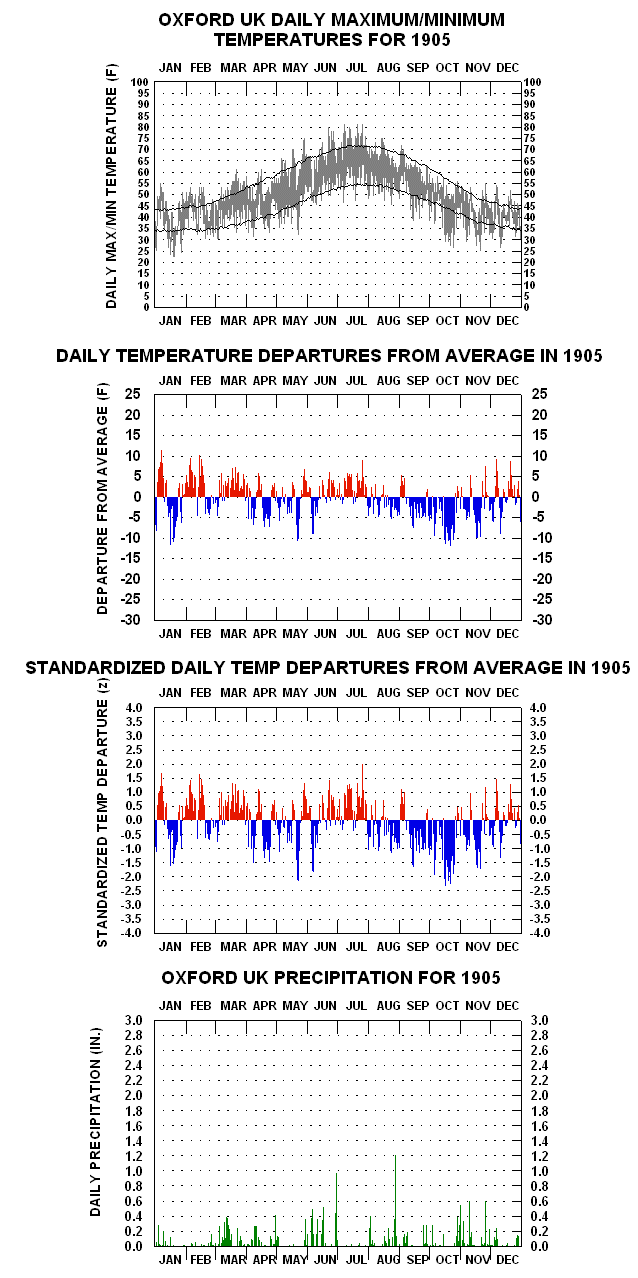
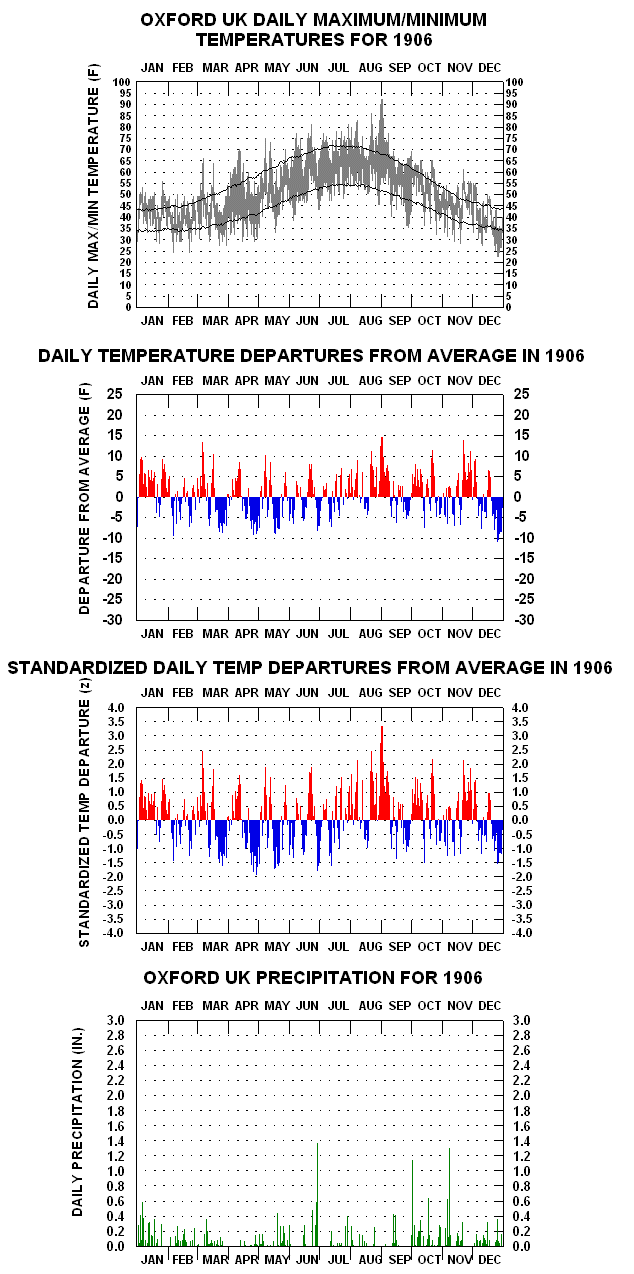
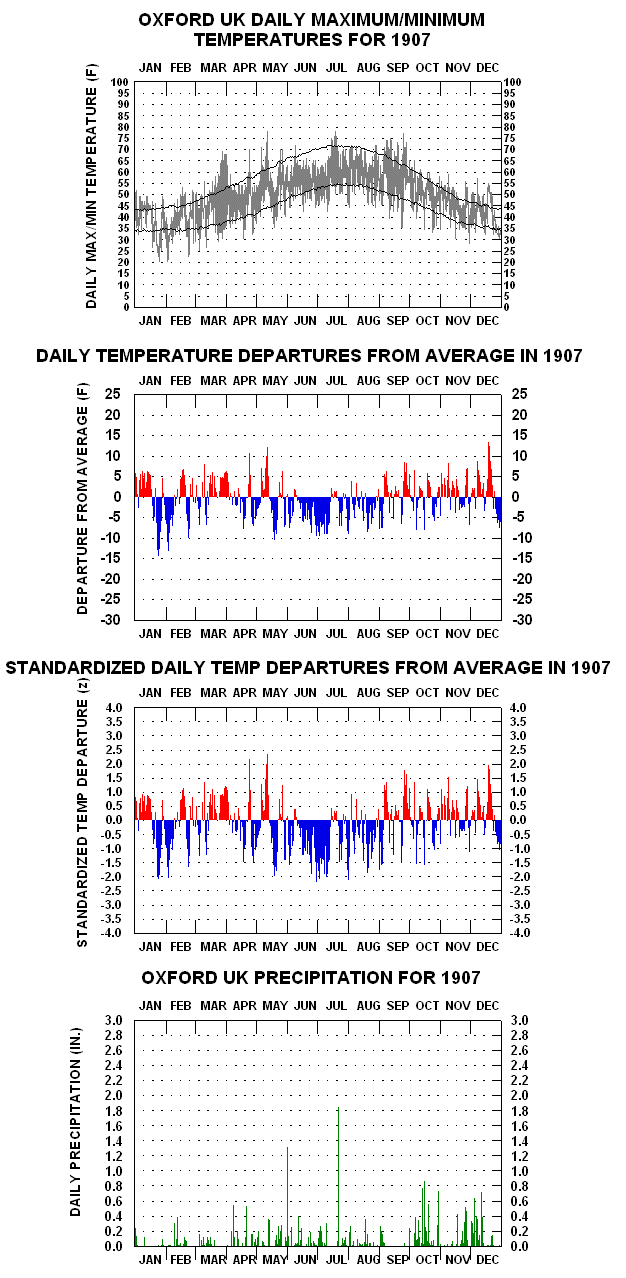
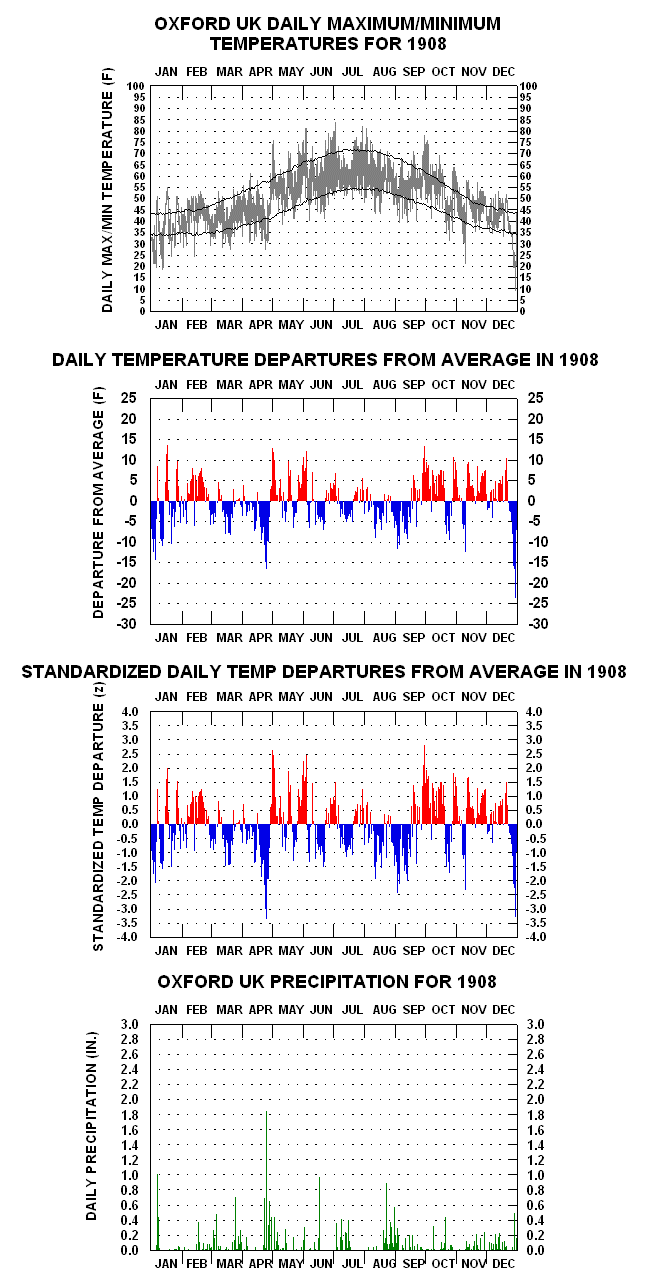
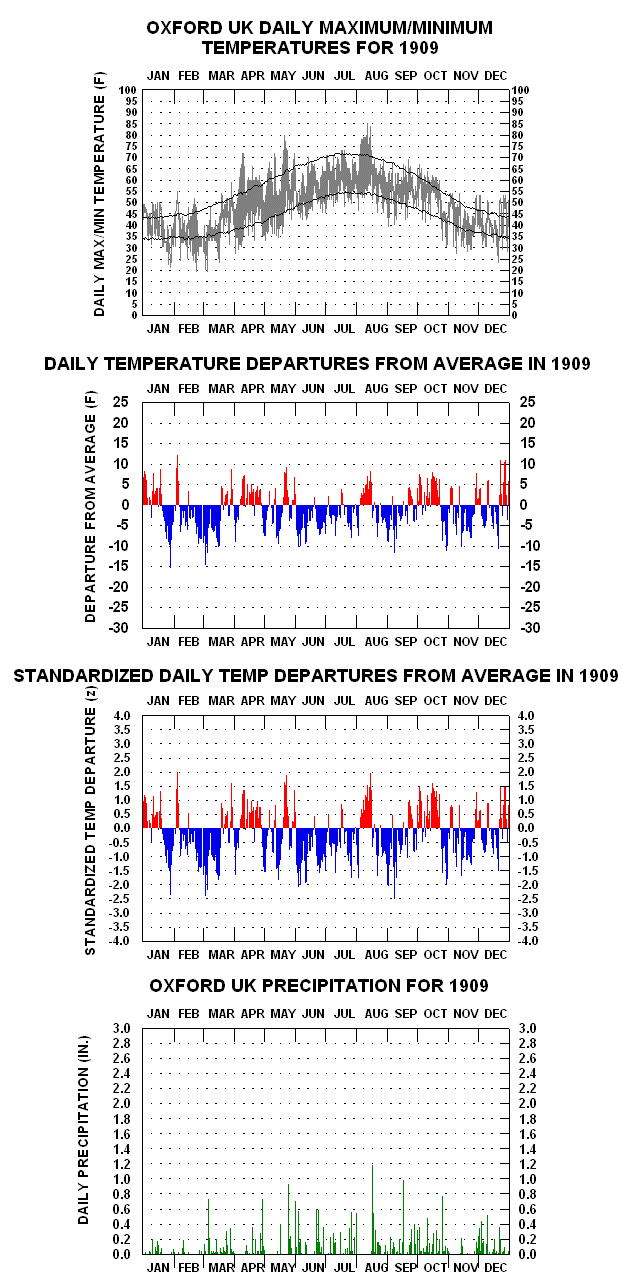
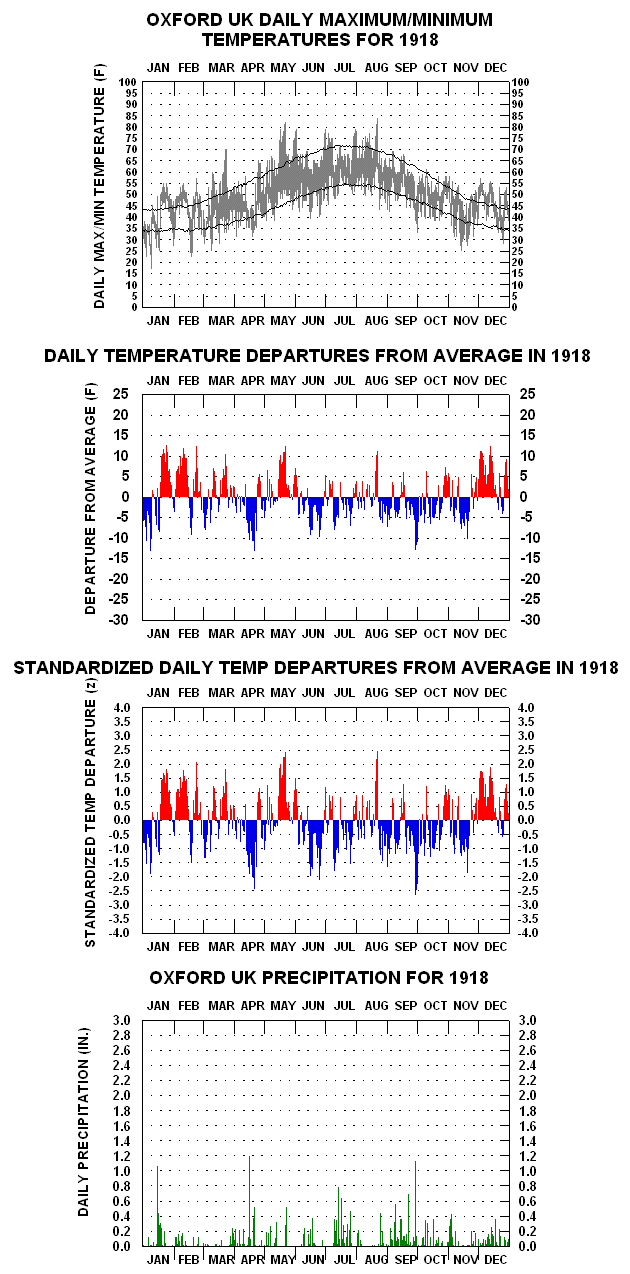
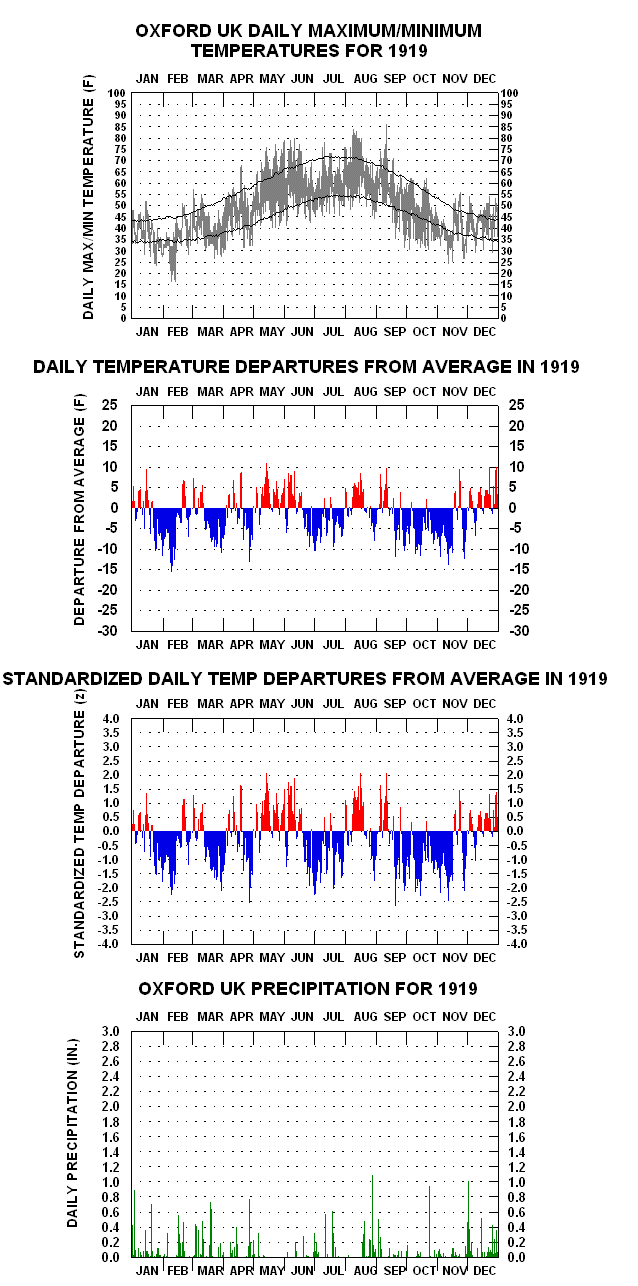
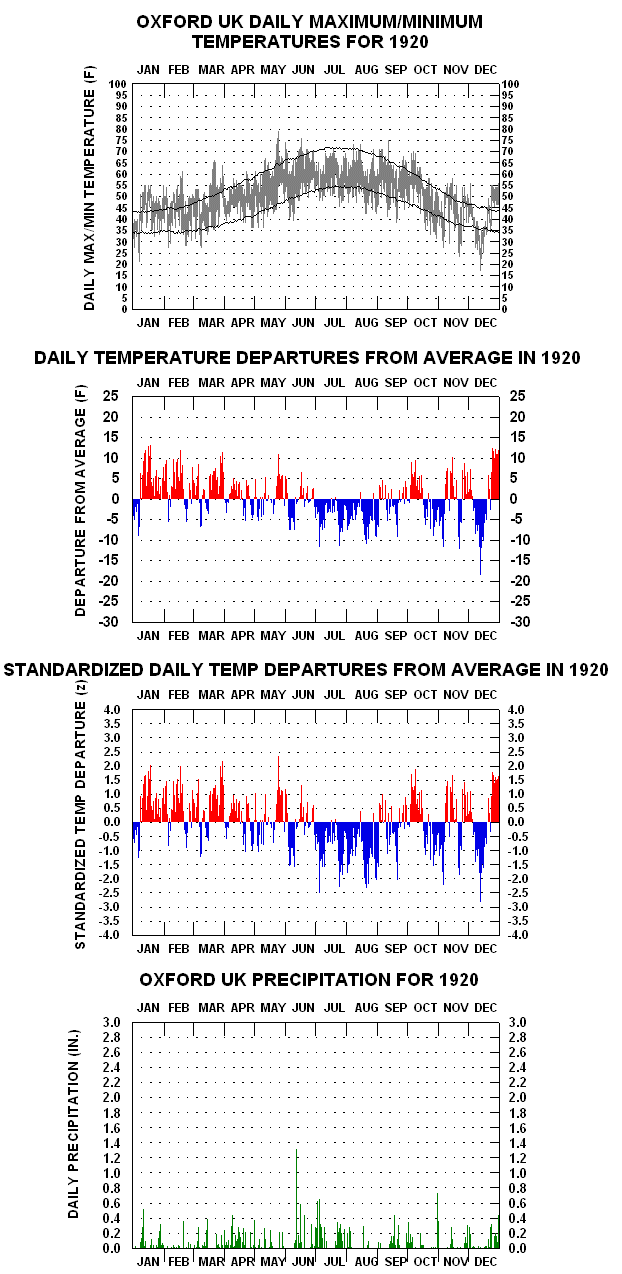
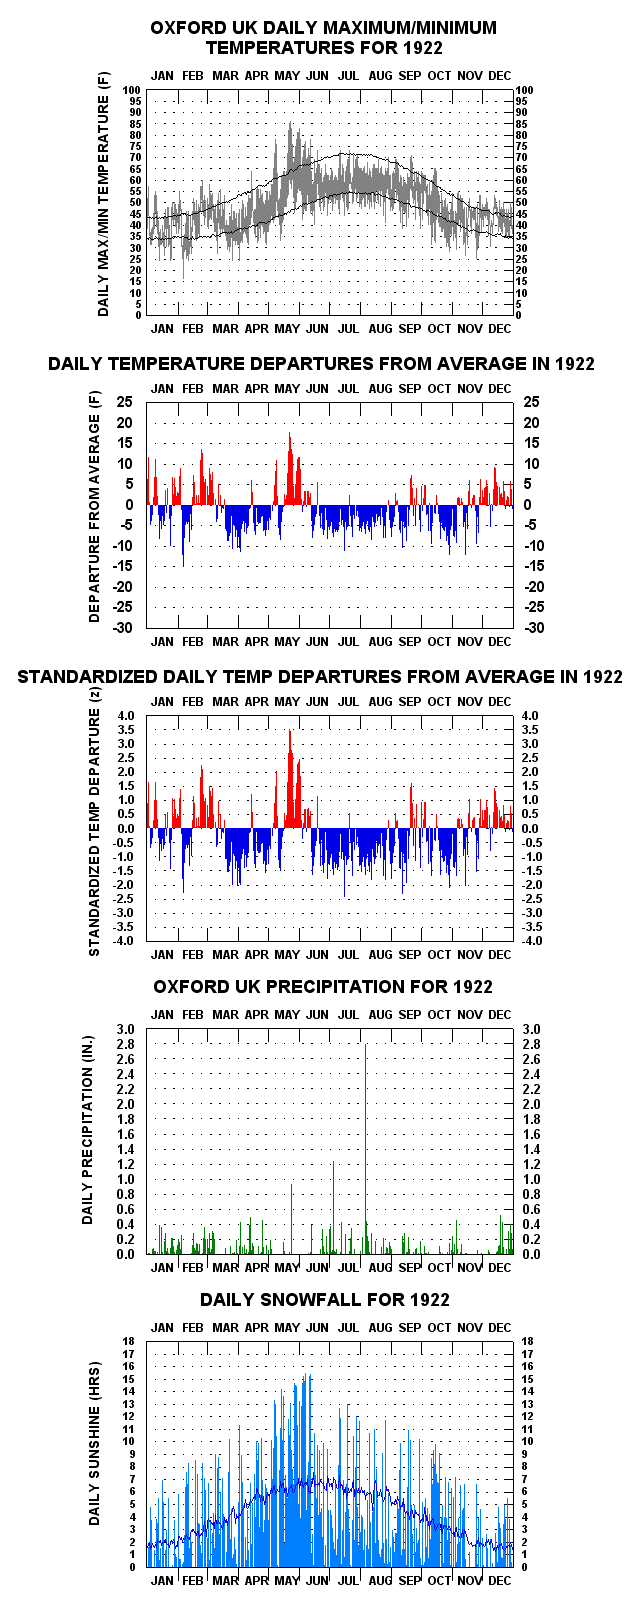
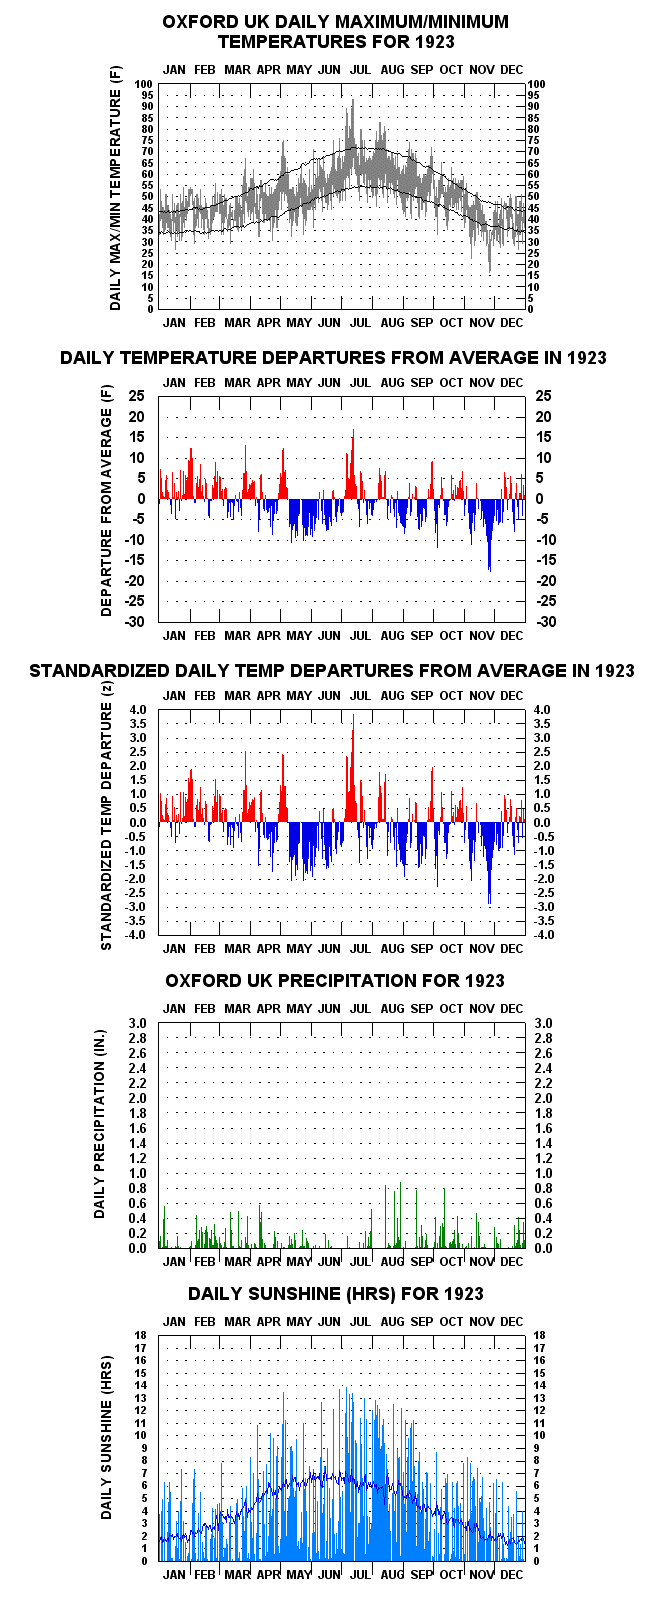
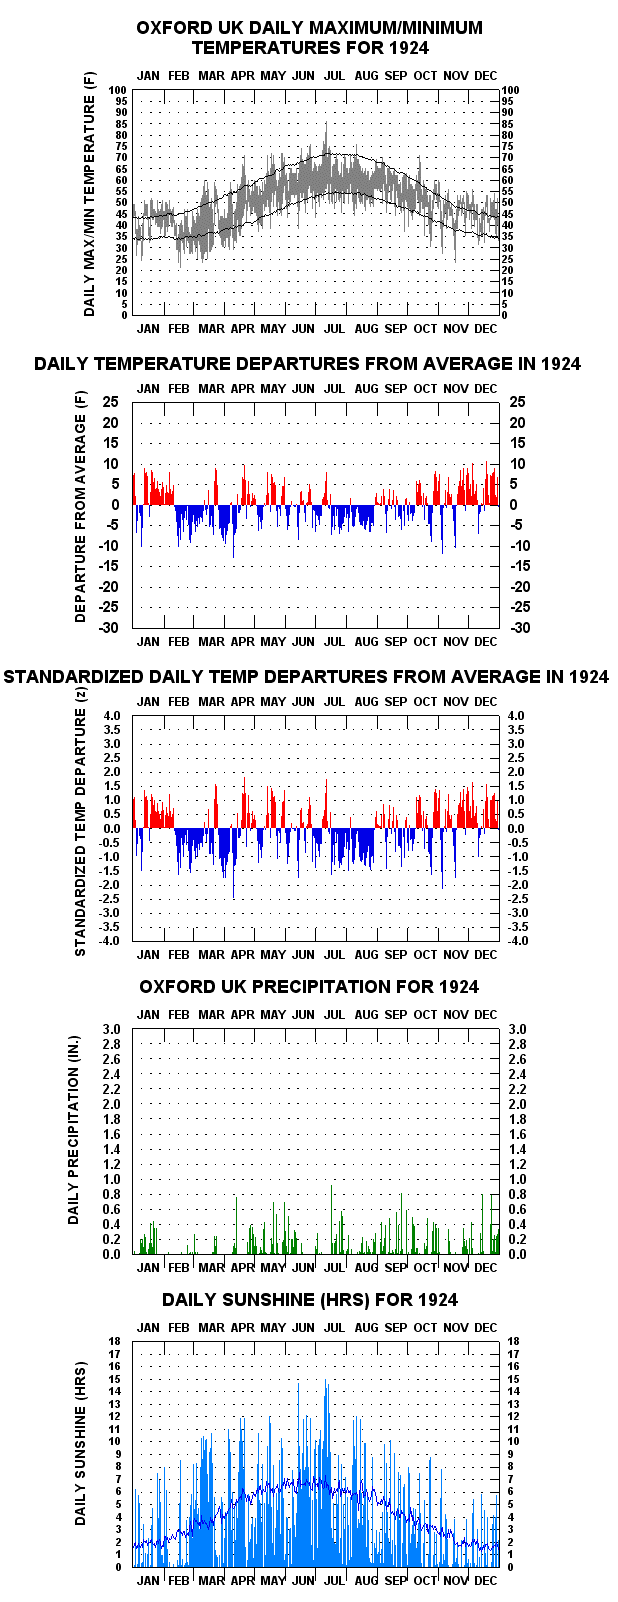
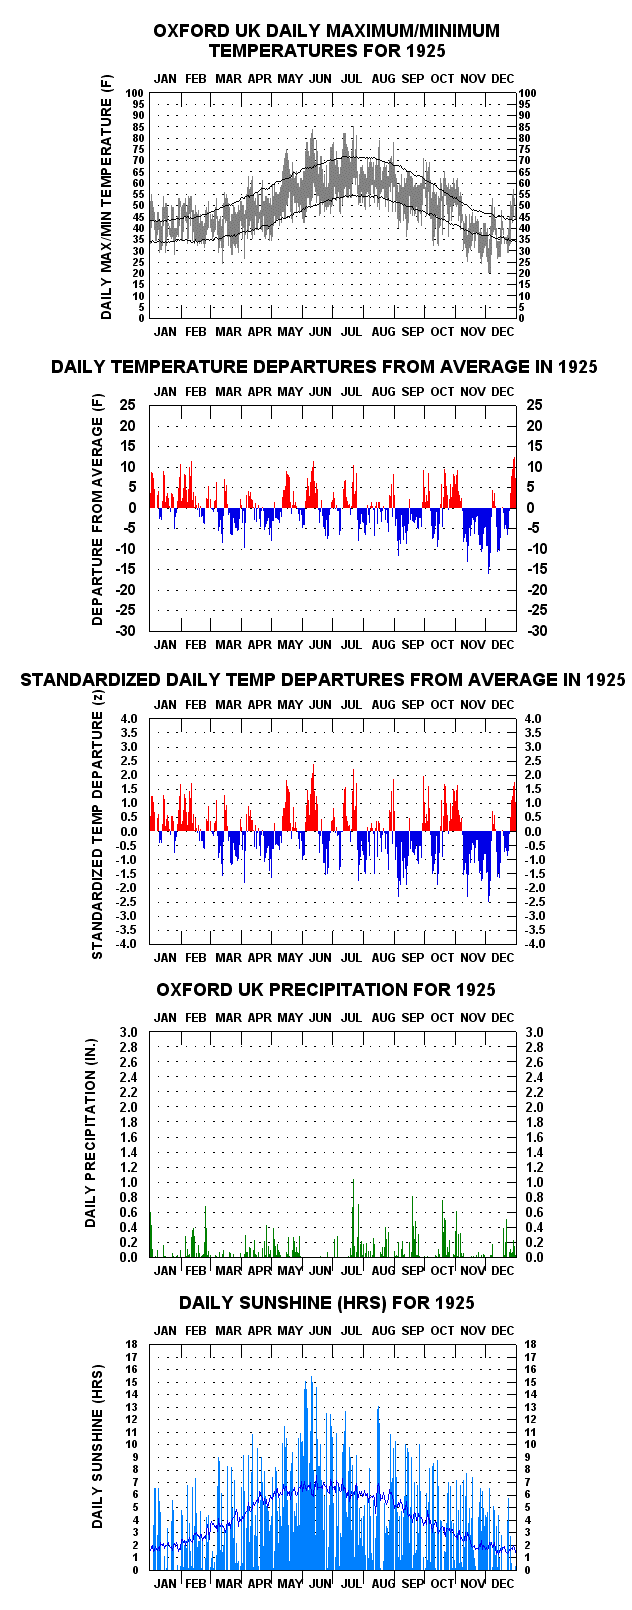
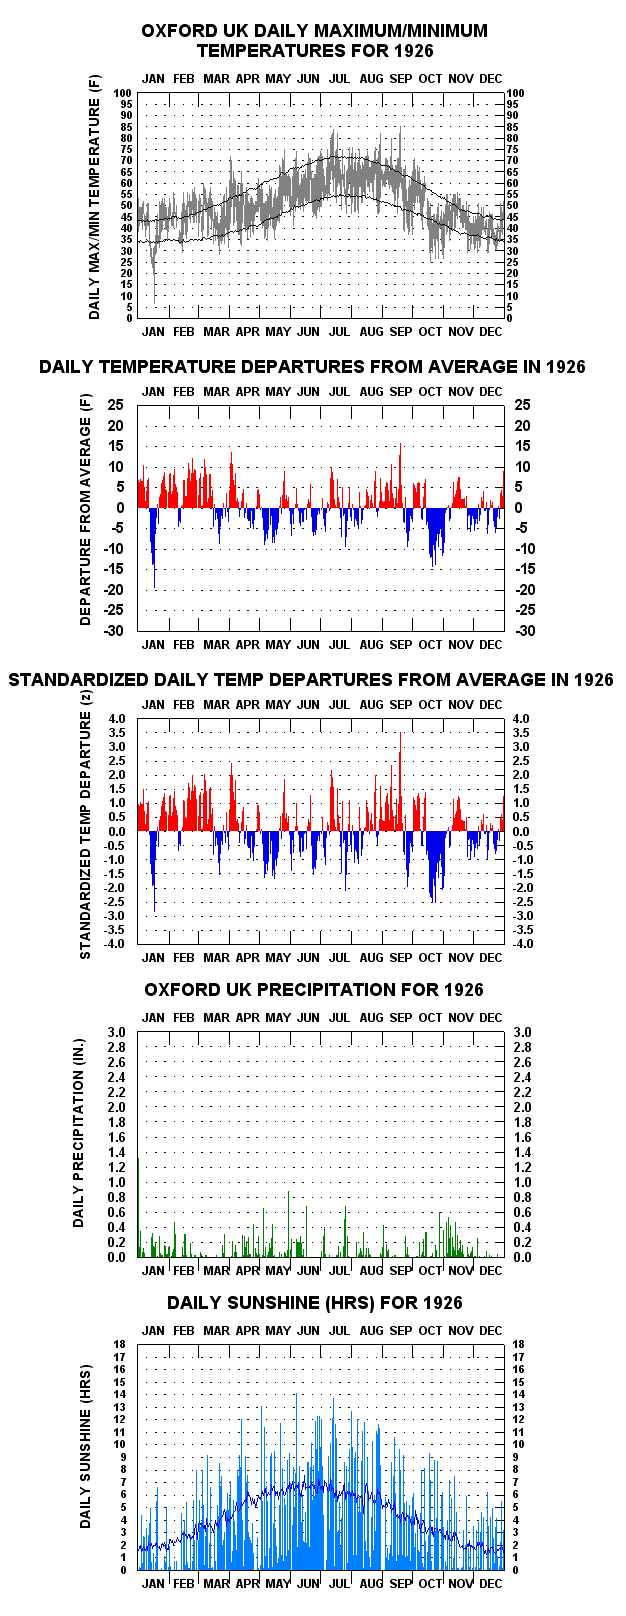
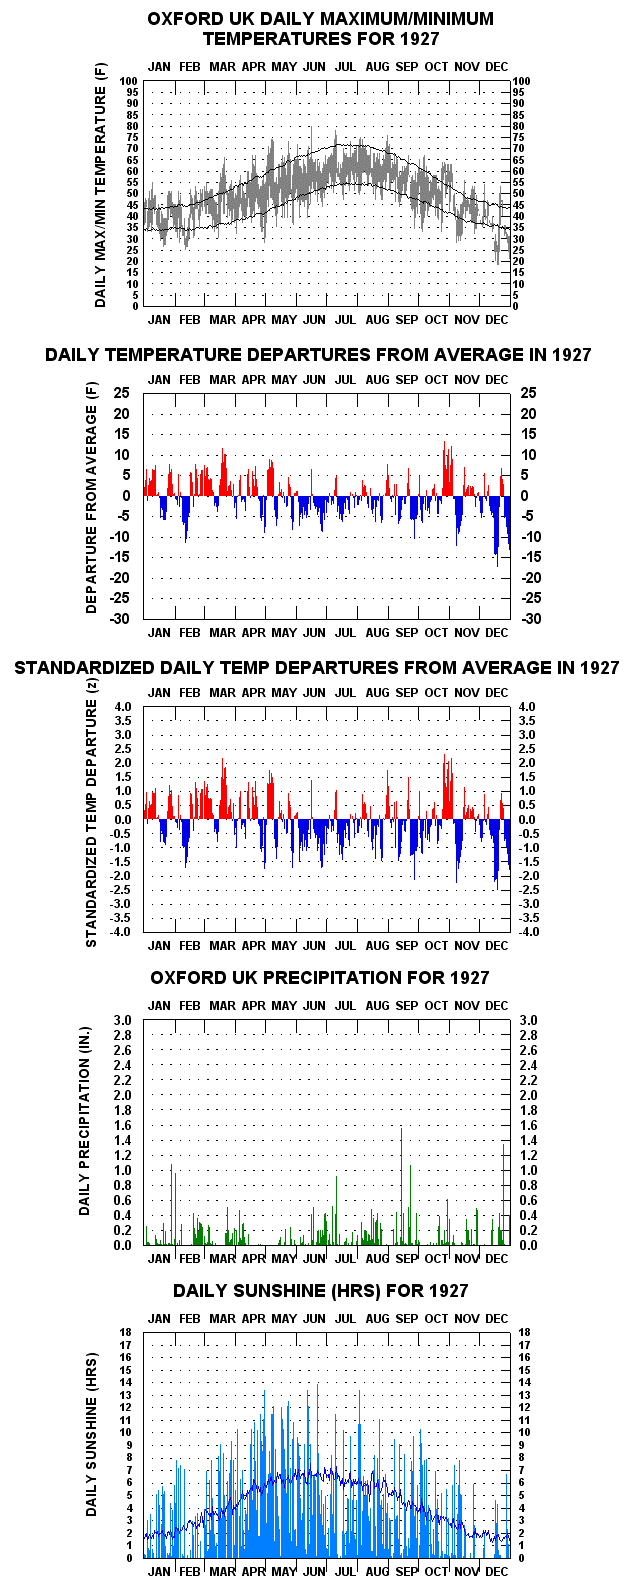
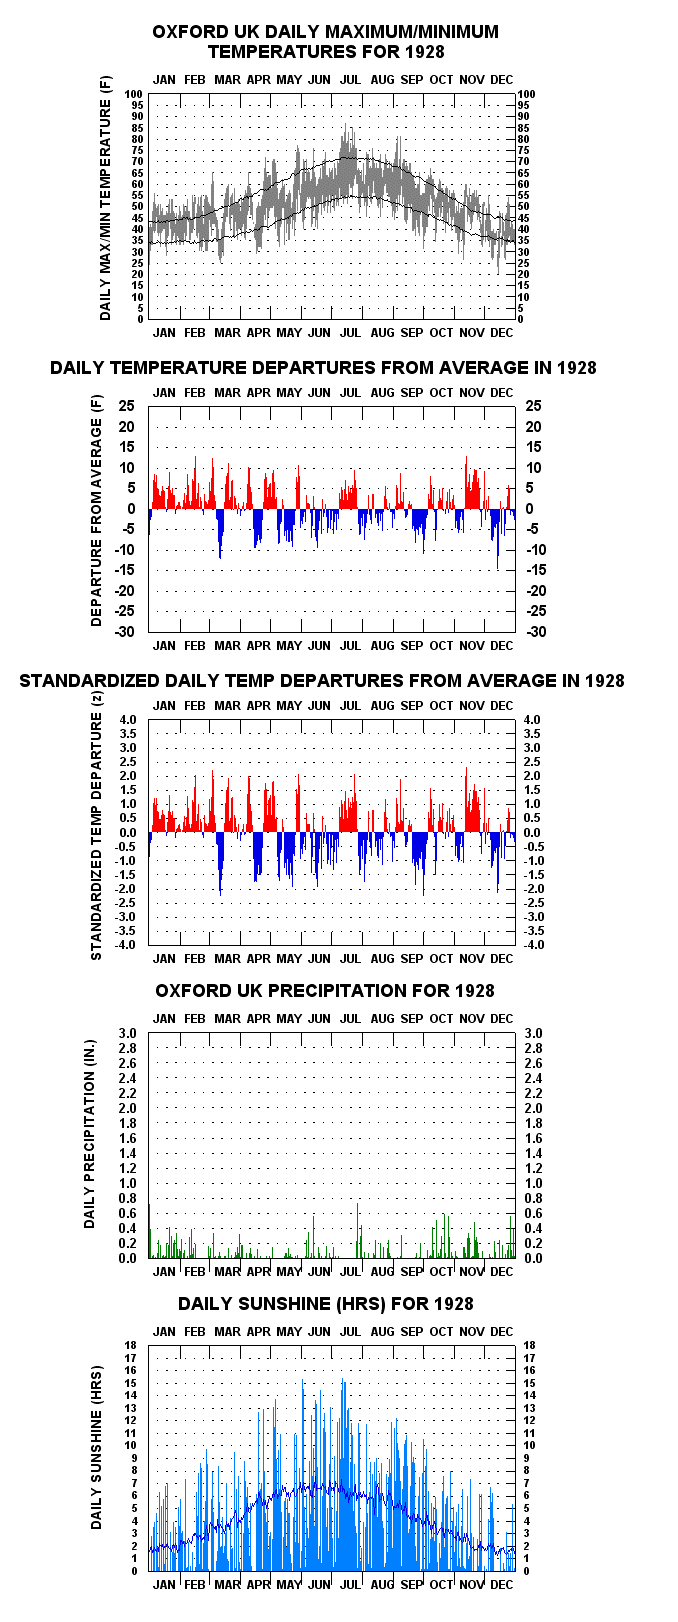
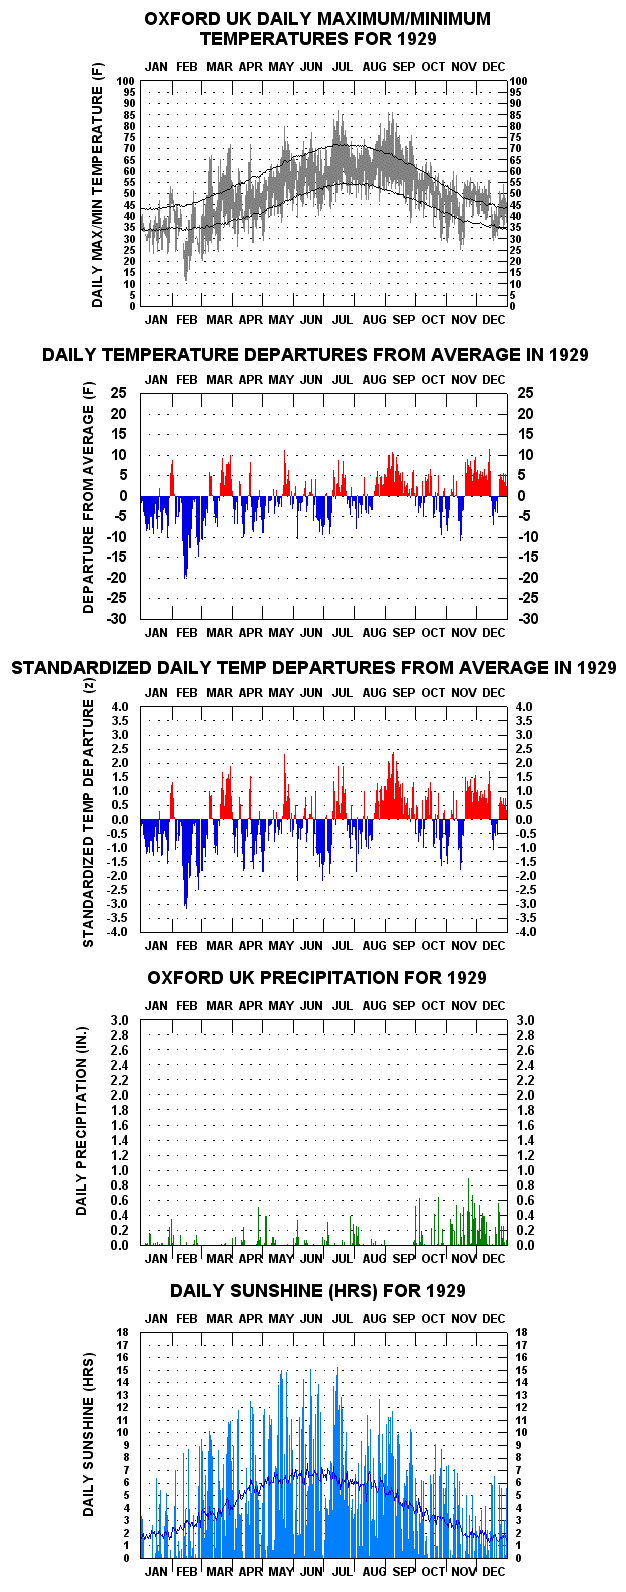
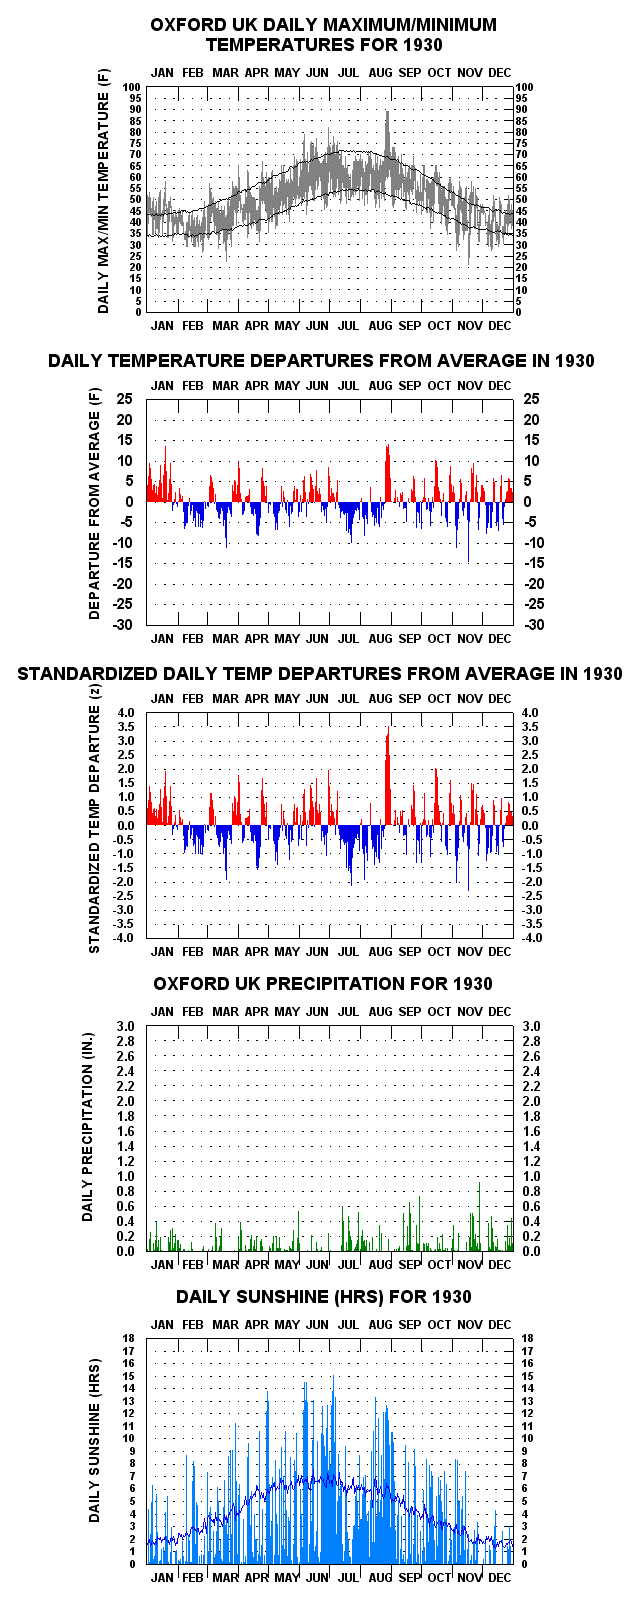
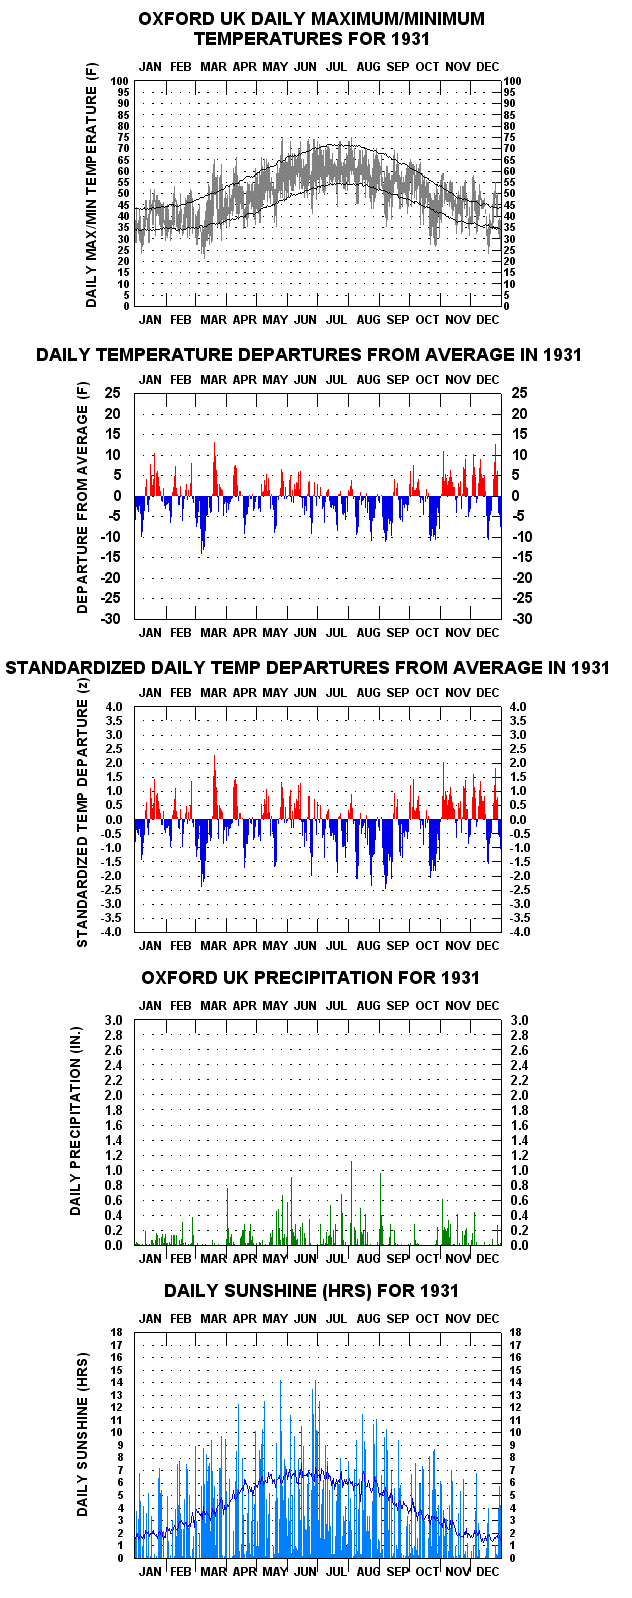
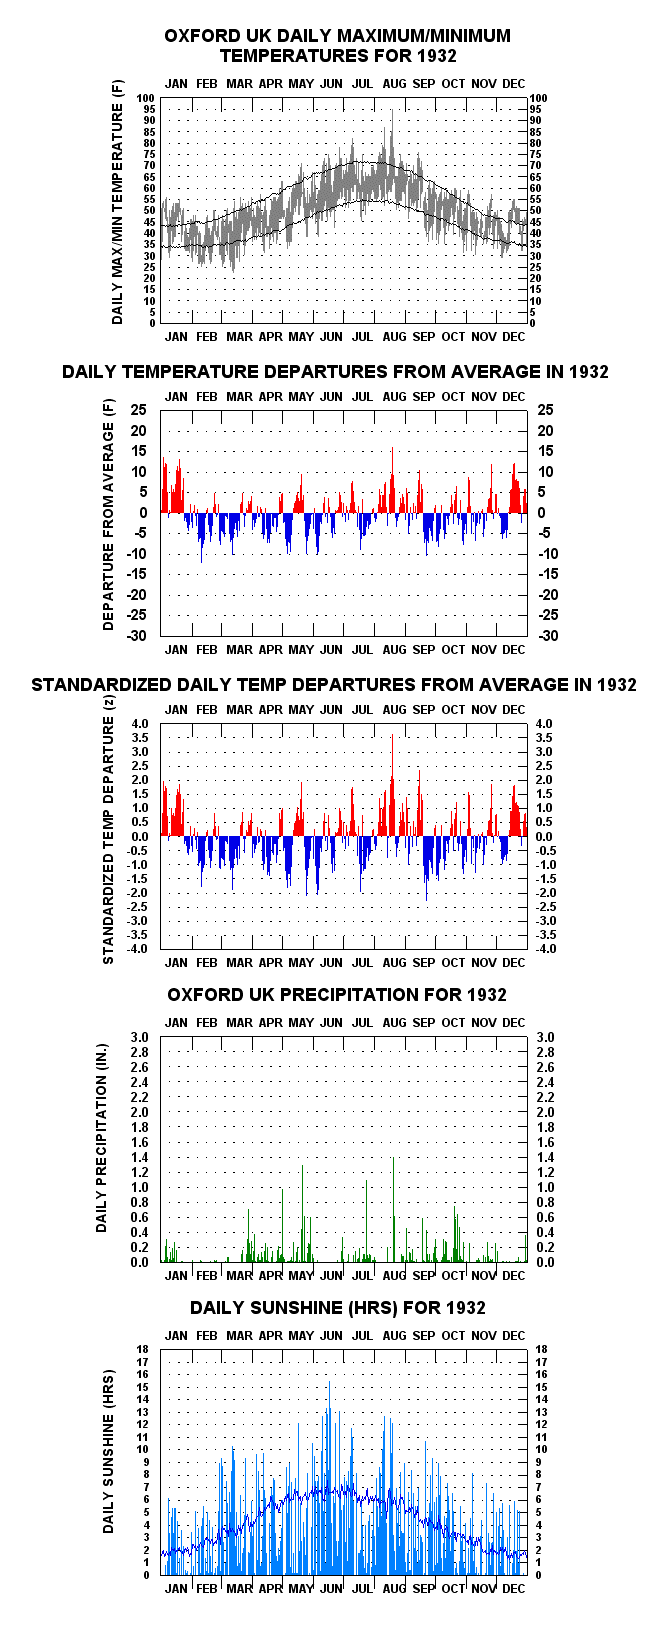
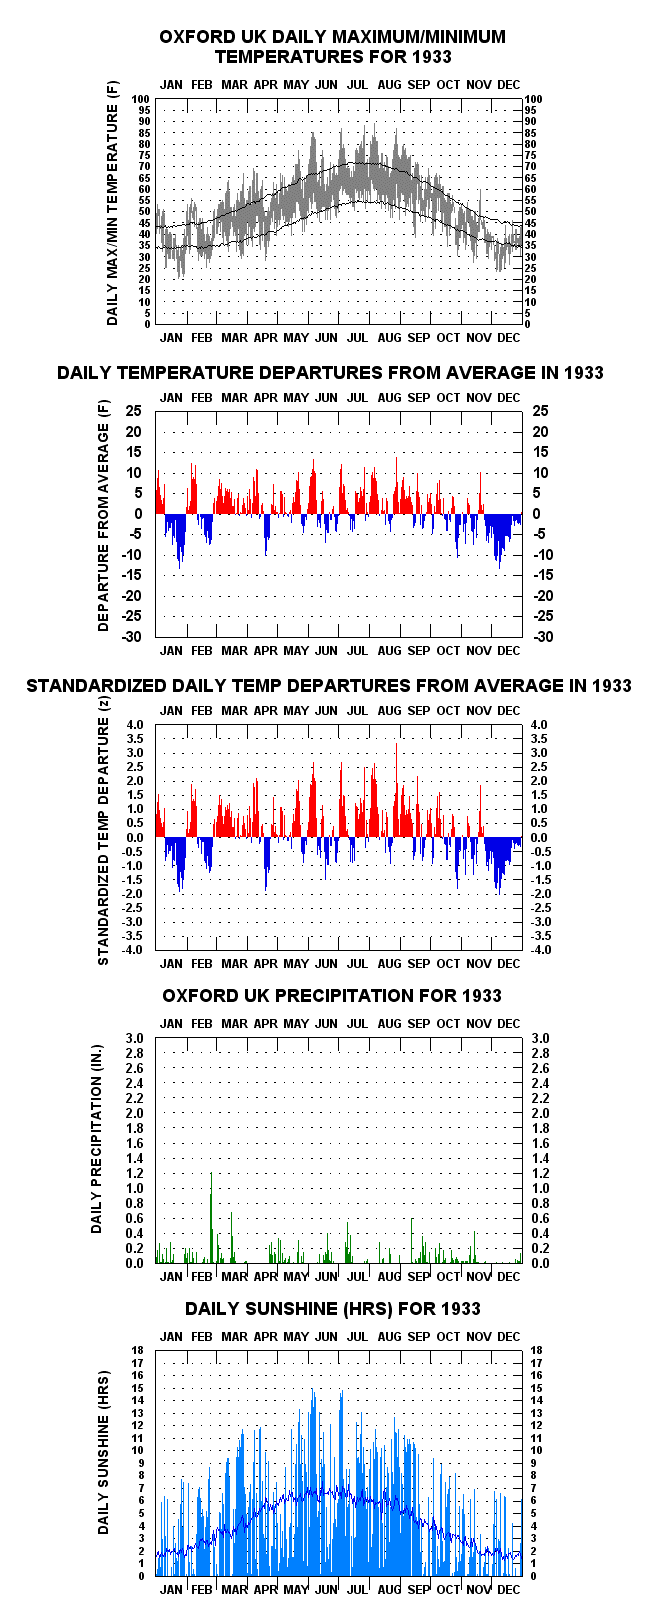
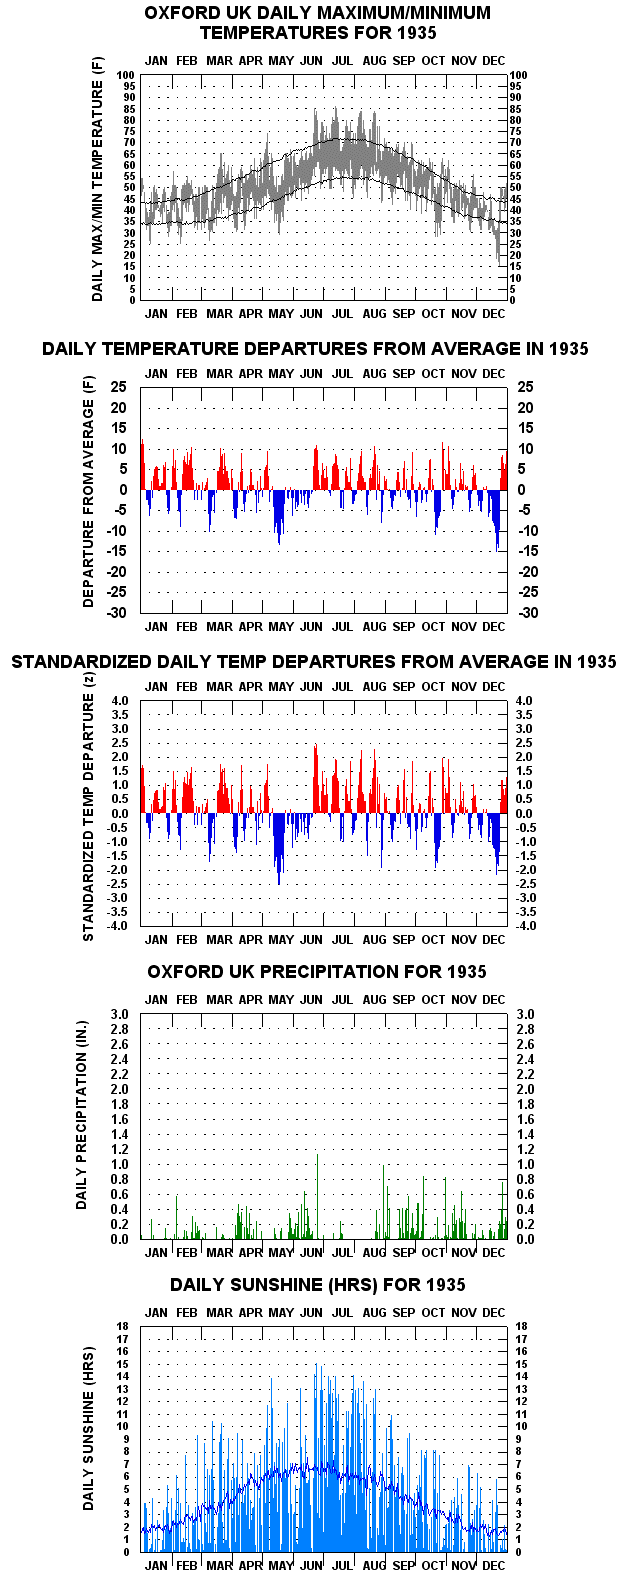
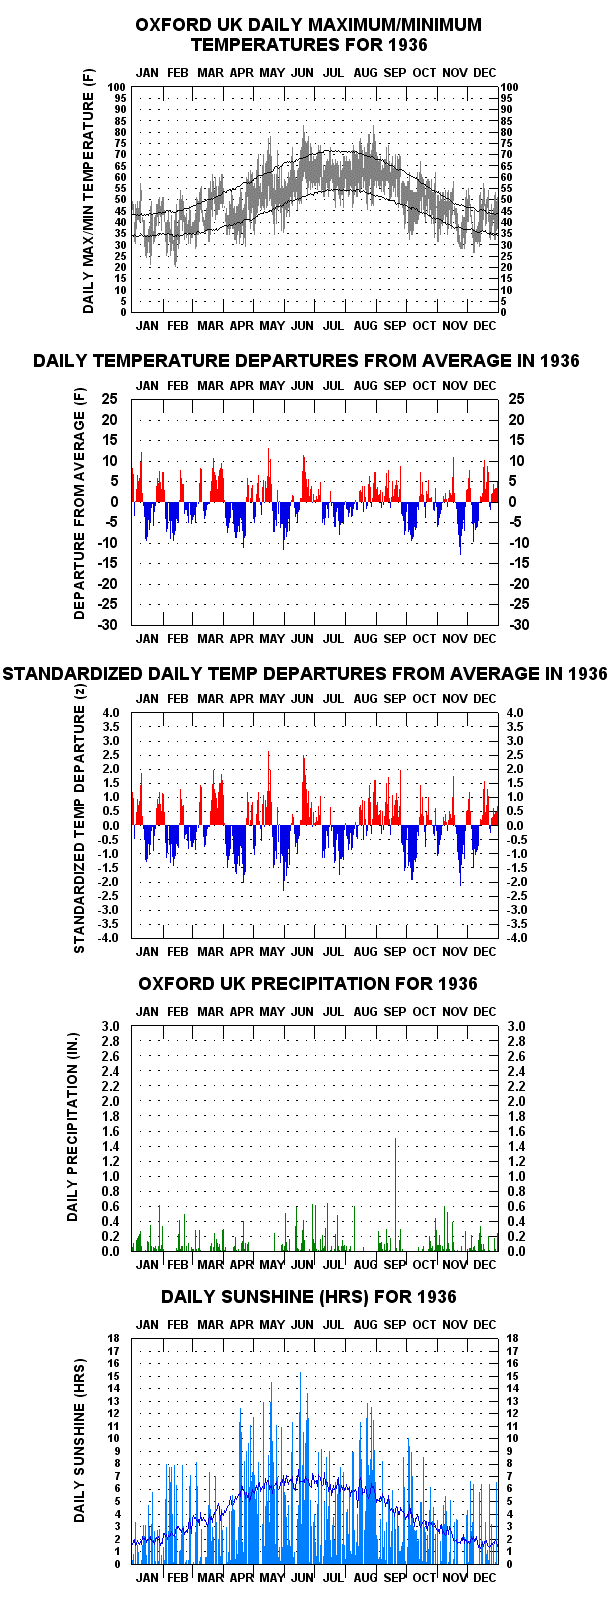
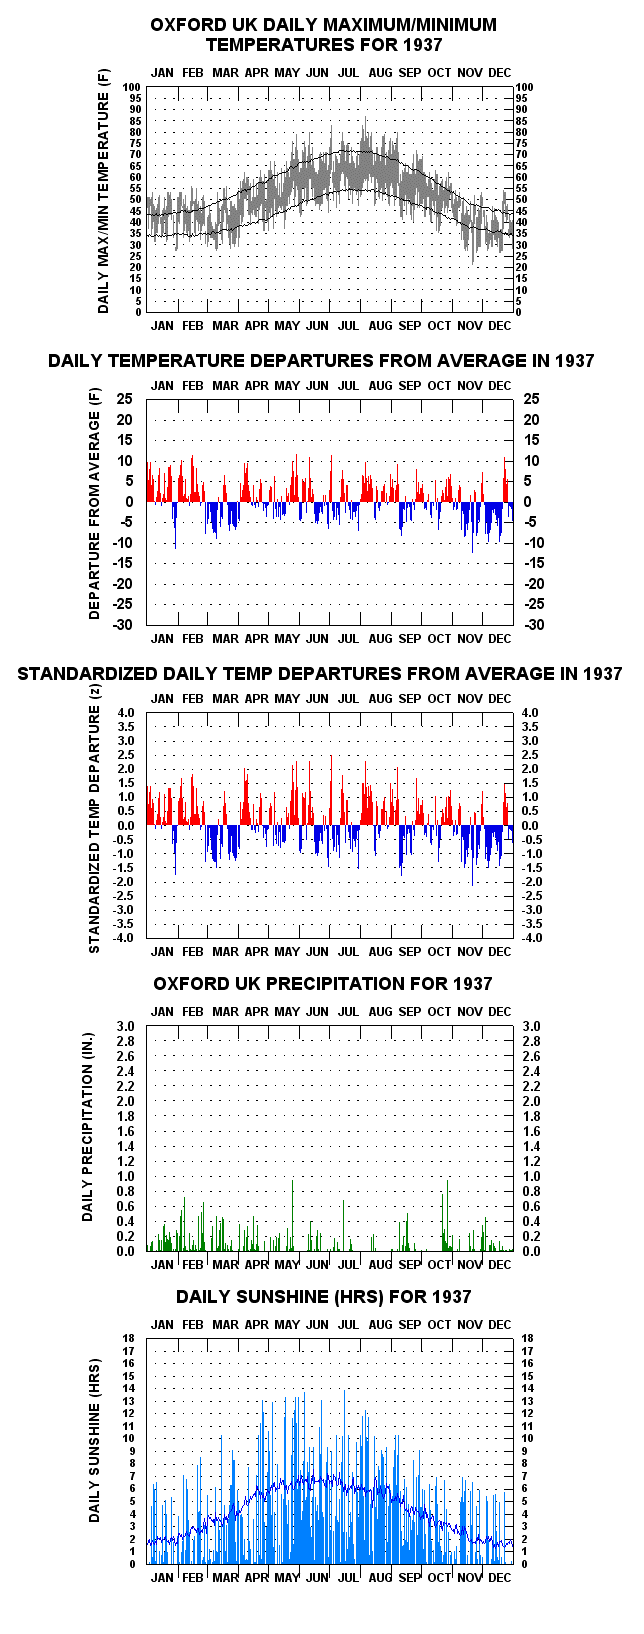
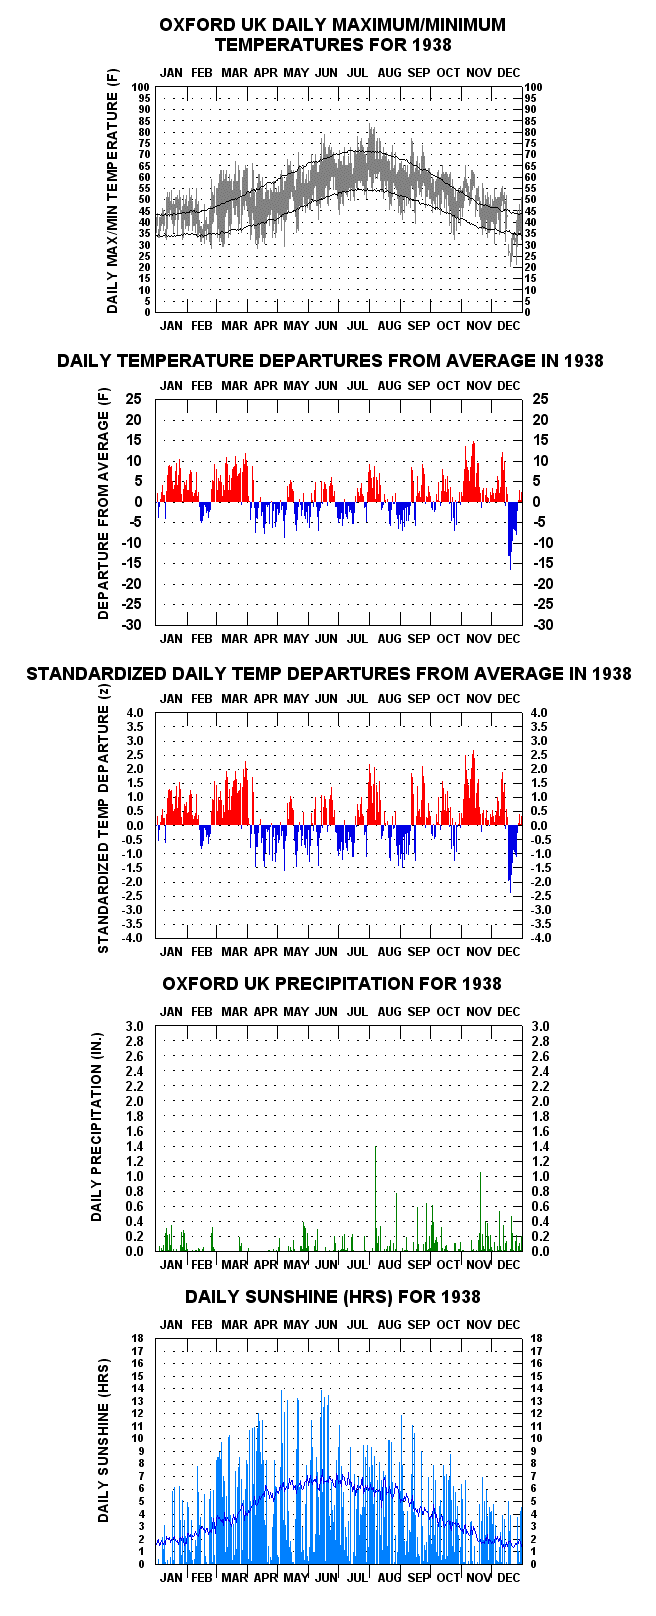
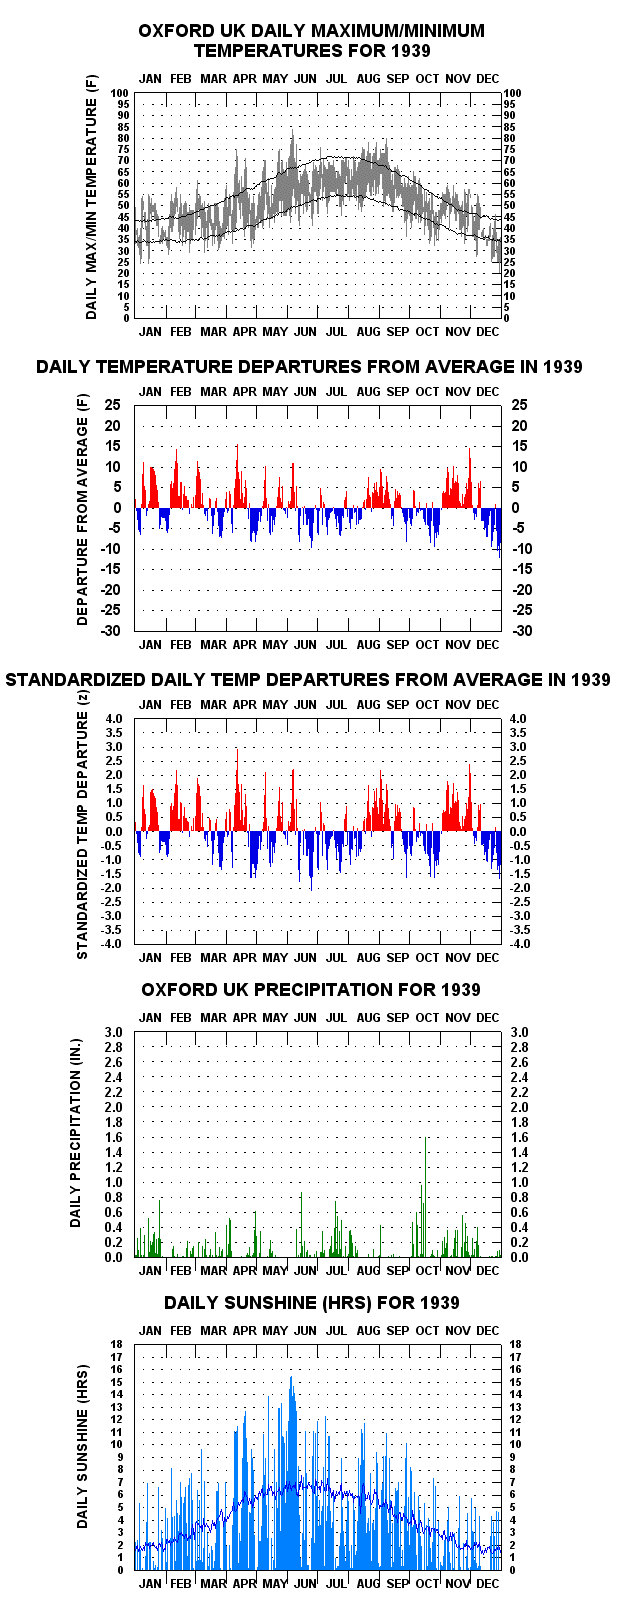
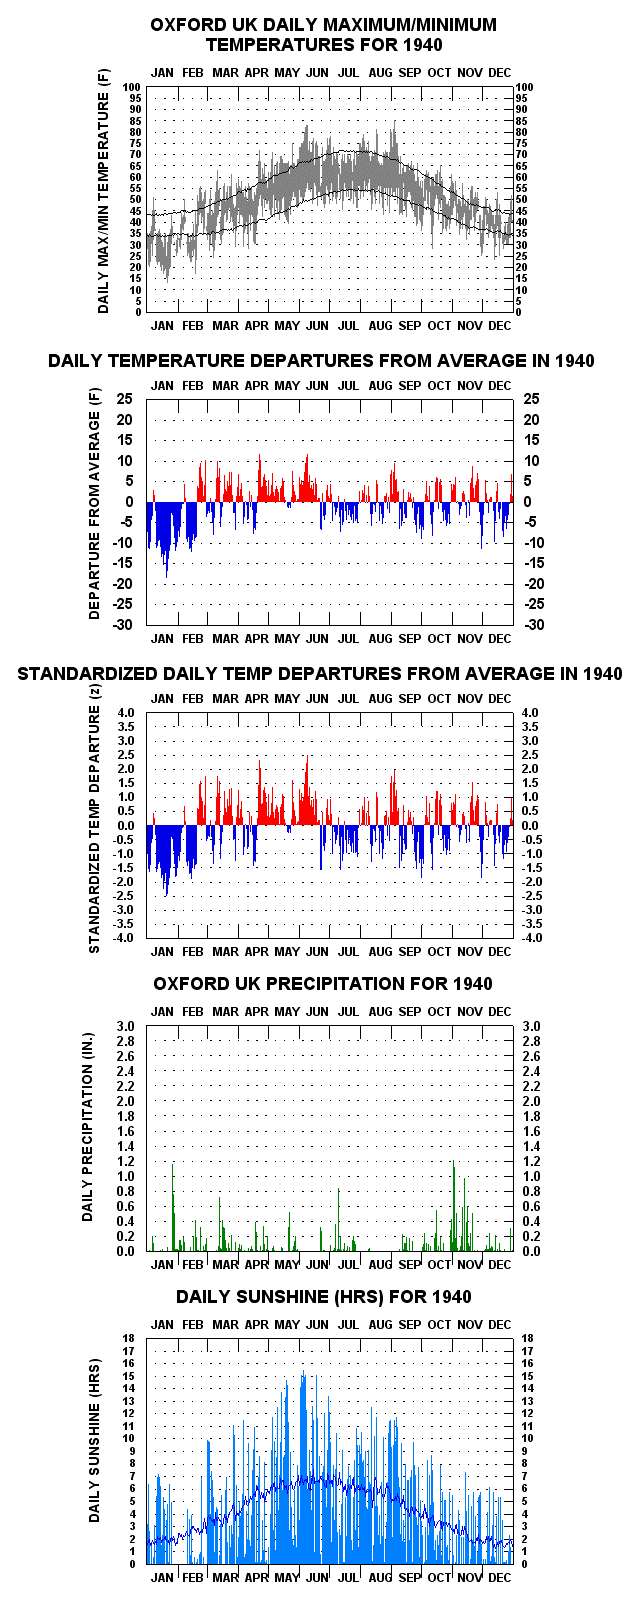
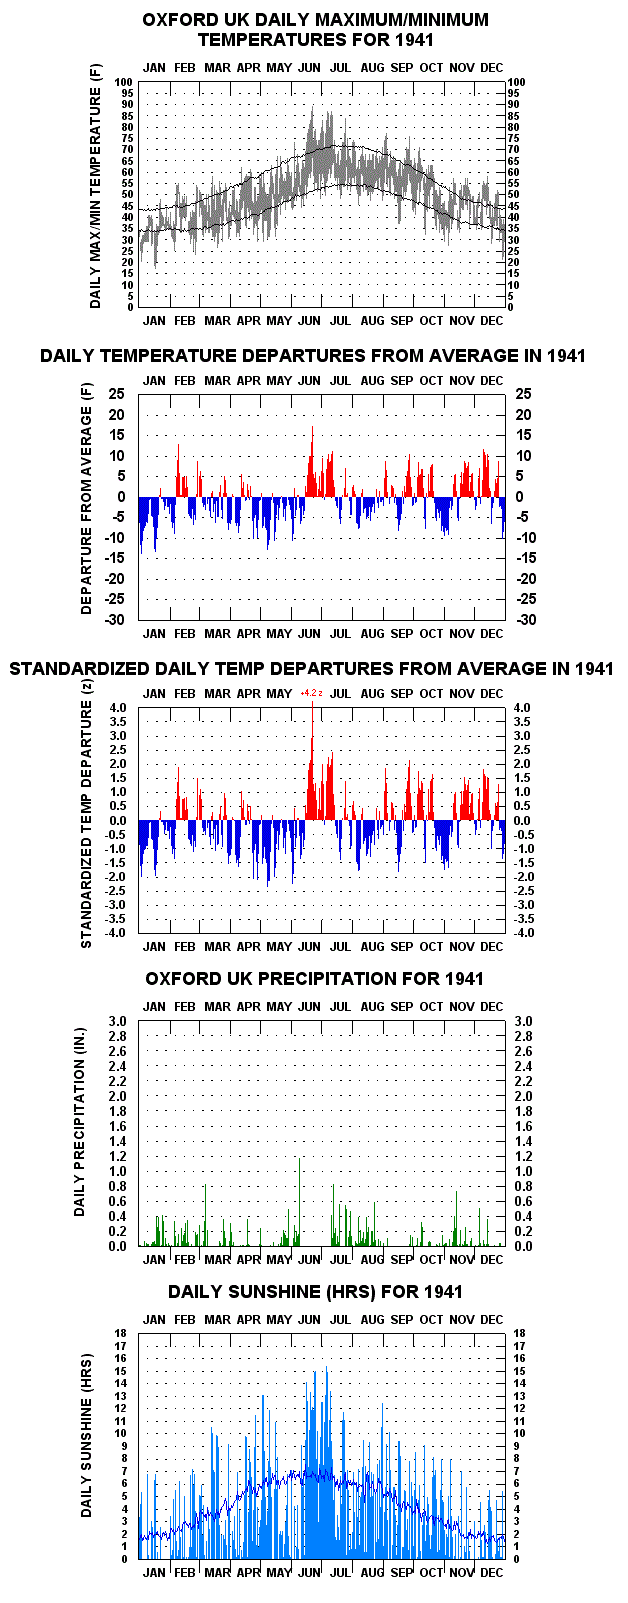
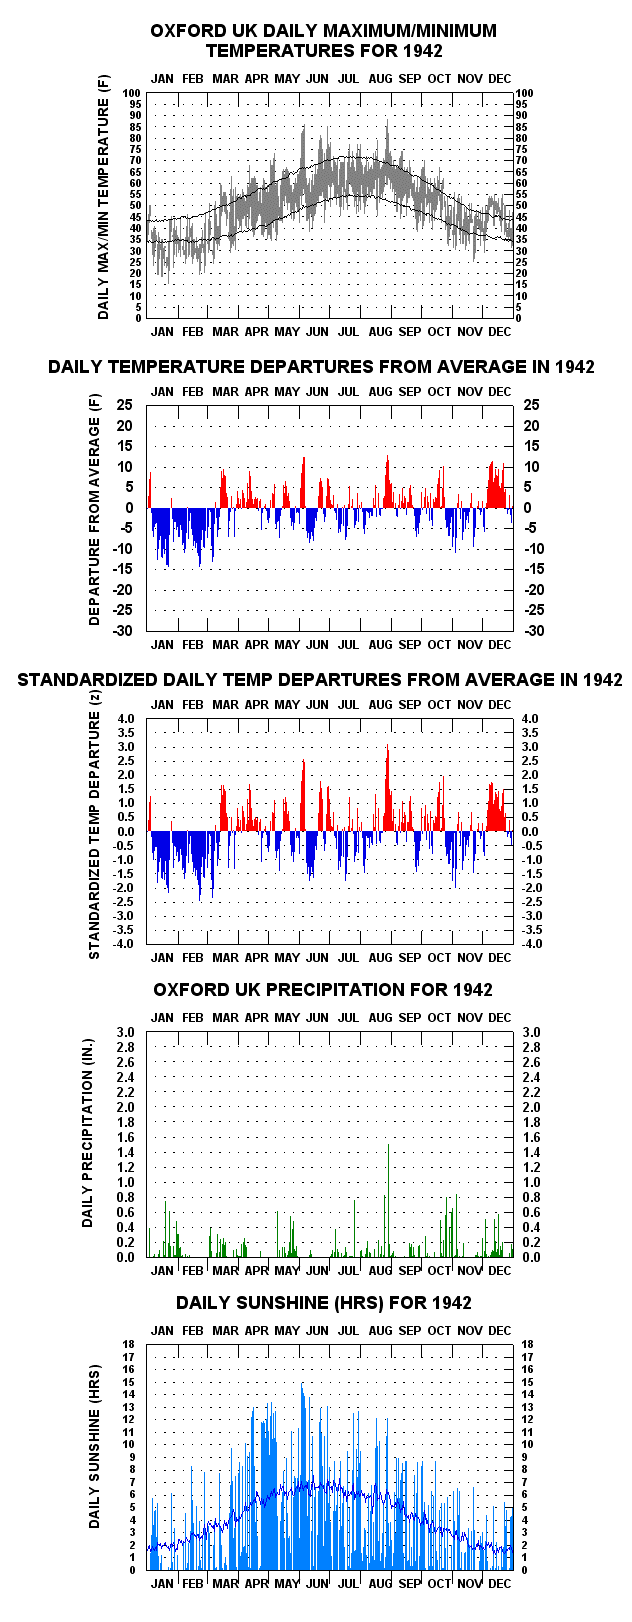
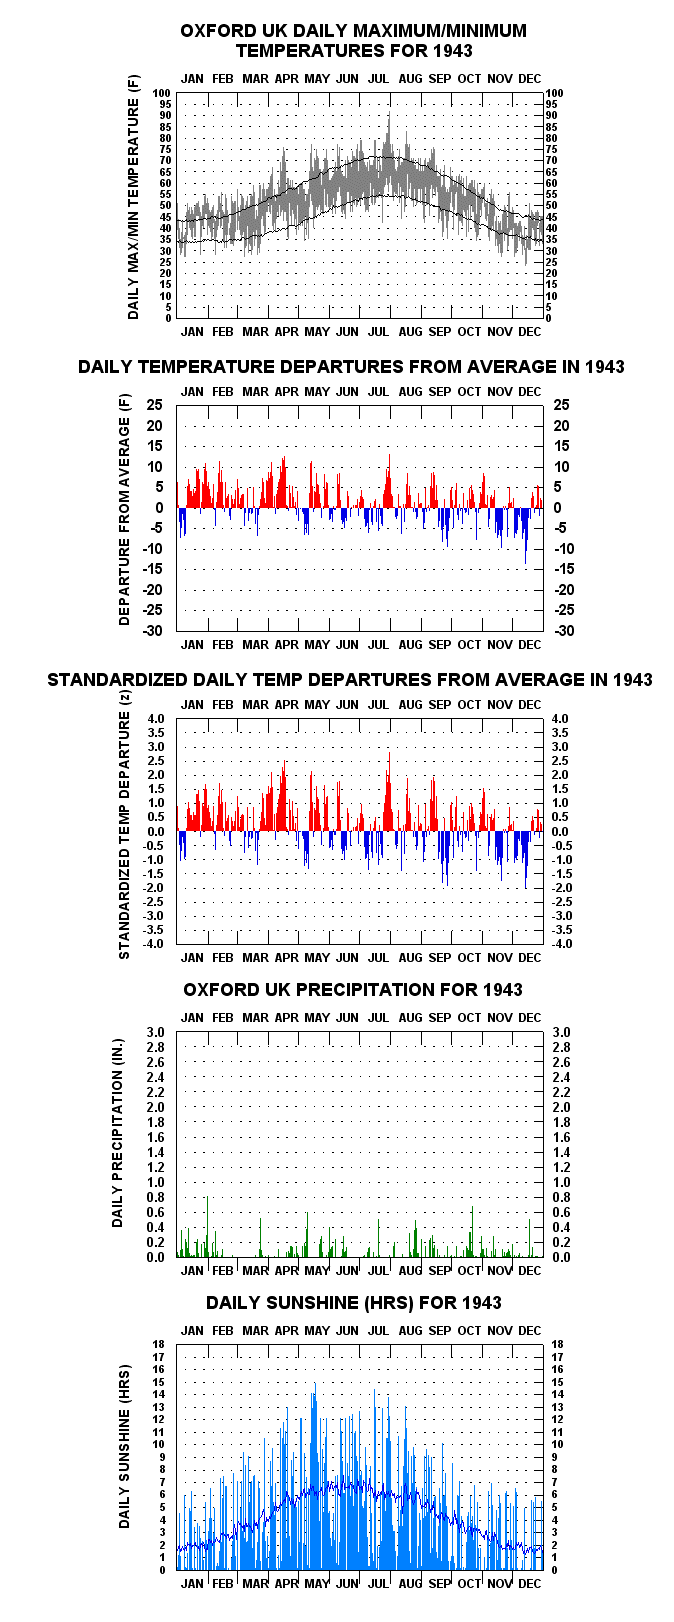
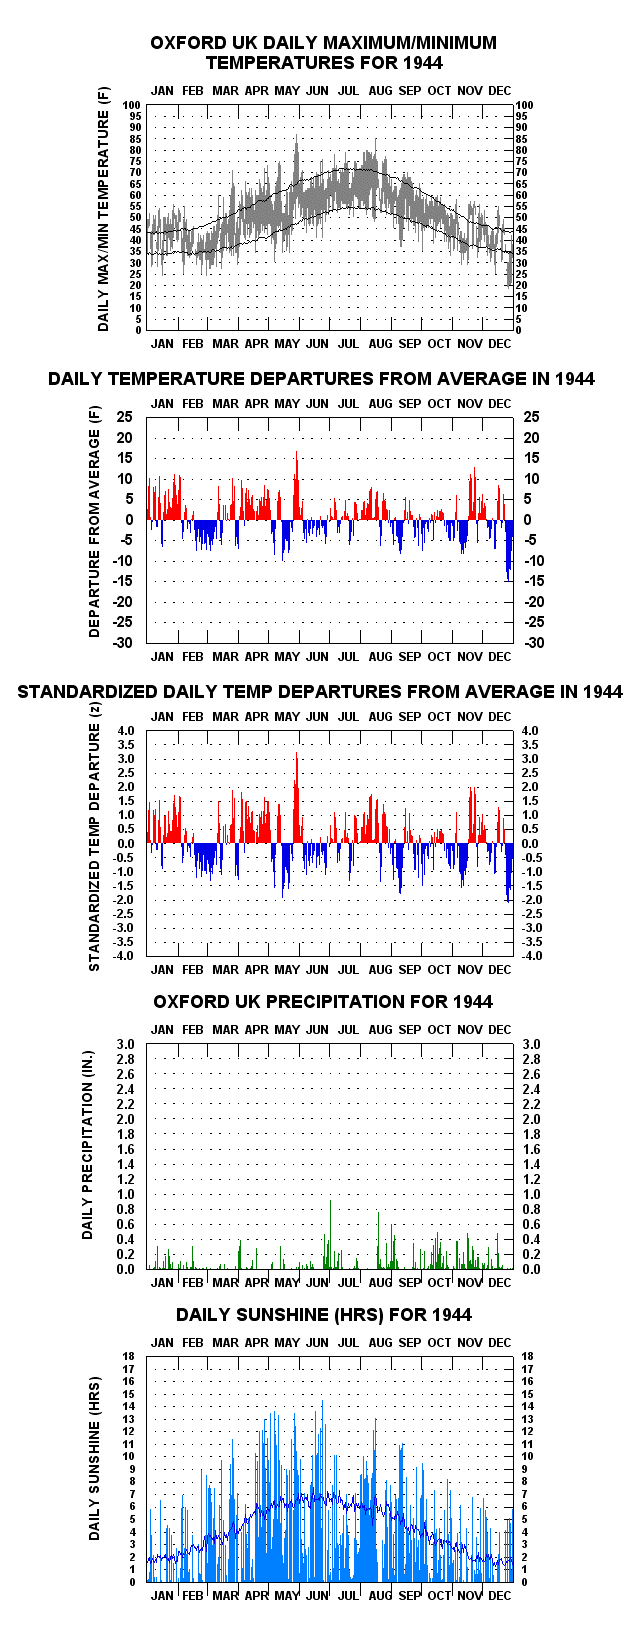
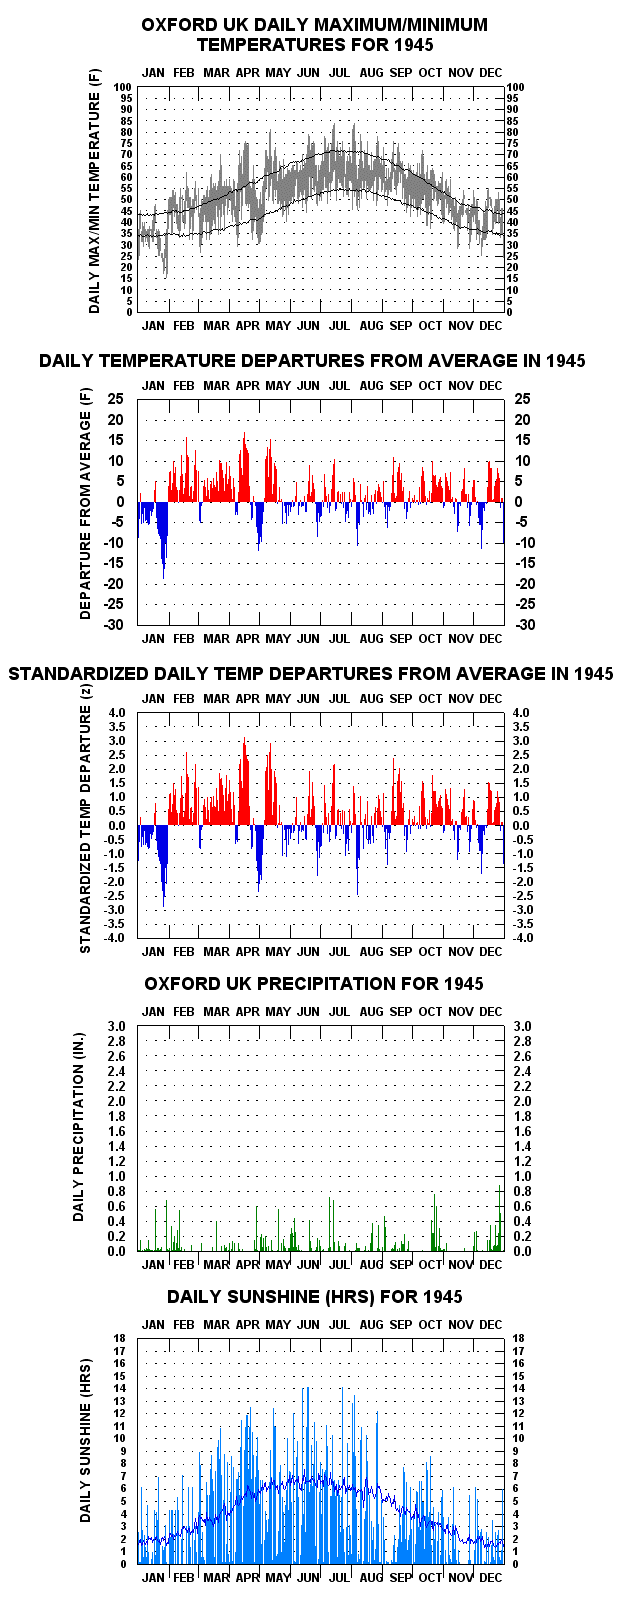
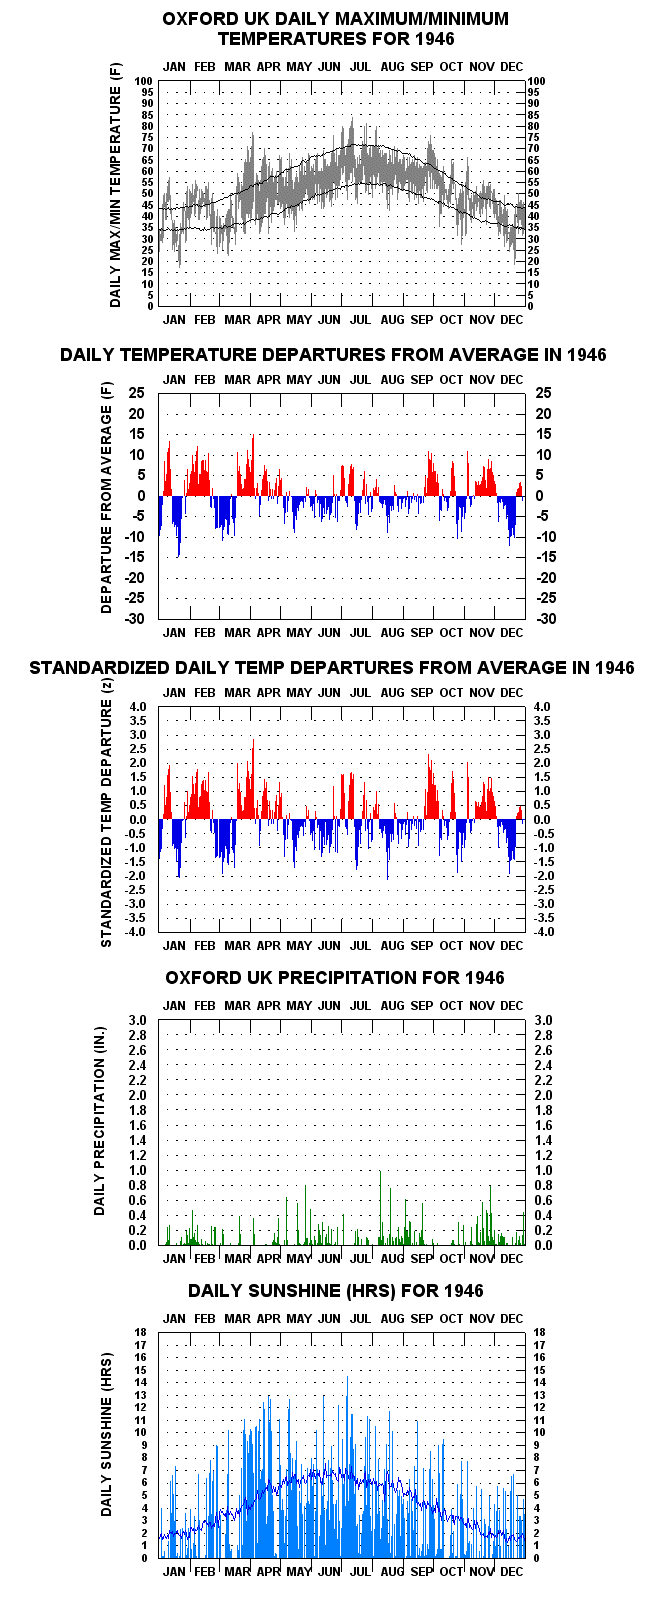
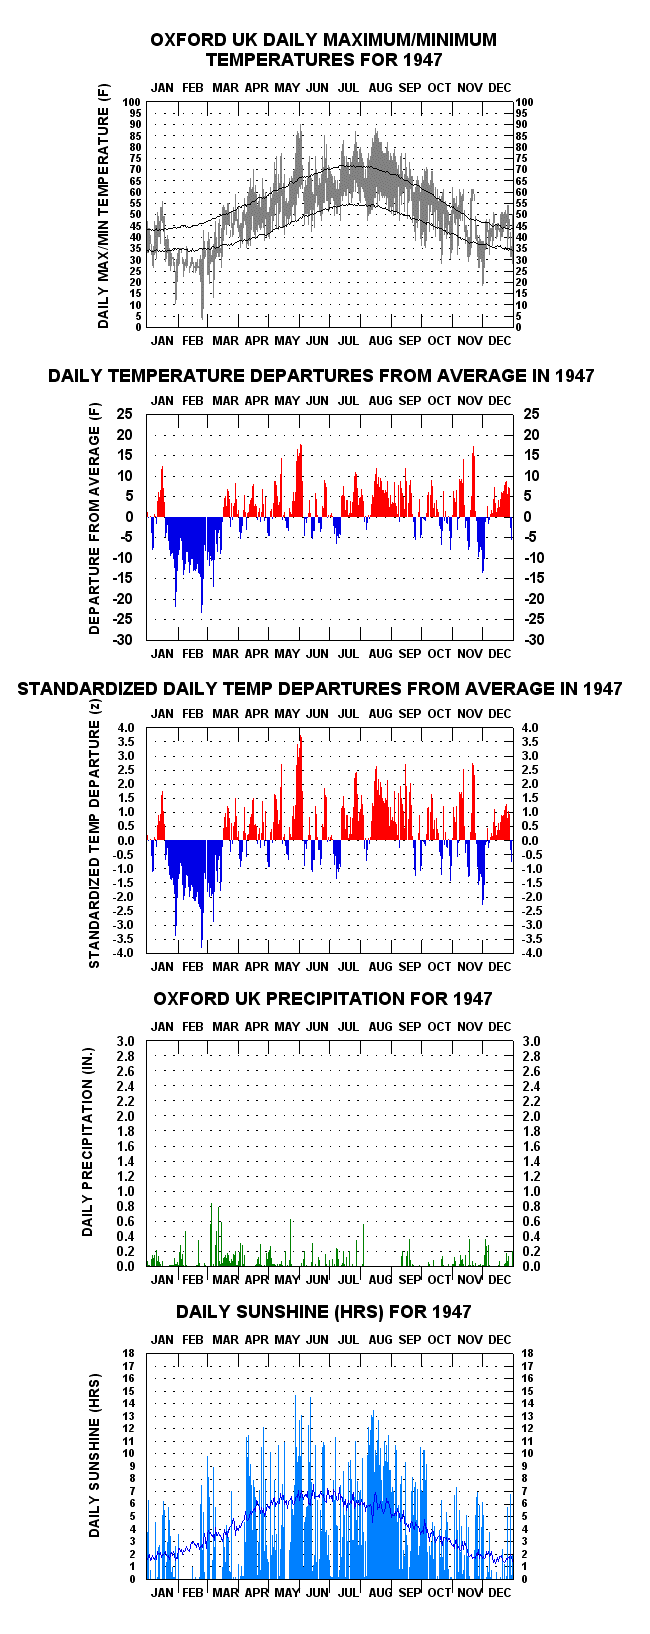
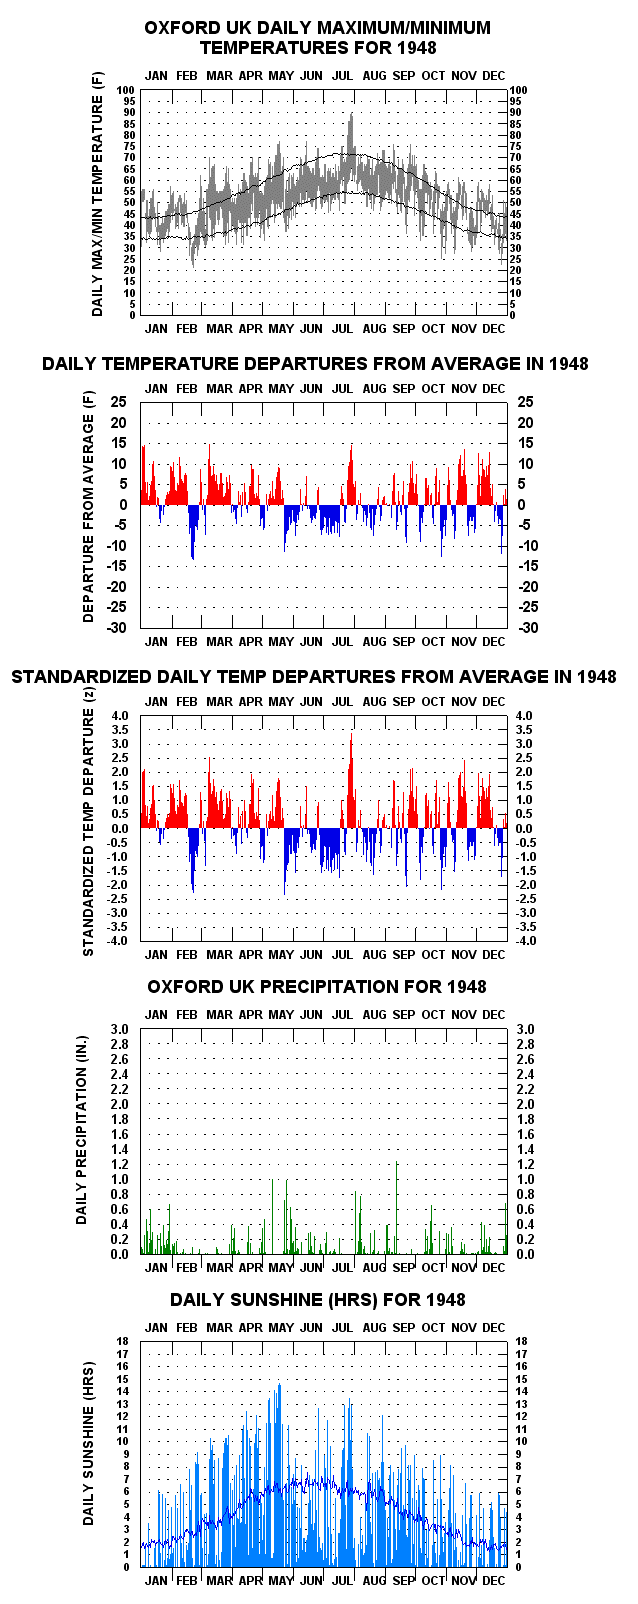
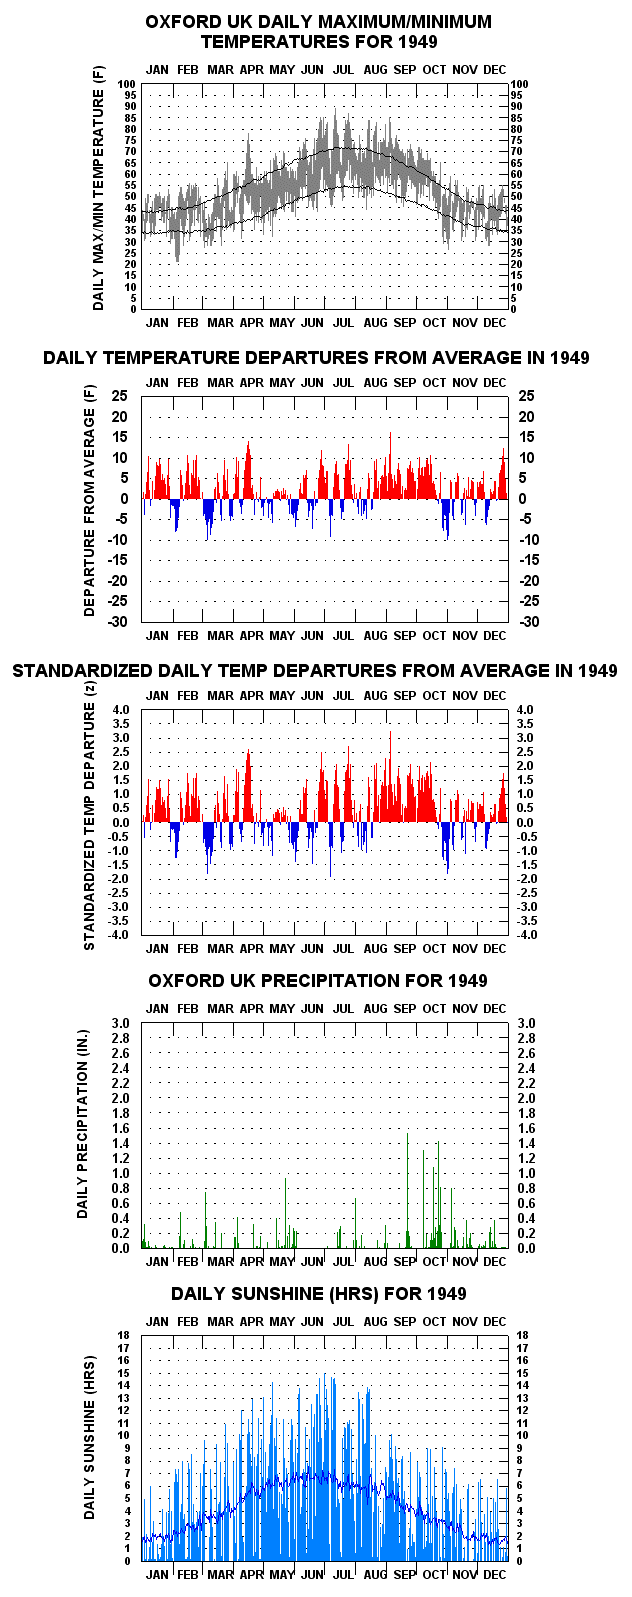
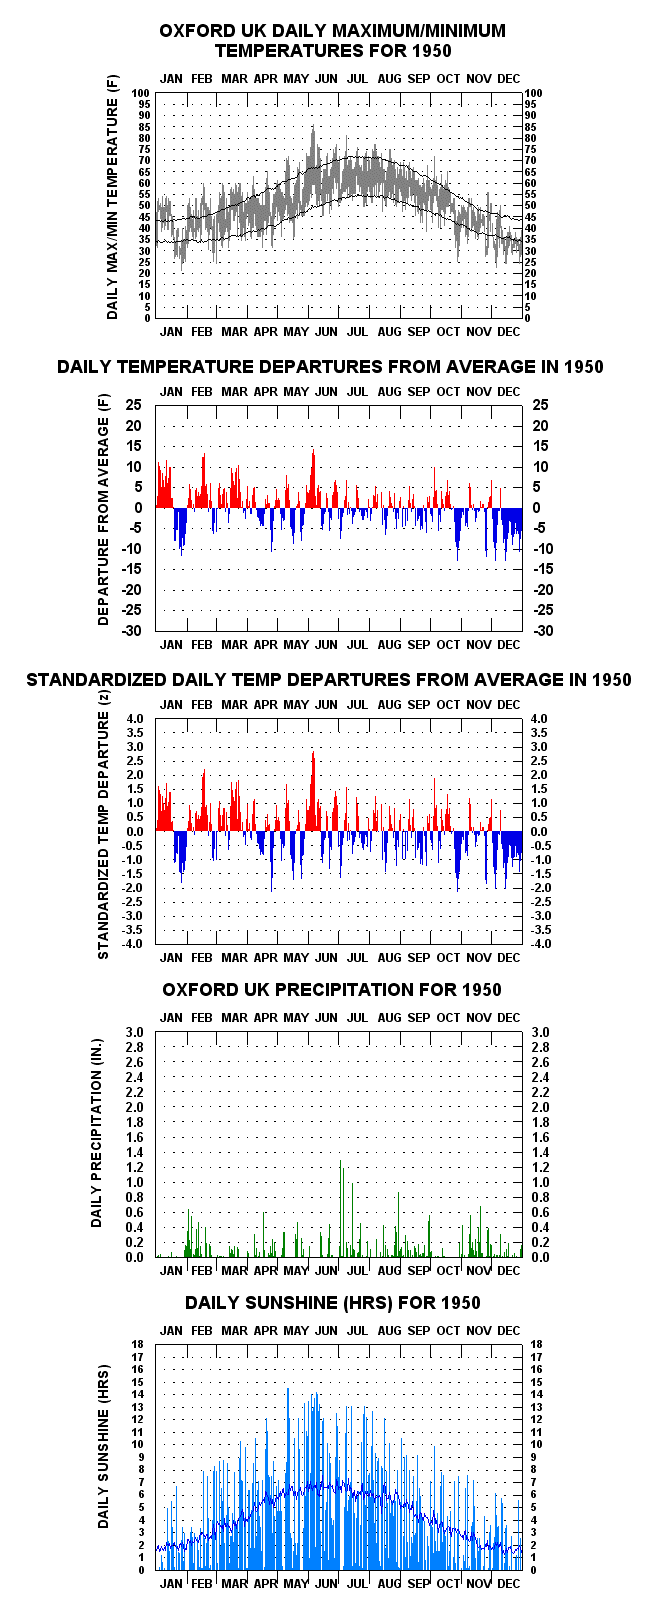
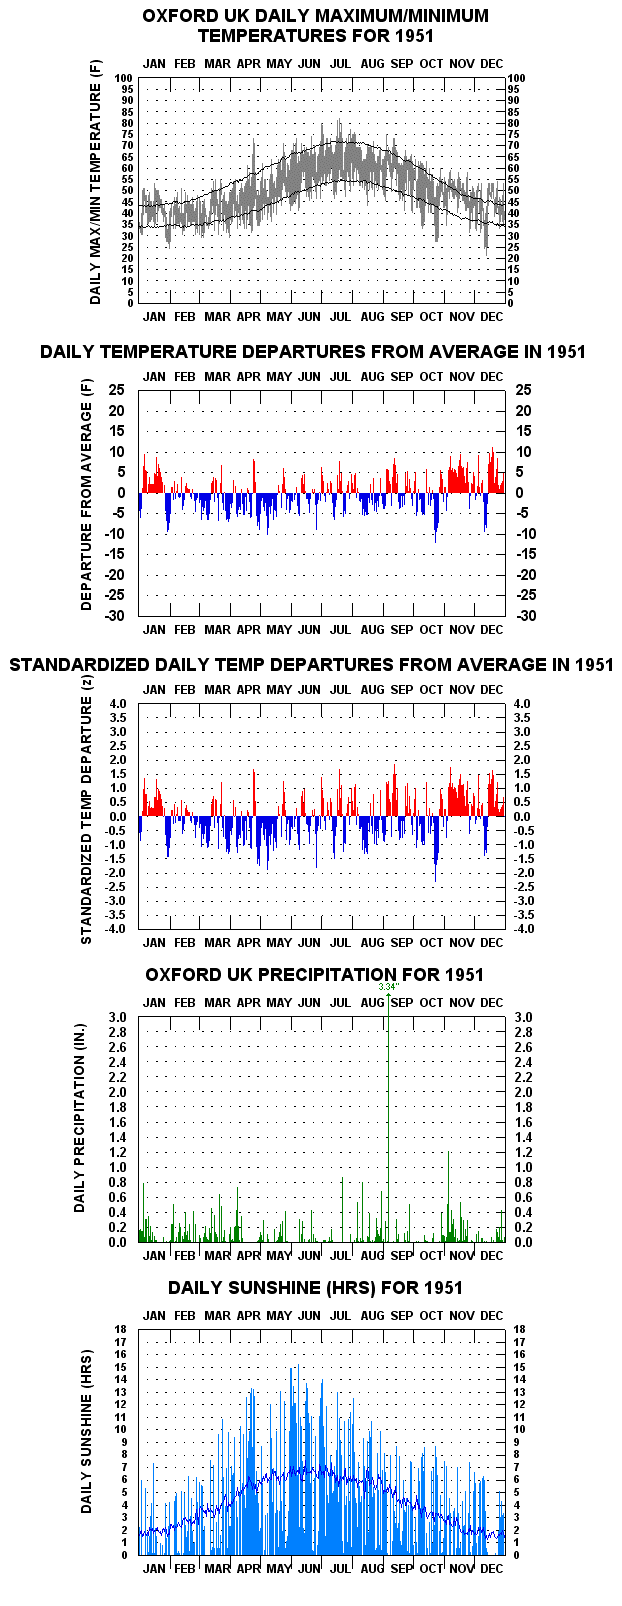
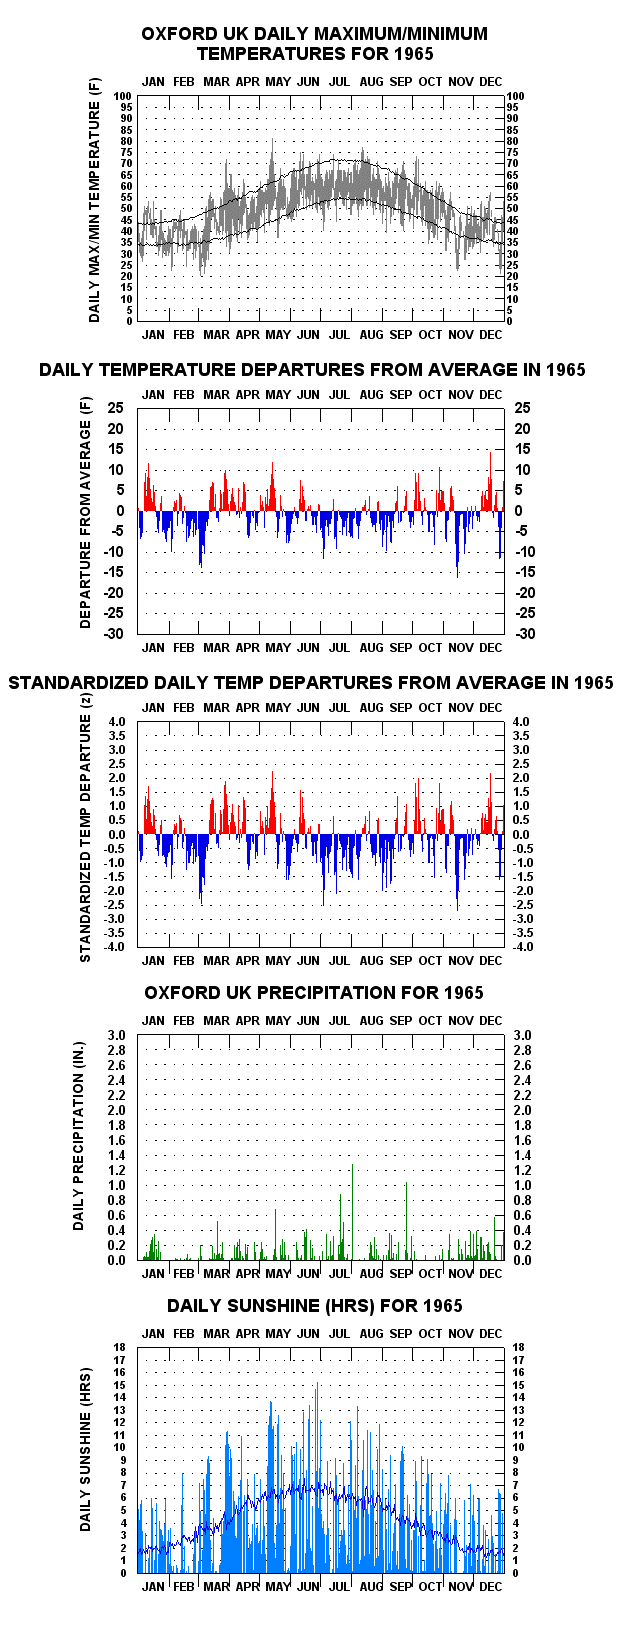
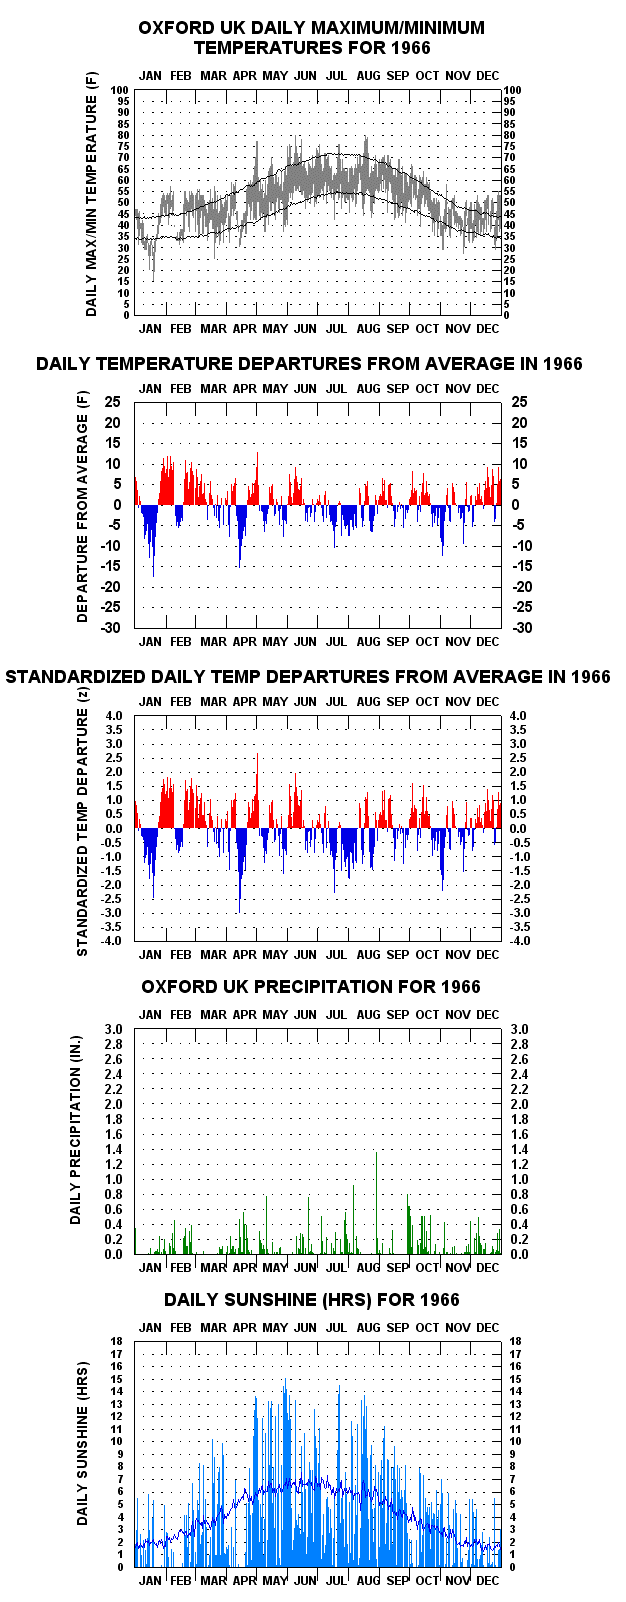
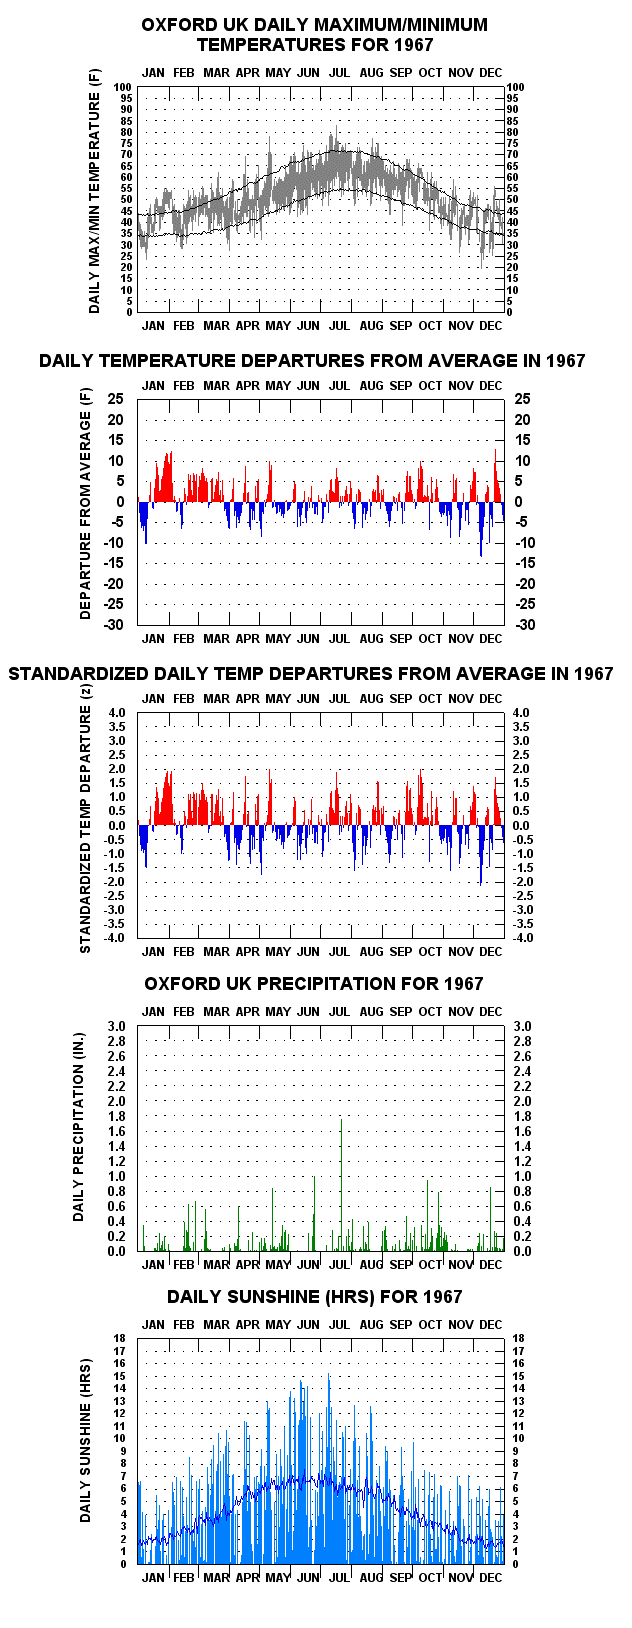
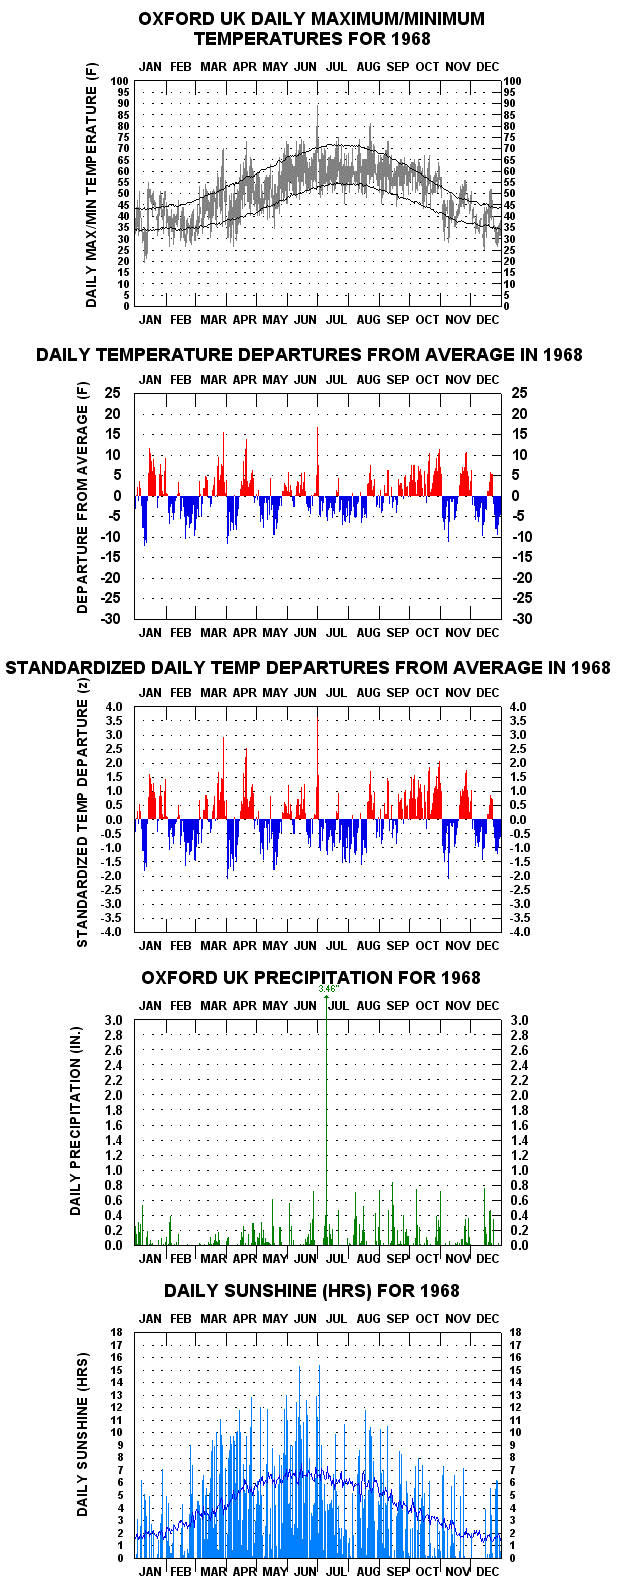
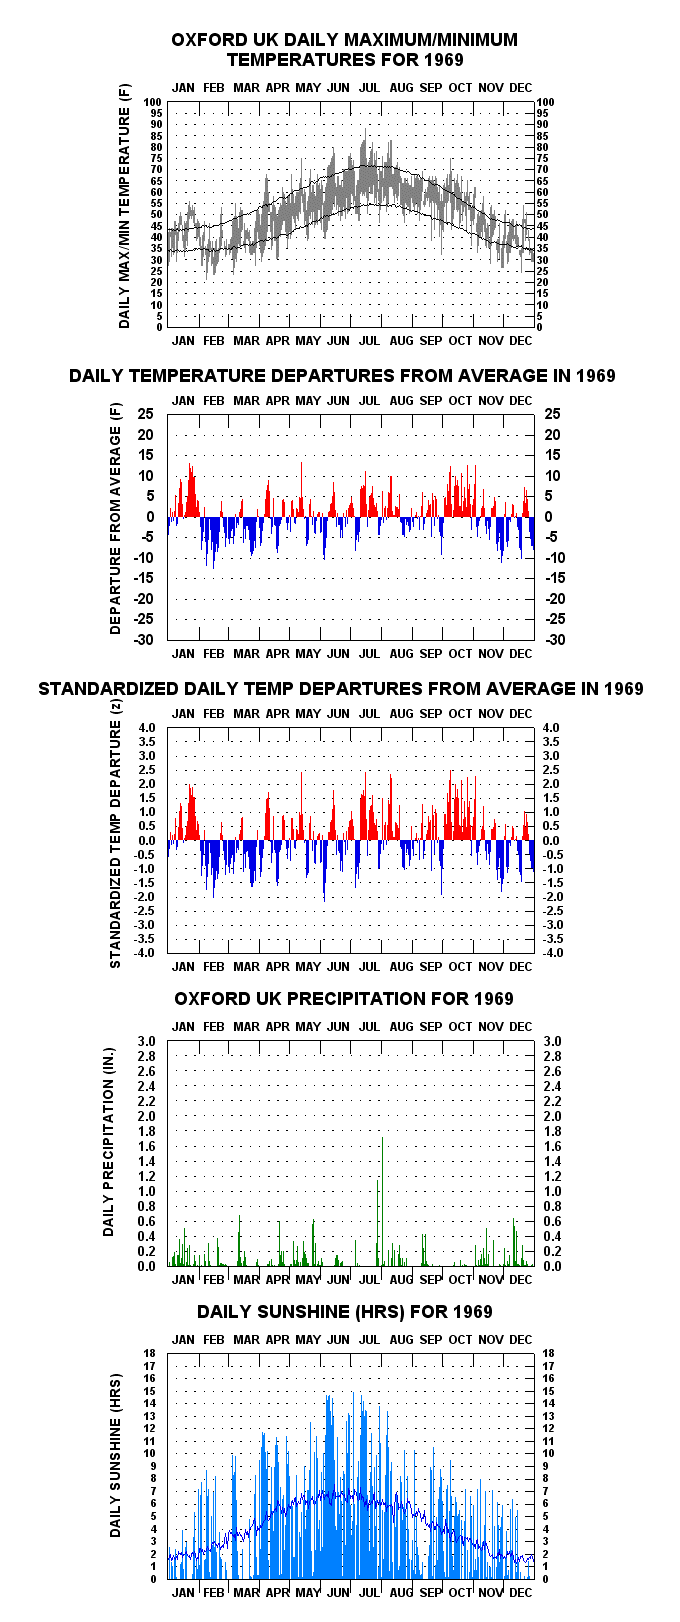
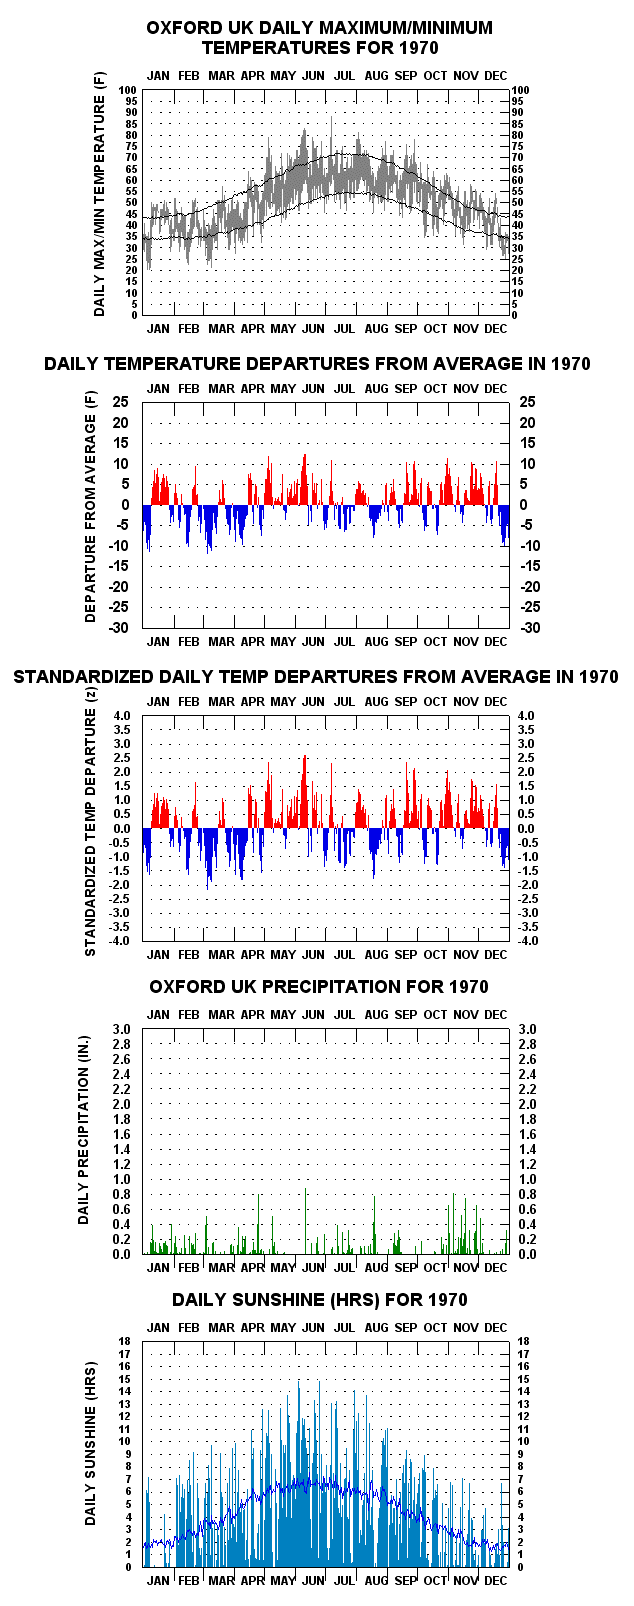
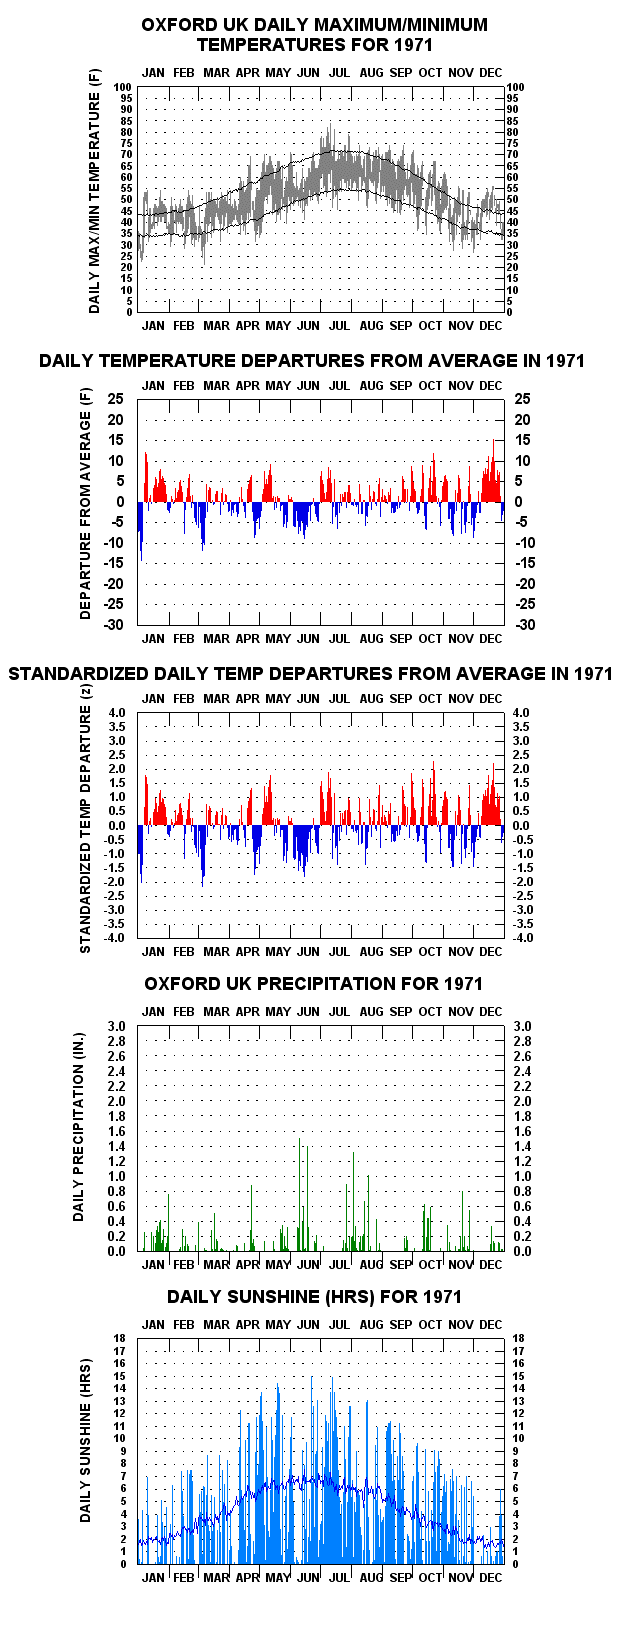
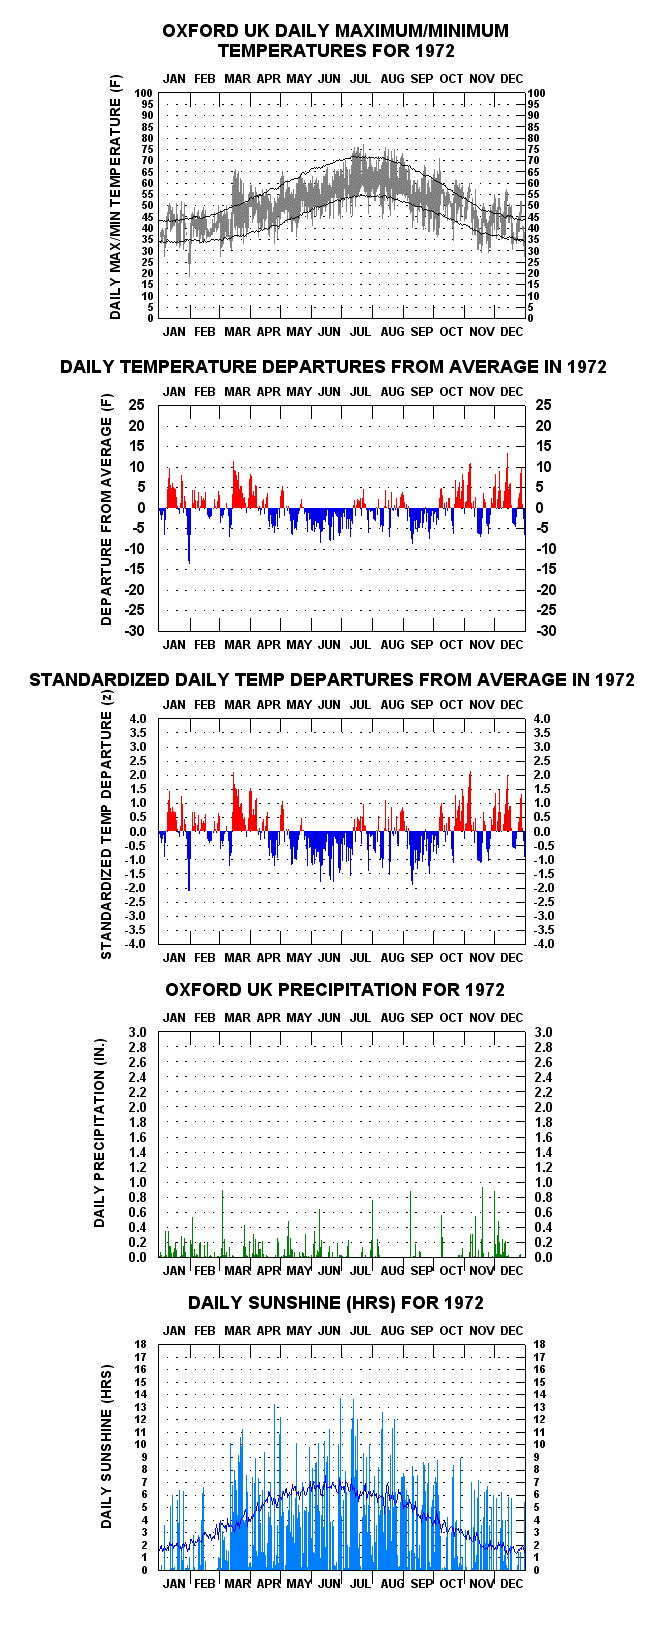
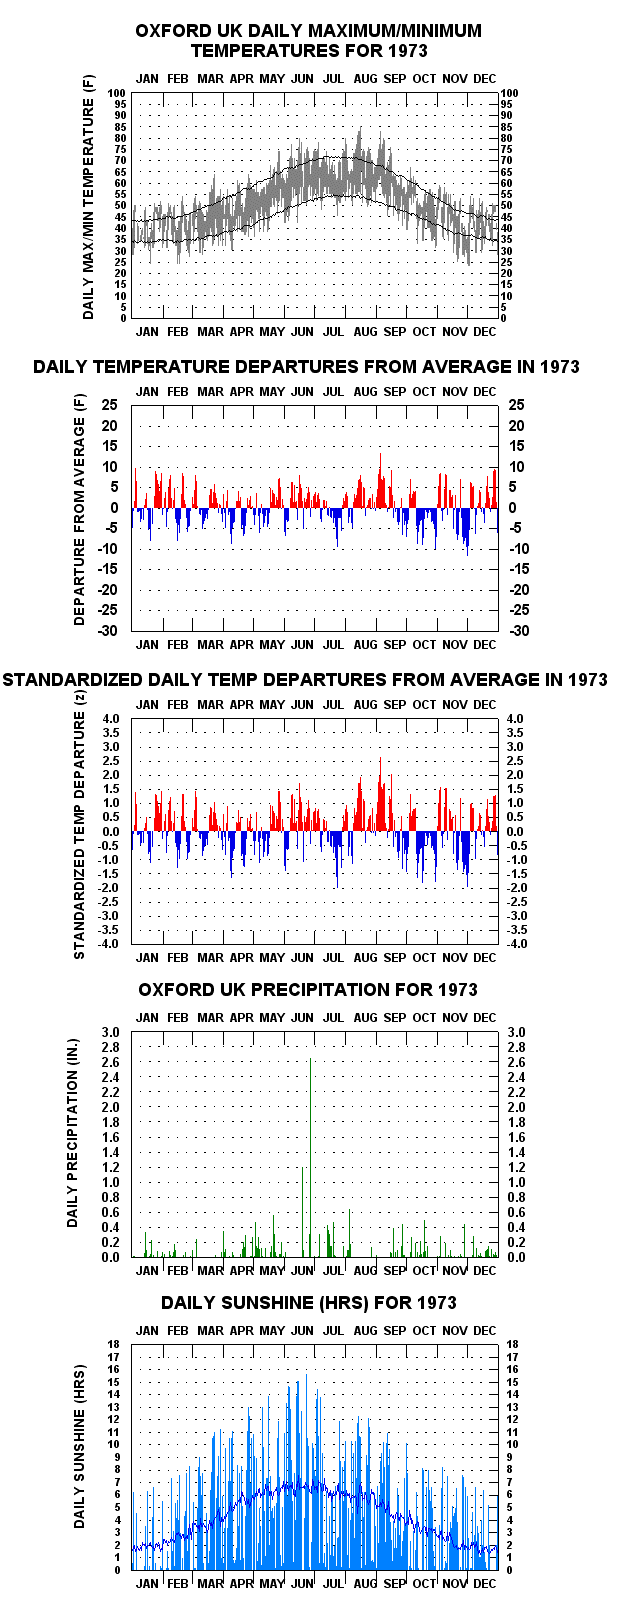
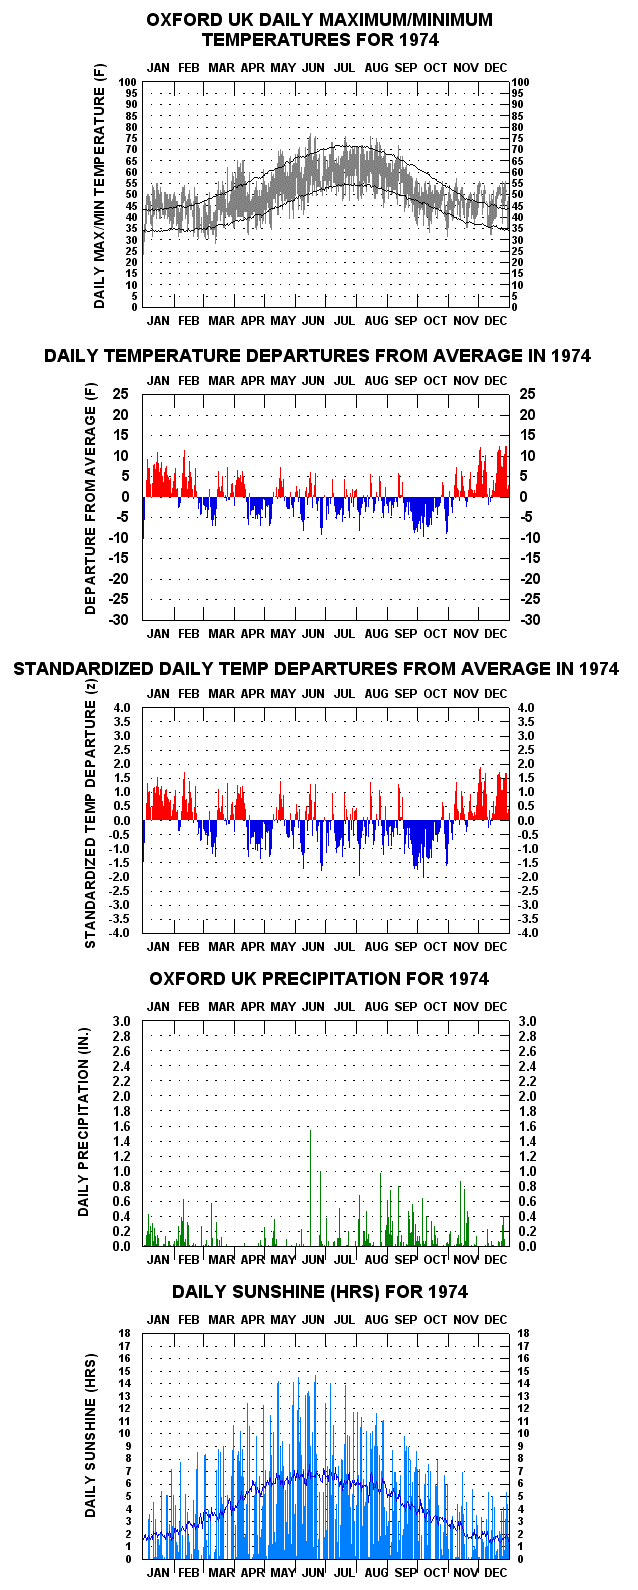
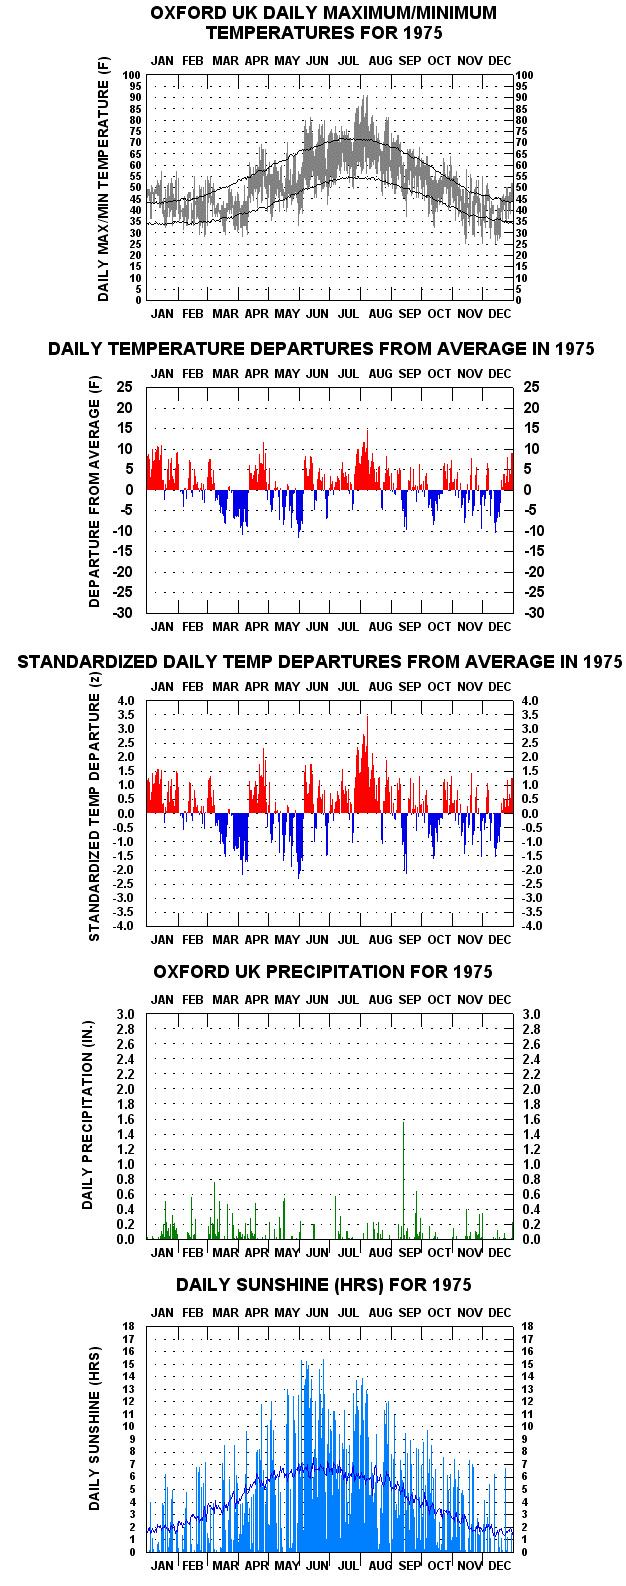
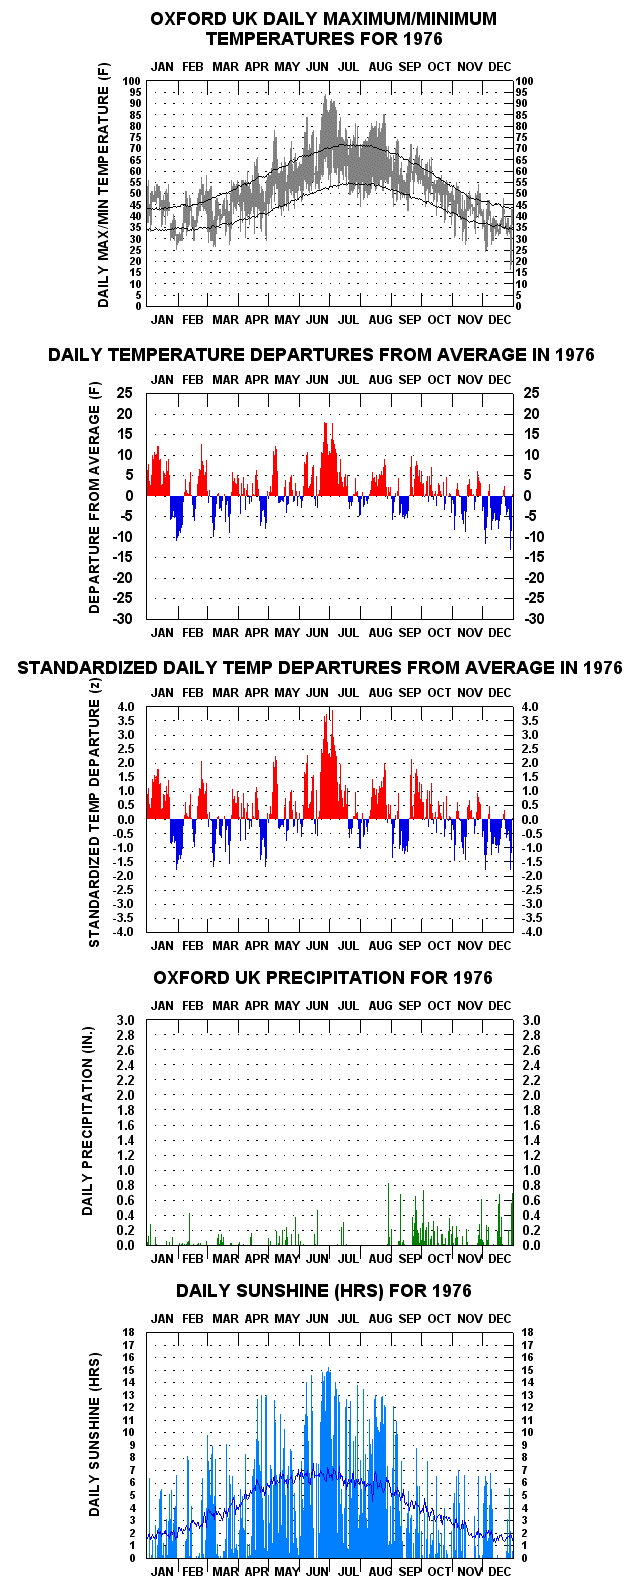
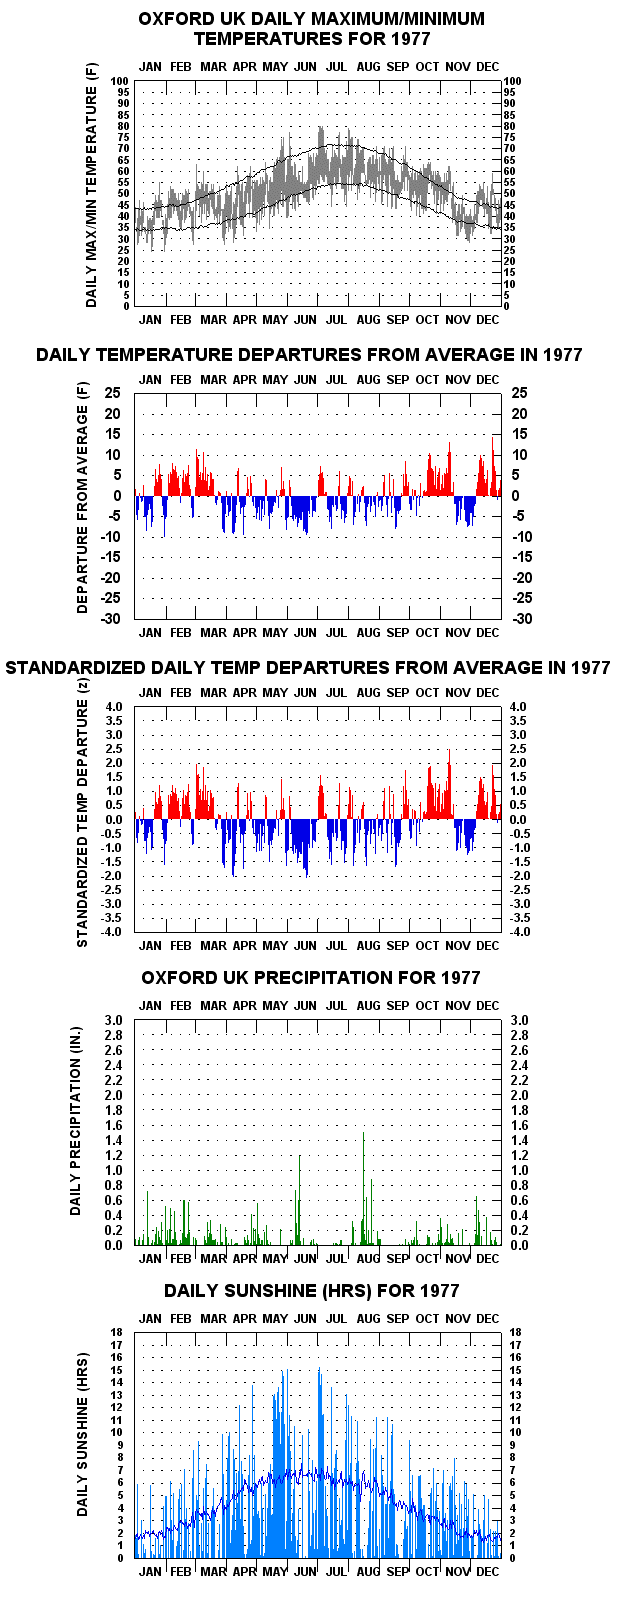
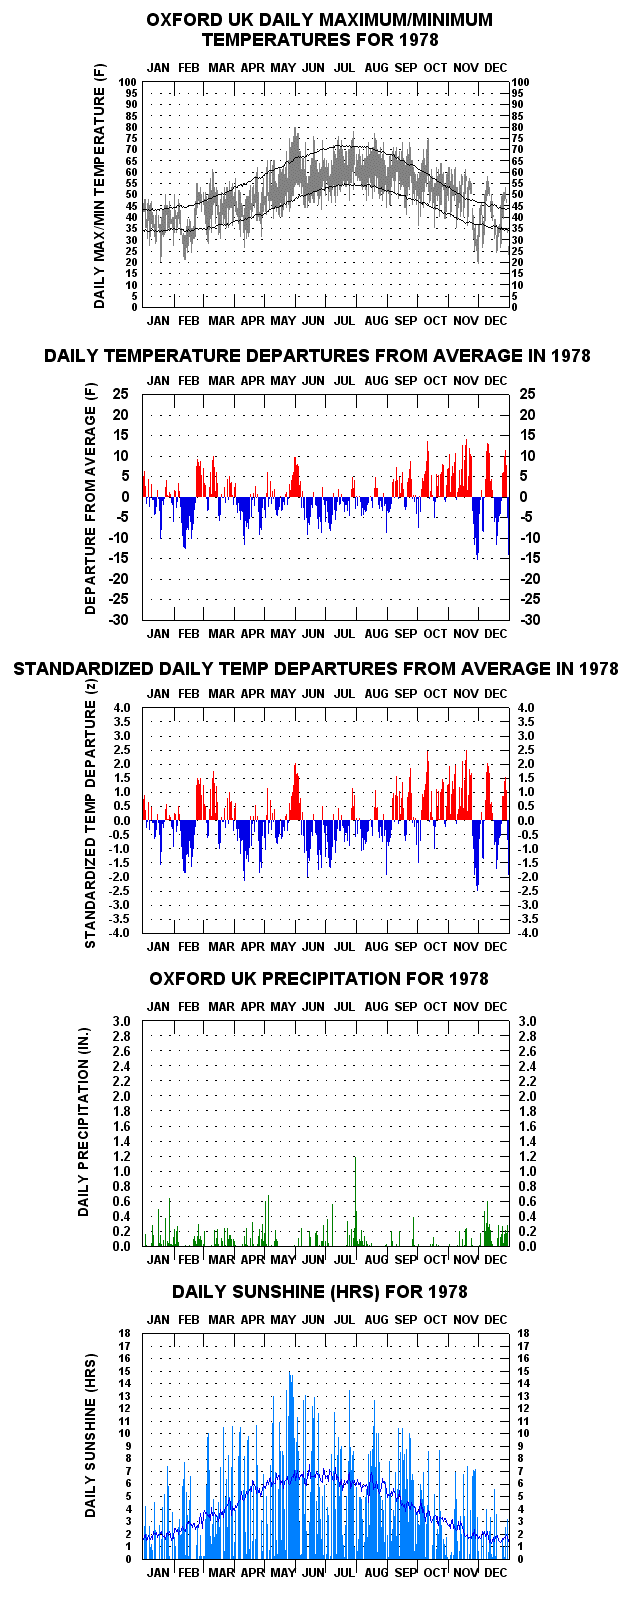
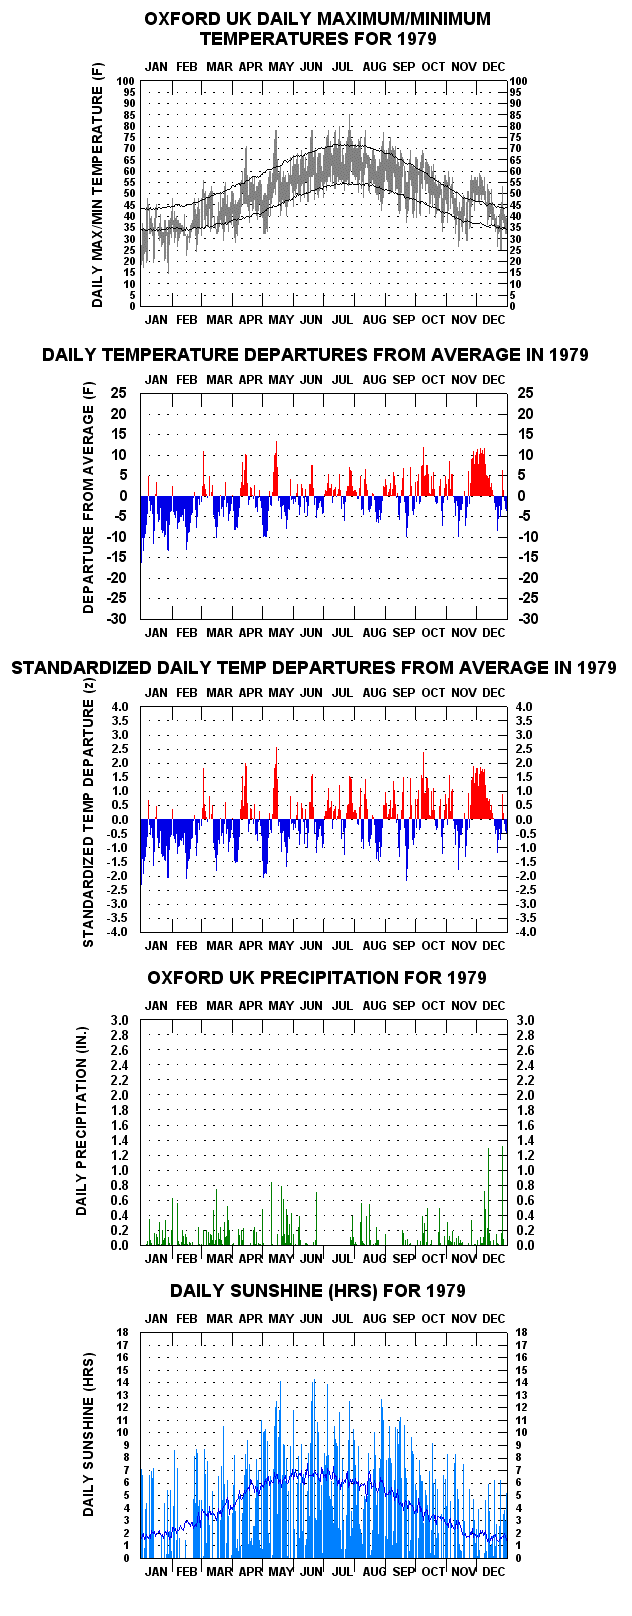
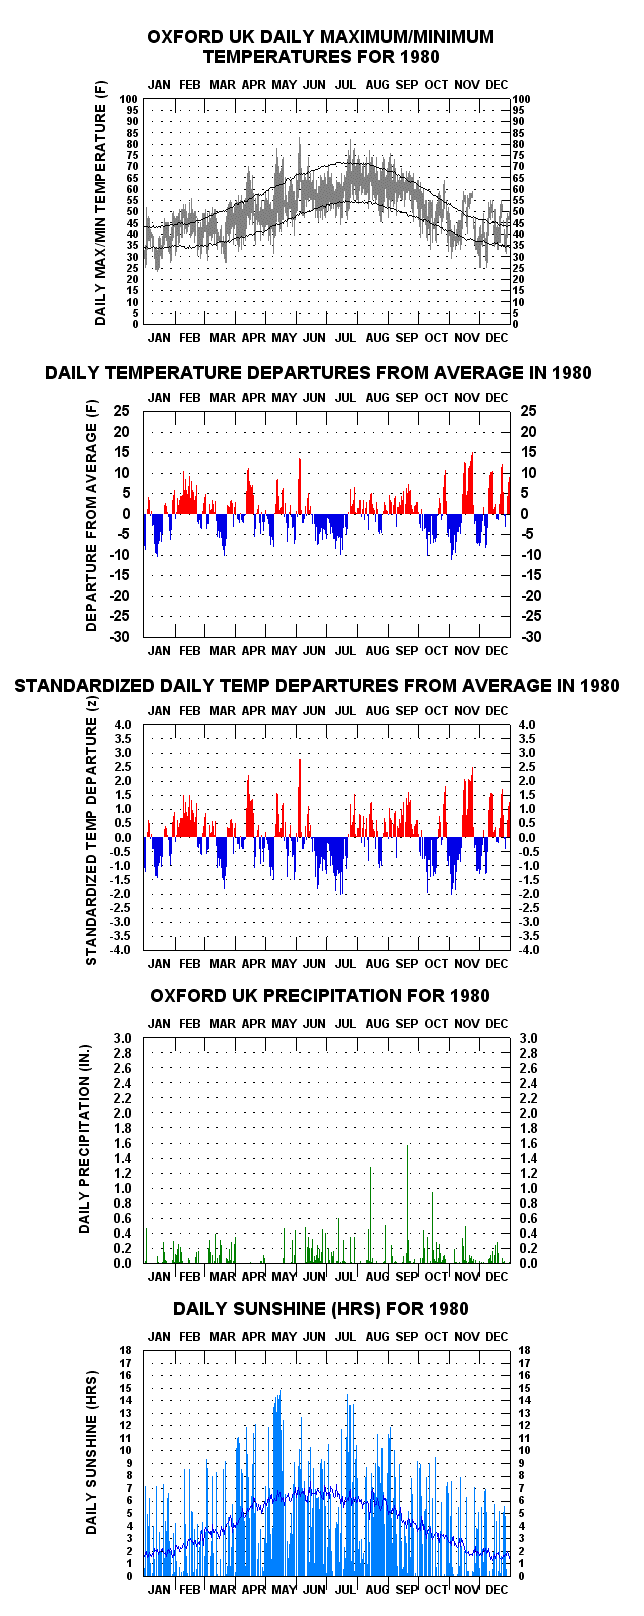
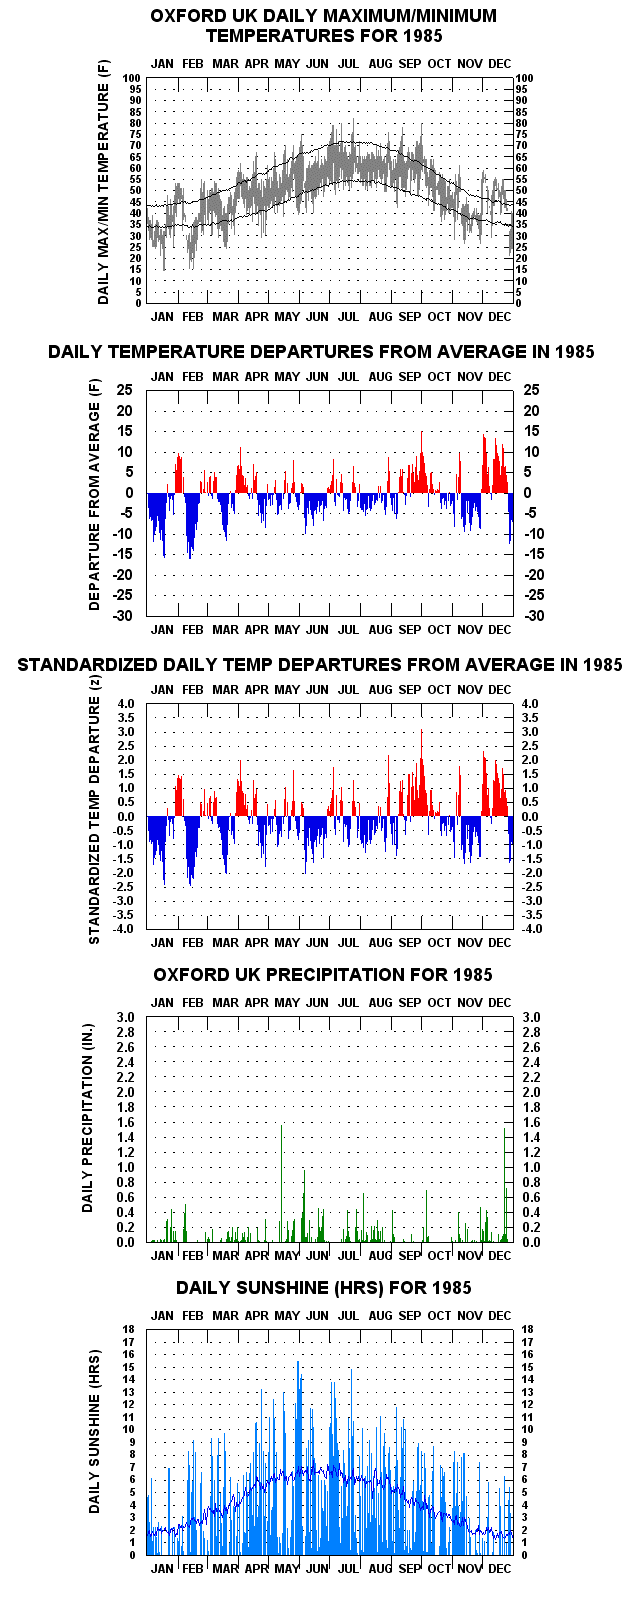
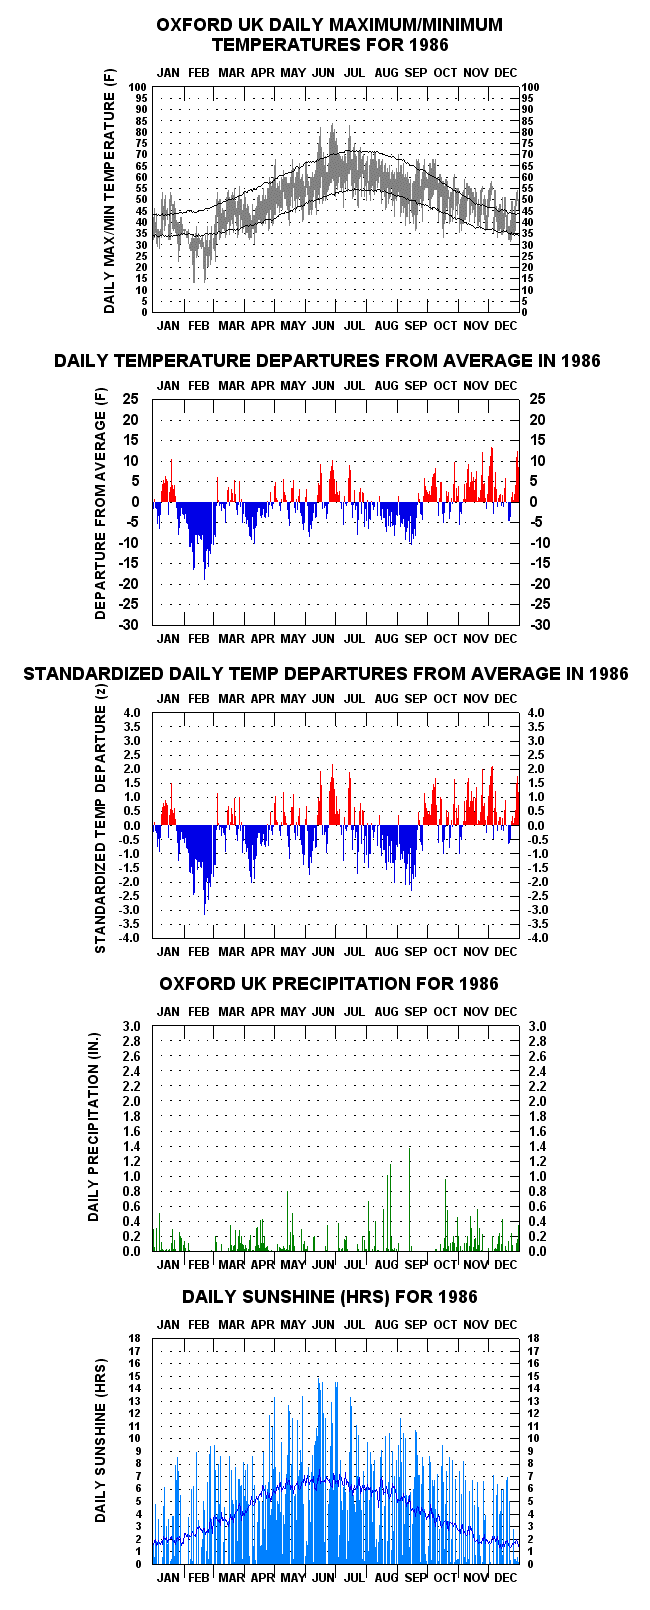
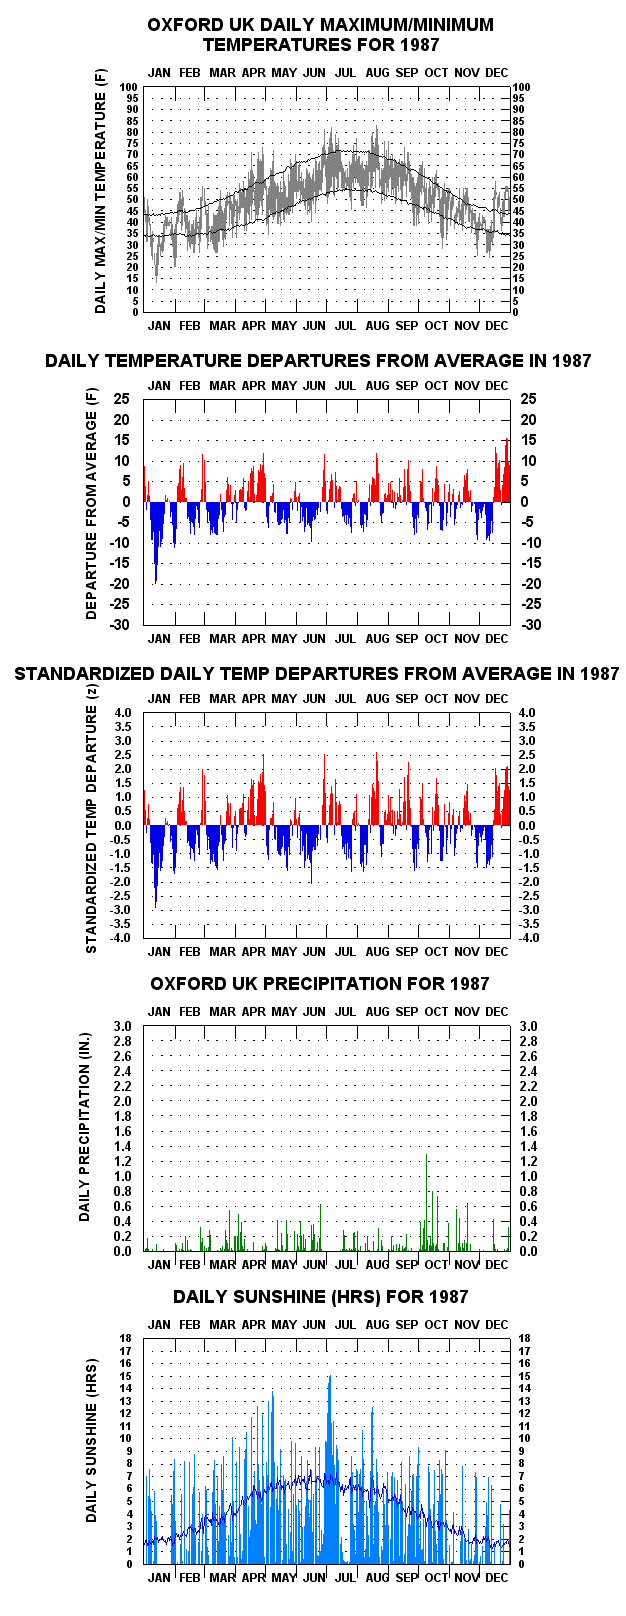
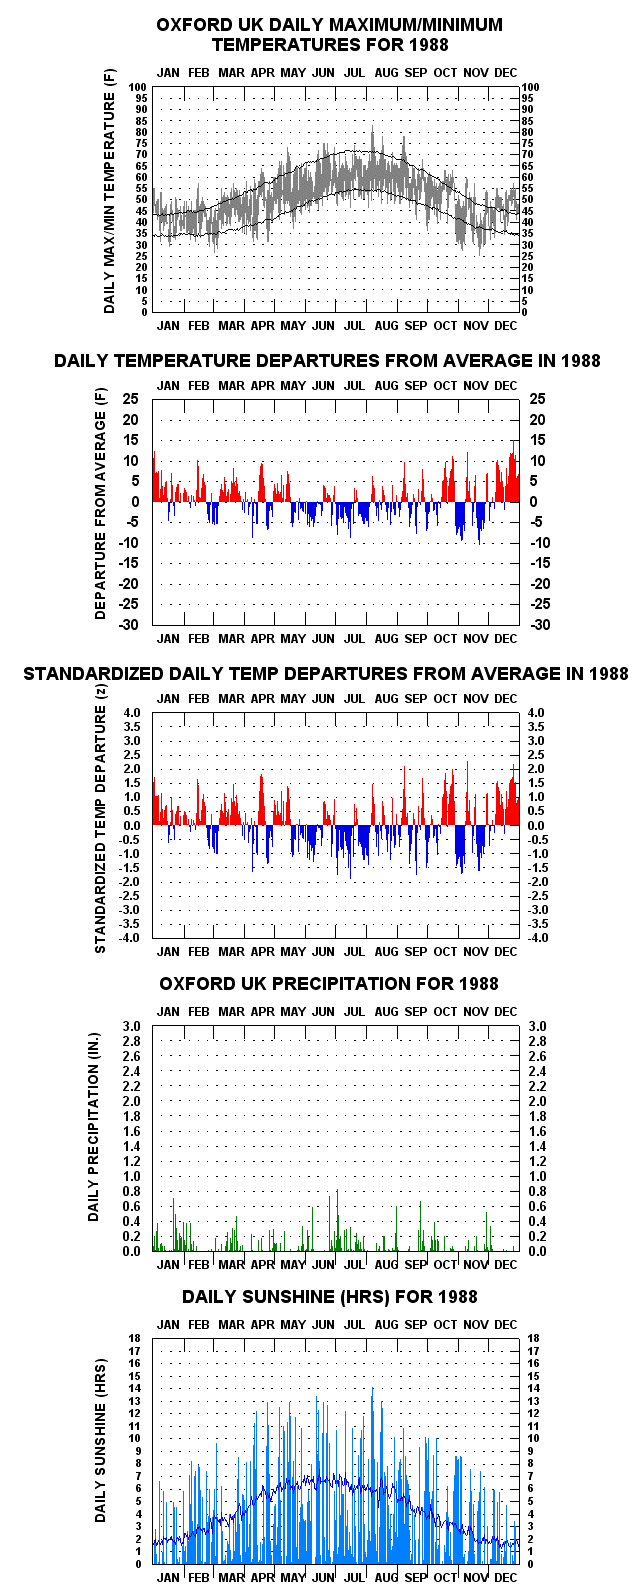
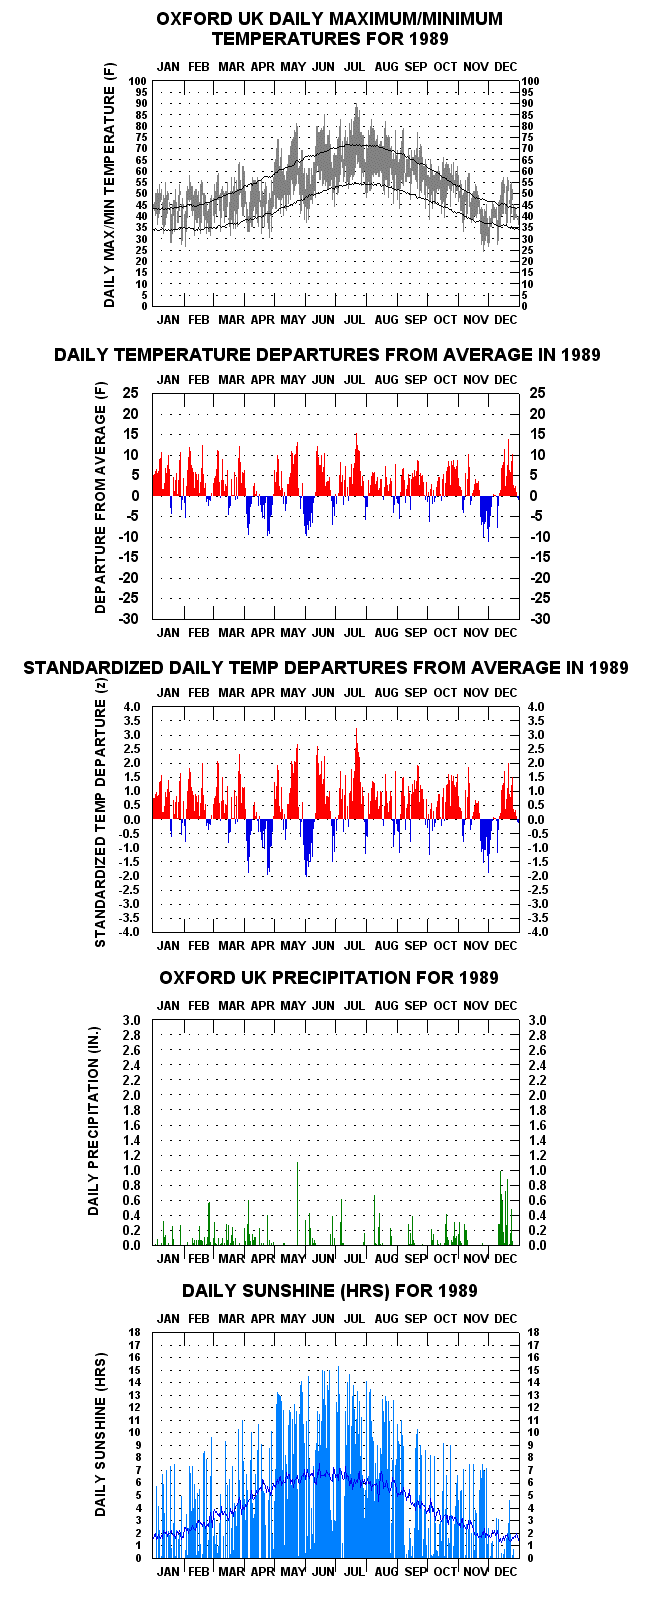
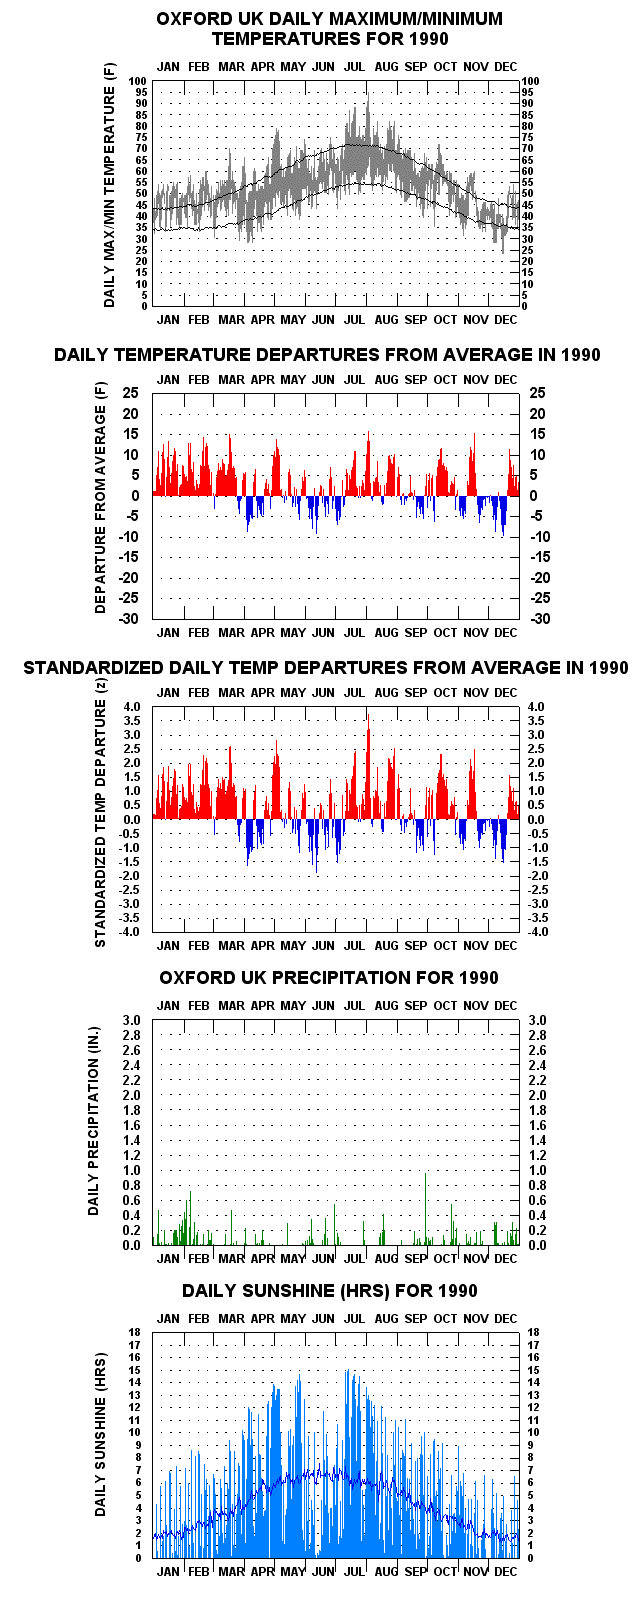
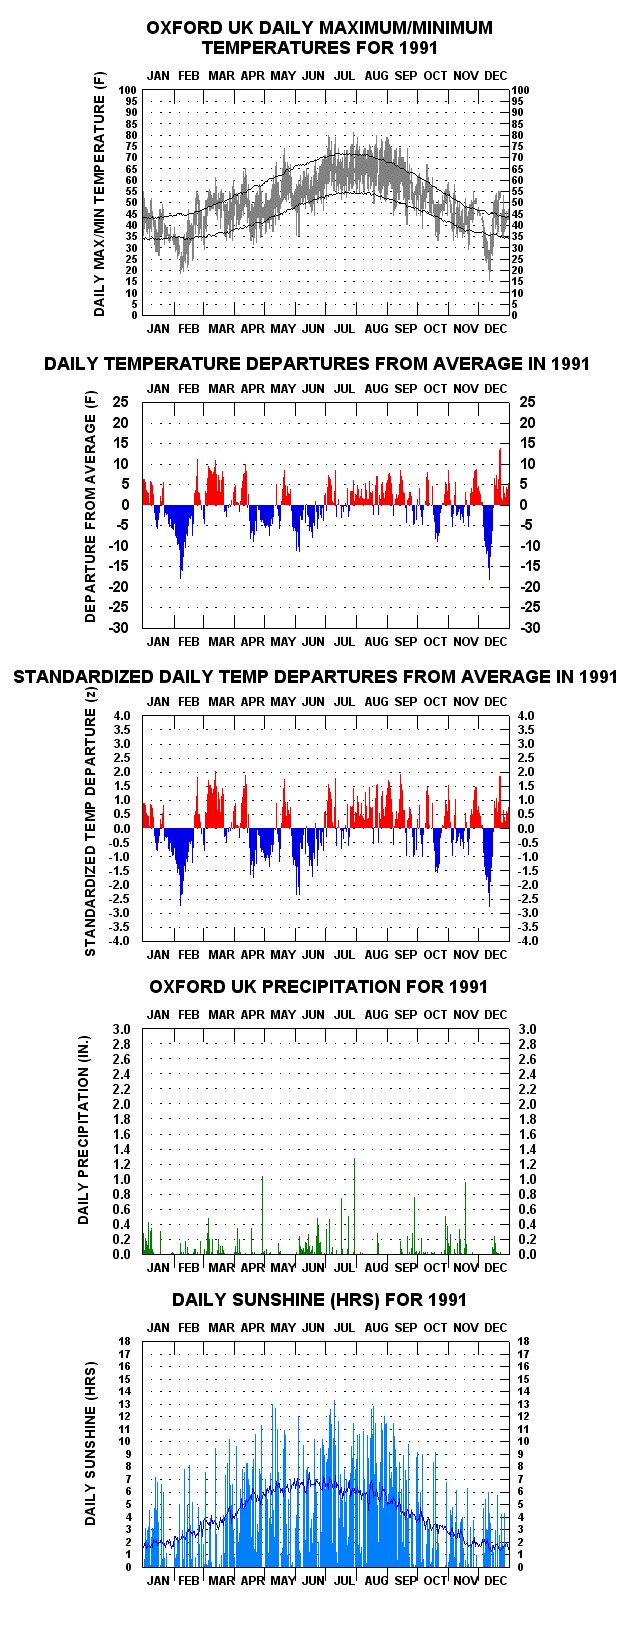
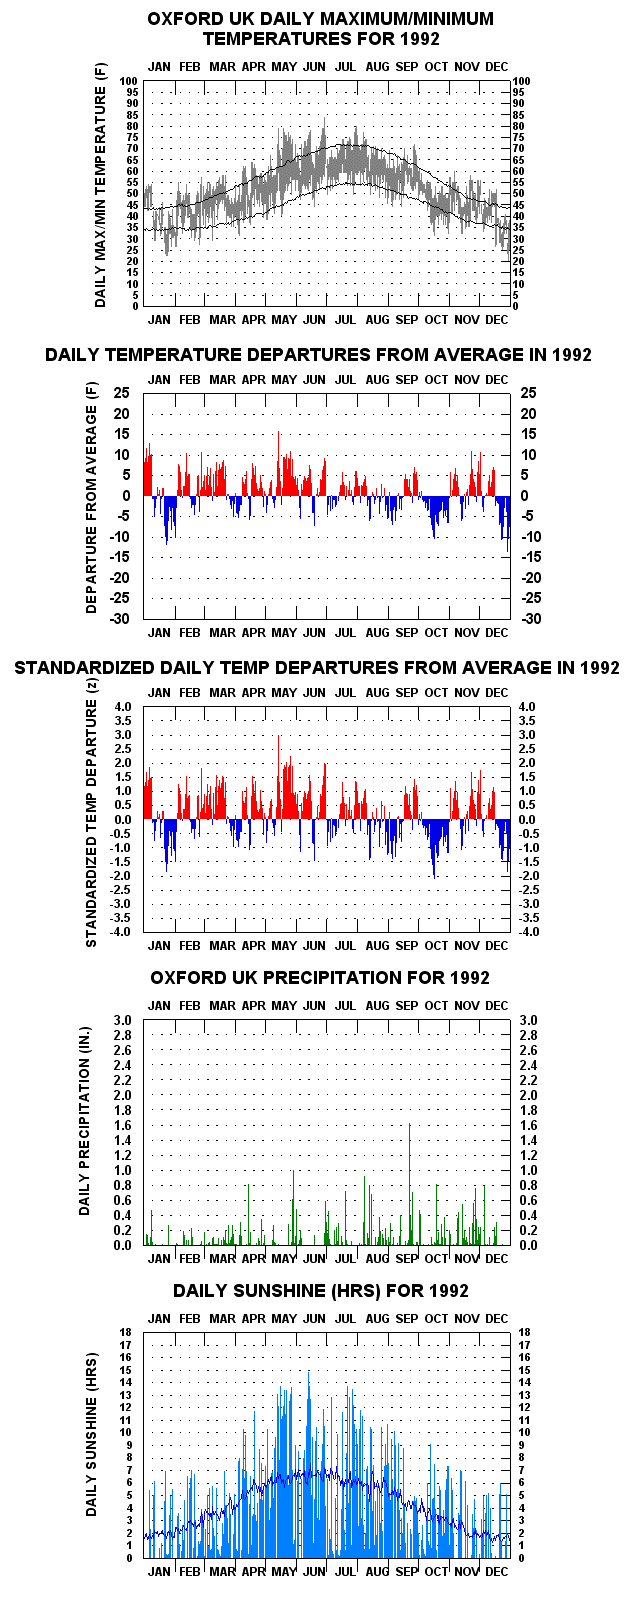
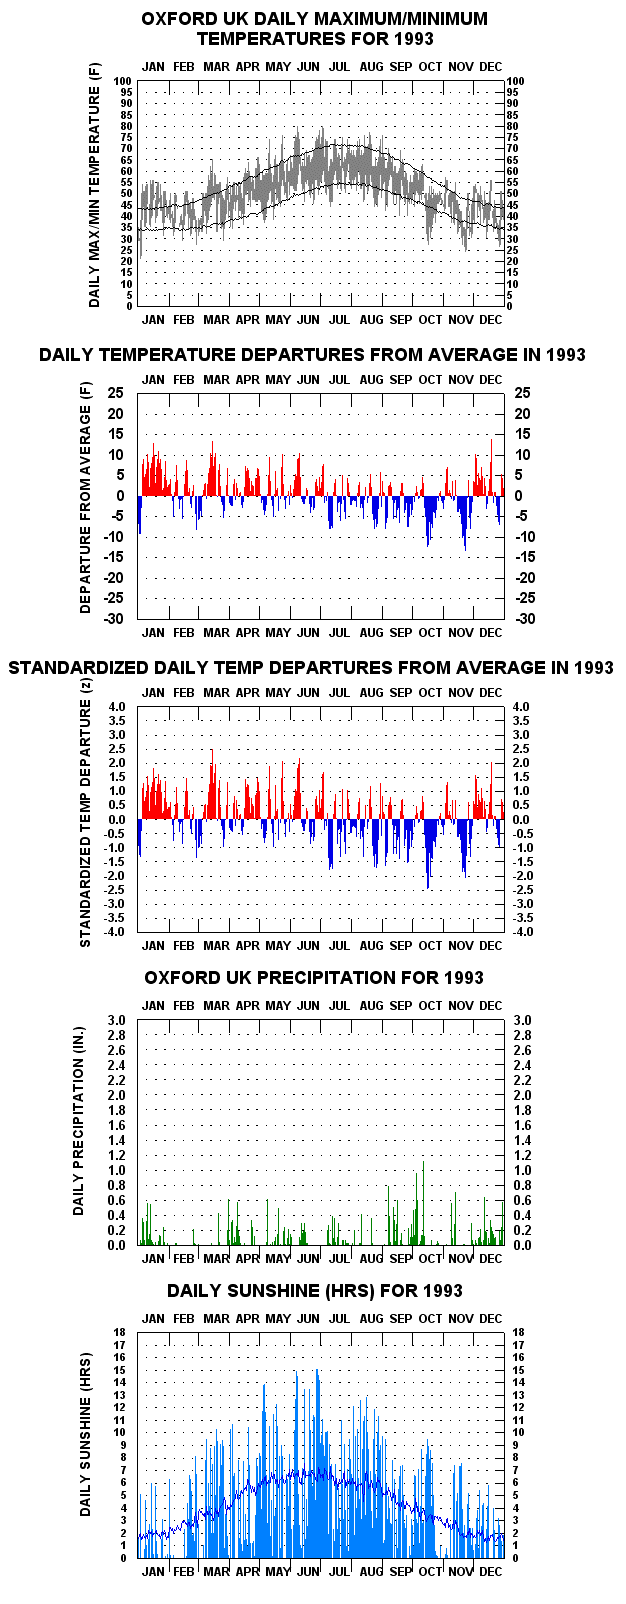
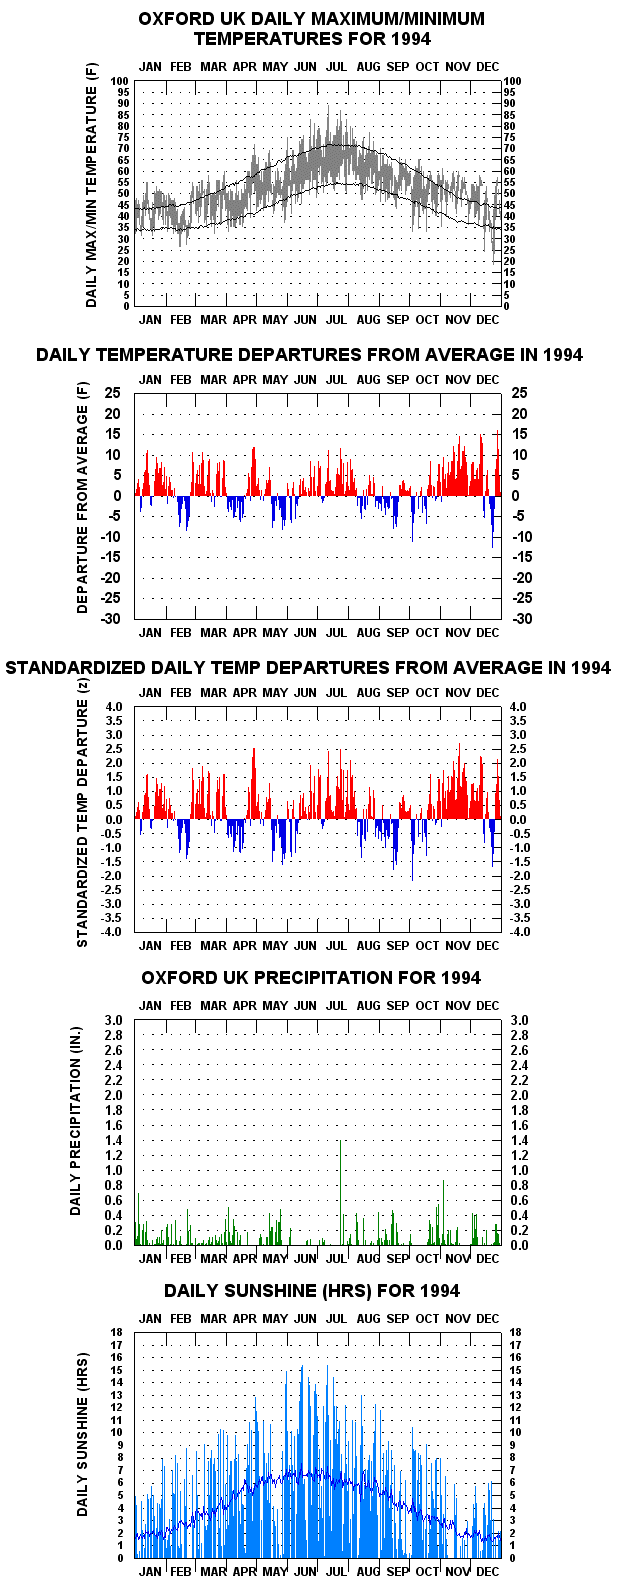
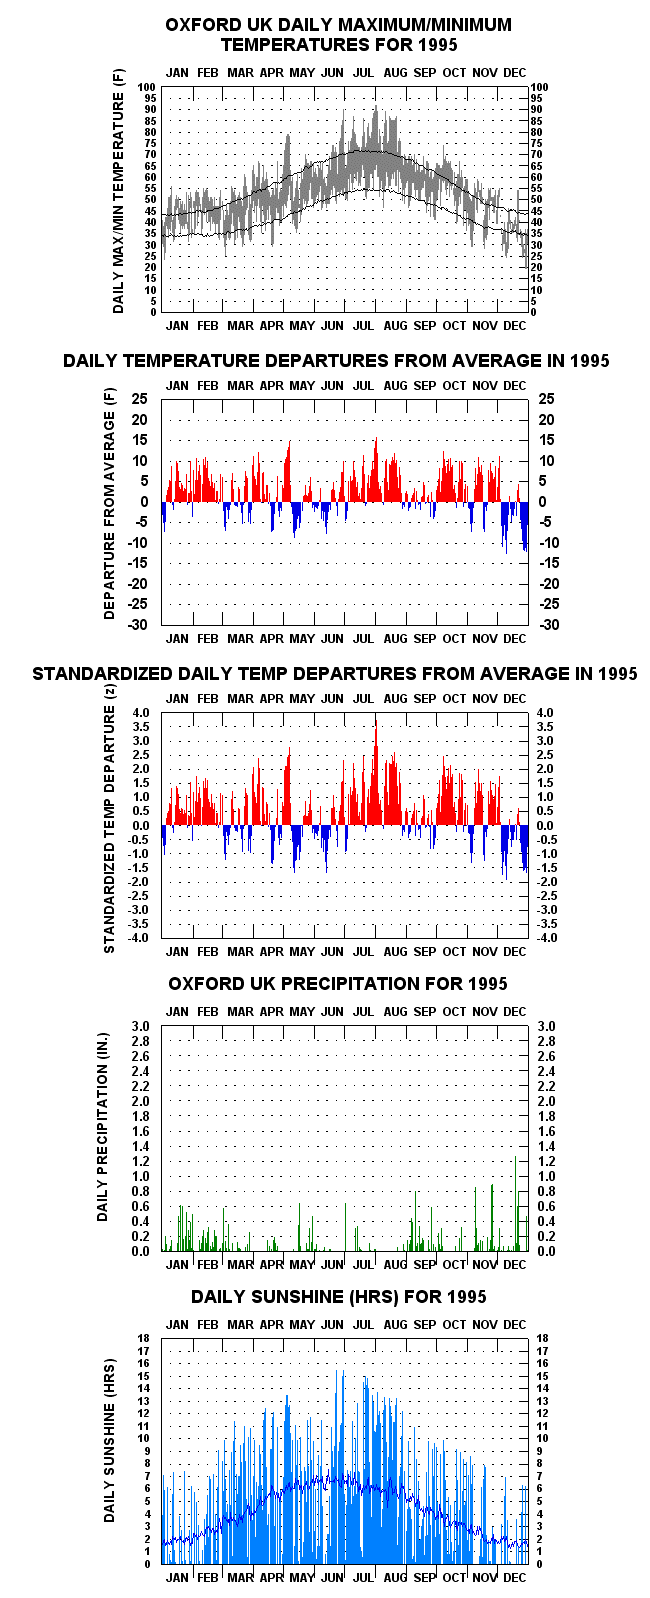
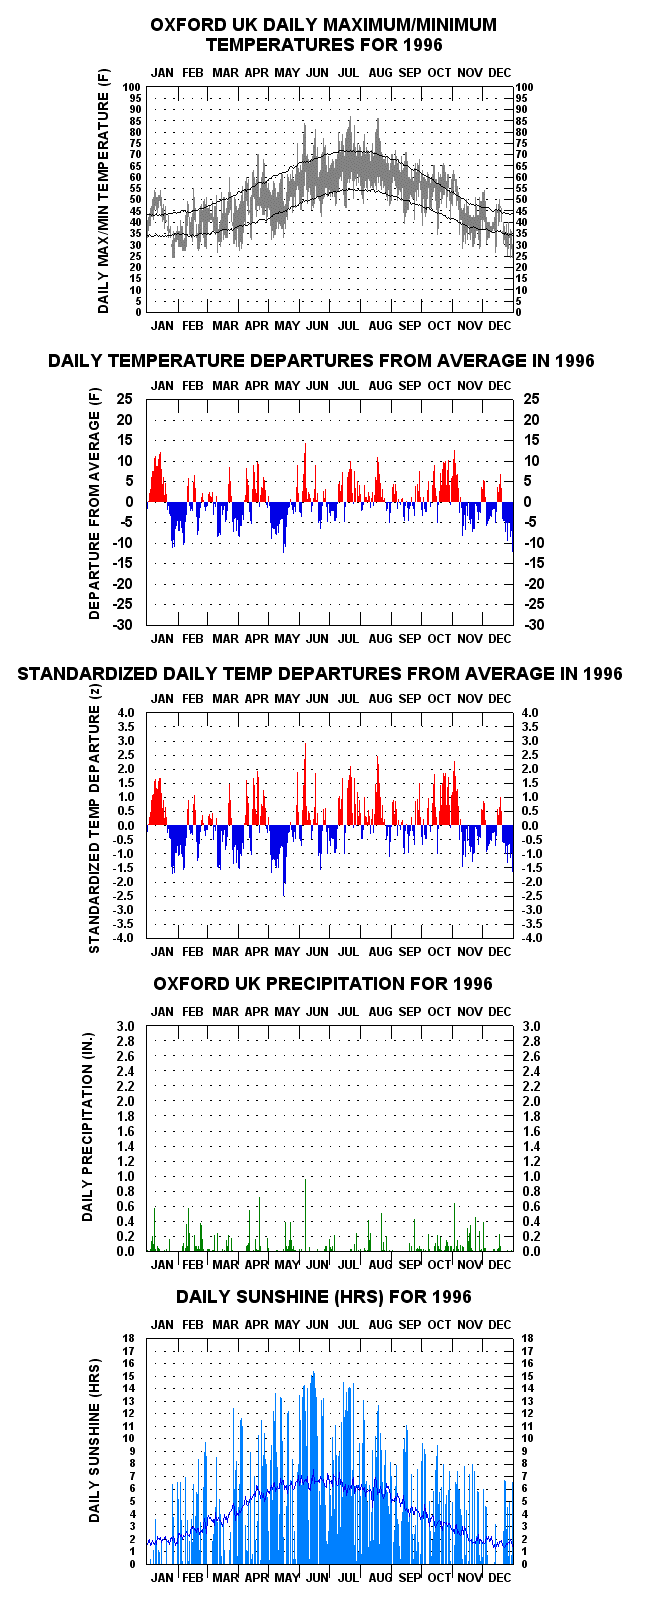
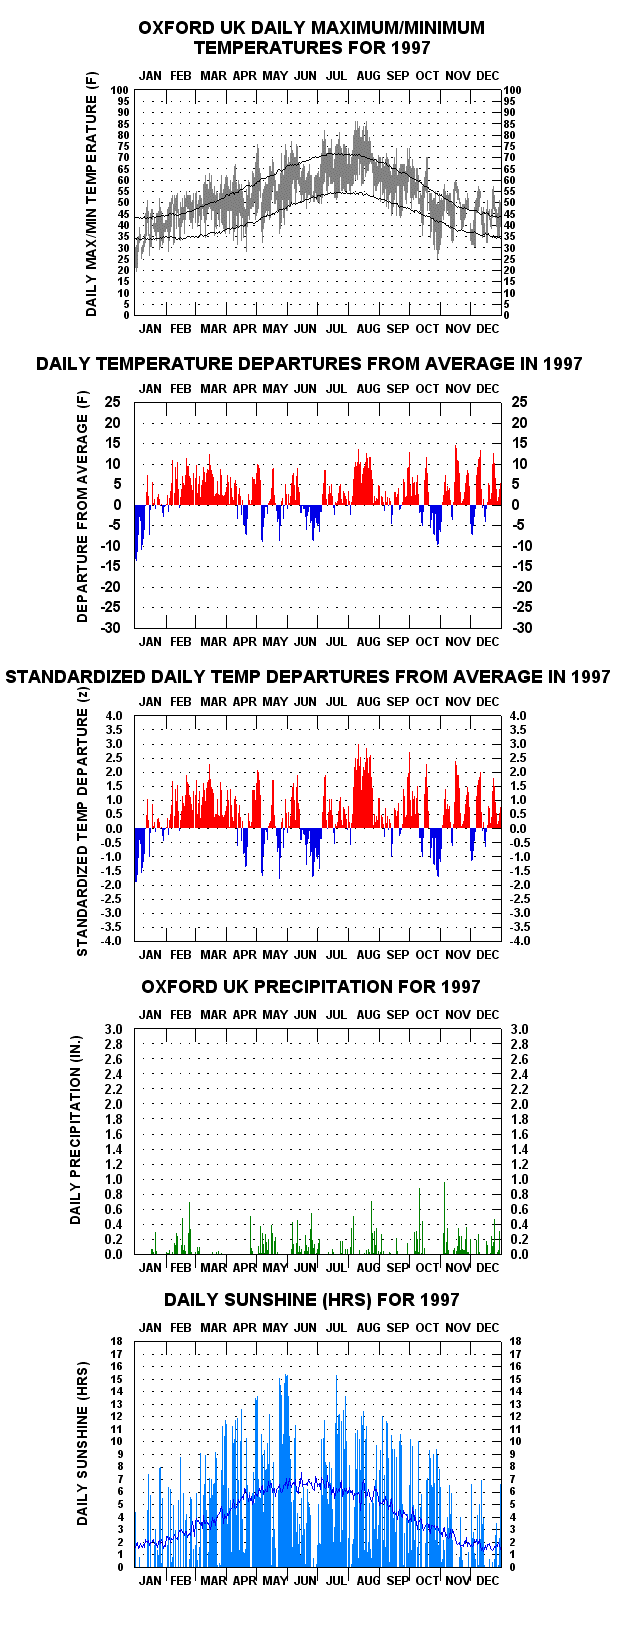
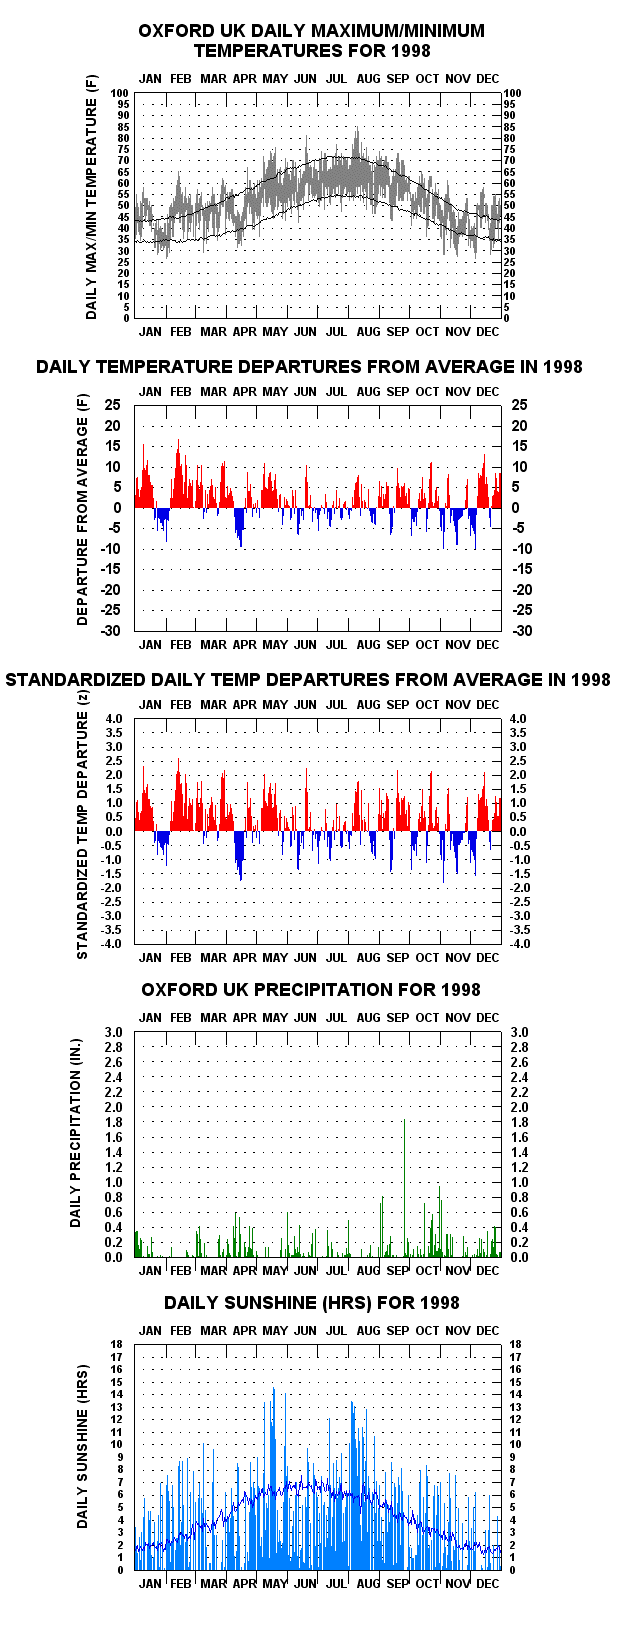
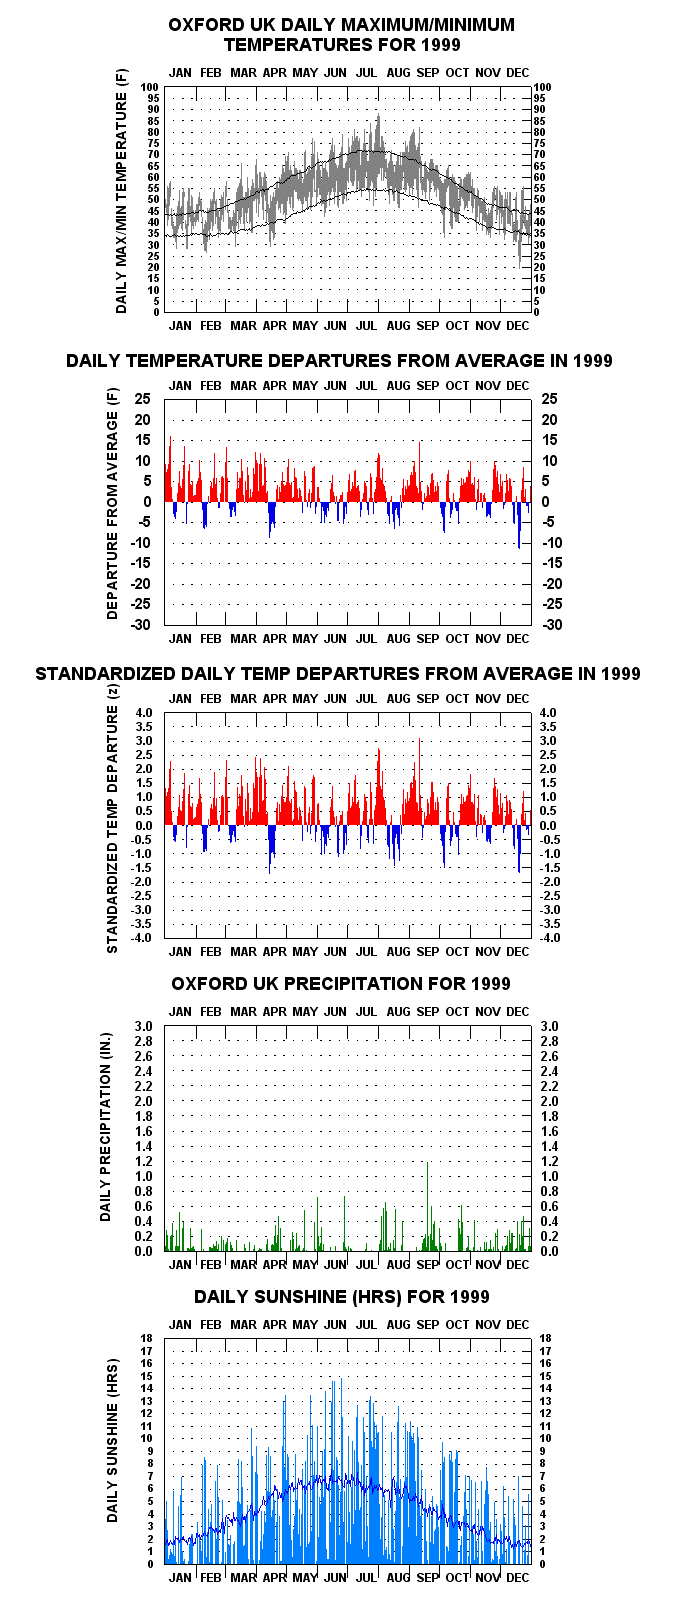
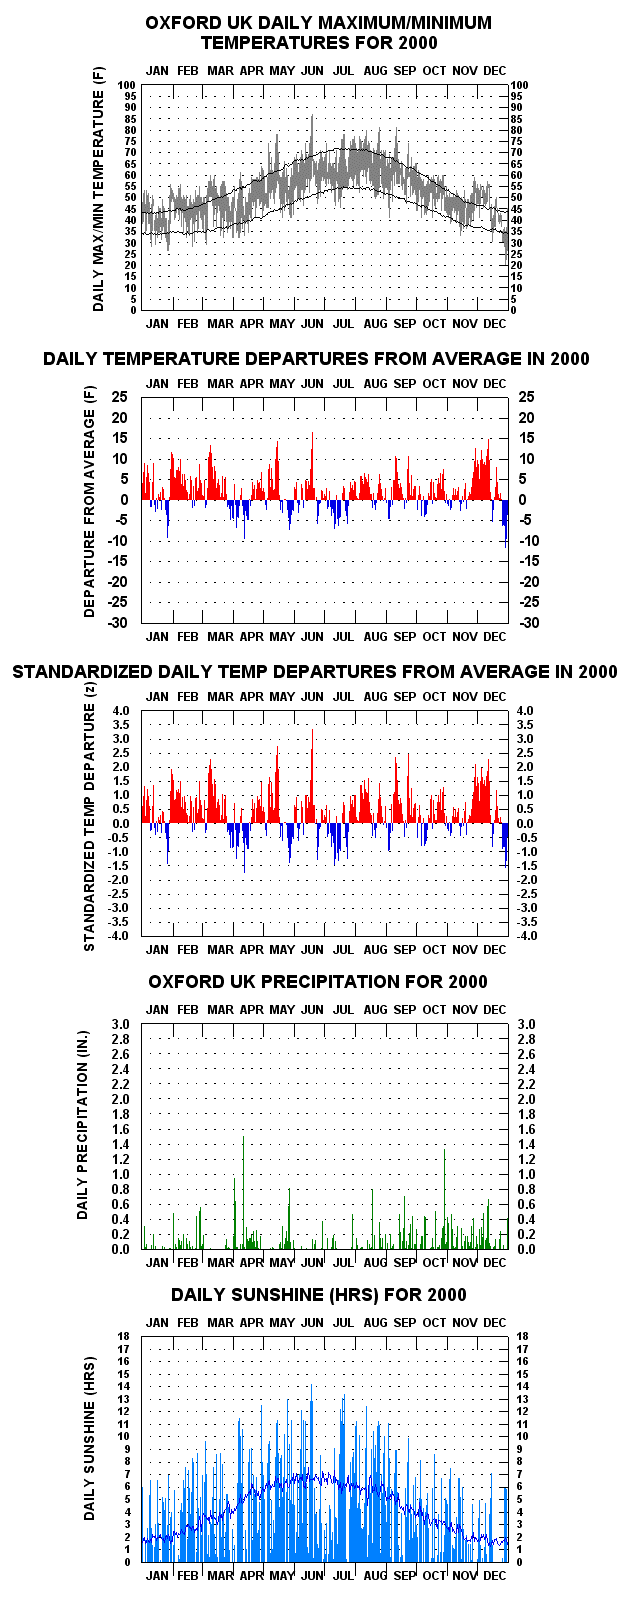
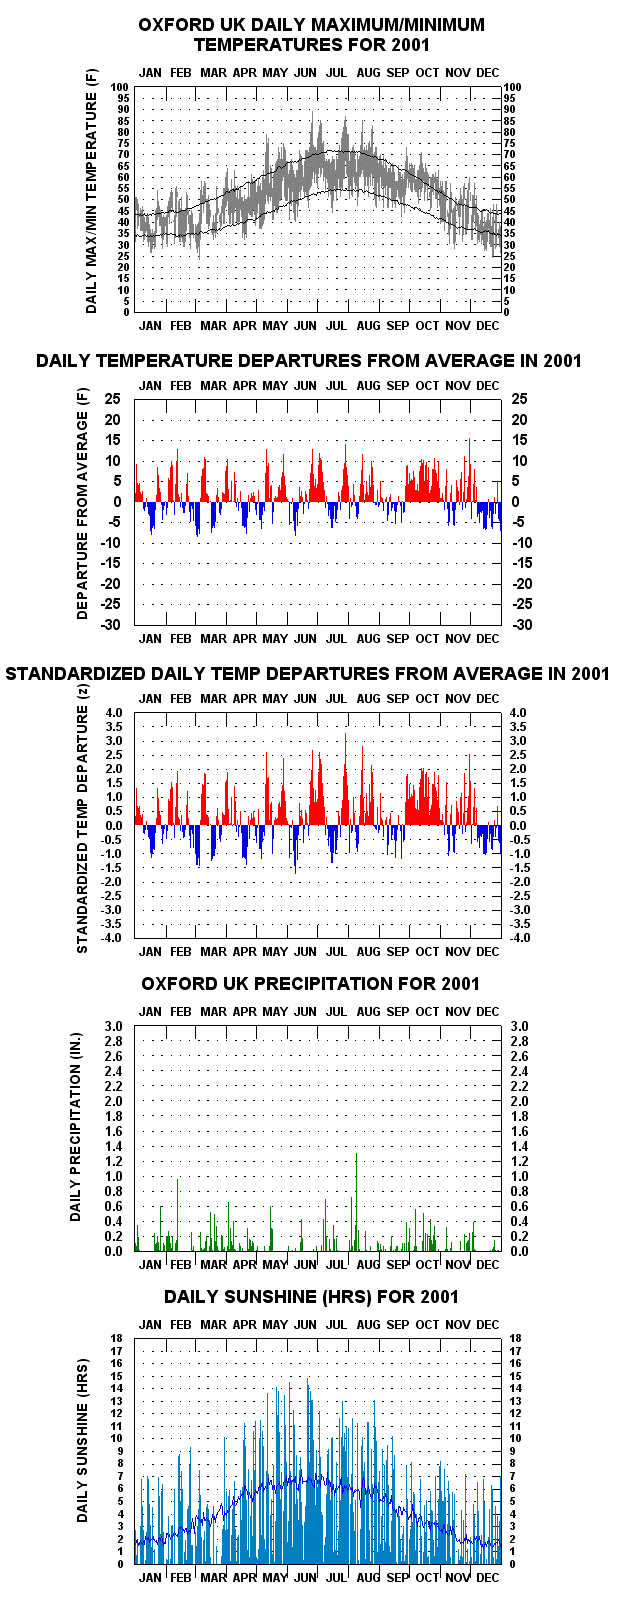
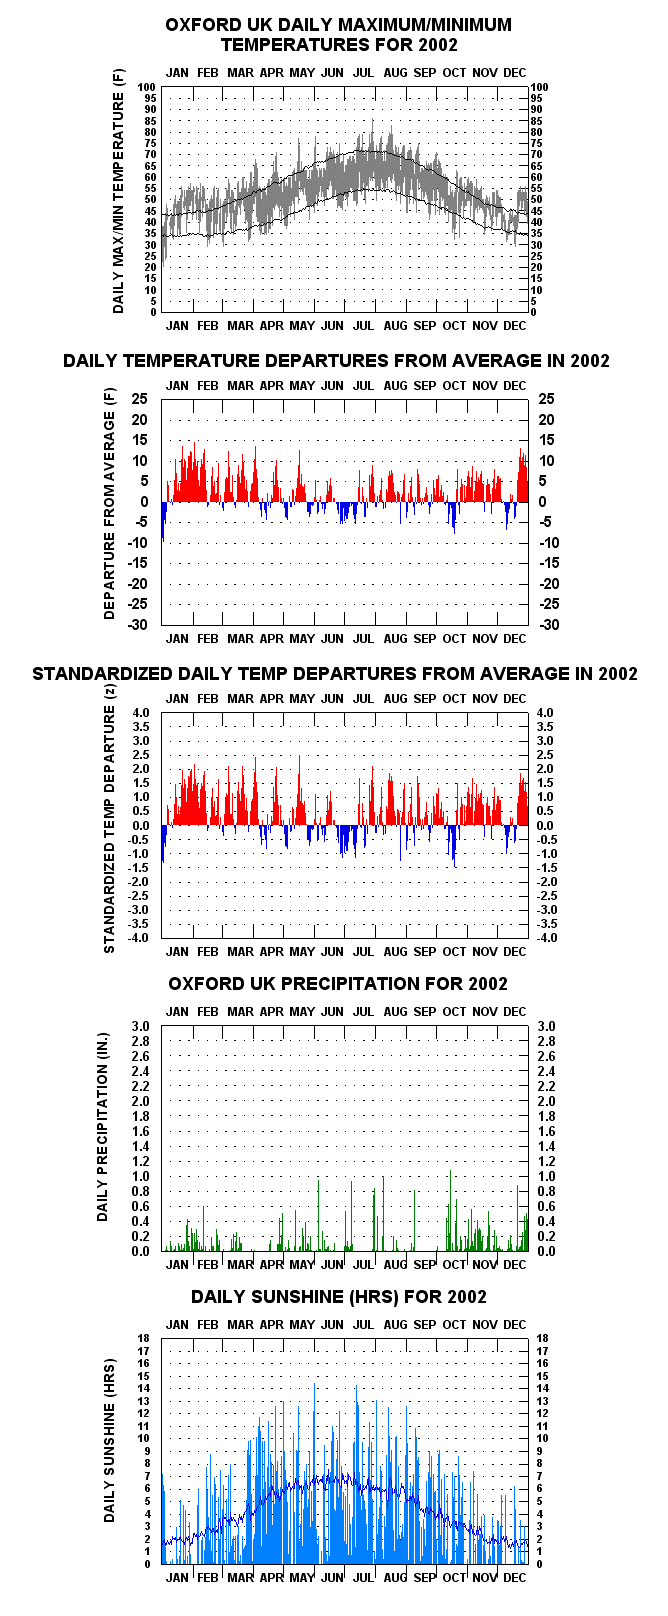
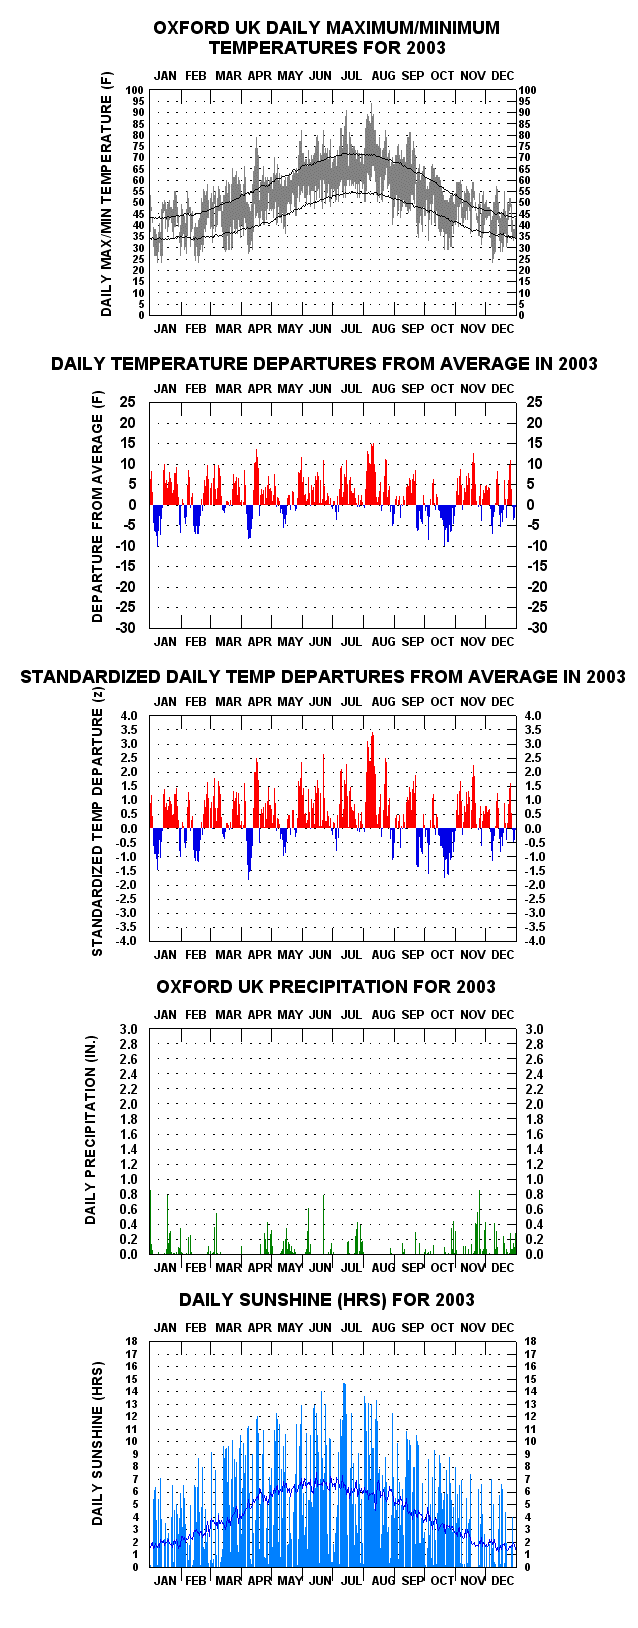
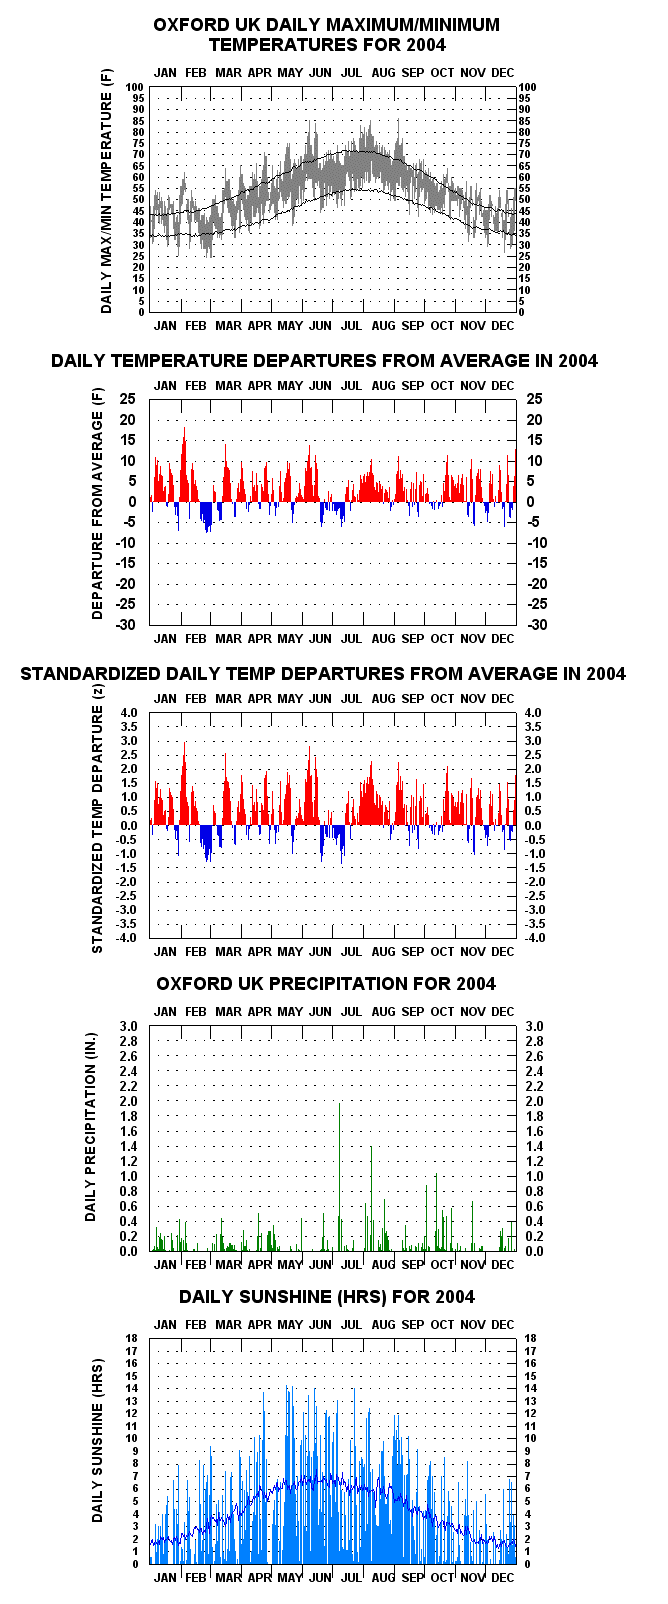
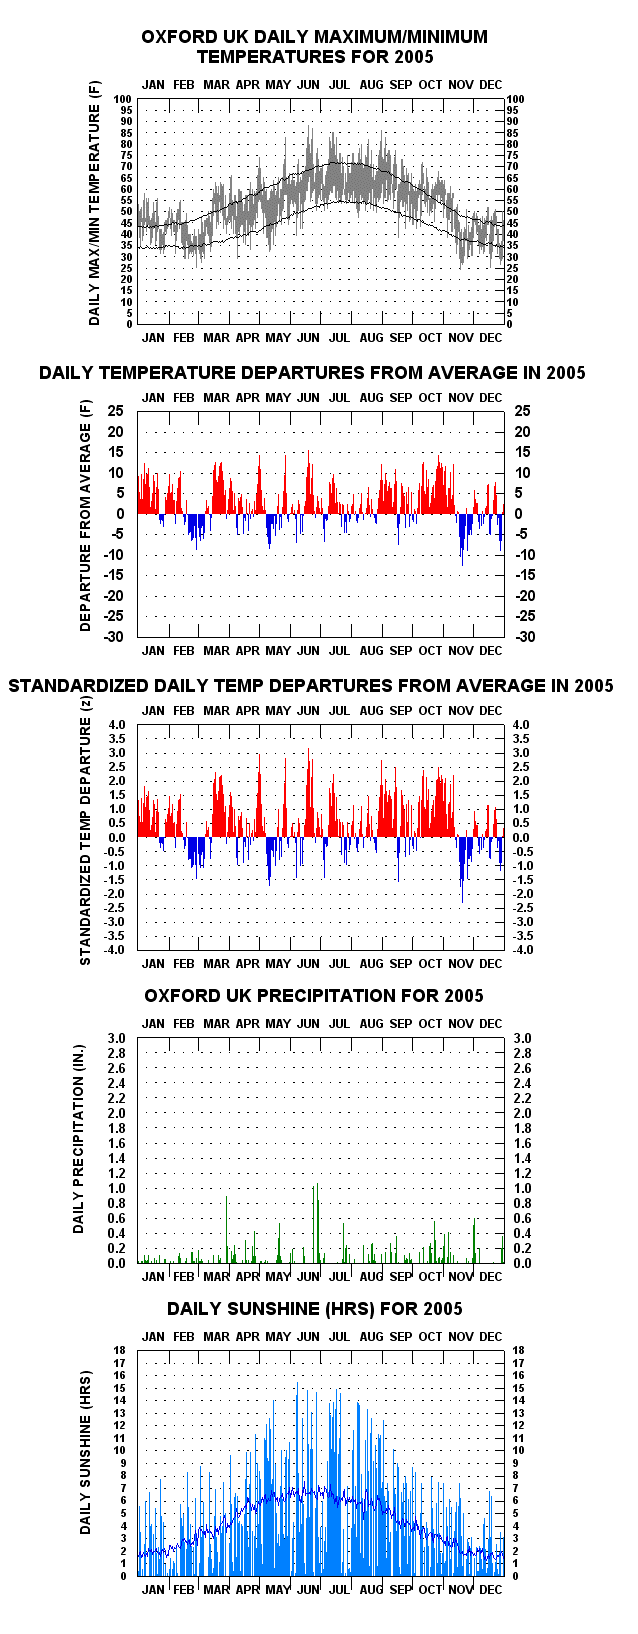
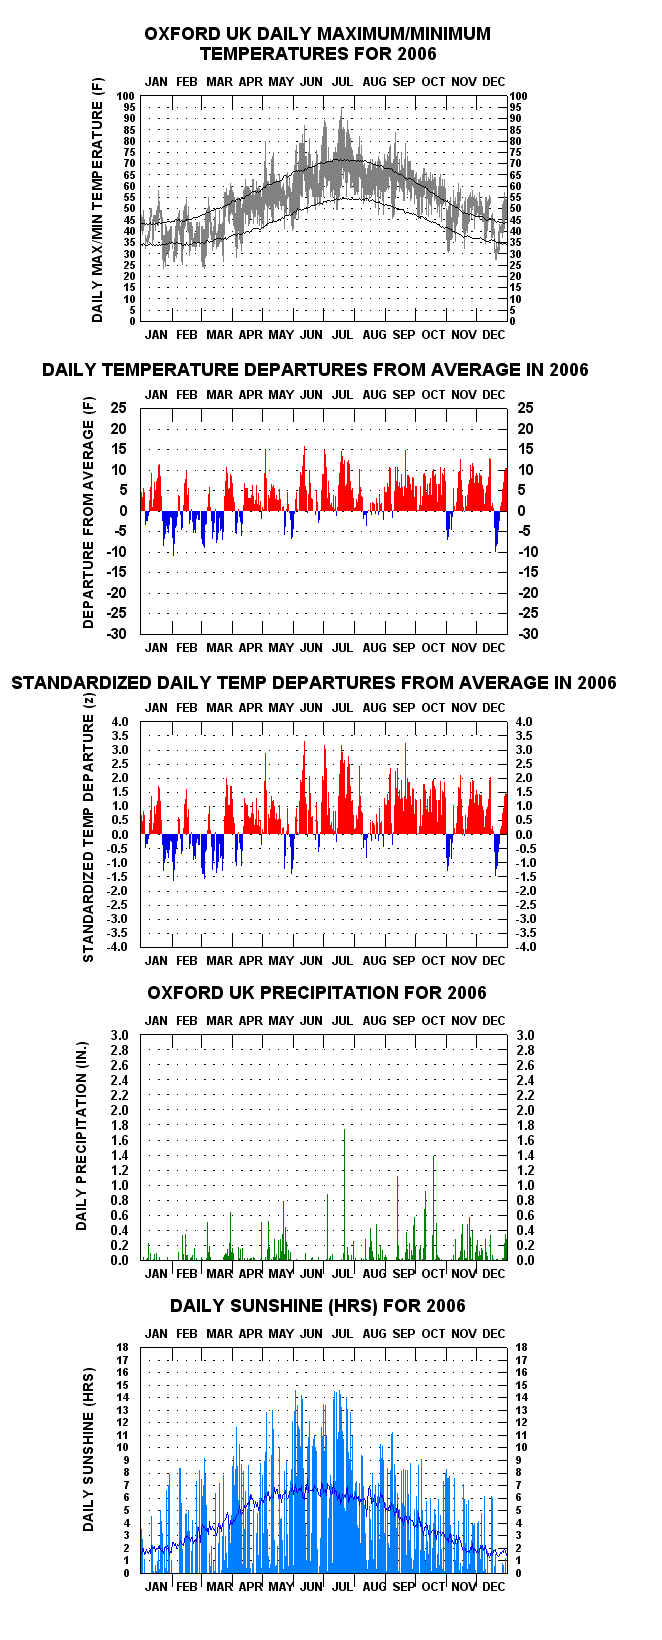
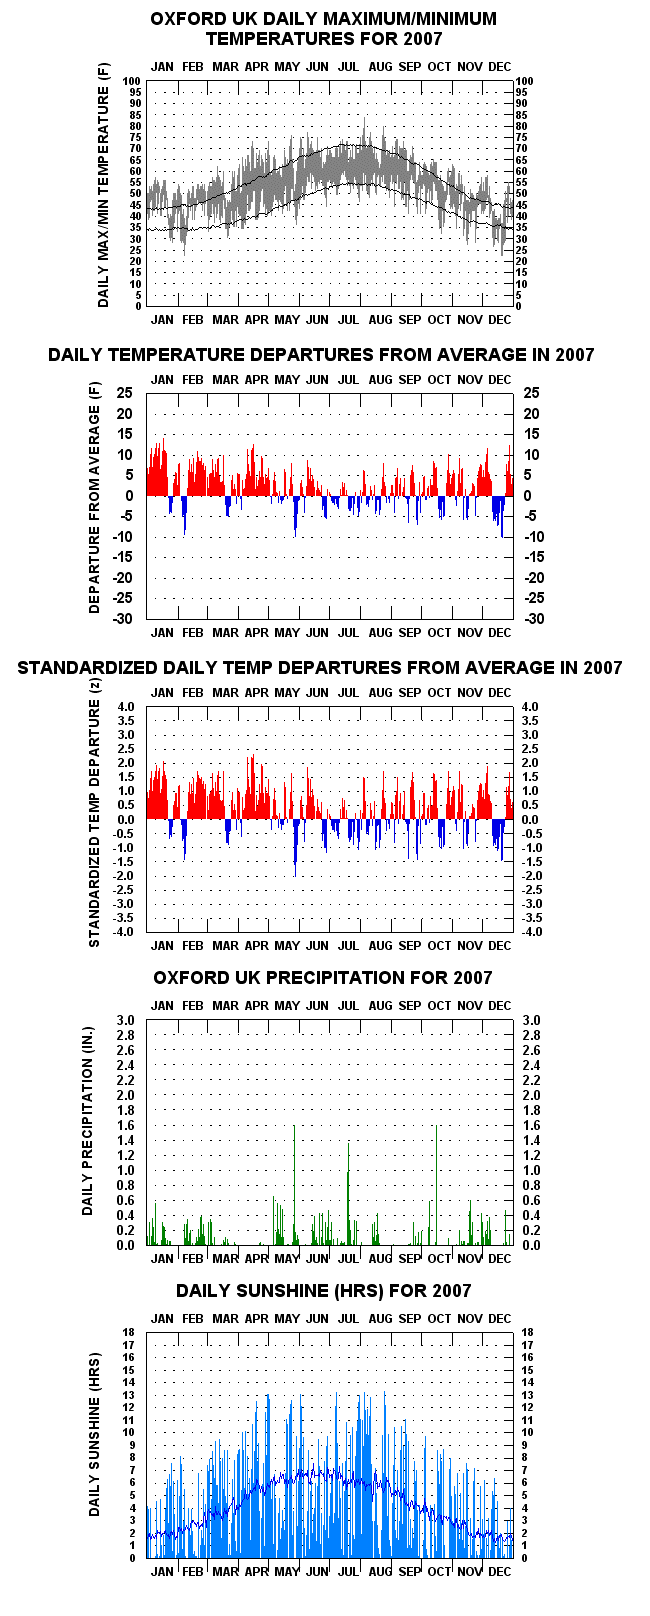
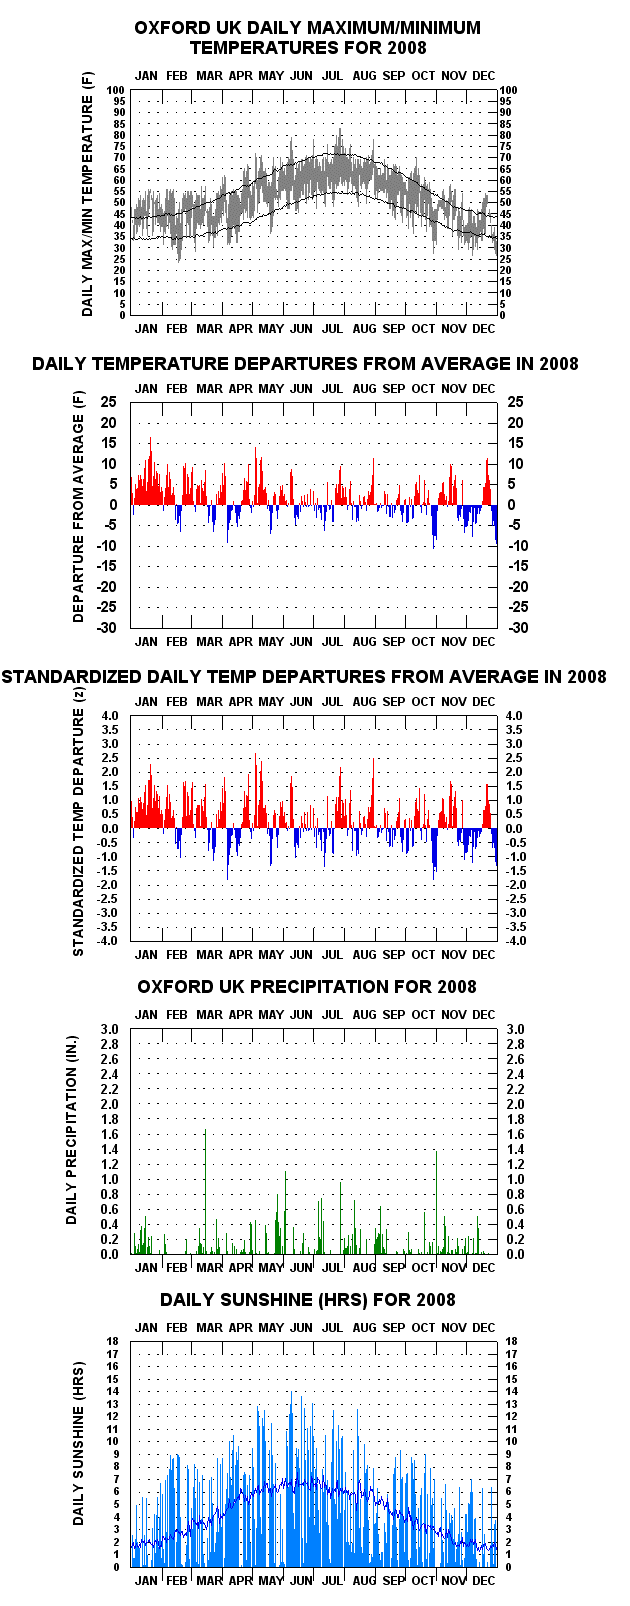
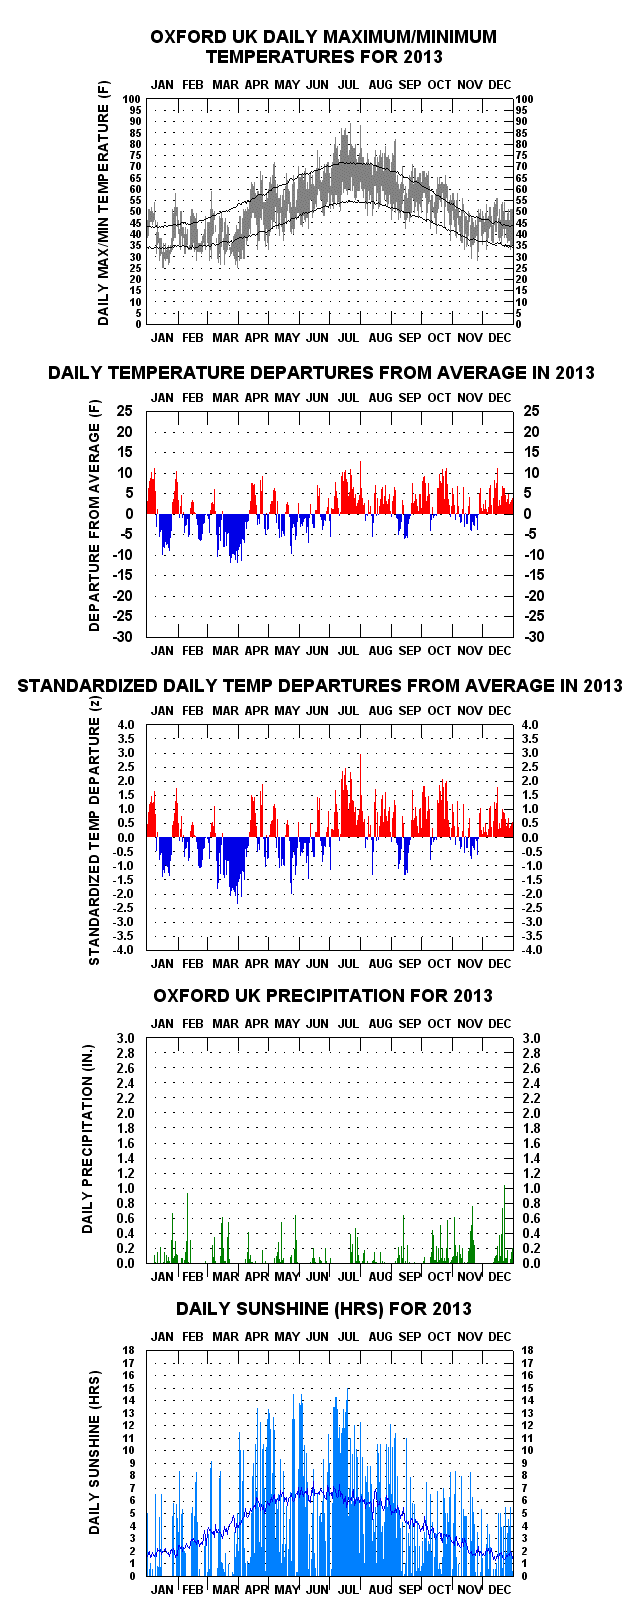
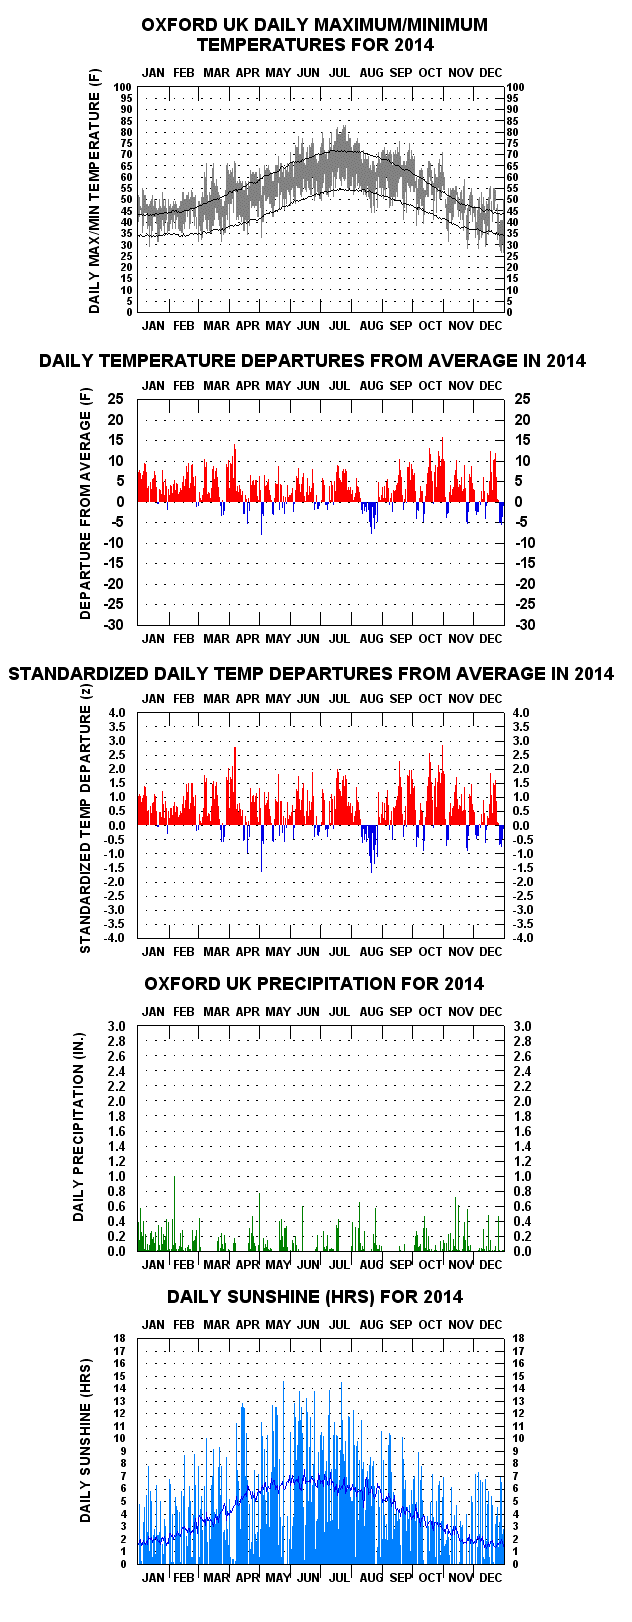
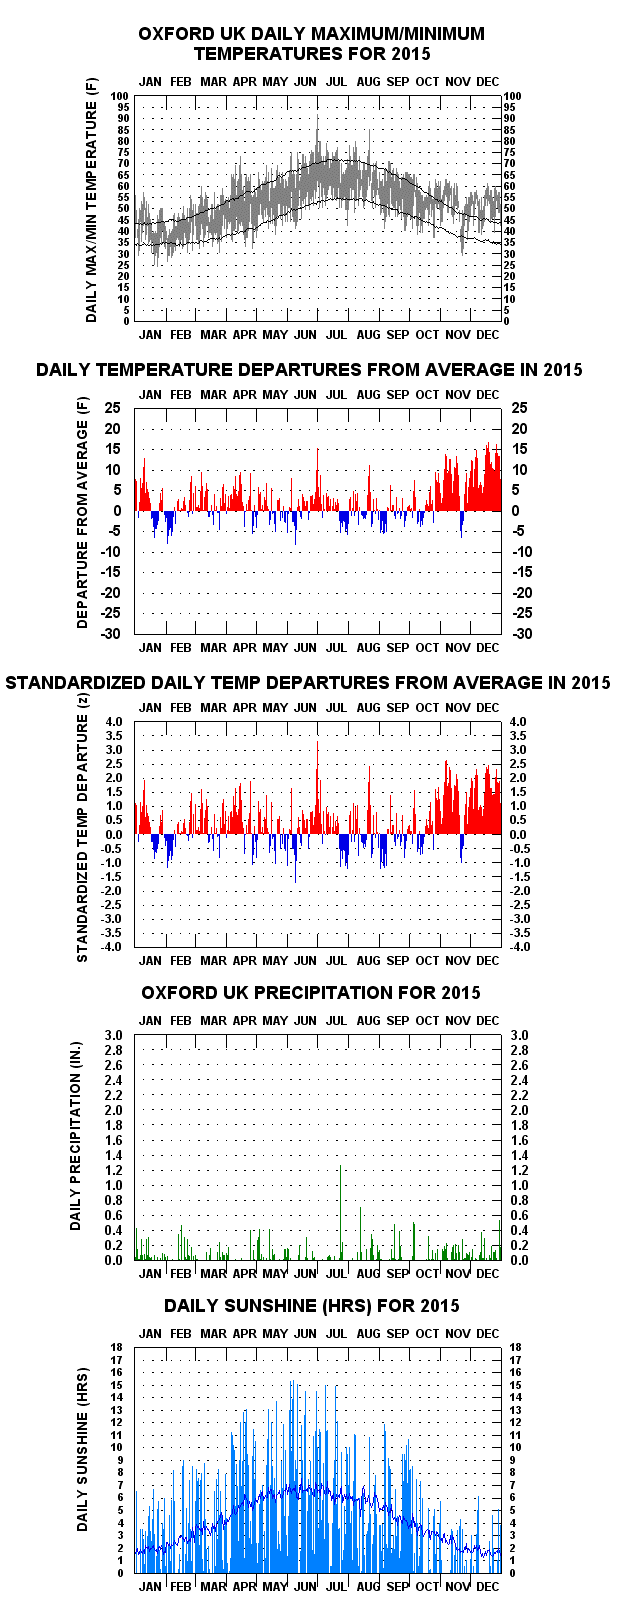
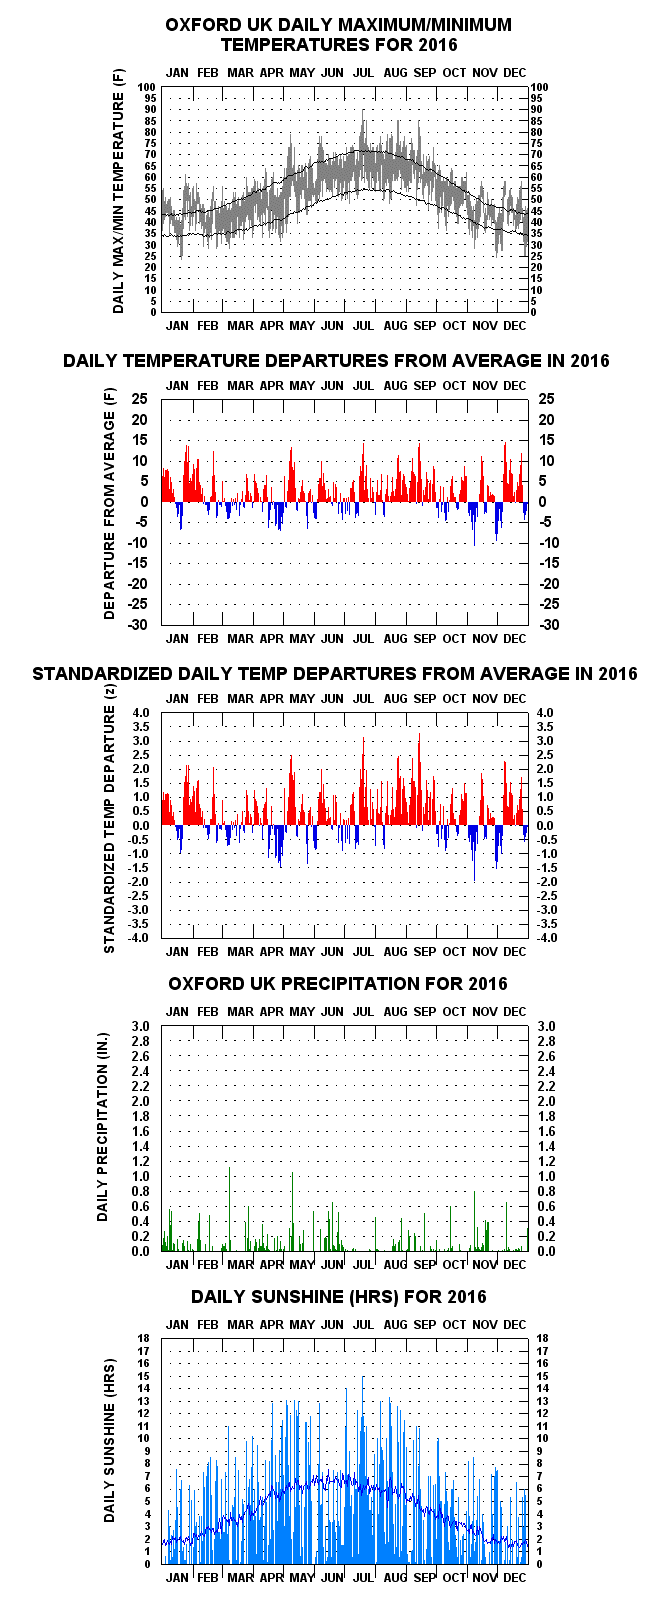
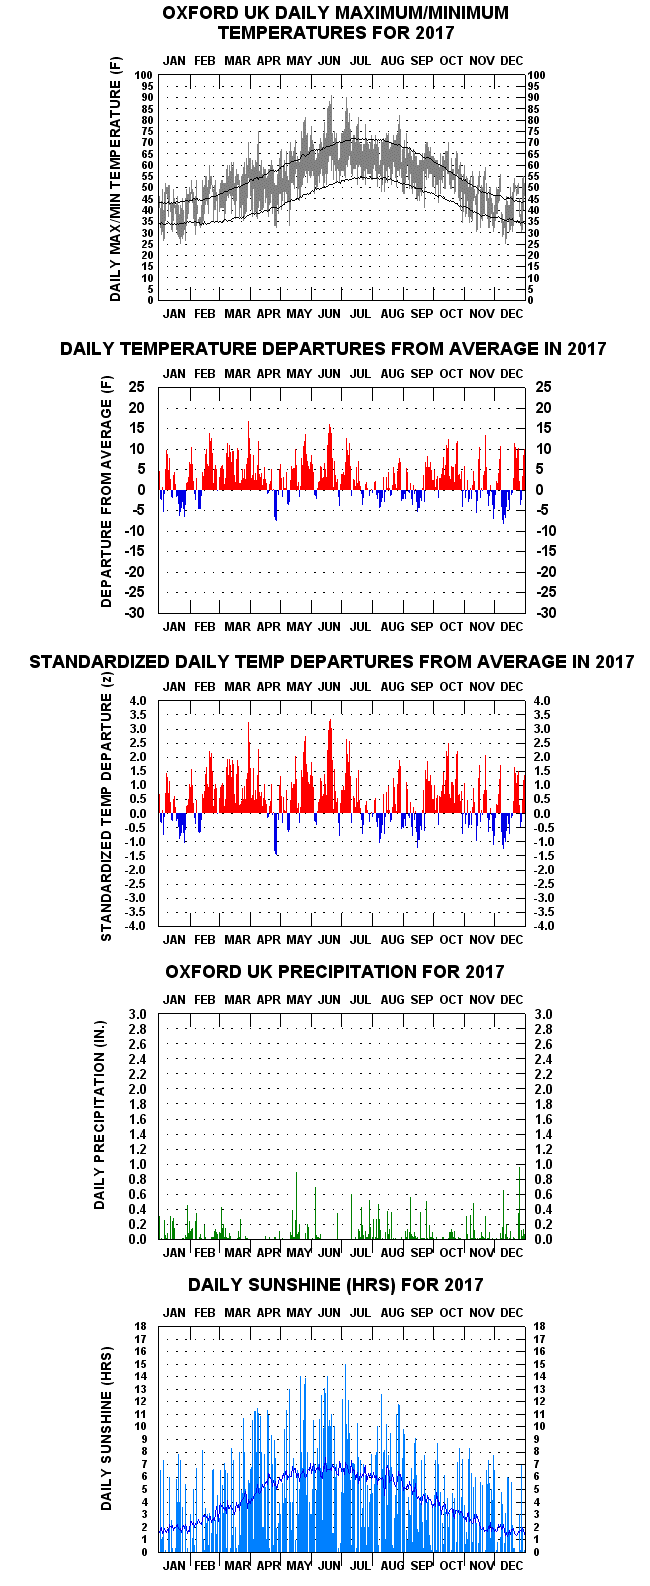
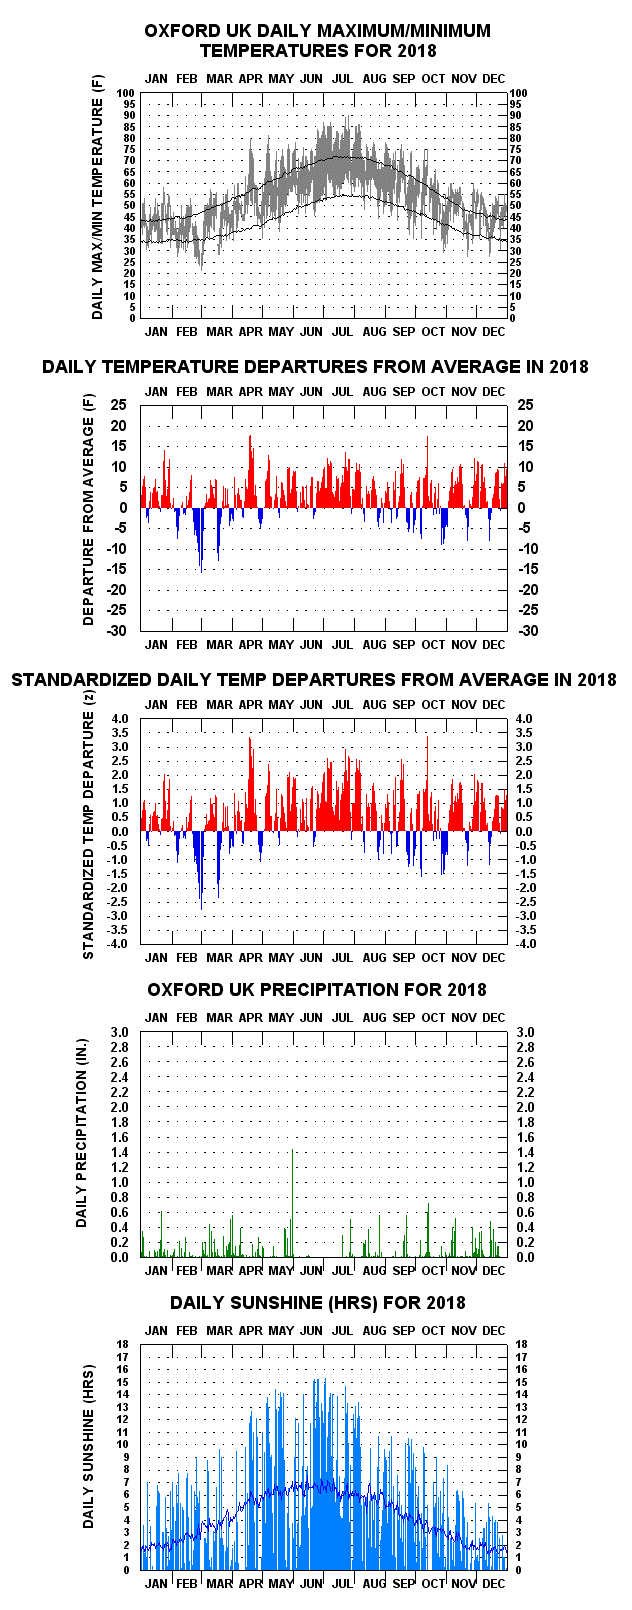
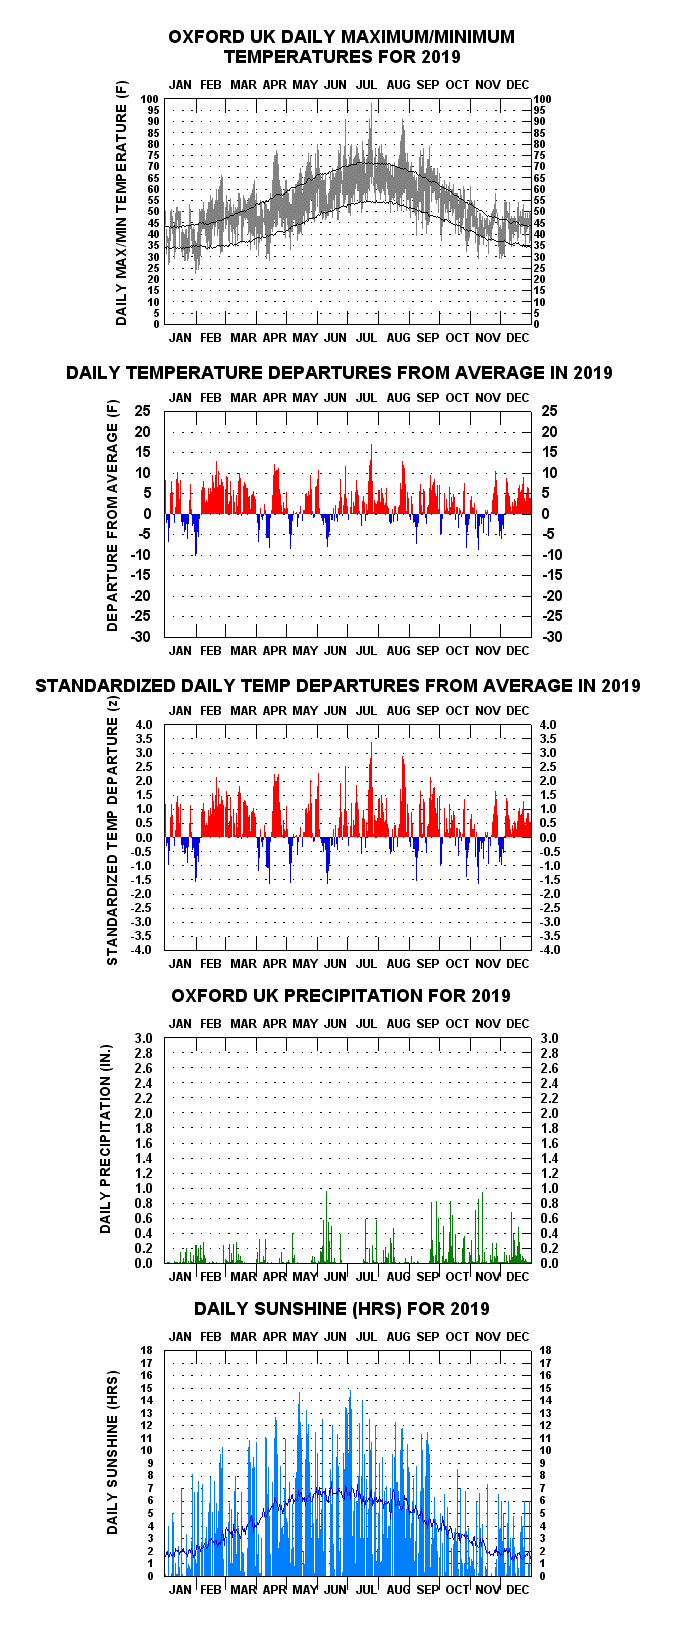
The individual year-to-year graphs contain three to five charts, depending on the period. For 1815 through 1826, the selection contains maximum/minimum temperatures, arithmetic daily temperature departures and standardized daily temperature departures. From 1827 onward, daily precipitation is added, and from 1921 onward, daily sunshine hours are also included.
The selected charts below represent years with distinguishing climatological features, including heat anomalies, cold anomalies, precipitation extremes and unusual patterns. They are listed from newest to oldest, followed by the complete set of individual-year links.
Links to Some of the More Interesting Year-to-Year Graphs, with Accompanying Notes
Record Number of Sunshine Hours set in 2025 (1898 hrs).
Second Warmest Year in History (53.4 F).
Warmest Year in History (53.9 F); 101 F on 19 July, the warmest in history.
Annual minimum temperature for the year (28 F), the mildest in history. May was the sunniest calendar month in history (332 hrs).
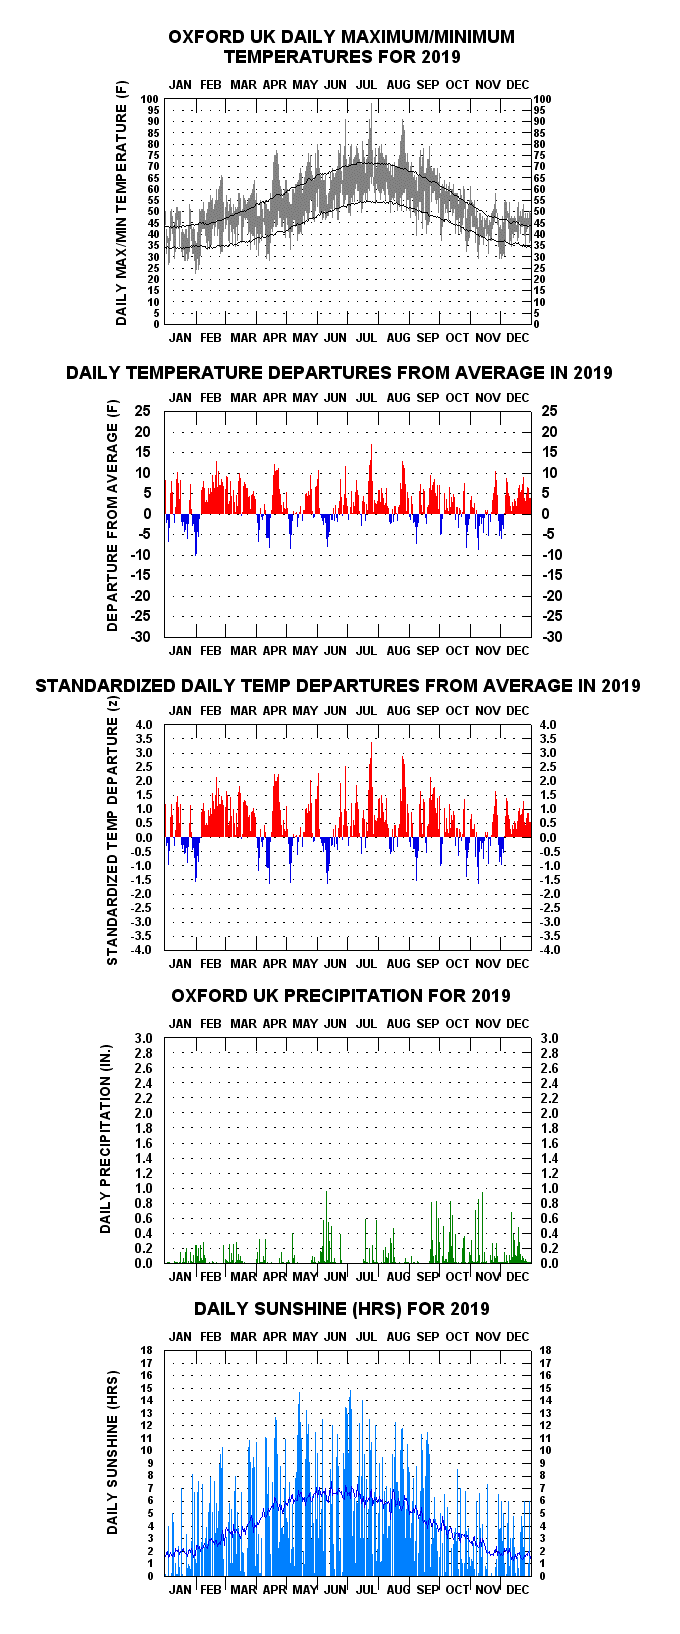
98 F recorded on 25 July, the warmest in history to date.
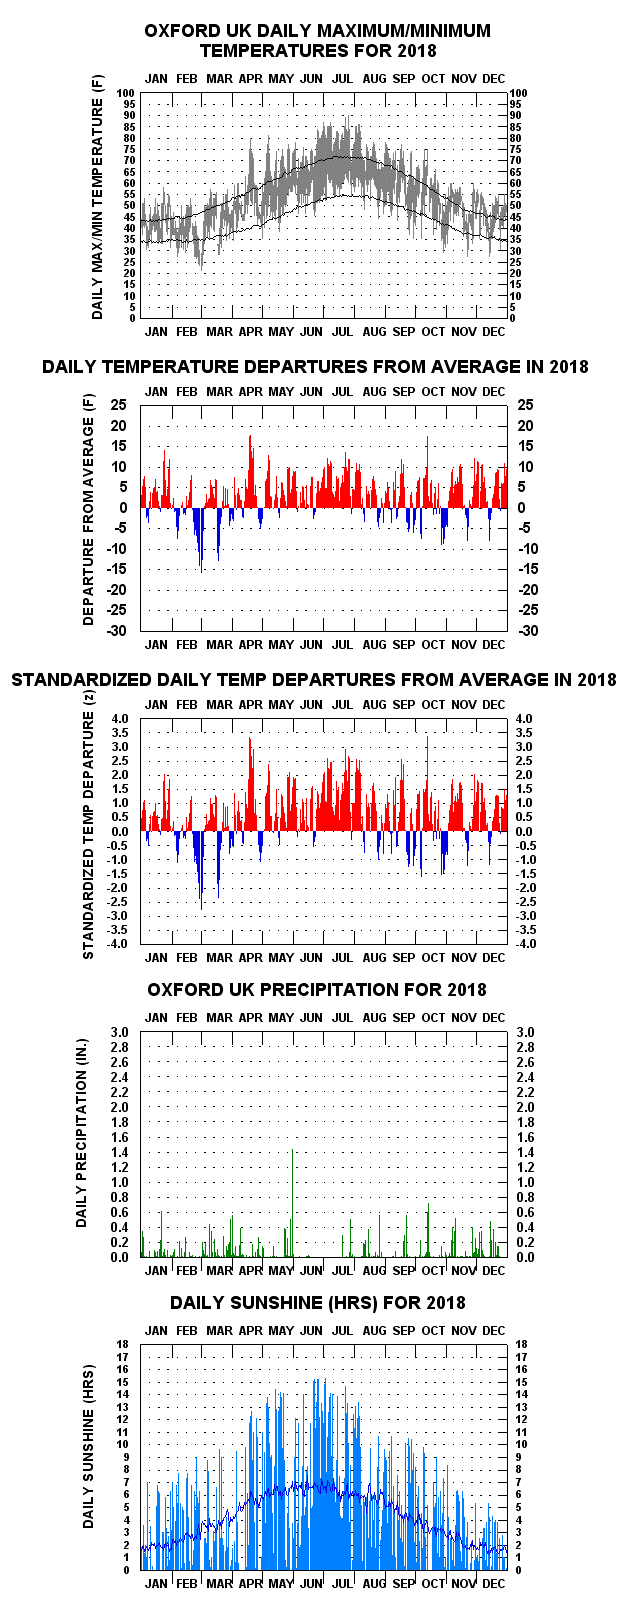
Warmest Summer (June–August) in history (66.0 F).
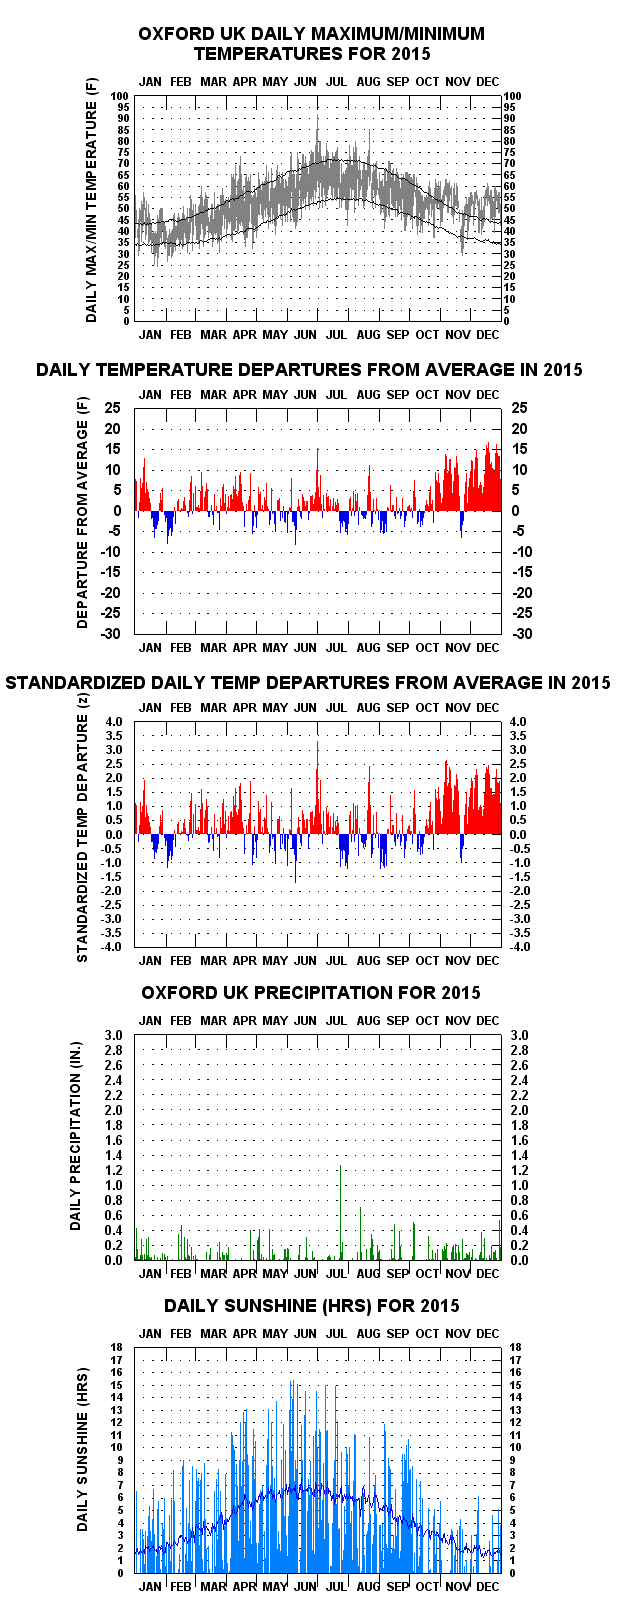
Exceptionally mild November and December helped produce the mildest winter (Nov.–Jan.) in history (45.3 F).
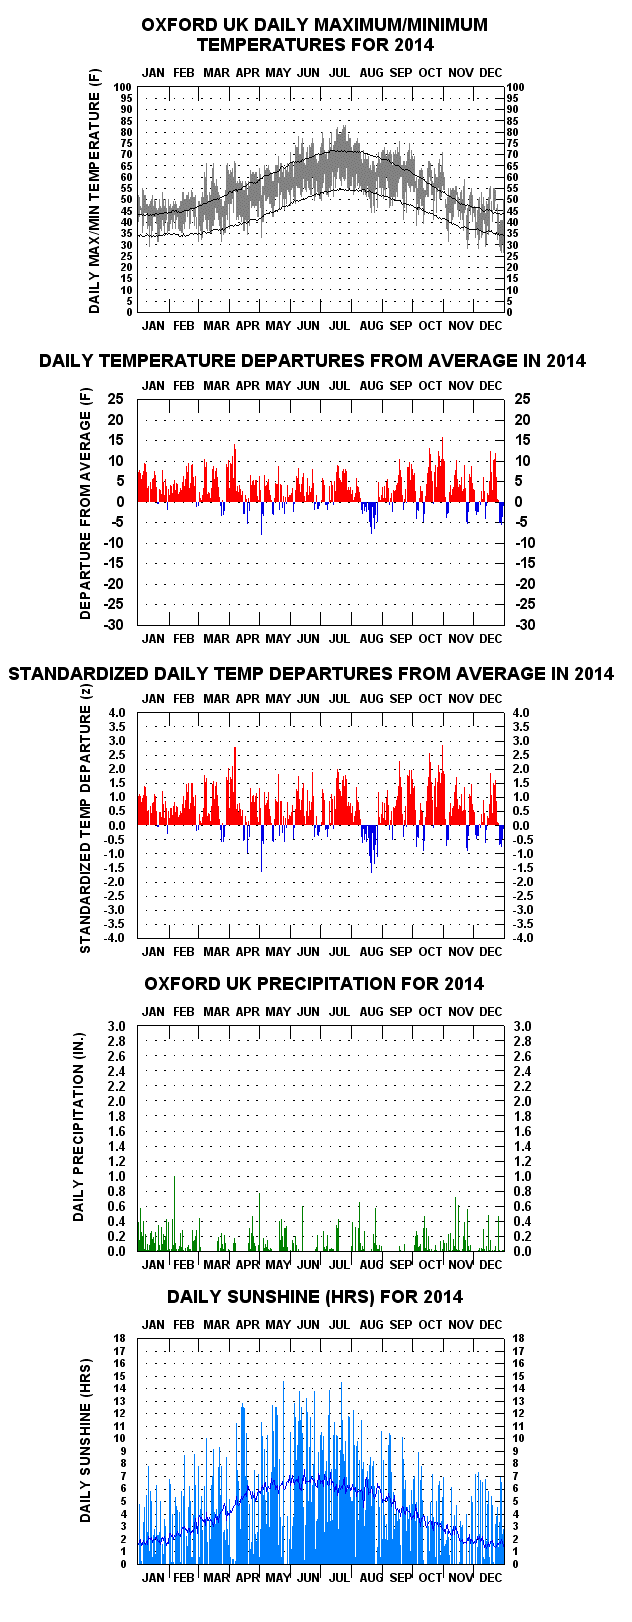
Warmest year in history to date (53.2 F).
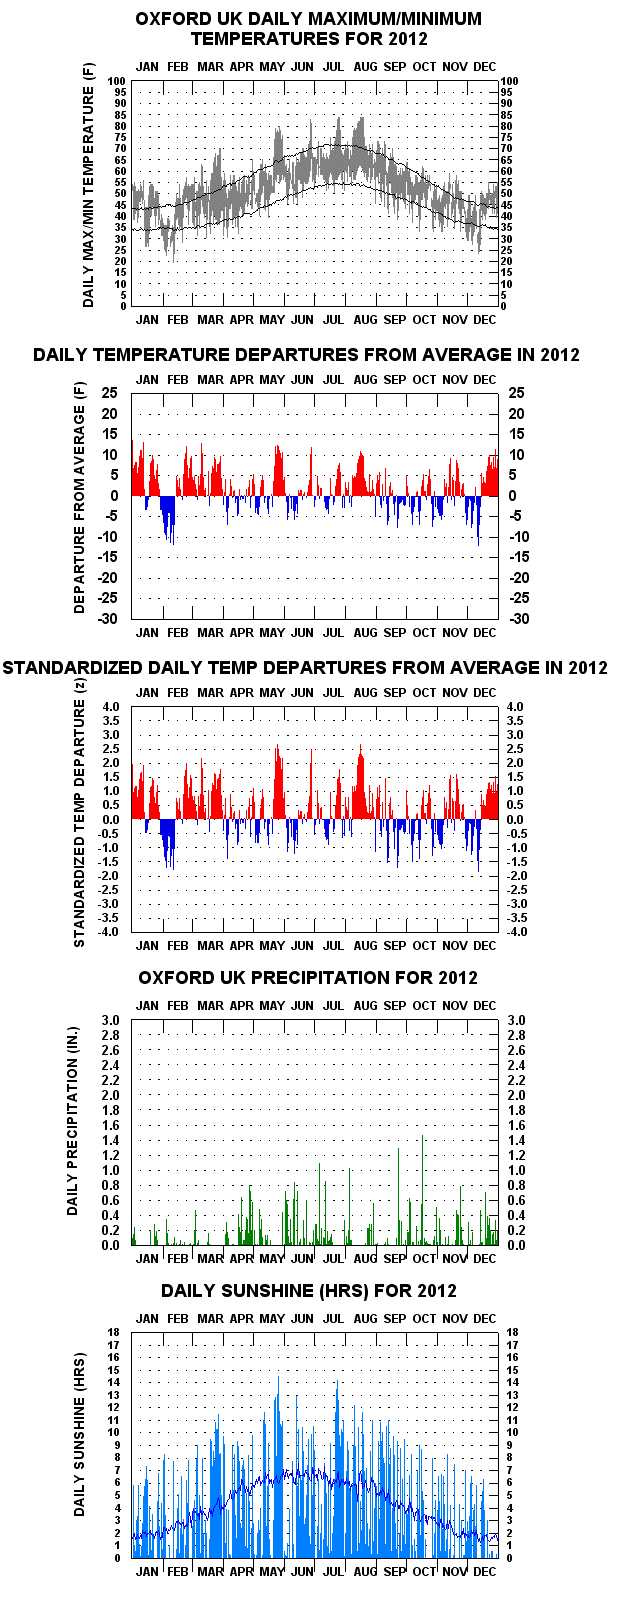
Wettest calendar year in history (38.56 inches).
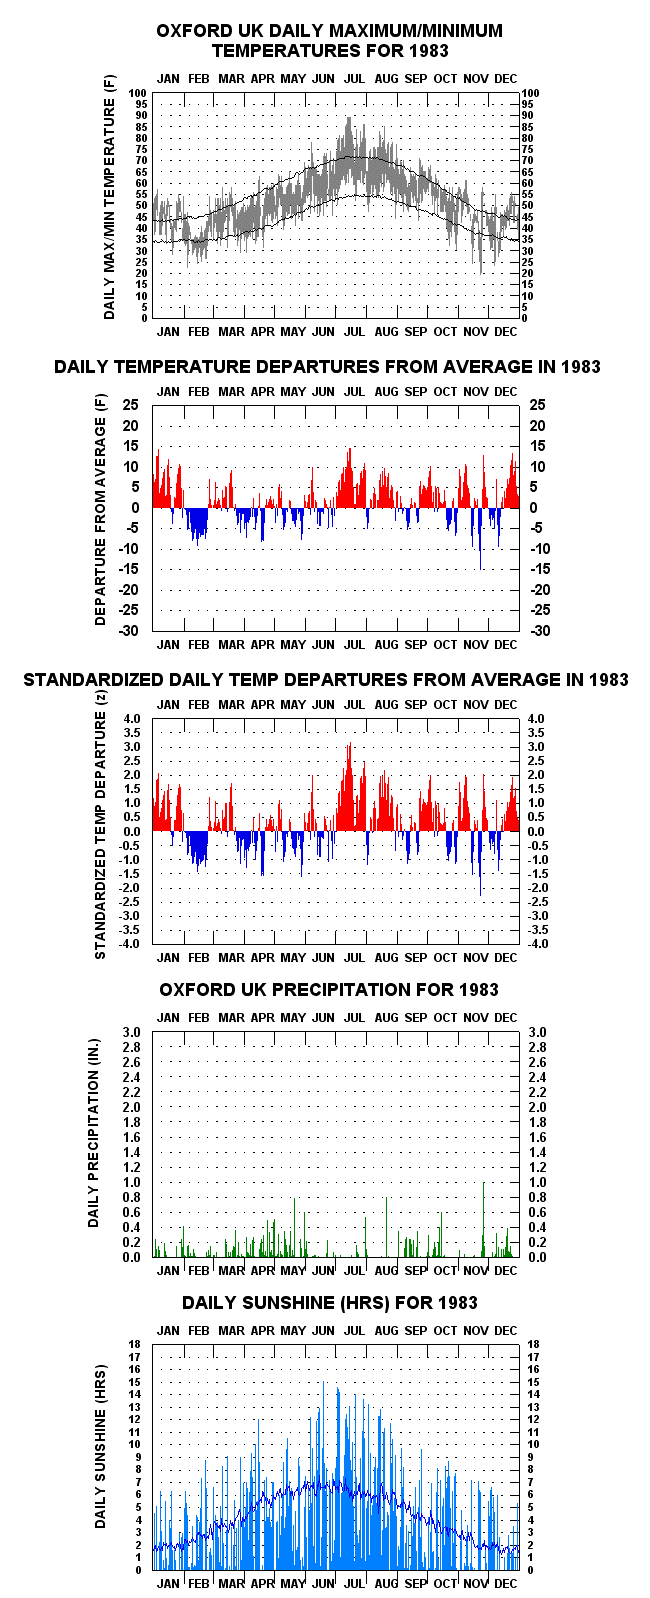
July monthly mean (70.2 F), the highest in history.
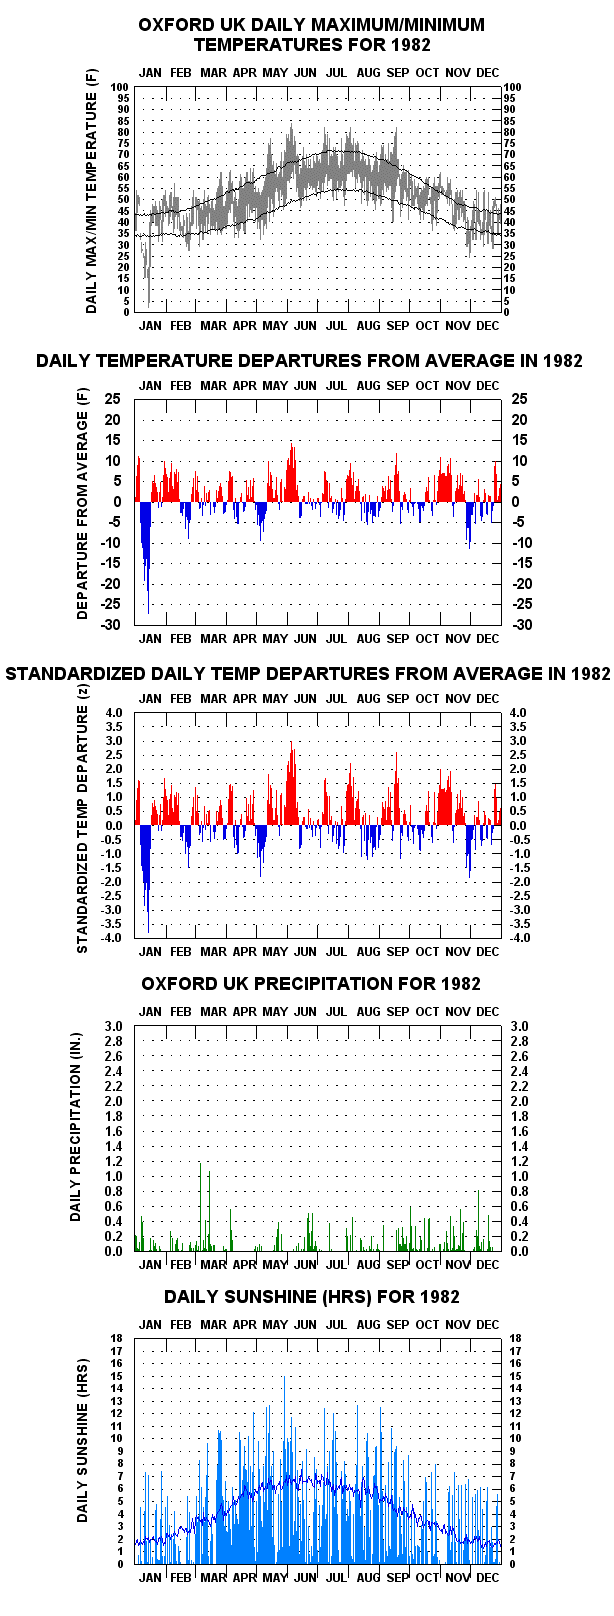
Severe cold in January; 2 F recorded on the 14th, the lowest since December 1860.
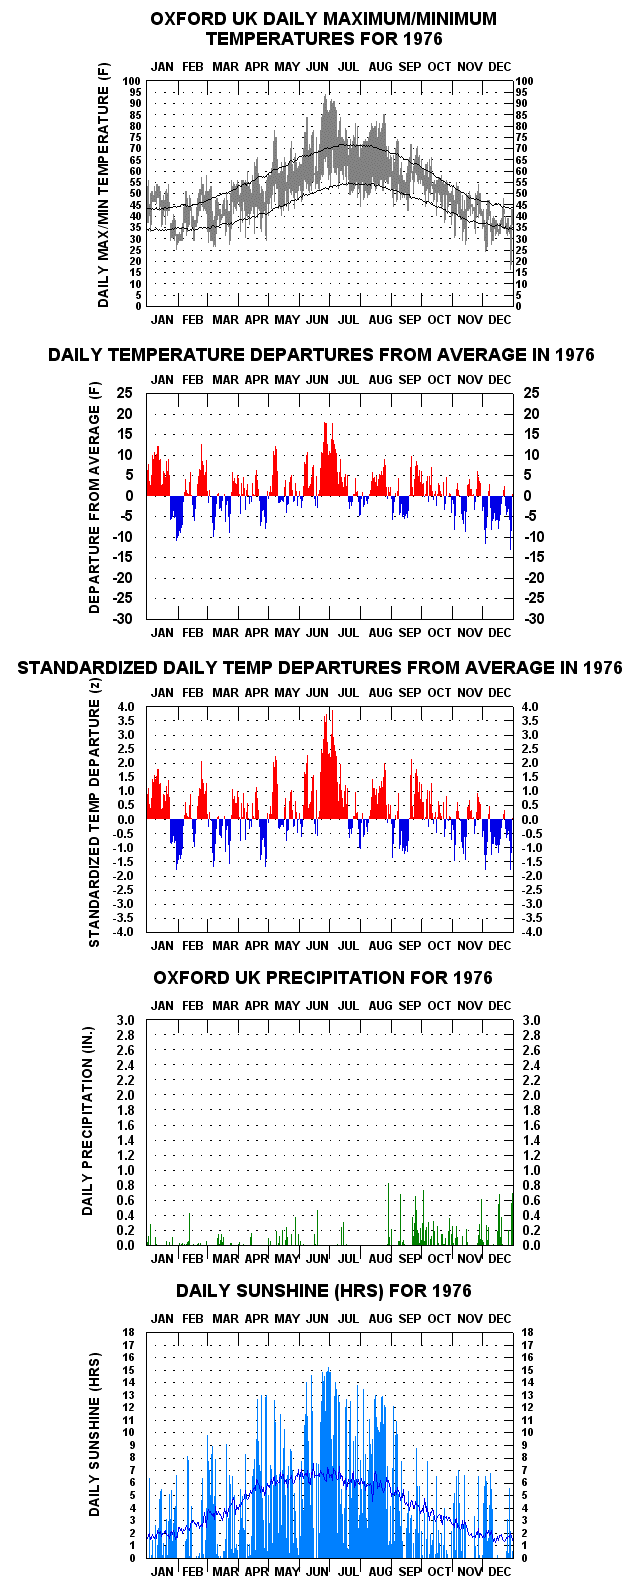
Two-week heat wave covering late June and early July. Nine daily maxima at 90 F or higher, the most for any one year in history. A forty-day drought followed from 19 July.
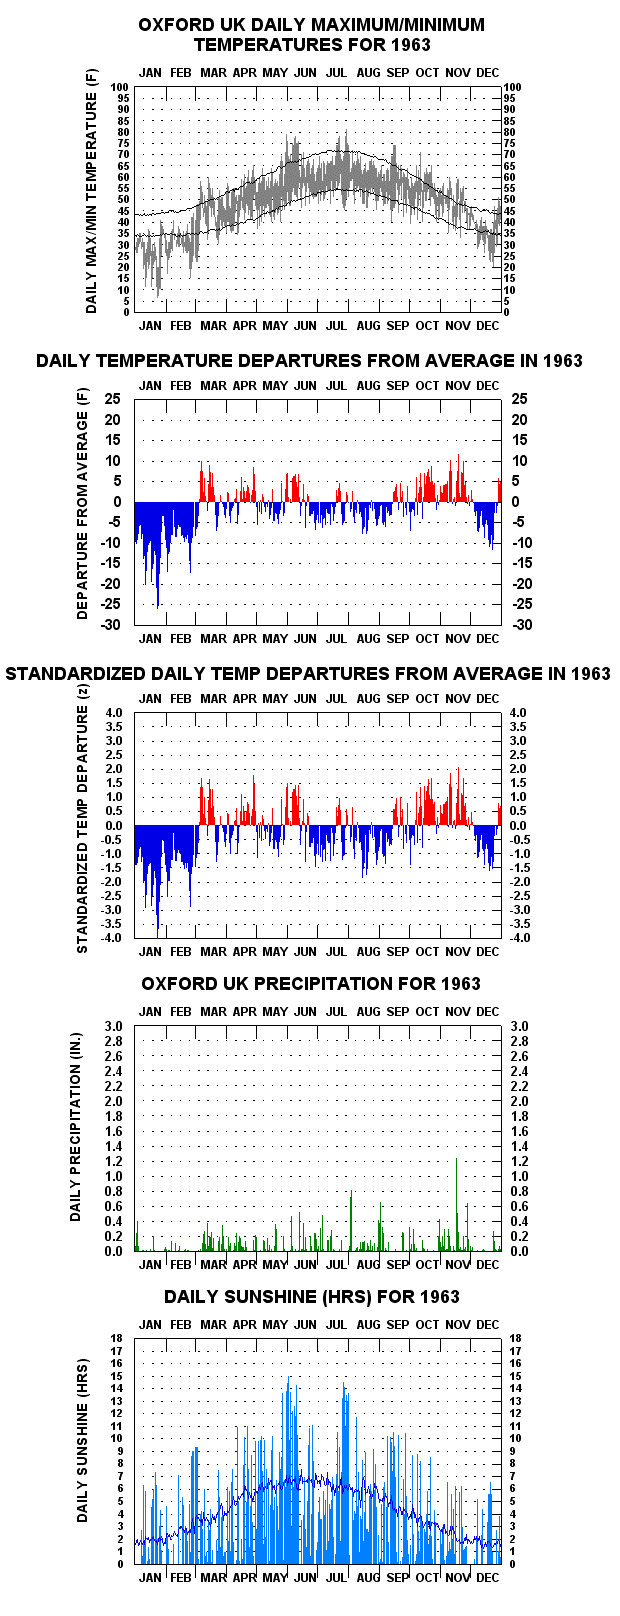
January was the coldest calendar month in history (26.6 F).
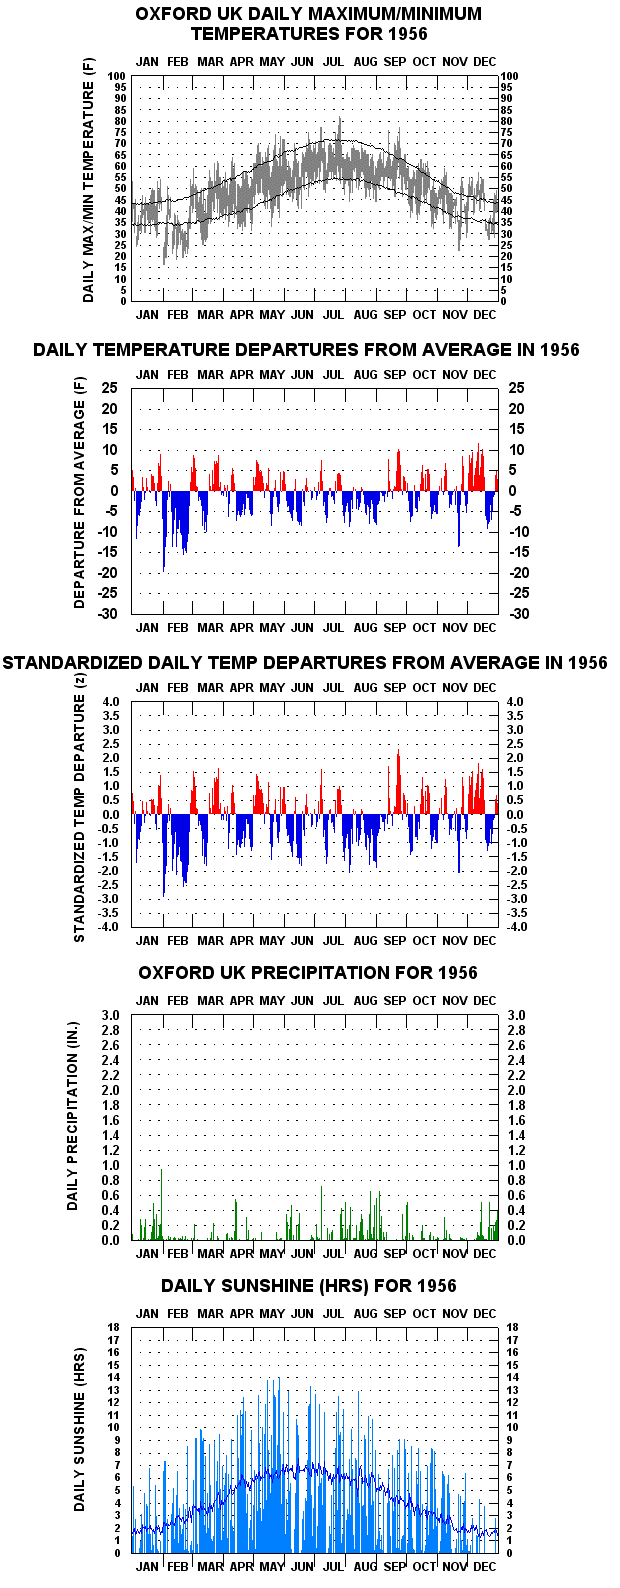
December recorded only 18 hours of sunshine, the least of any calendar month in history.
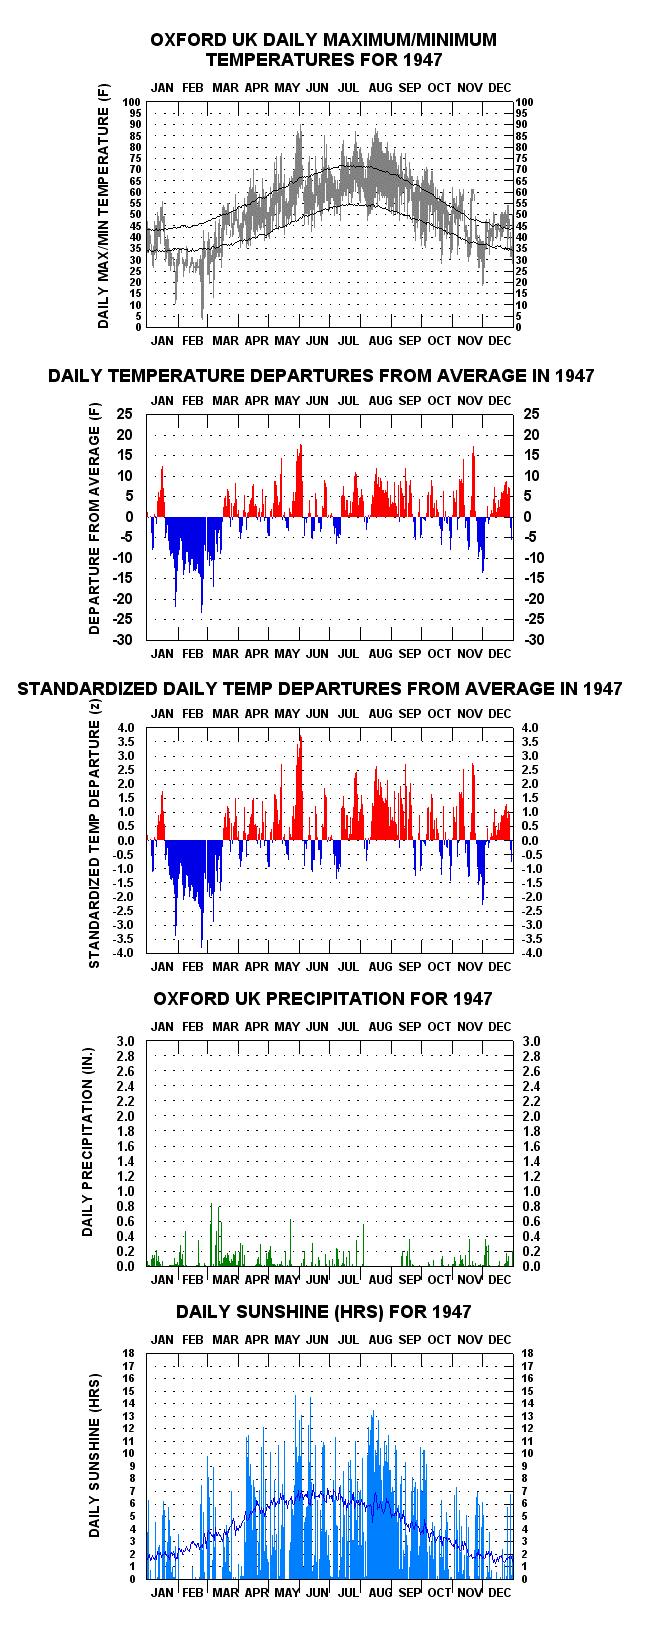
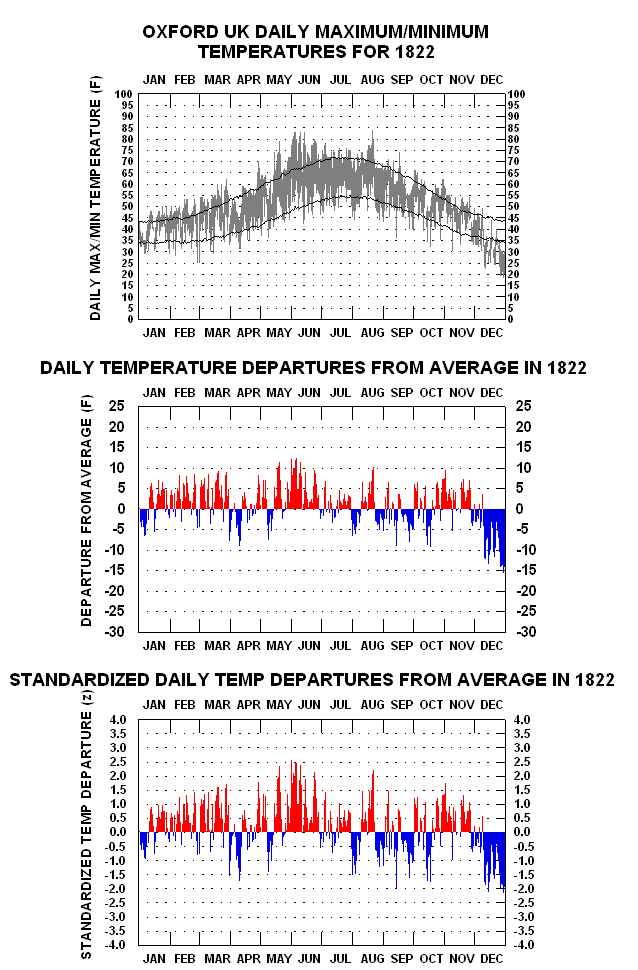
Abnormal cold from mid-January to early March, including 3 F in late February, with frequent abnormal warm spells during the rest of the year.
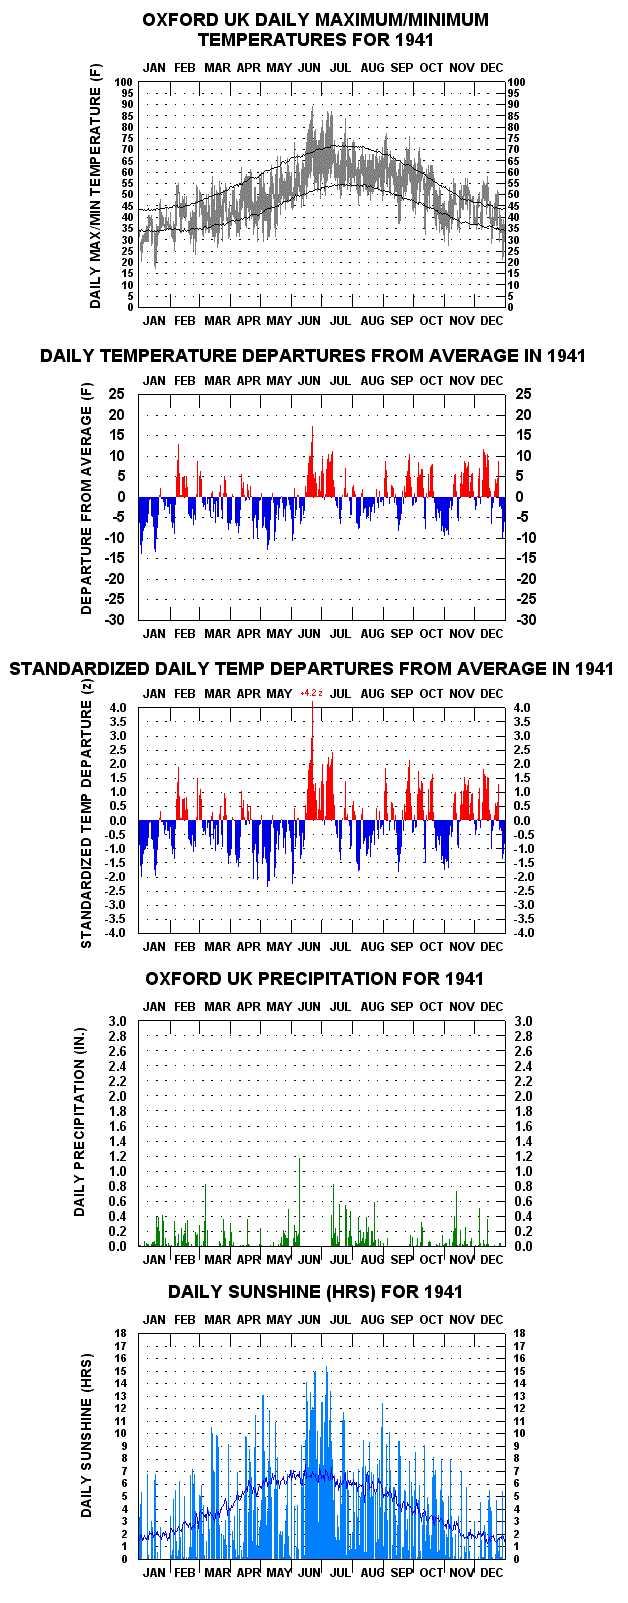
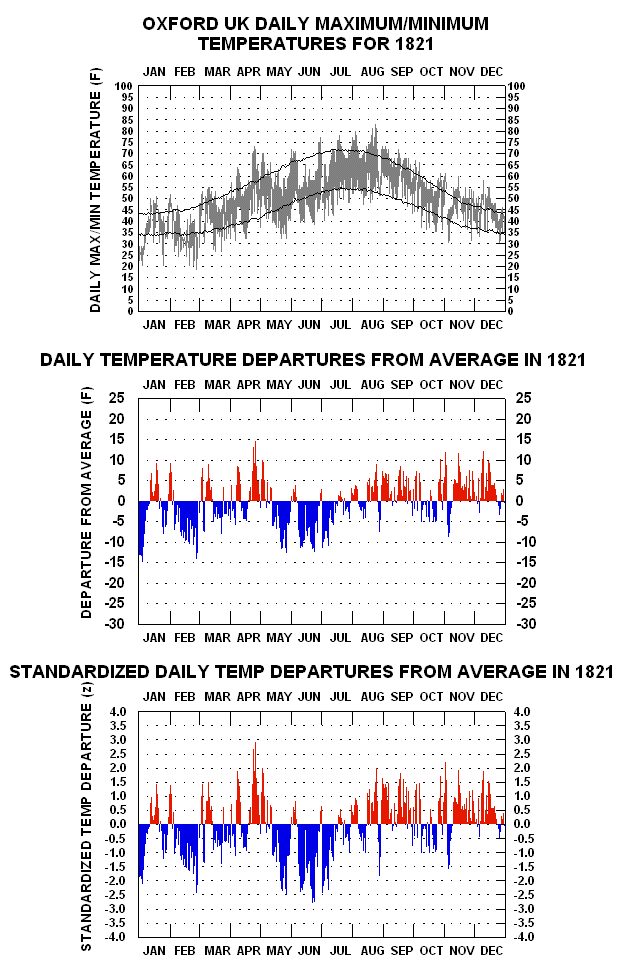
89 F/66 F max/min on 22 June, 4.2 standard deviations above average for the day (based on 1815–2021 daily means).
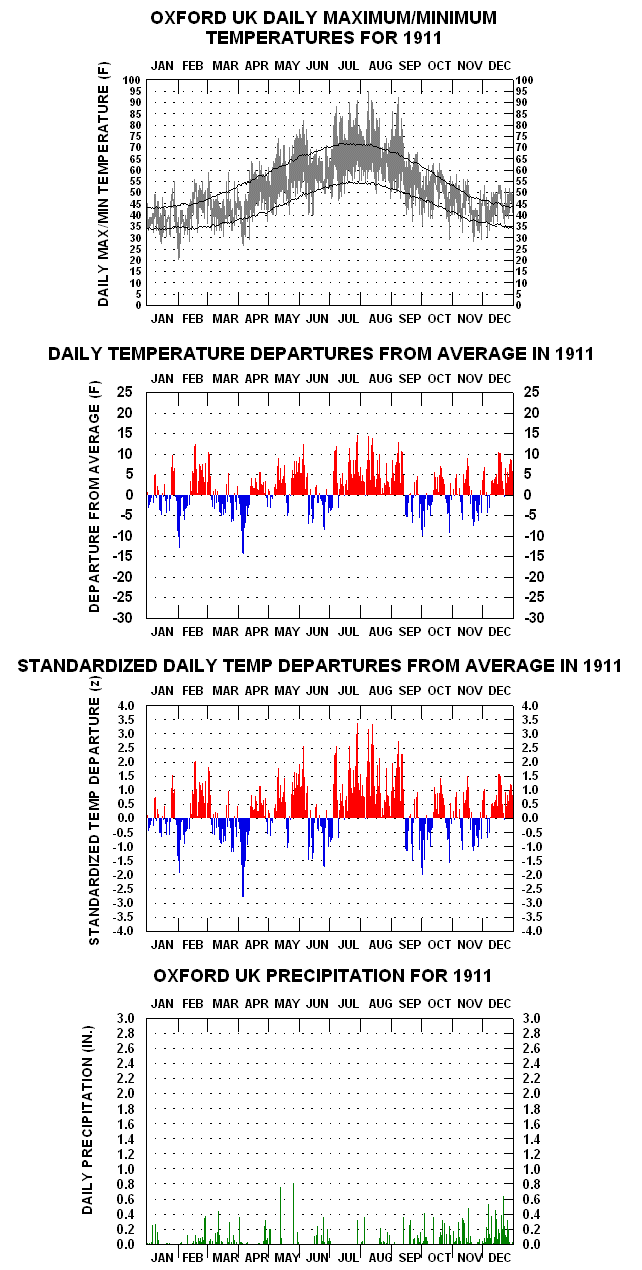
Nine-week spell of continuously above-average daily temperatures from July through early September, including 95 F in early August, the highest temperature yet recorded in the history.
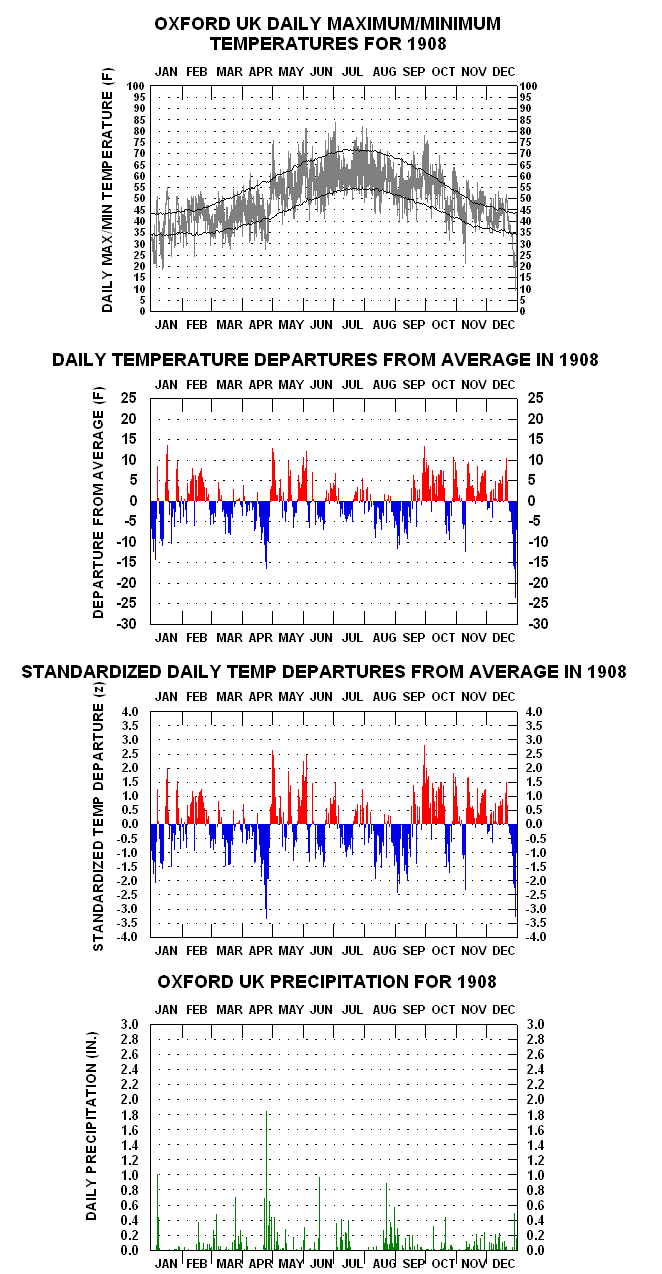
In late April, a pronounced five-day changeover from unseasonably cold to unseasonably warm conditions.
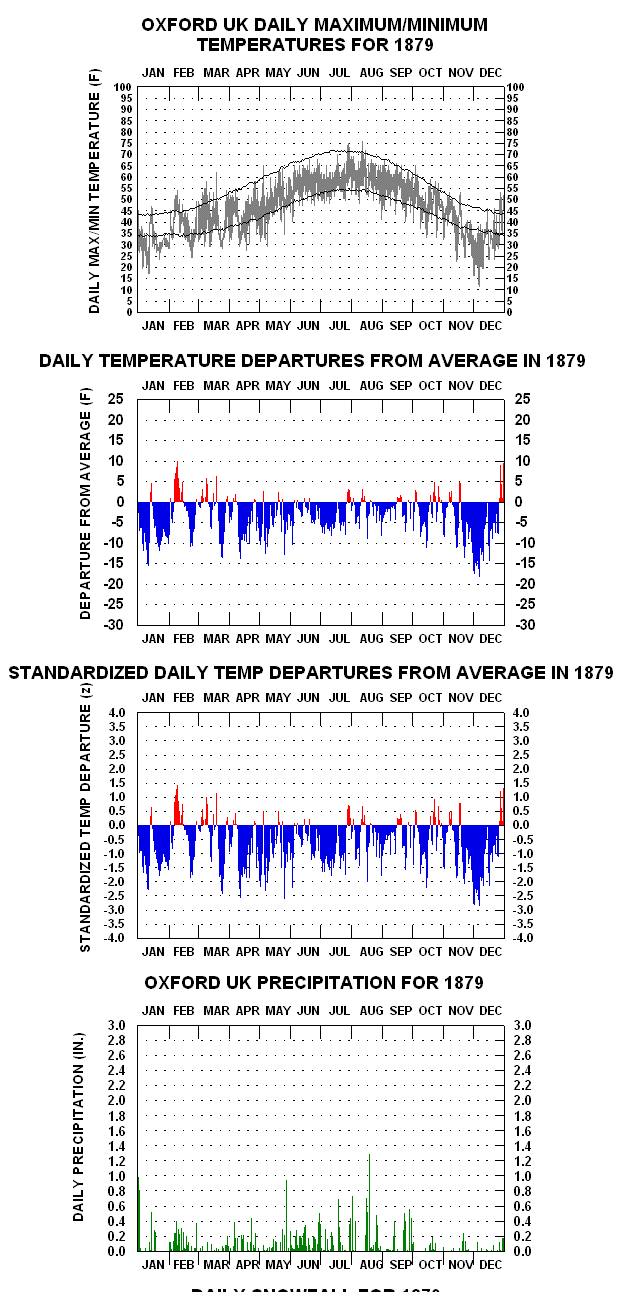
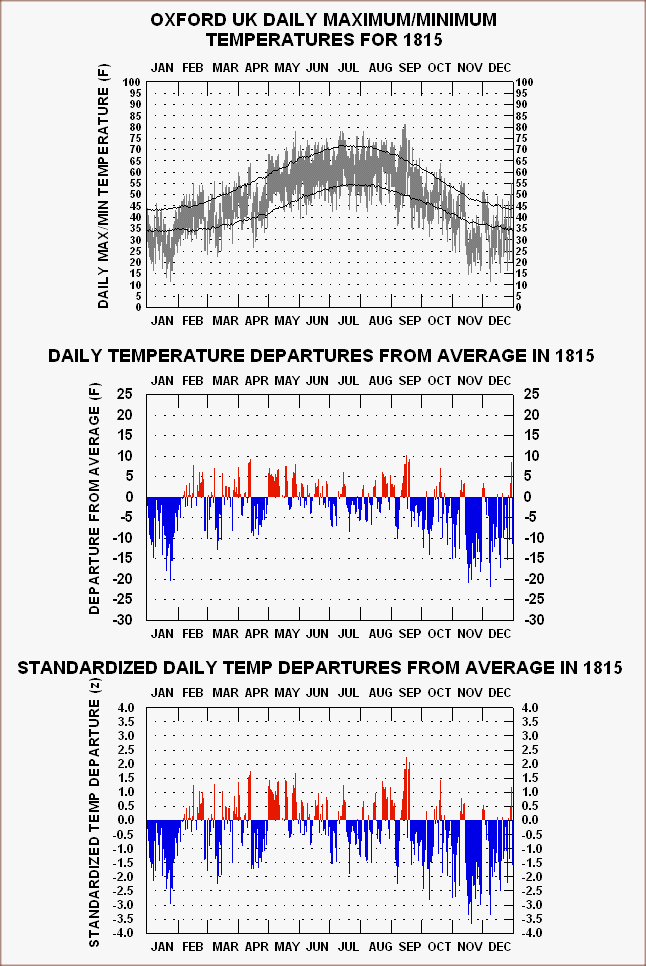
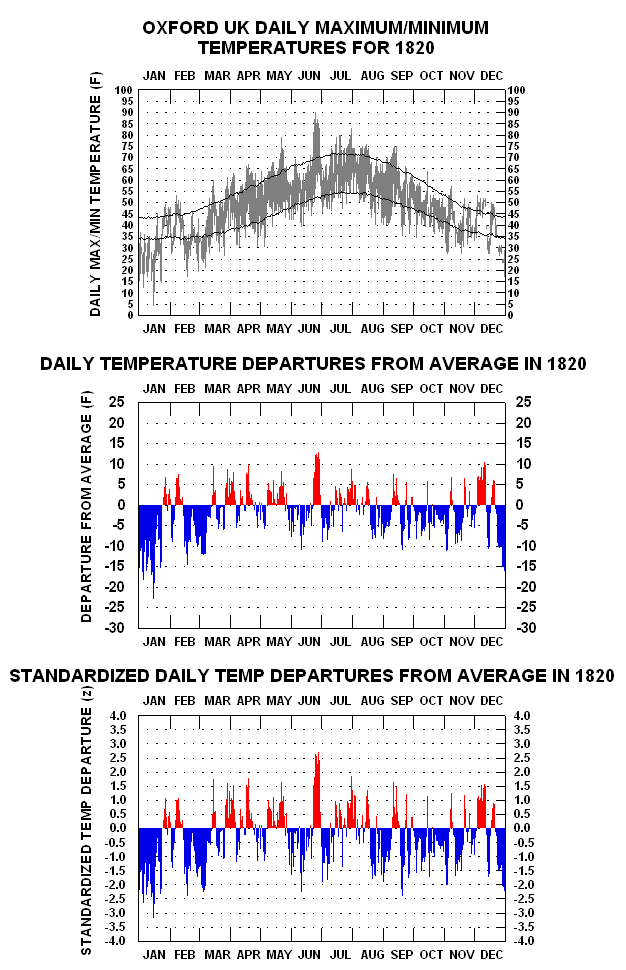
Coldest year of the entire history (45.9 F).
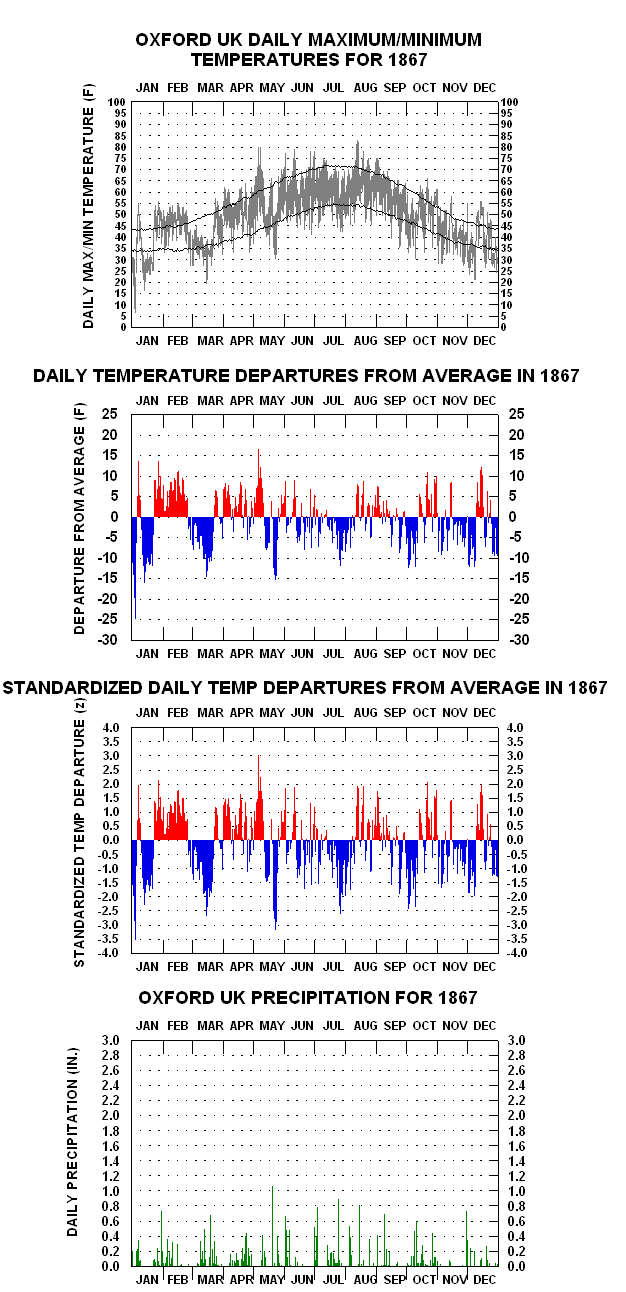
Alternating mixture of both extreme cold and warm spells over the year.
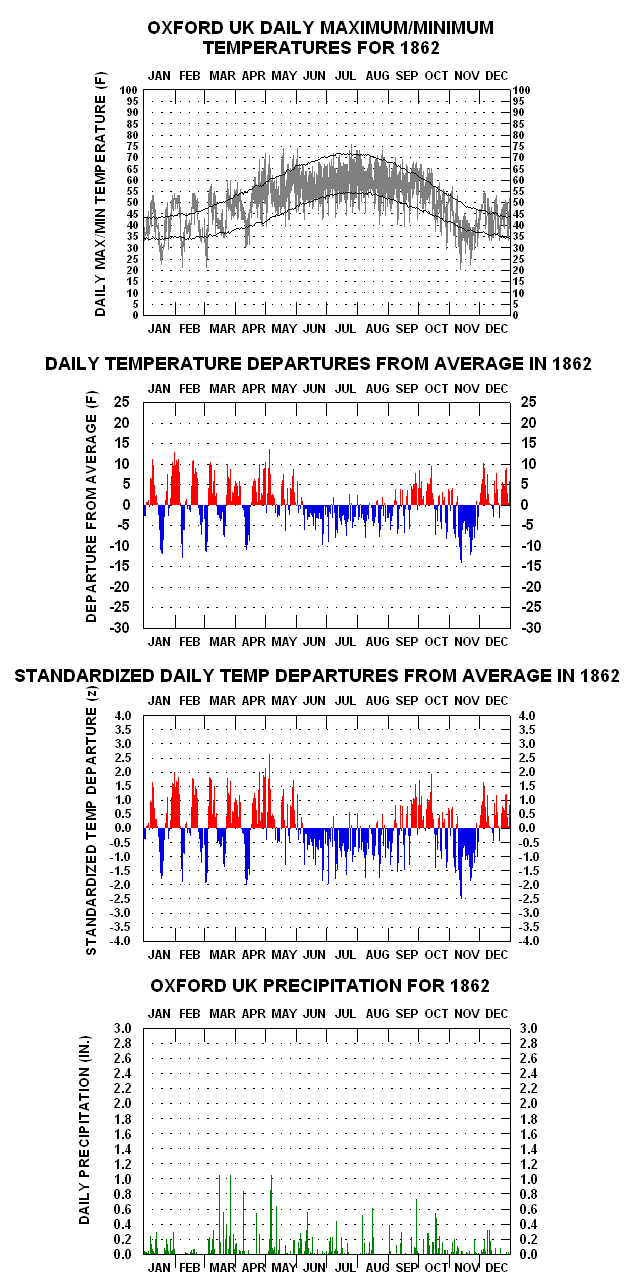
Striking short-period oscillations in day-to-day temperatures from January through early May.
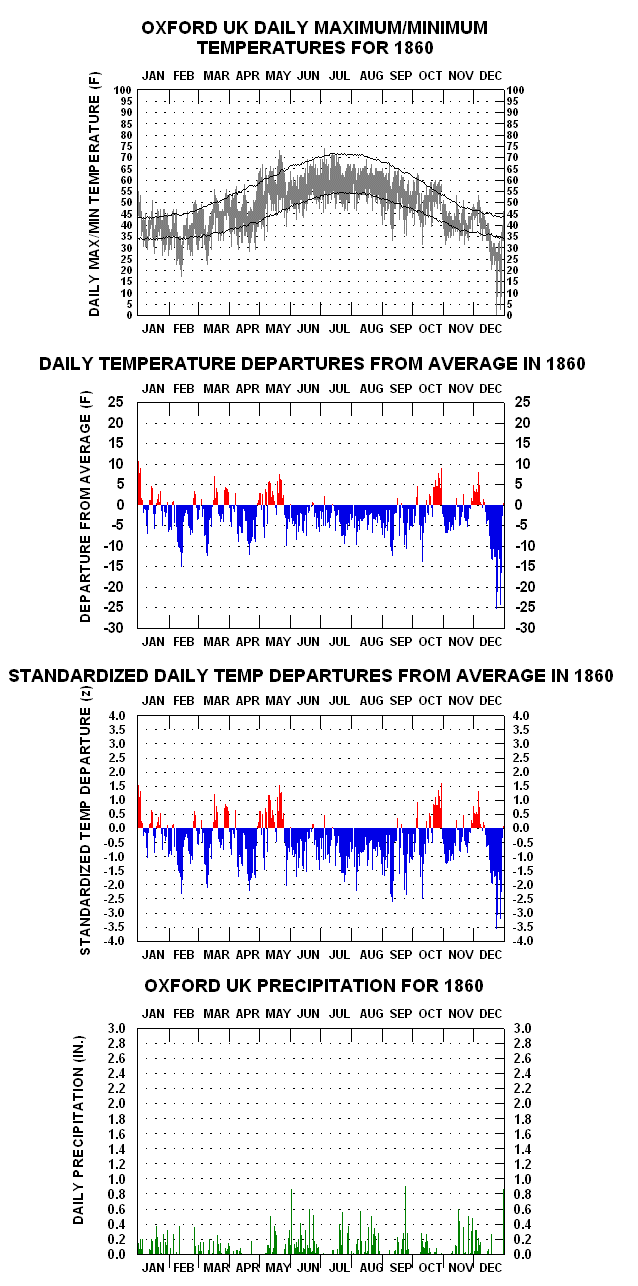
Coolest summer of the entire history (57.5 F) and the coldest daily minimum temperature in the entire history, 0 F on 24 December.
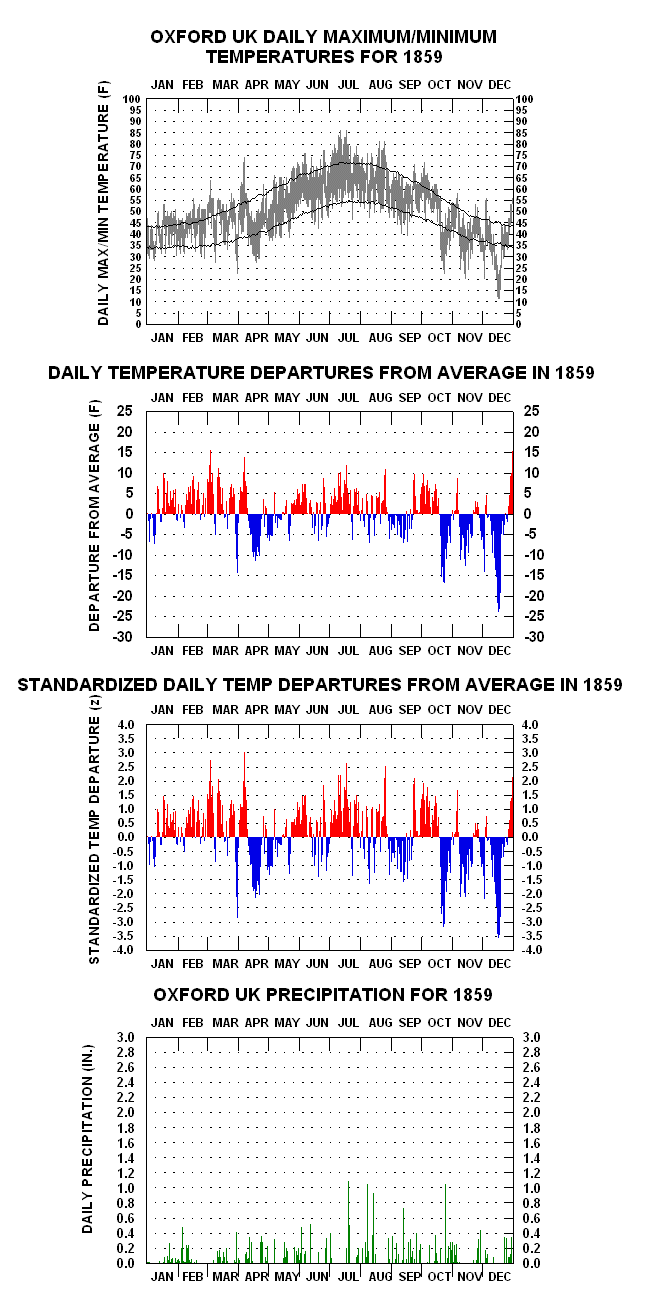
Great gyrating temperature spells over October–December.
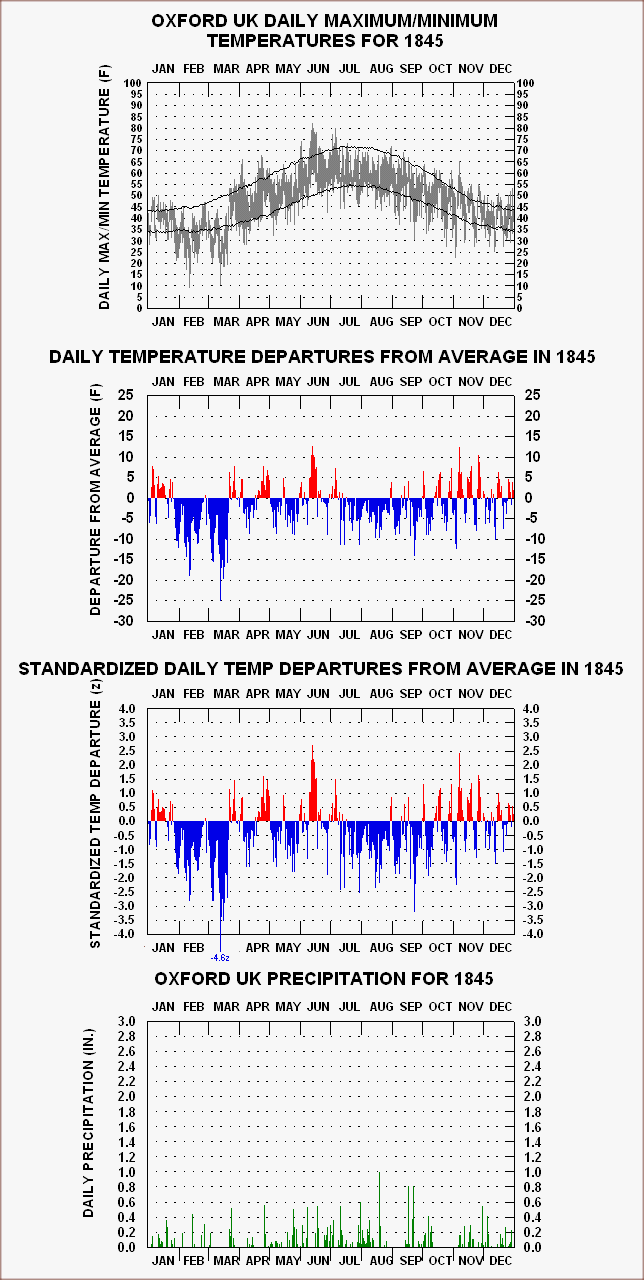
25 F/10 F max/min on 18 March, 4.7 standard deviations below average for the day (based on 1815–2022 daily means).
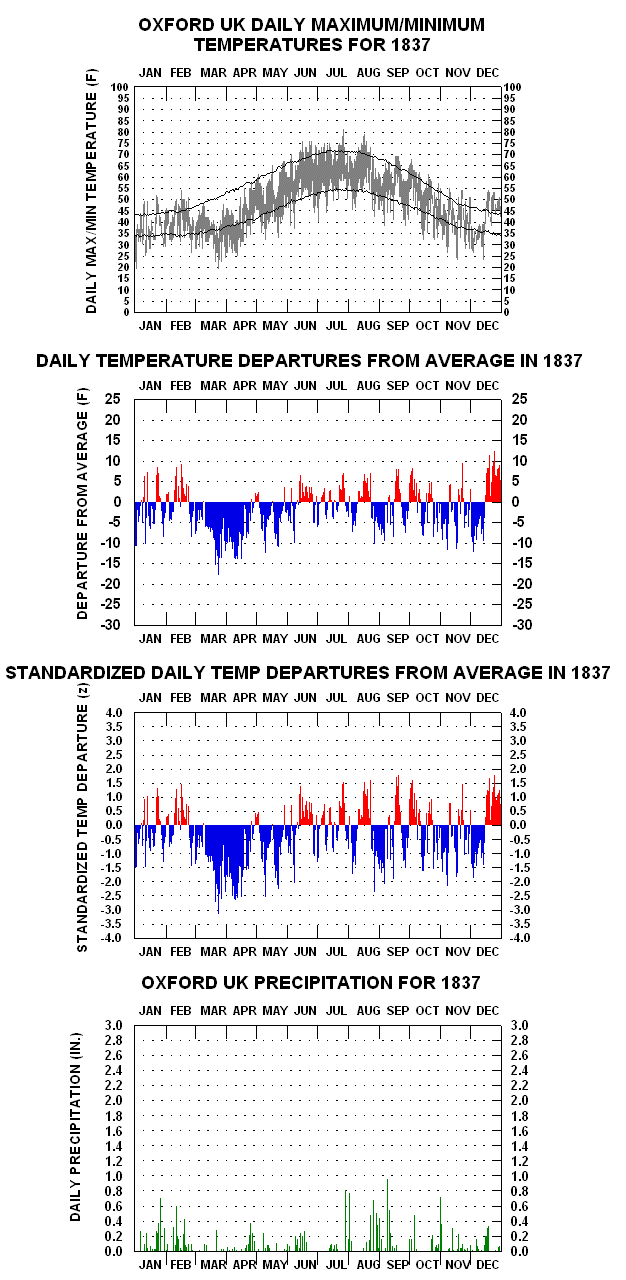
Coldest spring in the entire history (mean 41.8 F).
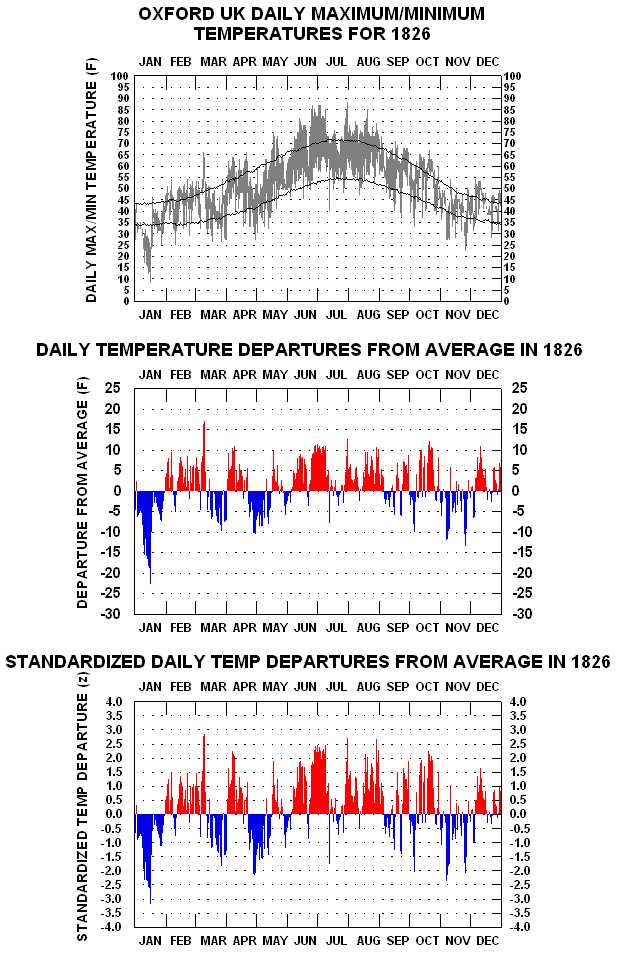
Spells of both extreme cold and warmth during the year, including a hot summer.
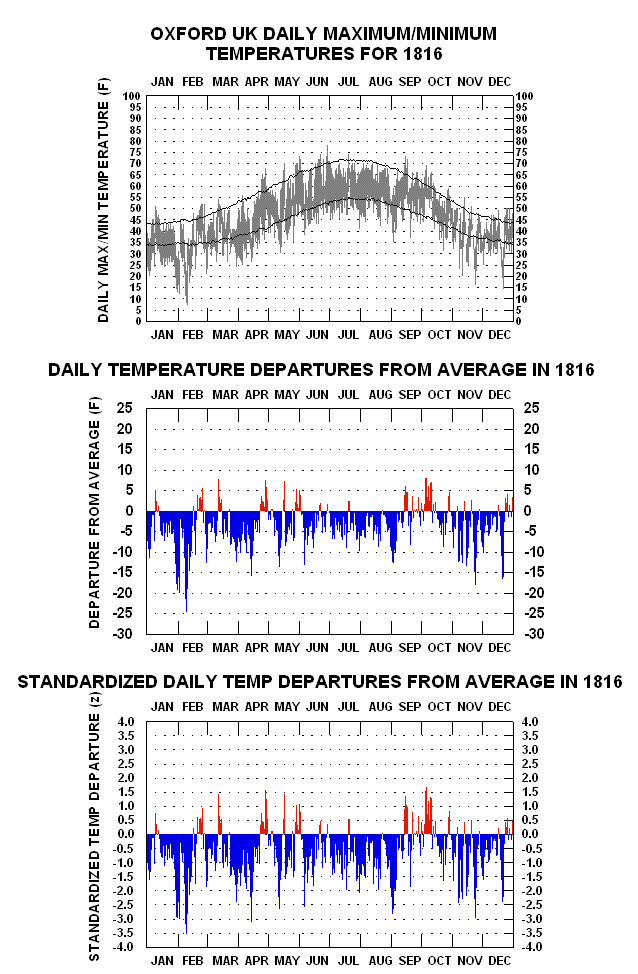
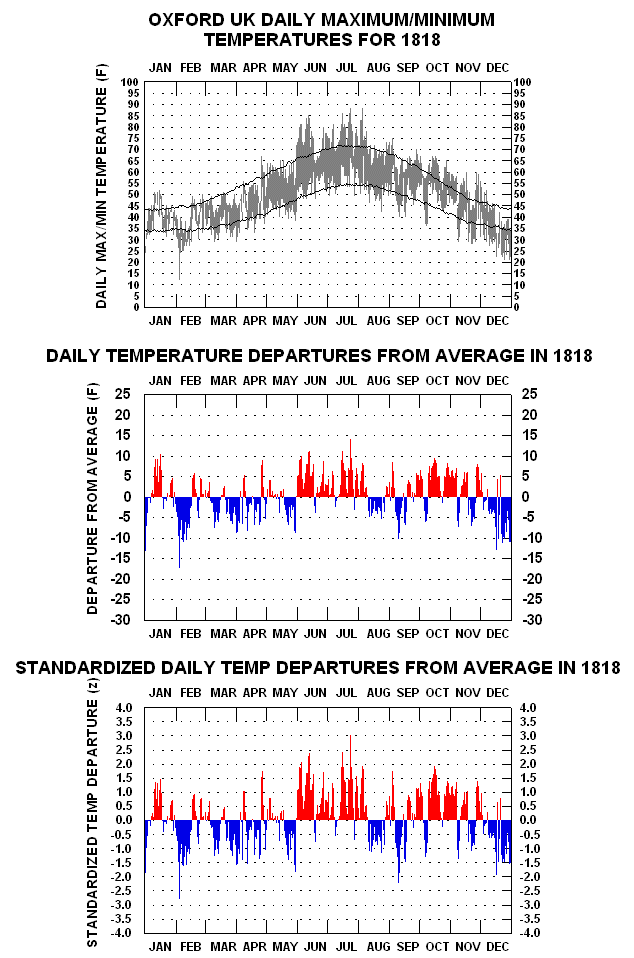
Continued response to the 1815 Tambora eruption; second coldest year in the entire history (46.1 F).

Coldest autumn in the entire history, associated with the Tambora eruption response (mean 45.6 F).
Year-to-Year Graphs — Complete Set of Links
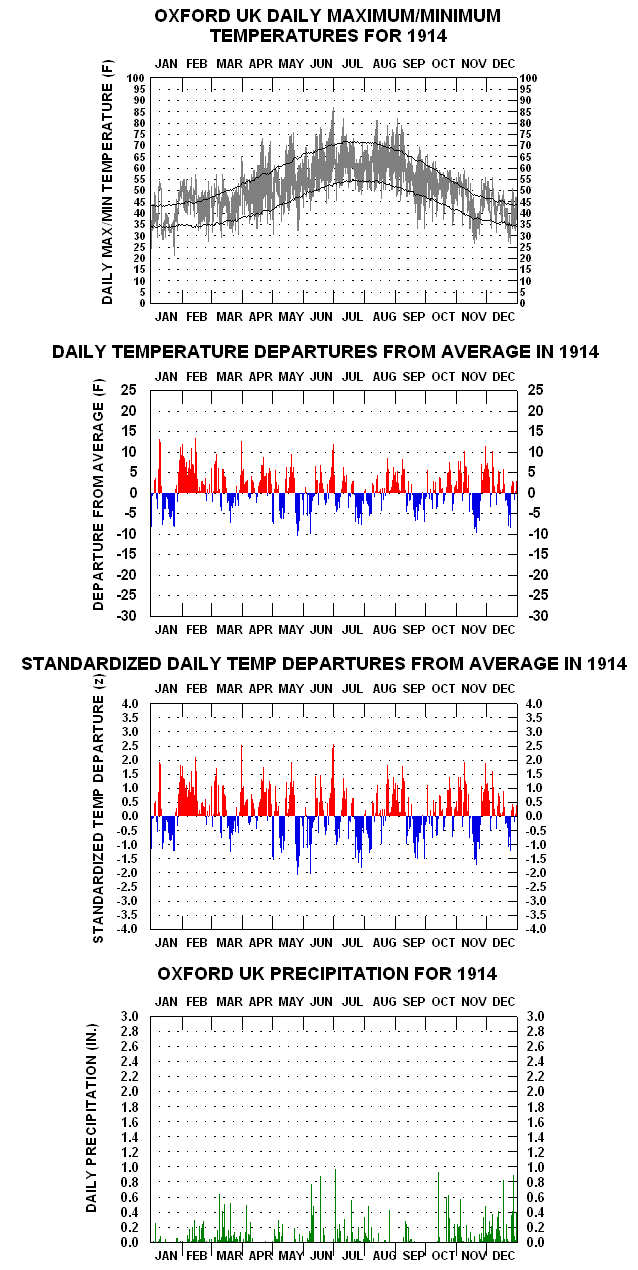
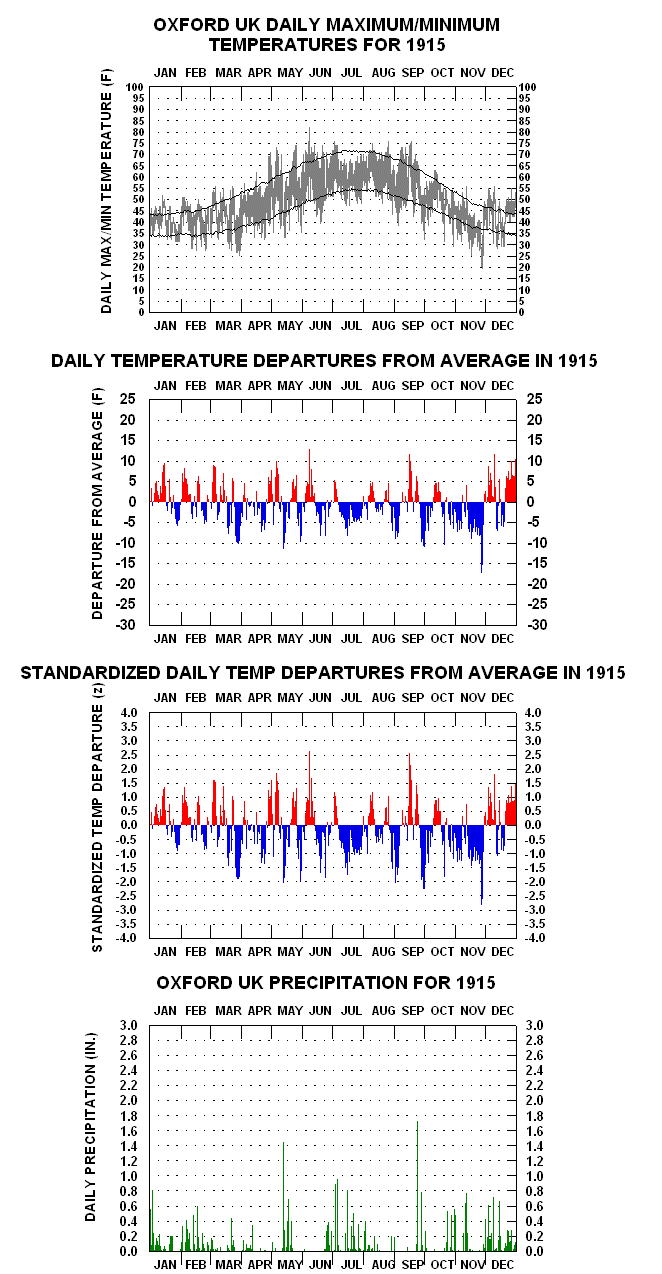
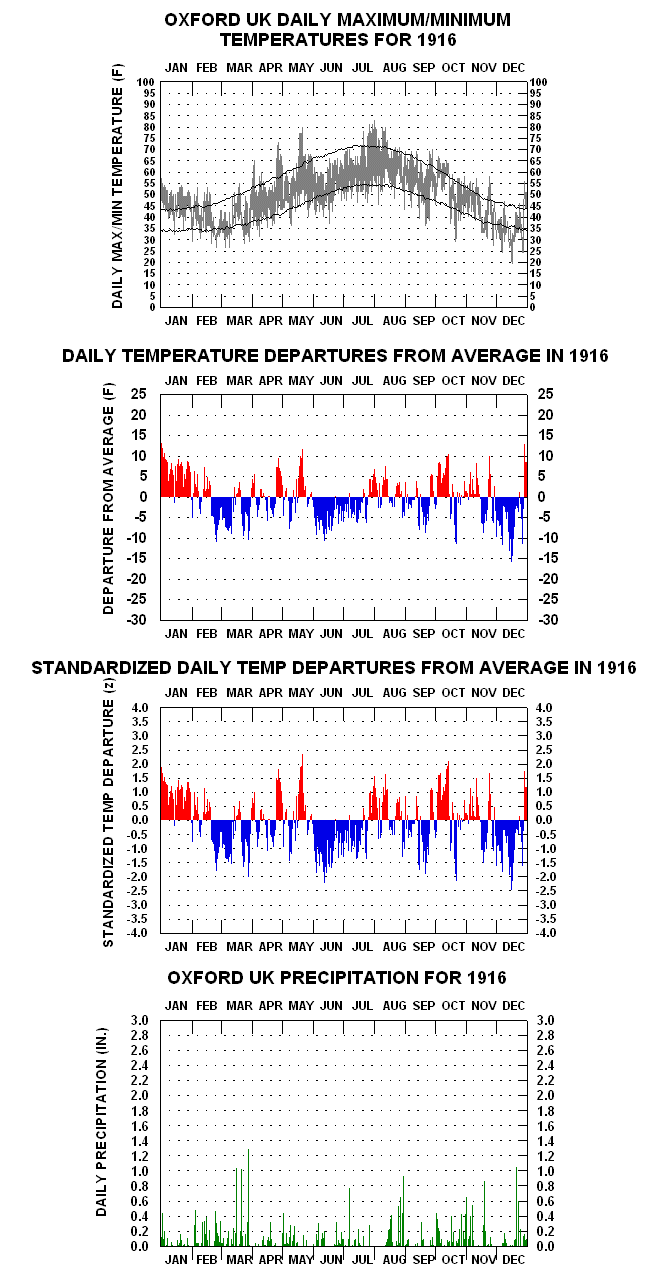
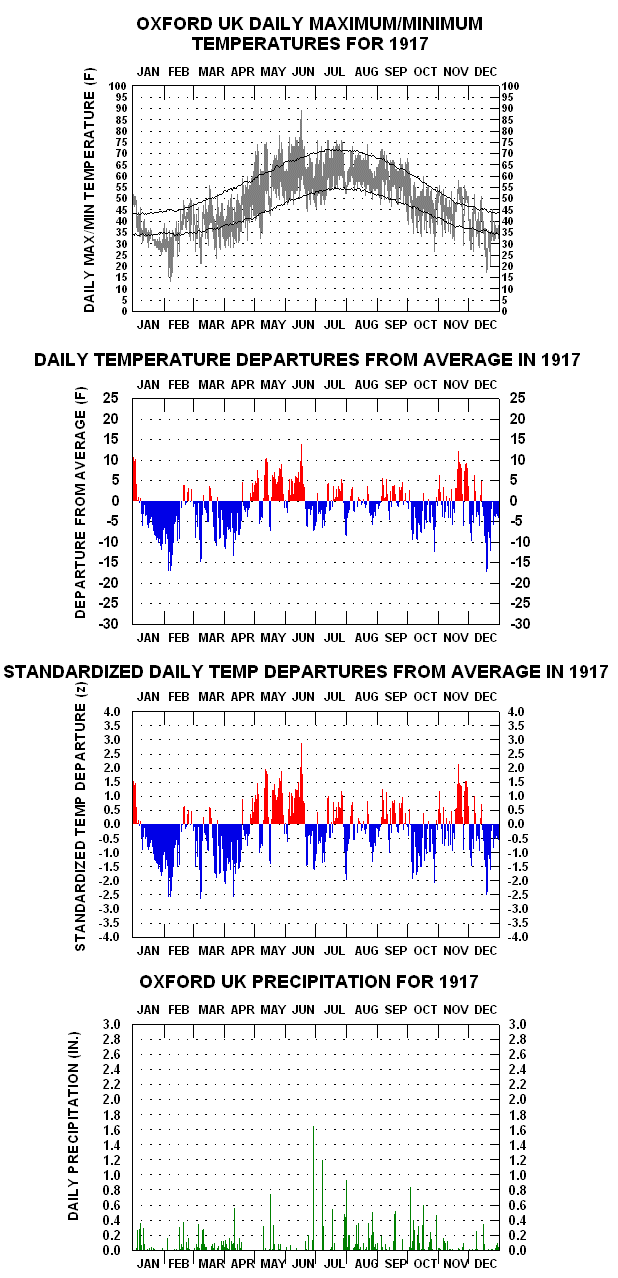

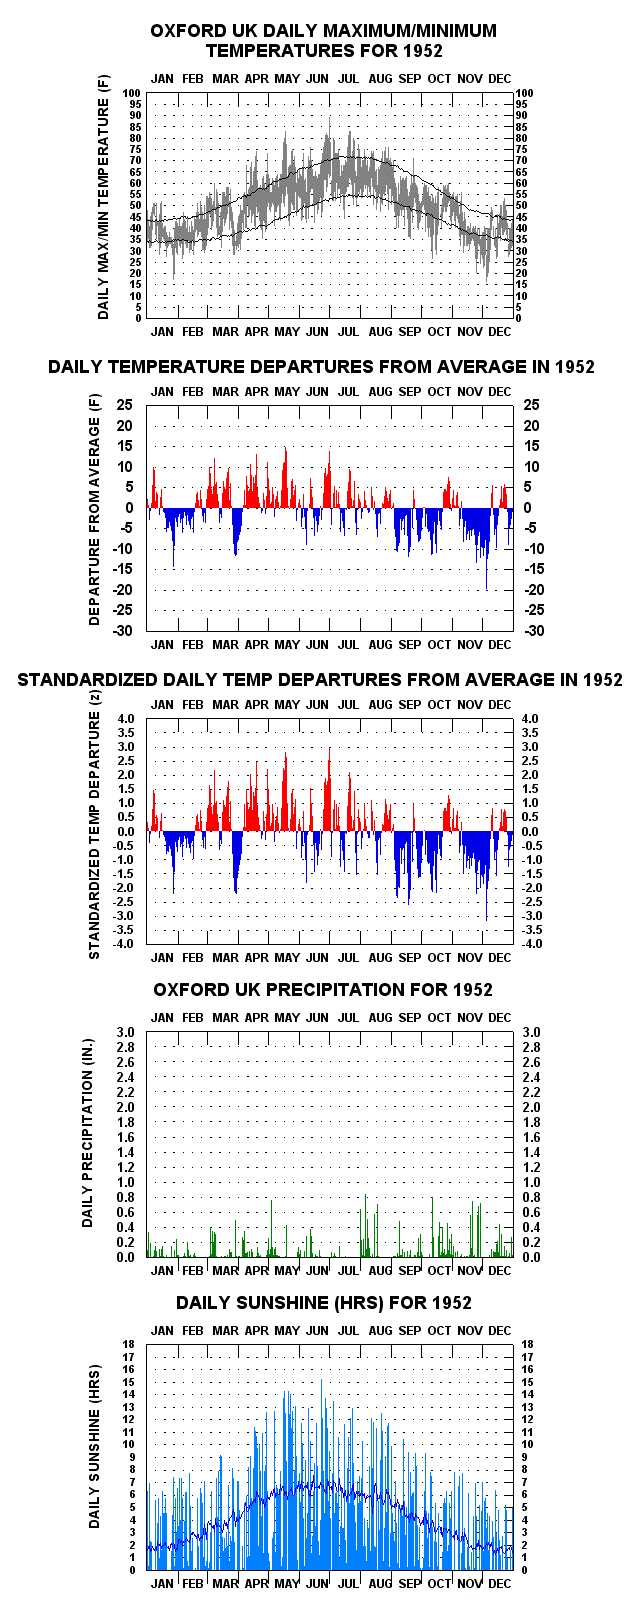
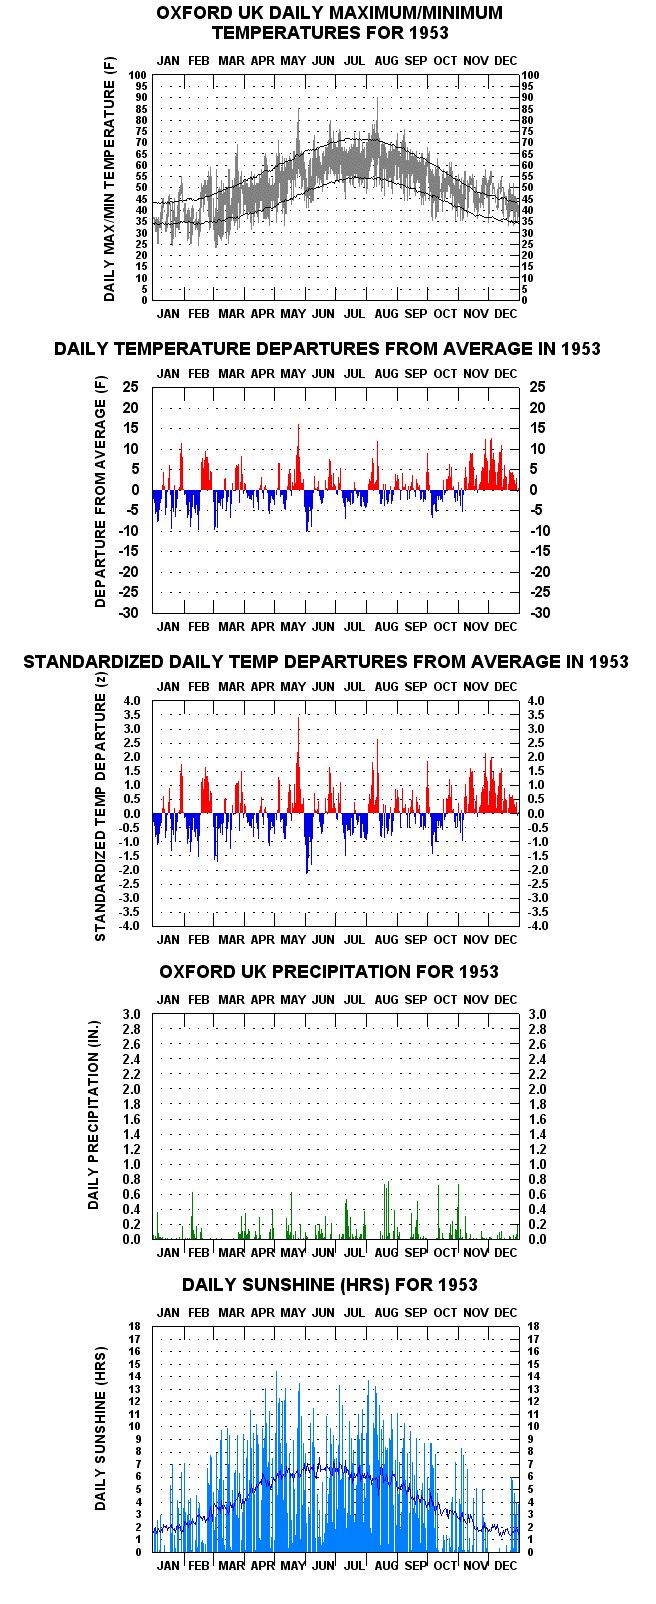
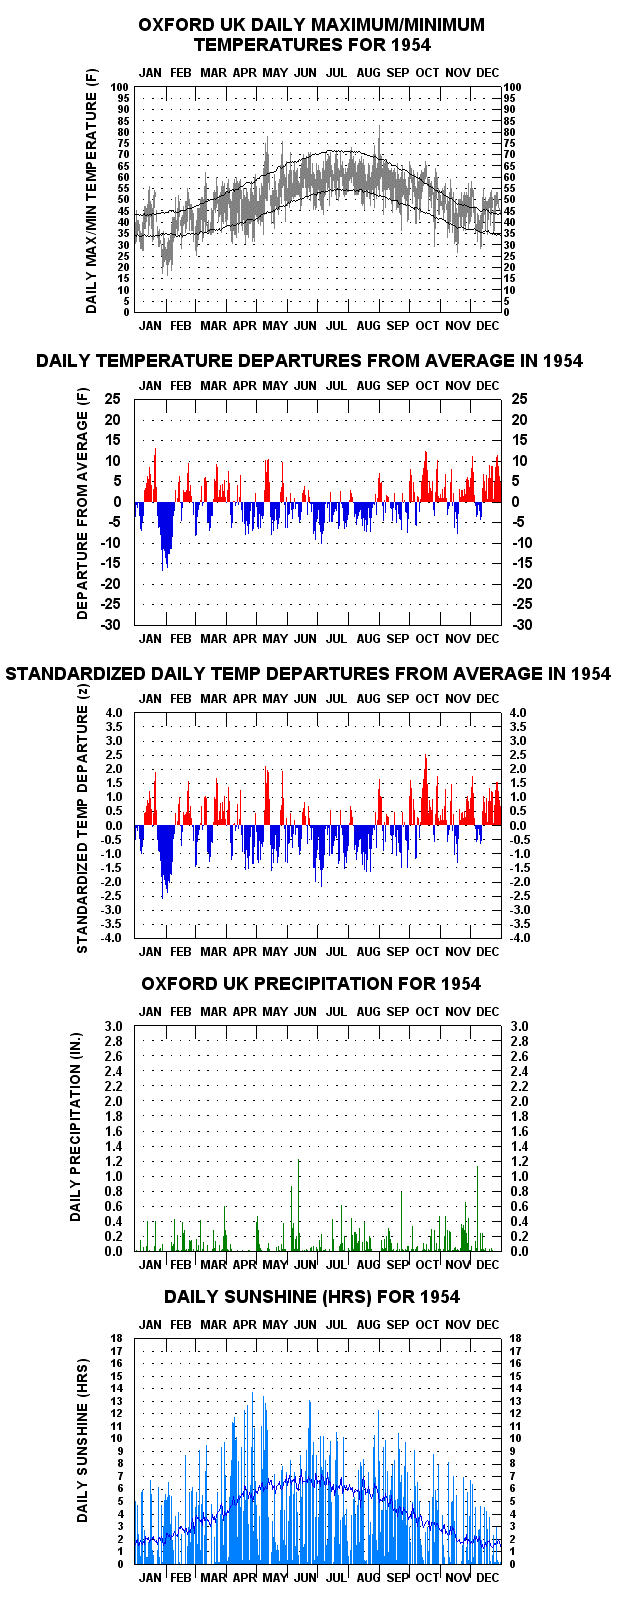
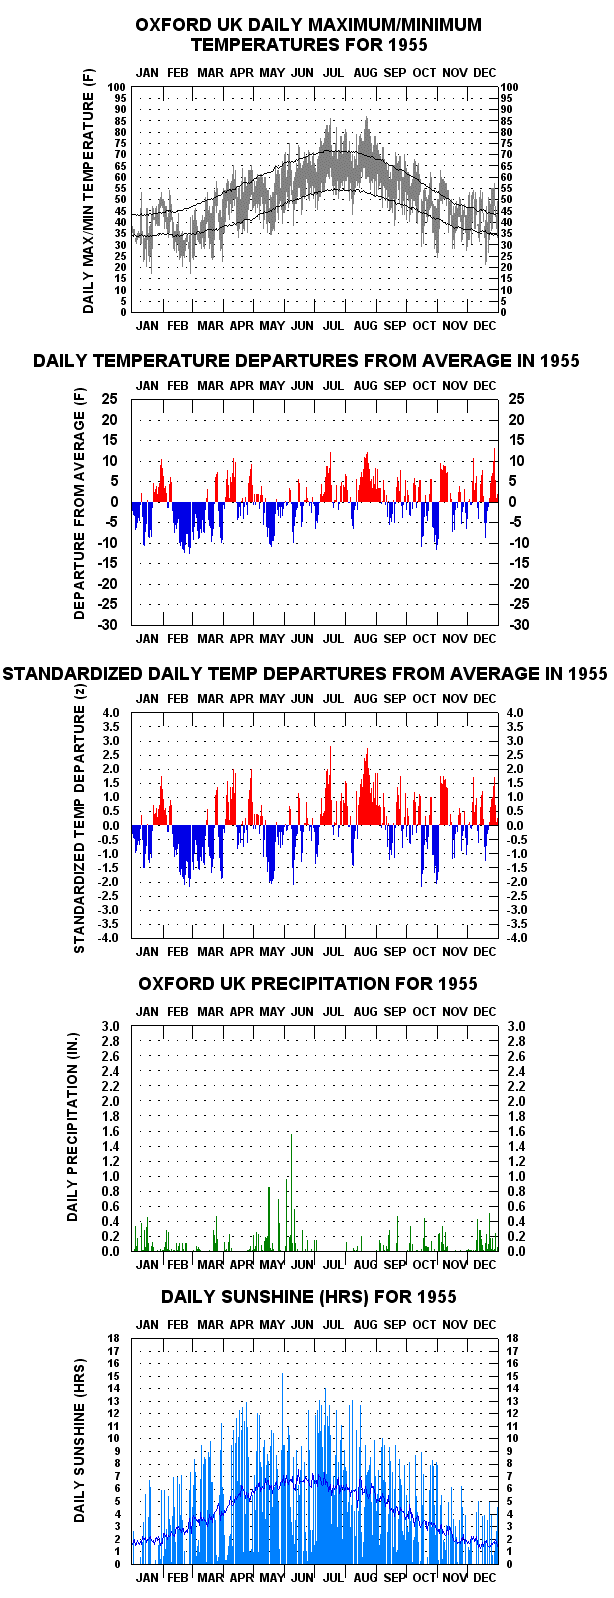
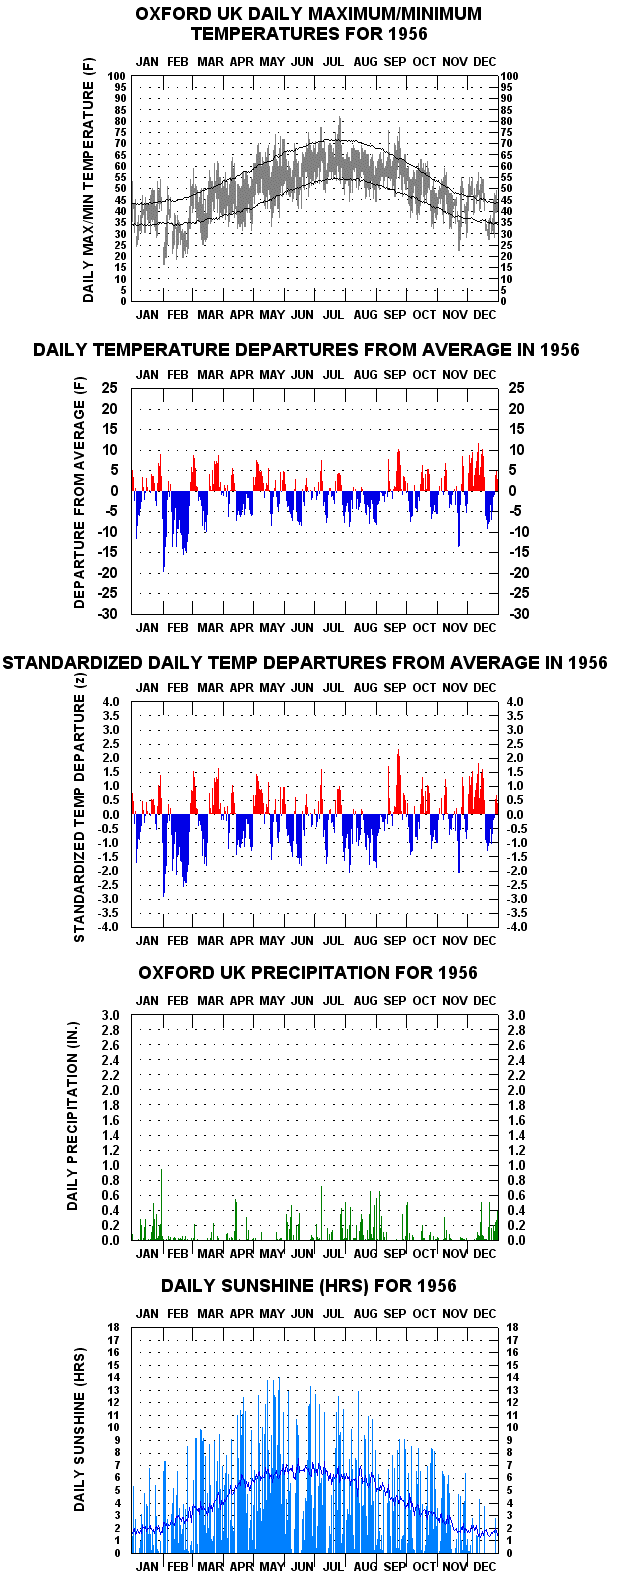
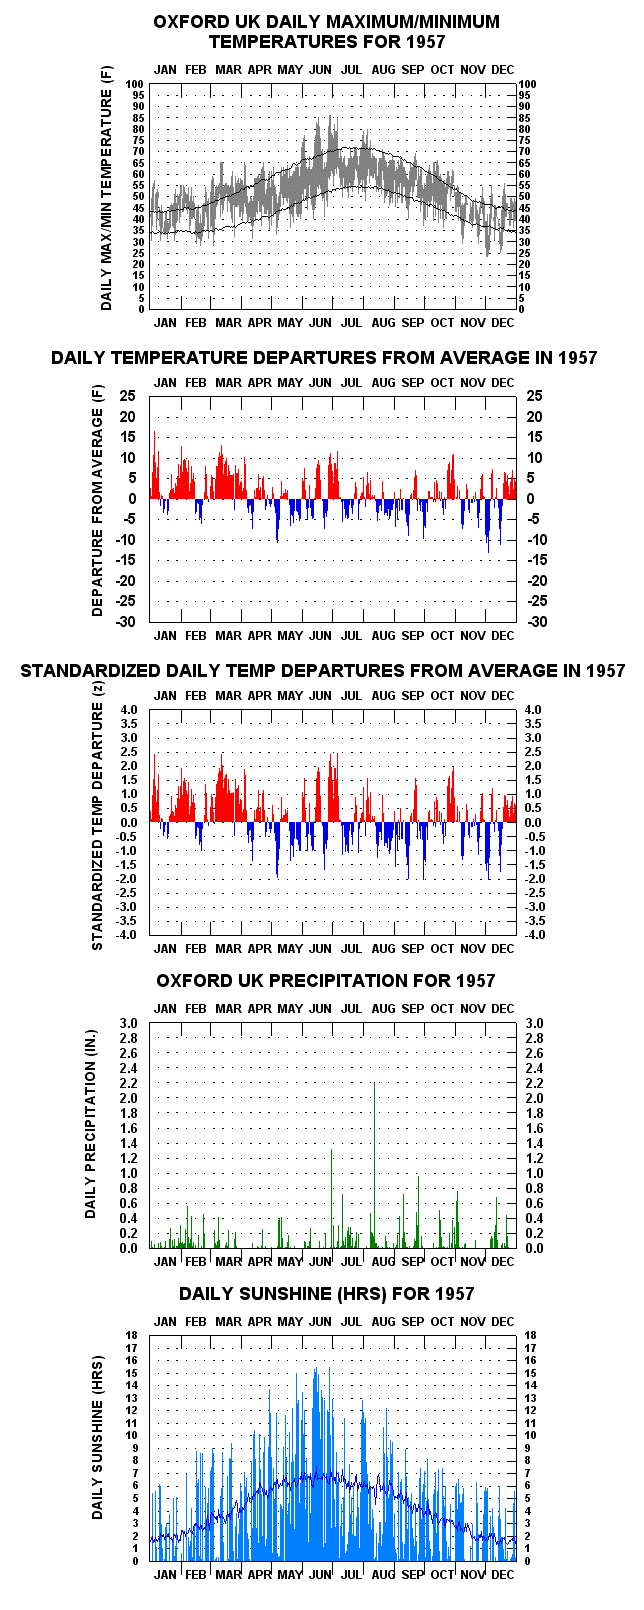
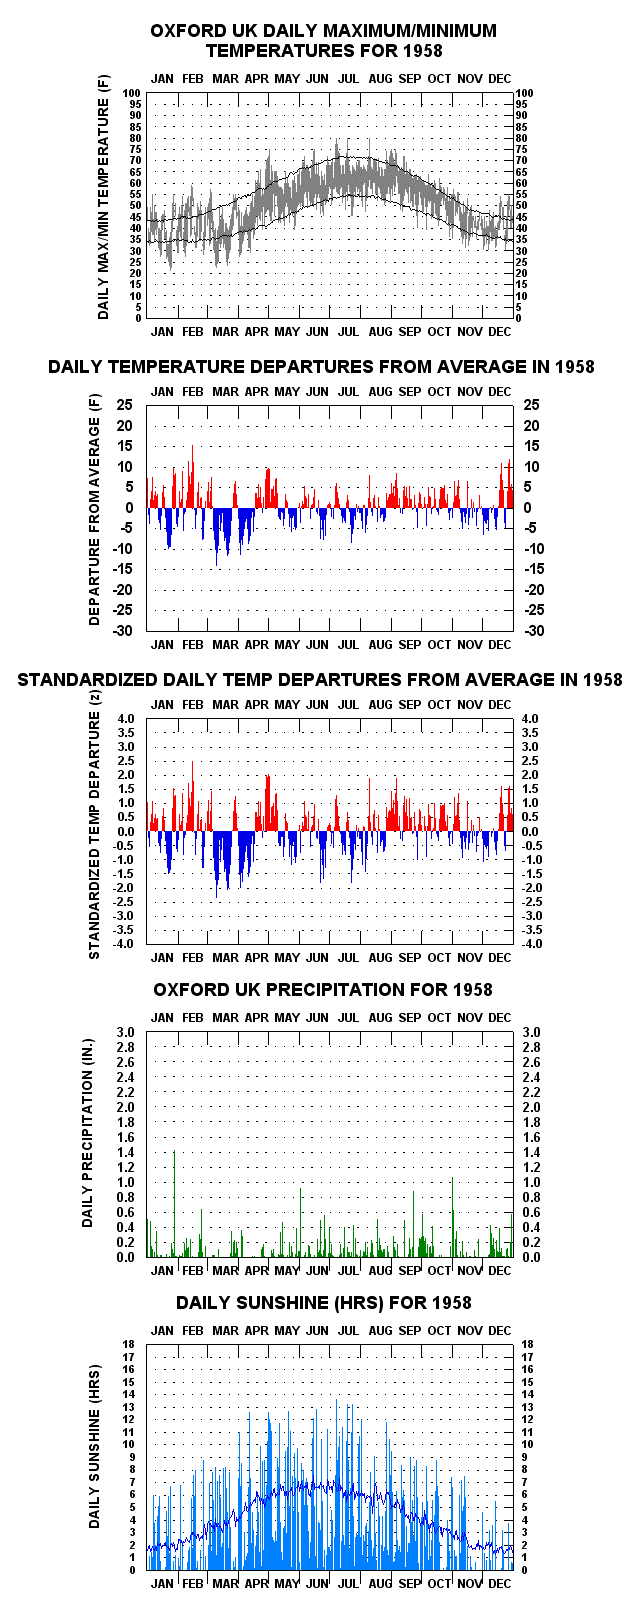
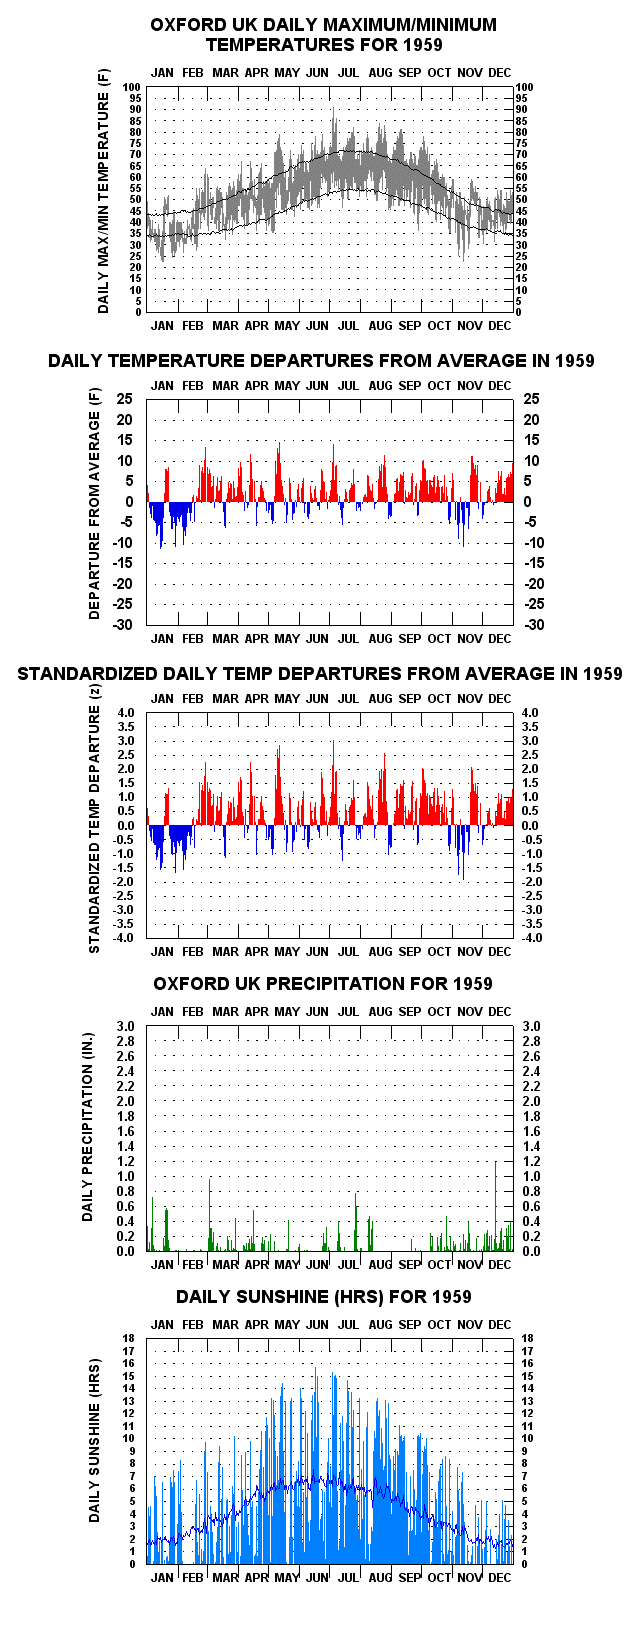

Data Collection 06Analytics
Sample Regimes, PCA Modes, PDFs & Extremes+
Rainfall+
Regimes+
Sample analysis: group years by recurring seasonal rainfall patterns for Oxford, then compare transitions between common, unusual and persistent regimes. This is sample Analytics content for layout and workflow testing. Replace it with the station’s verified analysis when the final material is ready.
PDFs+
Sample analysis: compare the central distribution and tail behavior of daily rainfall observations at Oxford. This is sample Analytics content for layout and workflow testing. Replace it with the station’s verified analysis when the final material is ready.
Temperature+
PCA Modes+
Sample analysis: demonstrate how leading modes can separate broad temperature variability variability from shorter-lived anomalies at Oxford. This is sample Analytics content for layout and workflow testing. Replace it with the station’s verified analysis when the final material is ready.
Extremes+
Sample analysis: review the upper and lower tails of the temperature record for Oxford and identify years that merit detailed chart interpretation. This is sample Analytics content for layout and workflow testing. Replace it with the station’s verified analysis when the final material is ready.
Sea-Level Pressure+
Regimes+
Sample analysis: group years by recurring pressure patterns for Oxford, then compare transitions between common, unusual and persistent regimes. This is sample Analytics content for layout and workflow testing. Replace it with the station’s verified analysis when the final material is ready.
PCA Modes+
Sample analysis: demonstrate how leading modes can separate broad pressure variability variability from shorter-lived anomalies at Oxford. This is sample Analytics content for layout and workflow testing. Replace it with the station’s verified analysis when the final material is ready.
Continue Exploring
Compare Climate History Across Every Station
Browse domestic and international climate archives, long-term trends and original statistical visualizations.