

Station Overview
Graphical Climatology of Seattle: Daily Temperatures and Rainfall, by Year (1945 – Present)
The following is a graphical climatology of Seattle, Washington (Seattle-Tacoma Int’l Airport) temperatures, precipitation, and various other parameters, from 1945 into 2026. Presented are daily climatological overview charts (temperature), annual time-series (temperature and precipitation), “climograms” (hour-by-month depictions of temperature, humidity, winds, fog, blowing sand/dust, and thunderstorms), followed by year-to-year graphs that depict daily max/min temperature, daily mean temperature anomalies, daily rainfall, and when applicable daily snowfall/depths. Data were obtained courtesy of the NOAA National Climatic Data Center and the NWS-Seattle online site.
Explore the Climate Data
Use these shortcuts to move directly to the principal charts, analyses and historical records.
Climate Overview Graphs — RECENT YEARS
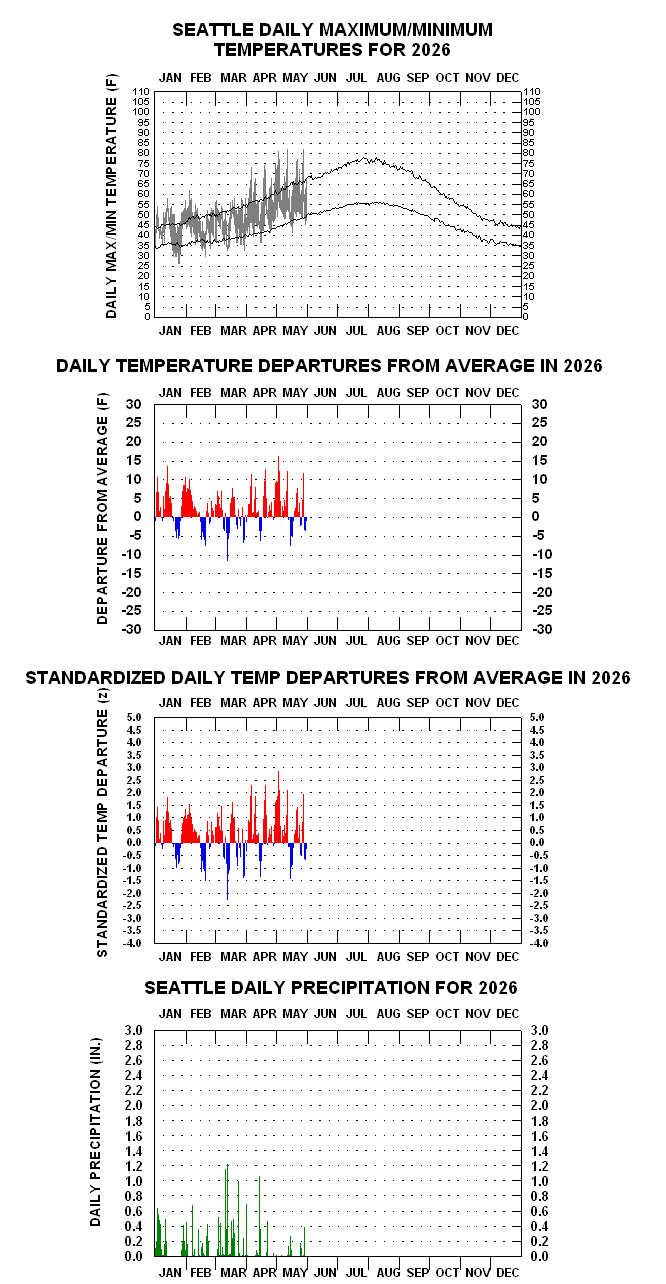
- 2026 Daily Temperature/Precipitation Graphs for Seattle New(New 5/31/26)
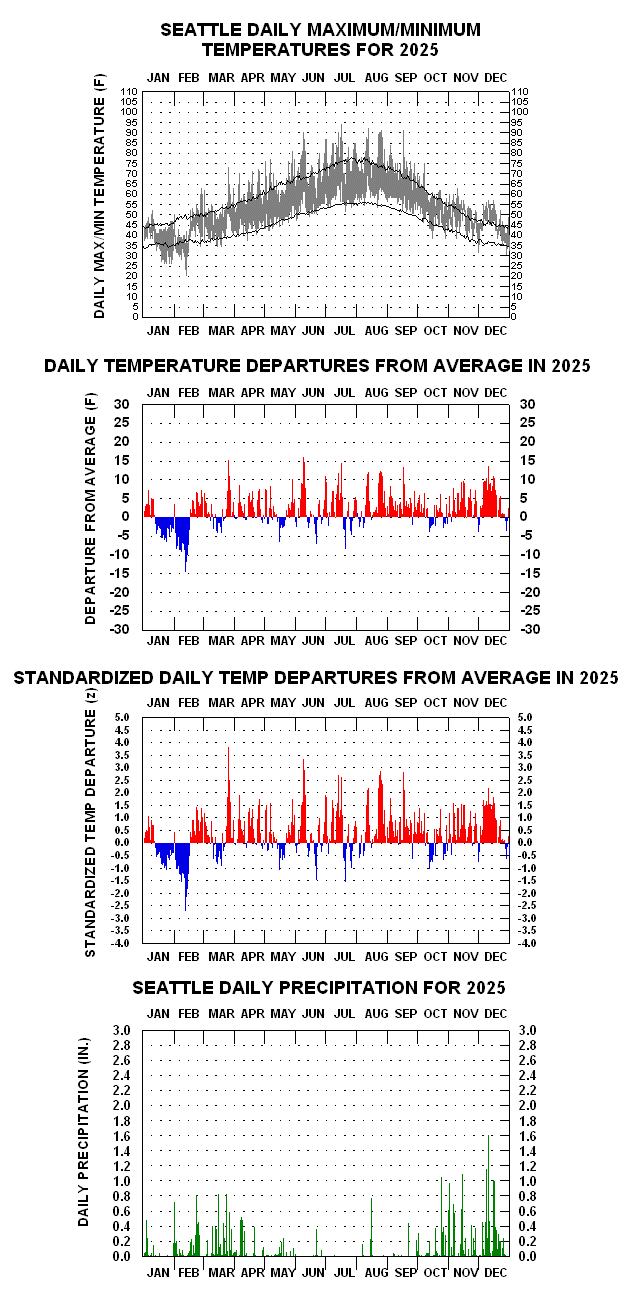
- 2025 Daily Temperature/Precipitation Graph for Seattle New(New 12/31/25)
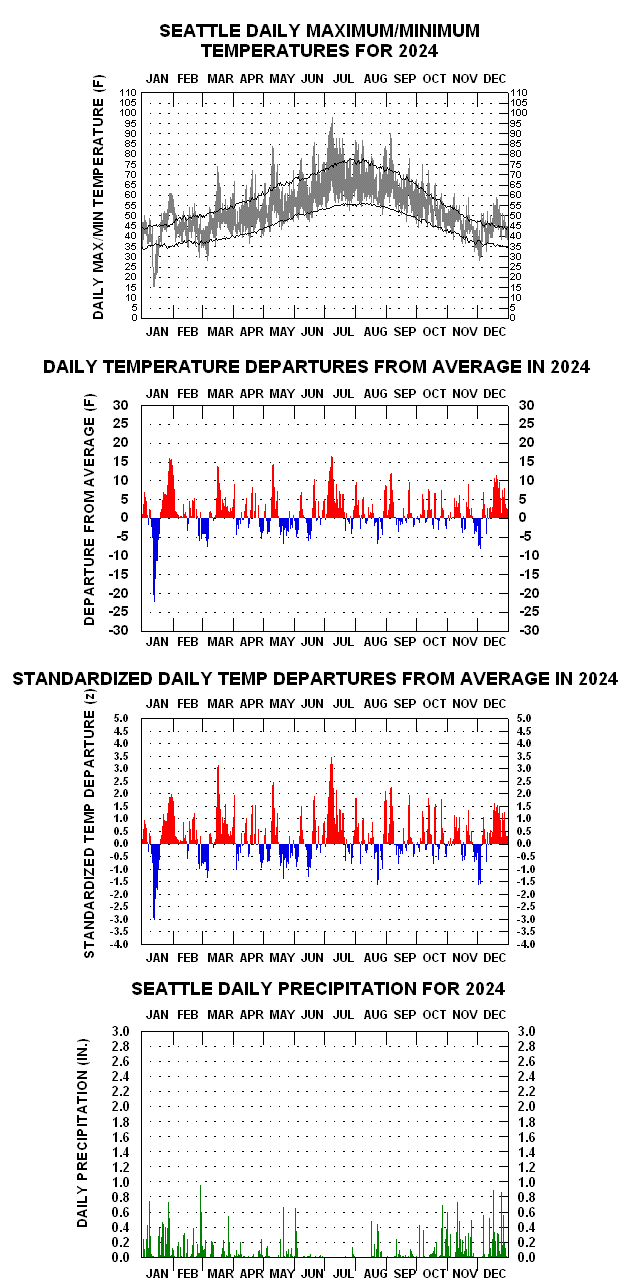
- 2024 Daily Temperature/Precipitation Graph for Seattle
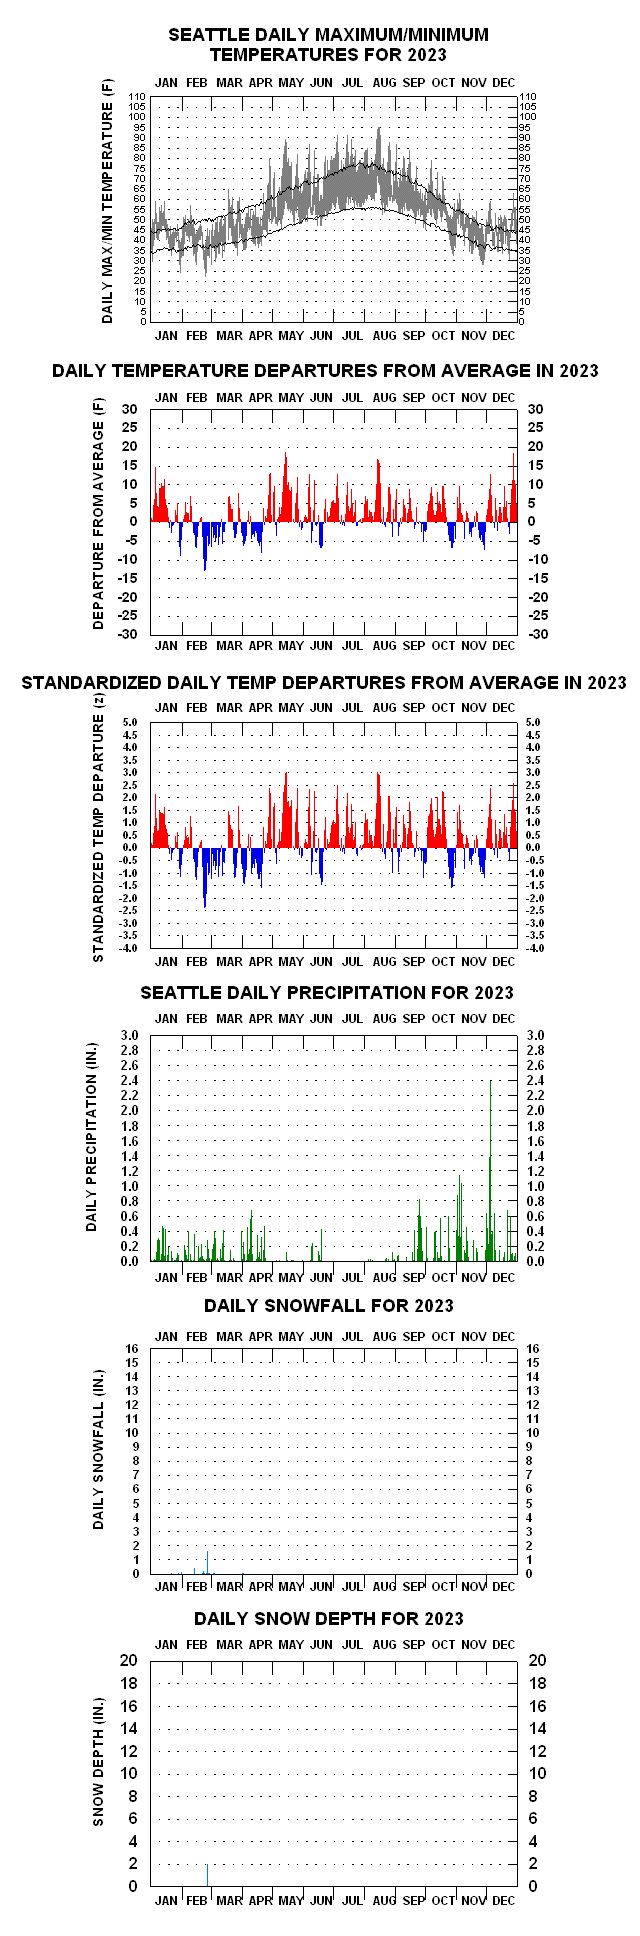
- 2023 Daily Temperature/Precipitation Graph for Seattle
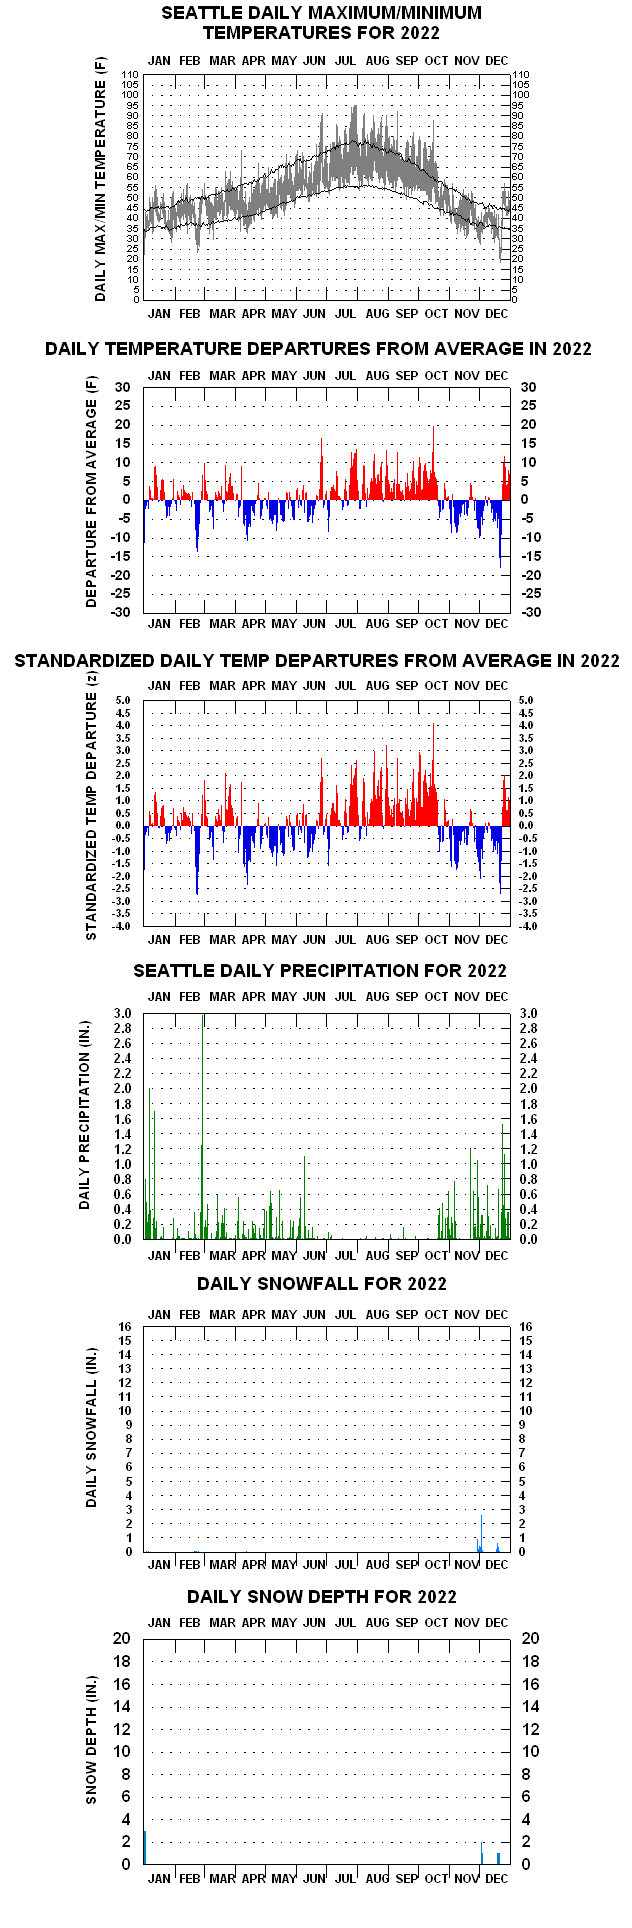
- 2022 Daily Temperature/Precipitation Graph for Seattle
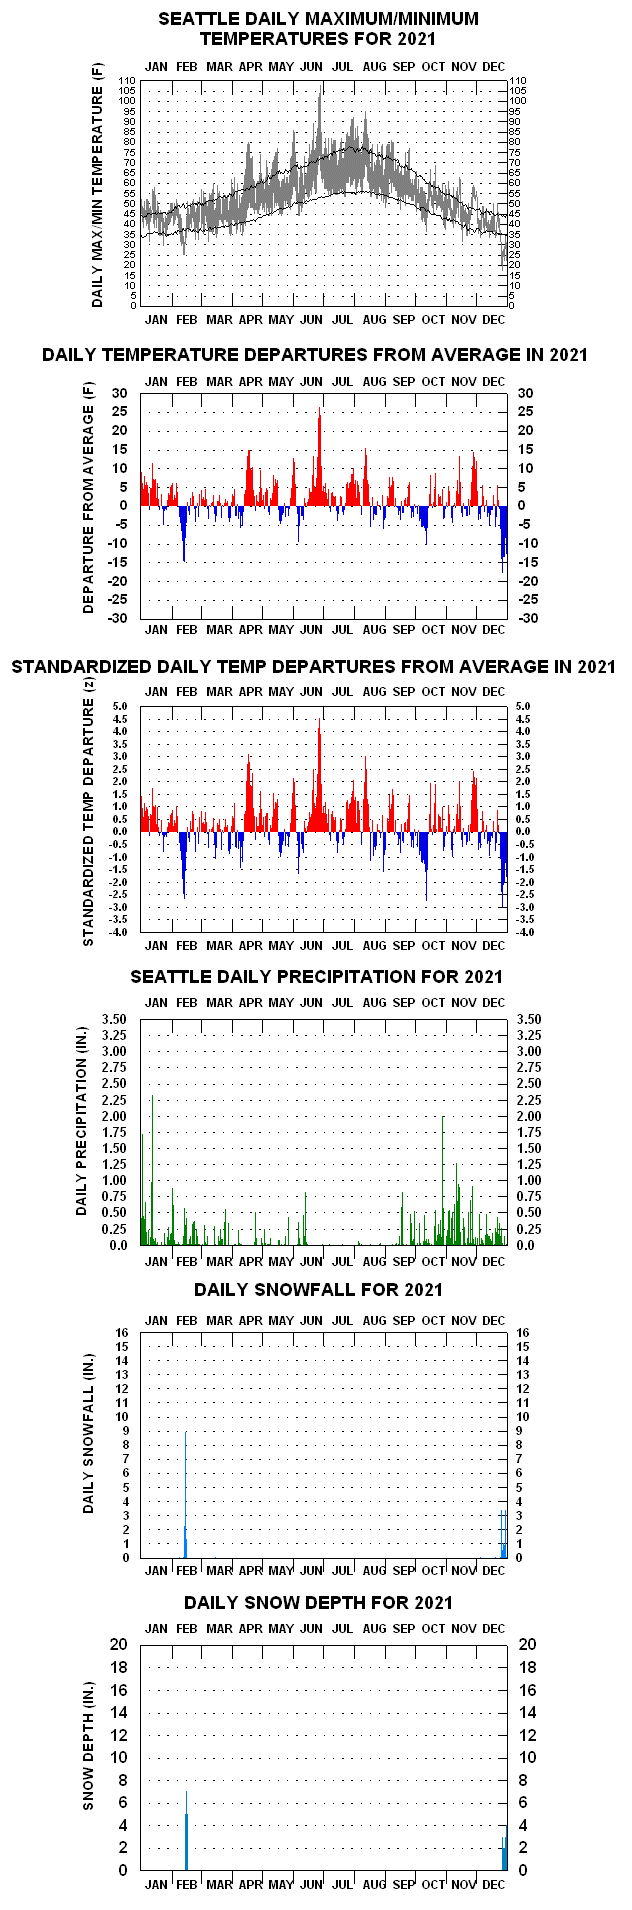
- 2021 Daily Temperature/Precipitation Graph for Seattle
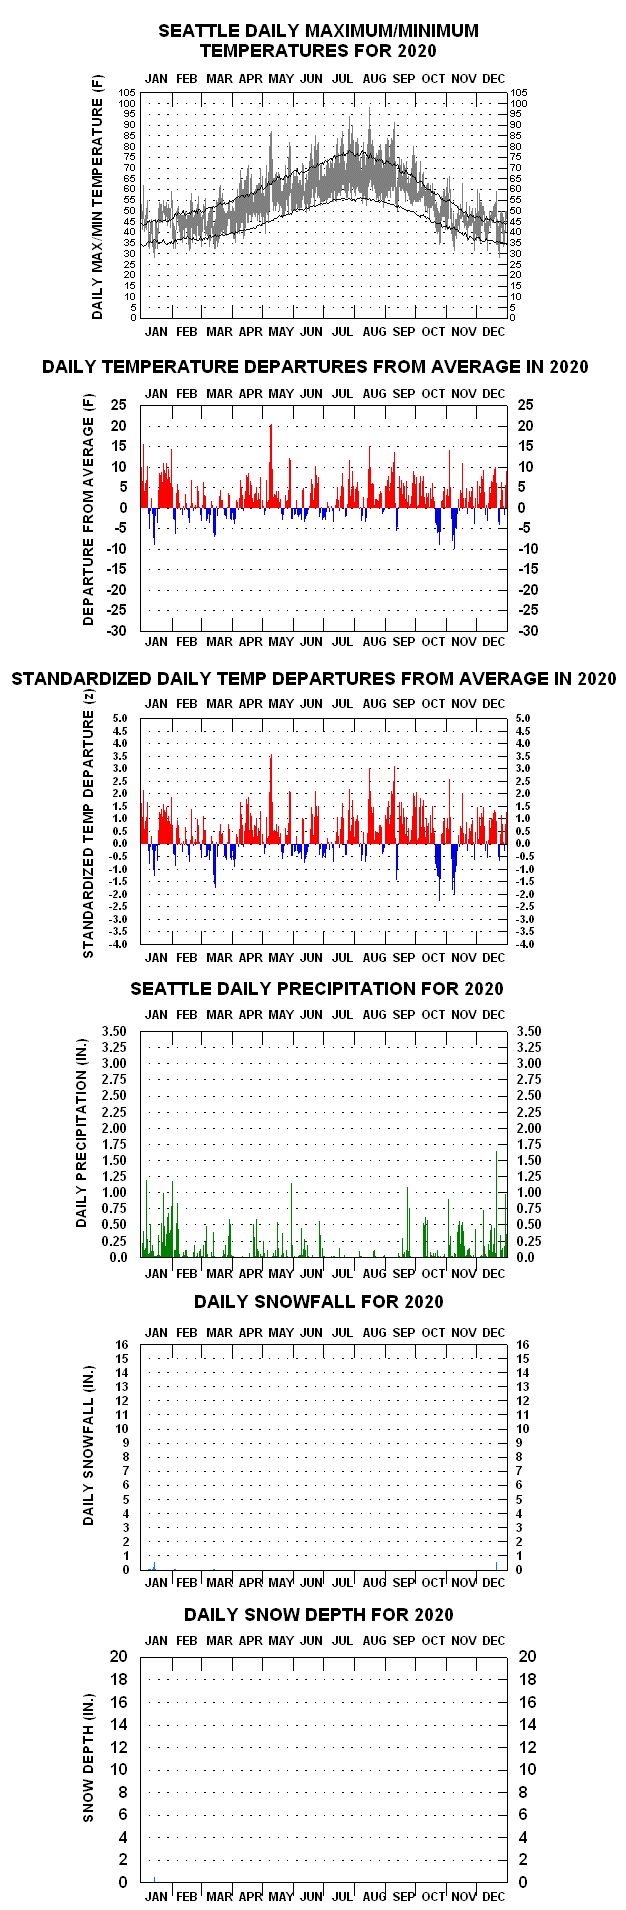
- 2020 Daily Temperature/Precipitation Graph for Seattle
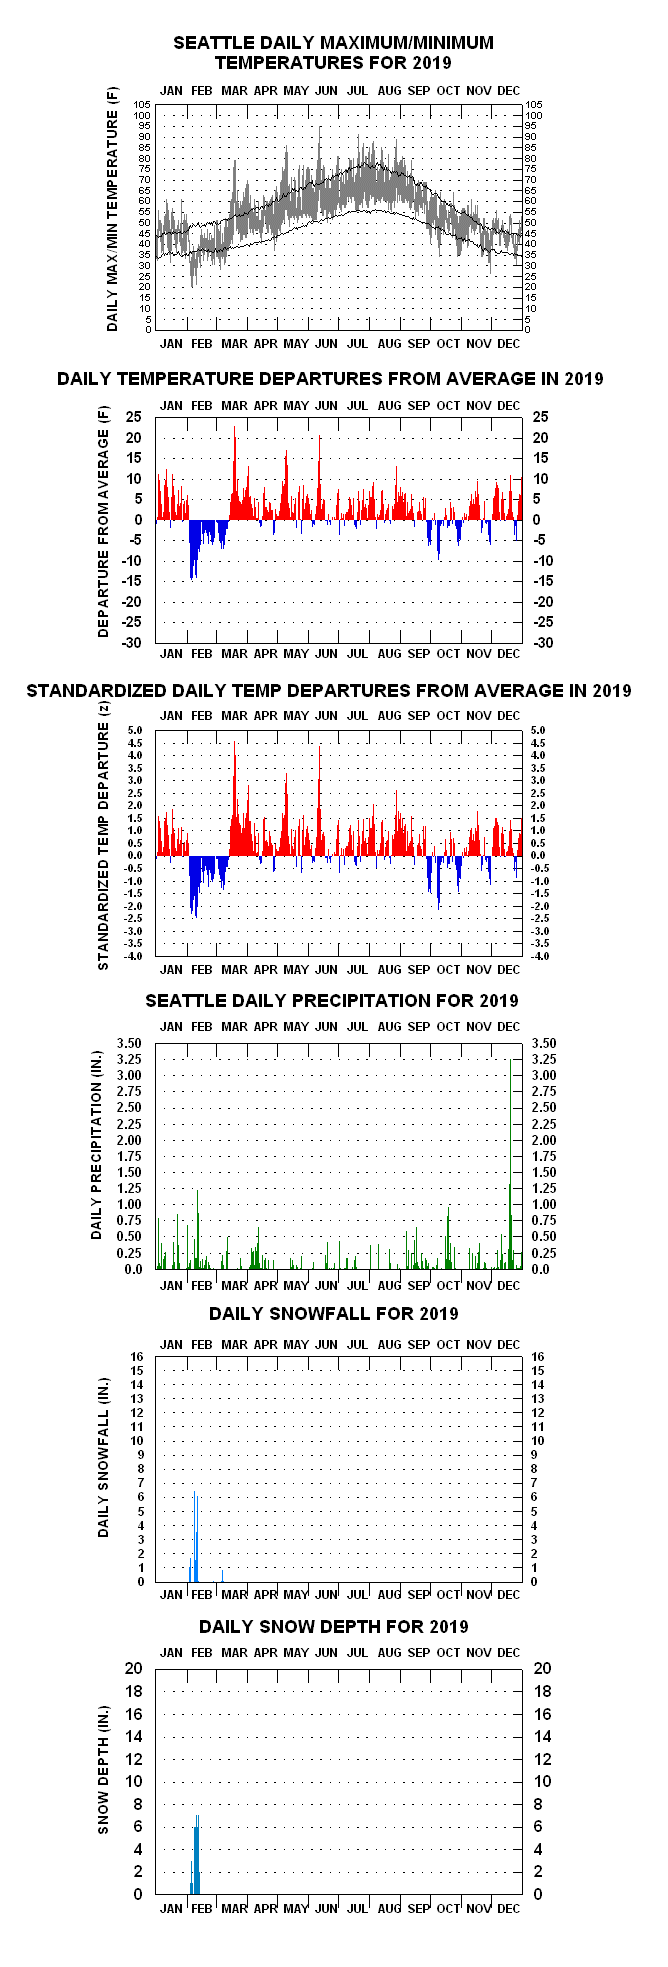
- 2019 Daily Temperature/Precipitation Graph for Seattle
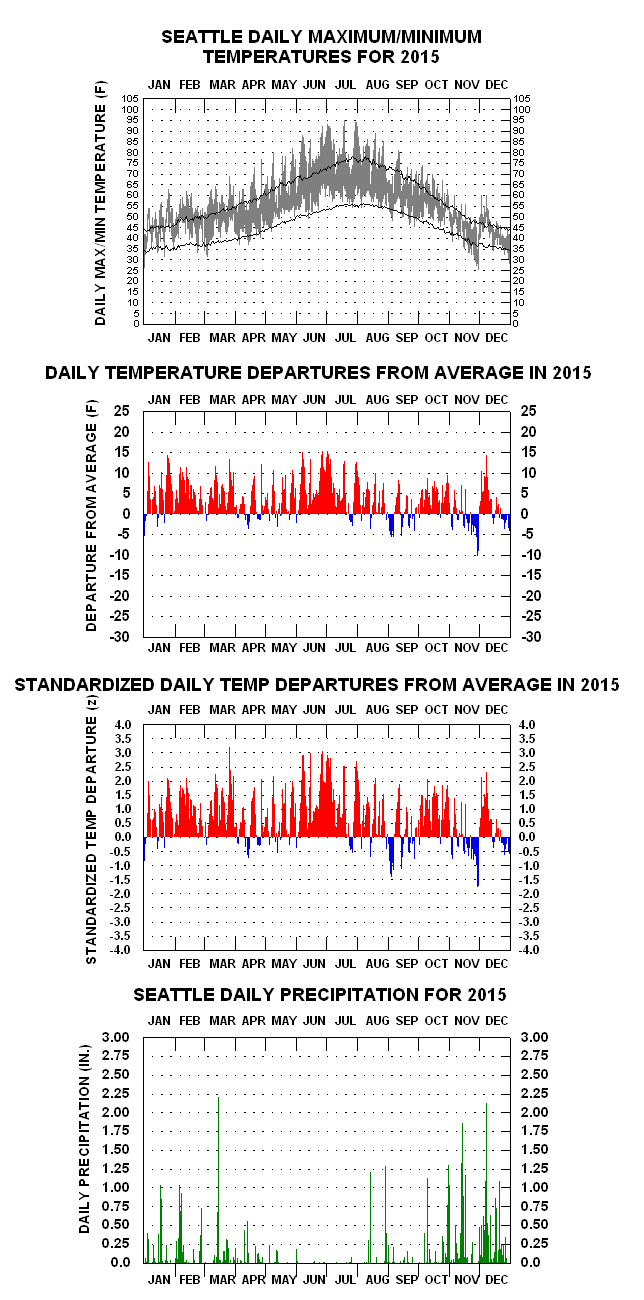
- 2015 Daily Temperature/Precipitation Graph for SeattleWarmest Year to Date (55.6 F)
Annual Temperature and Rainfall Time-Series
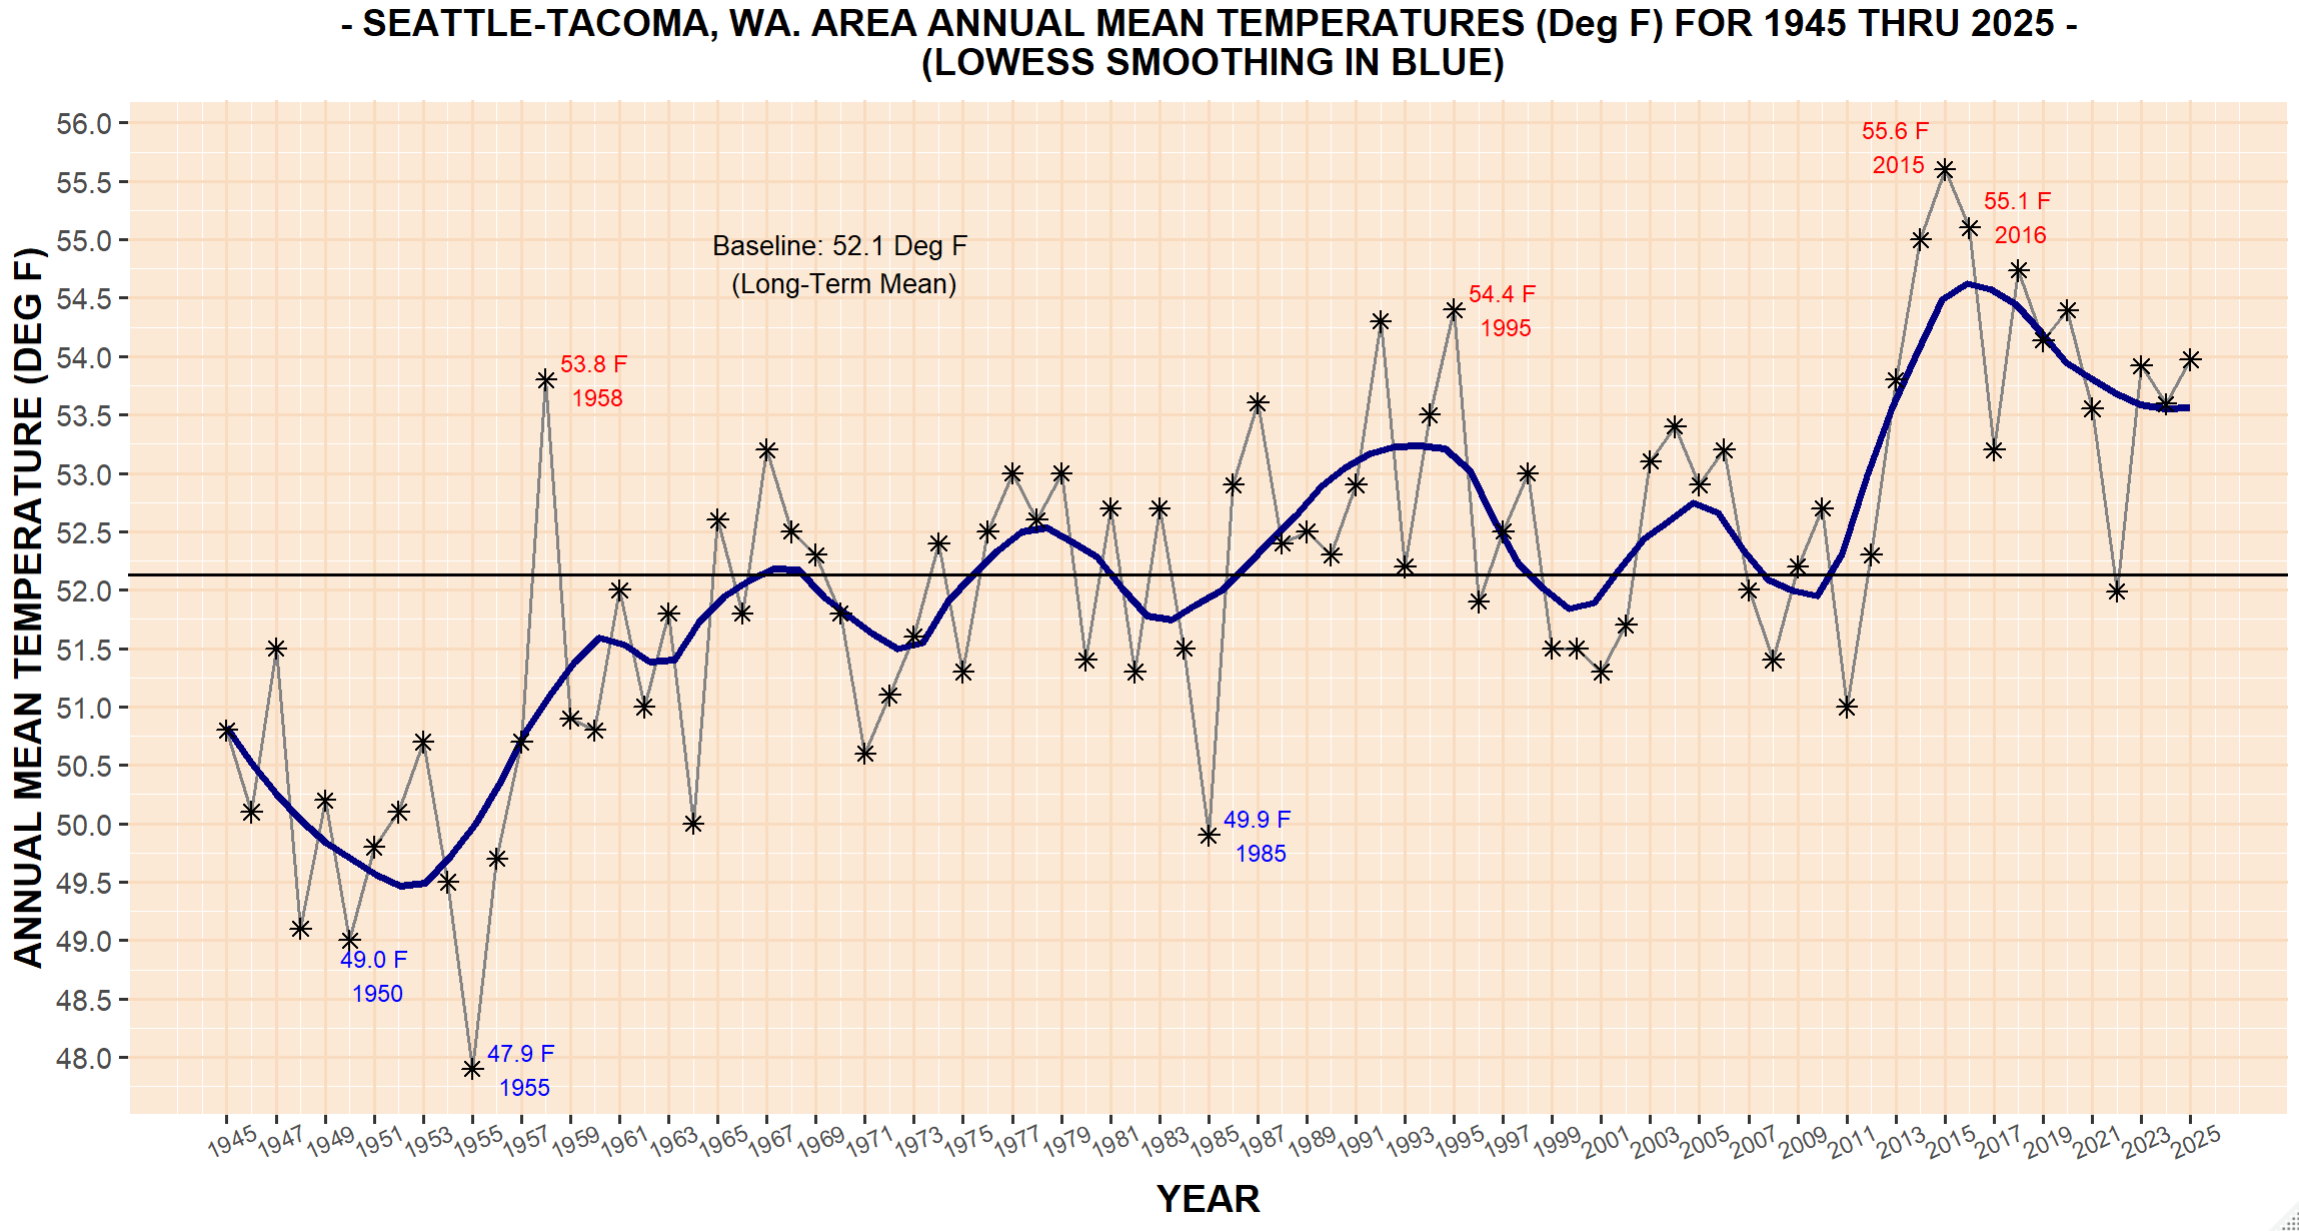
- Seattle Annual Mean Temperatures (1945-2025) NewNew (1/9/26)
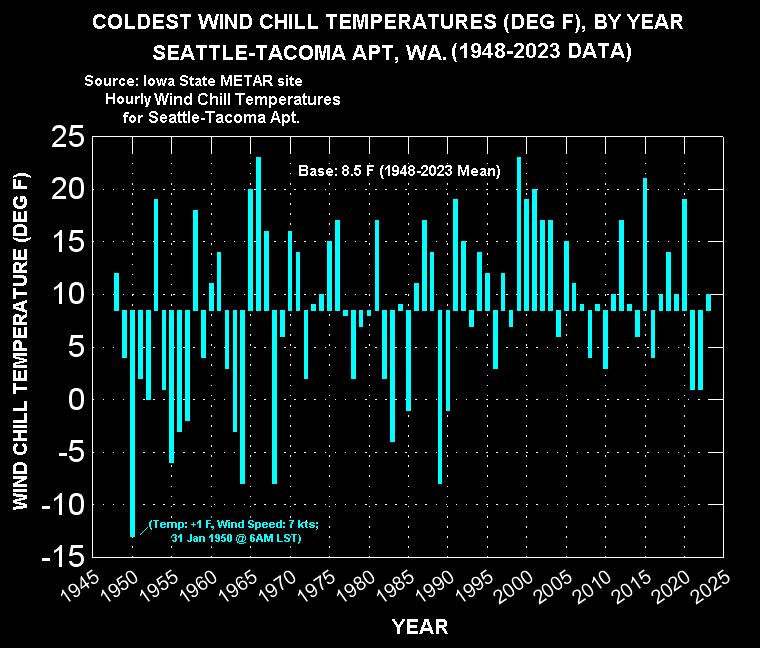
- Seattle Coldest Wind Chill Temperatures, by Year, (1948-2023)
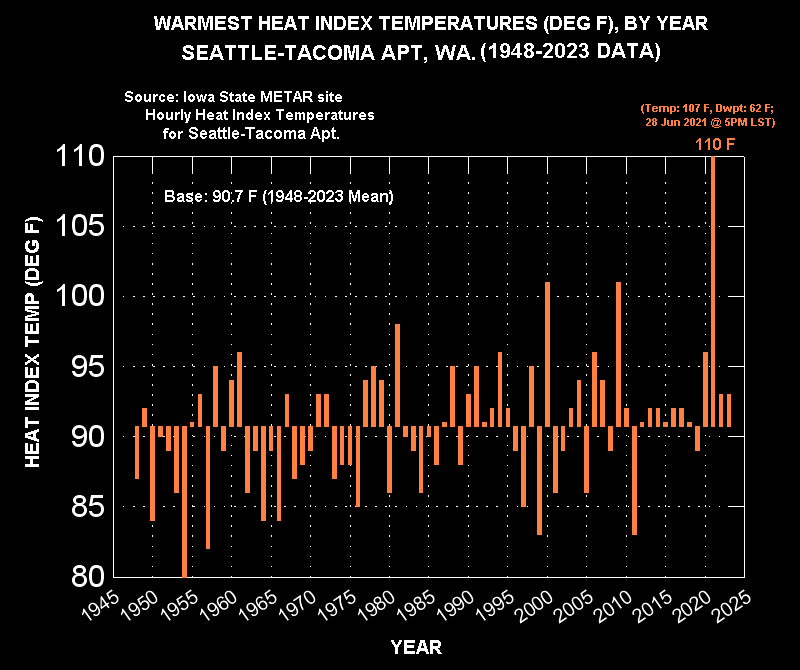
- Seattle Warmest Heat Index Temperatures, by Year, (1948-2023)
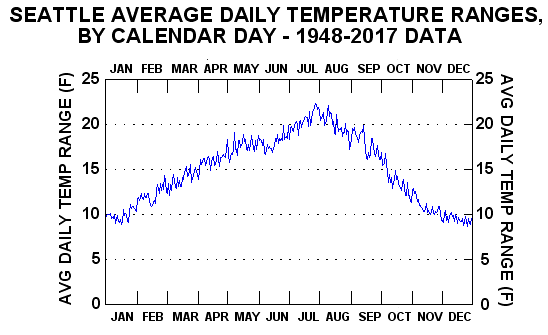
- Seattle Average Daily Temperature Ranges (1948-2017)Boxplot of Seattle-Tacoma Mean Monthly Precipitation Distributions
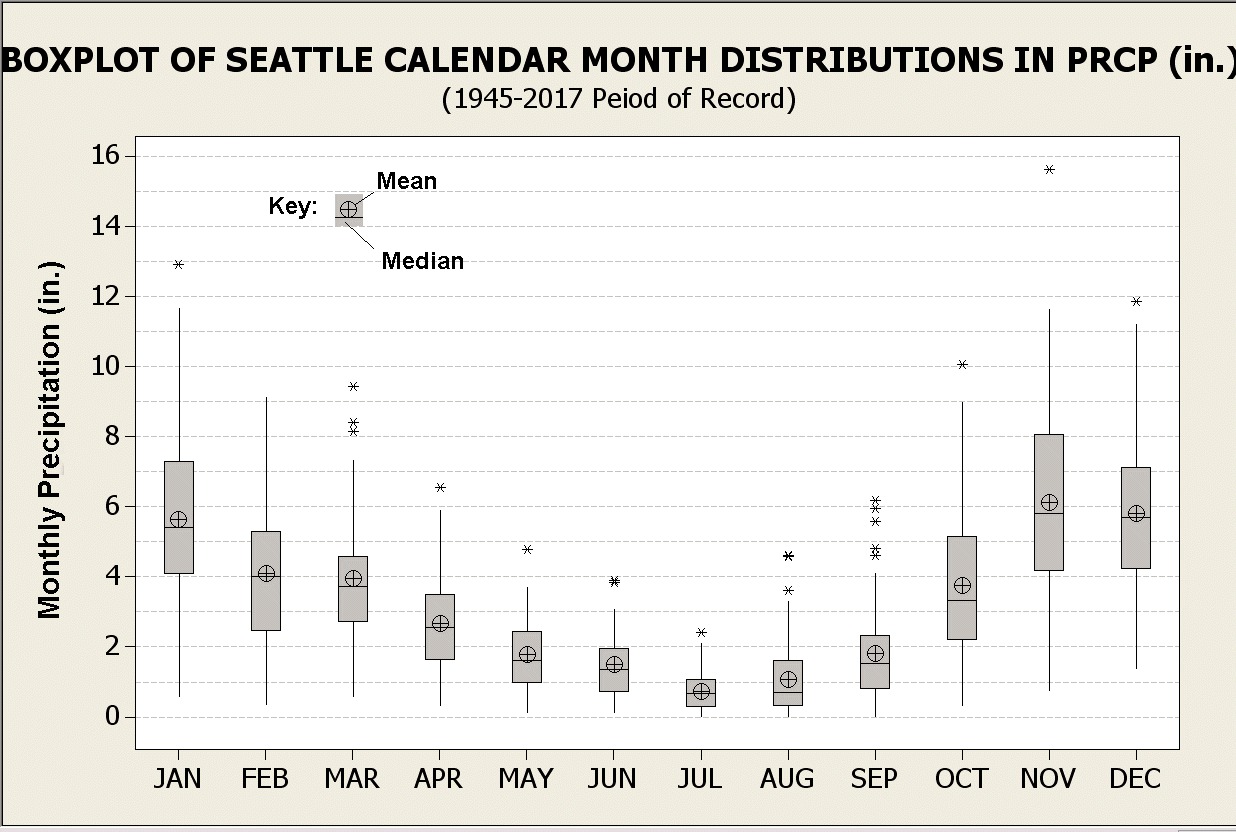
- Boxplot of Seattle-Tacoma Mean Monthly Precipitation DistributionsSeattle Average Daily Temperature Ranges (1948-2017) Boxplot of Seattle-Tacoma Mean Monthly Precipitation Distributions
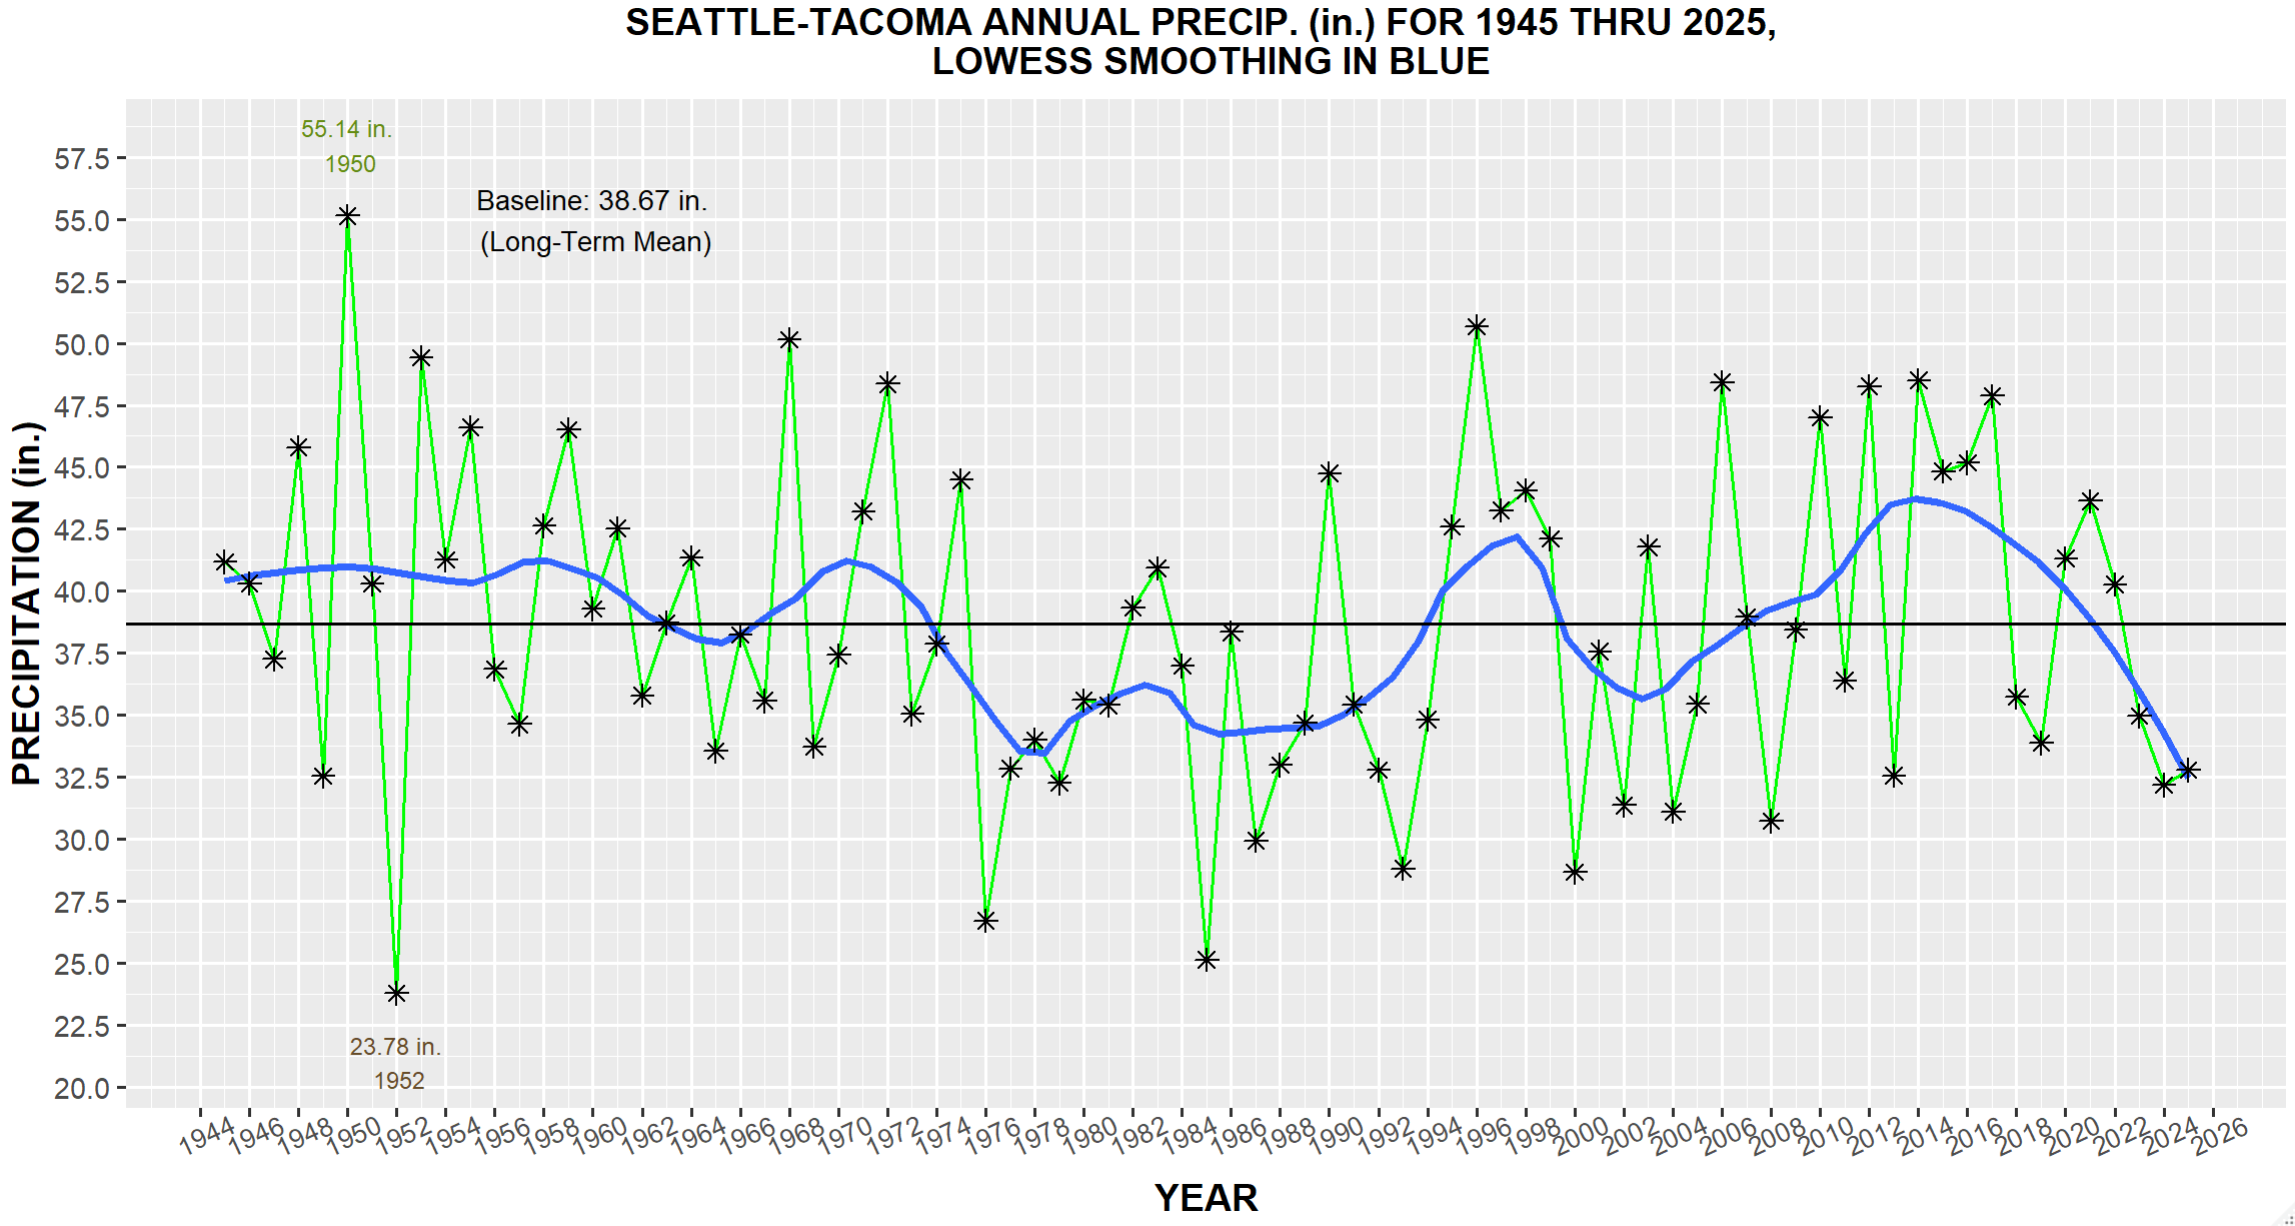
- Seattle-Tacoma Annual Precipitation History (1945-2025) NewNew (1/9/26)
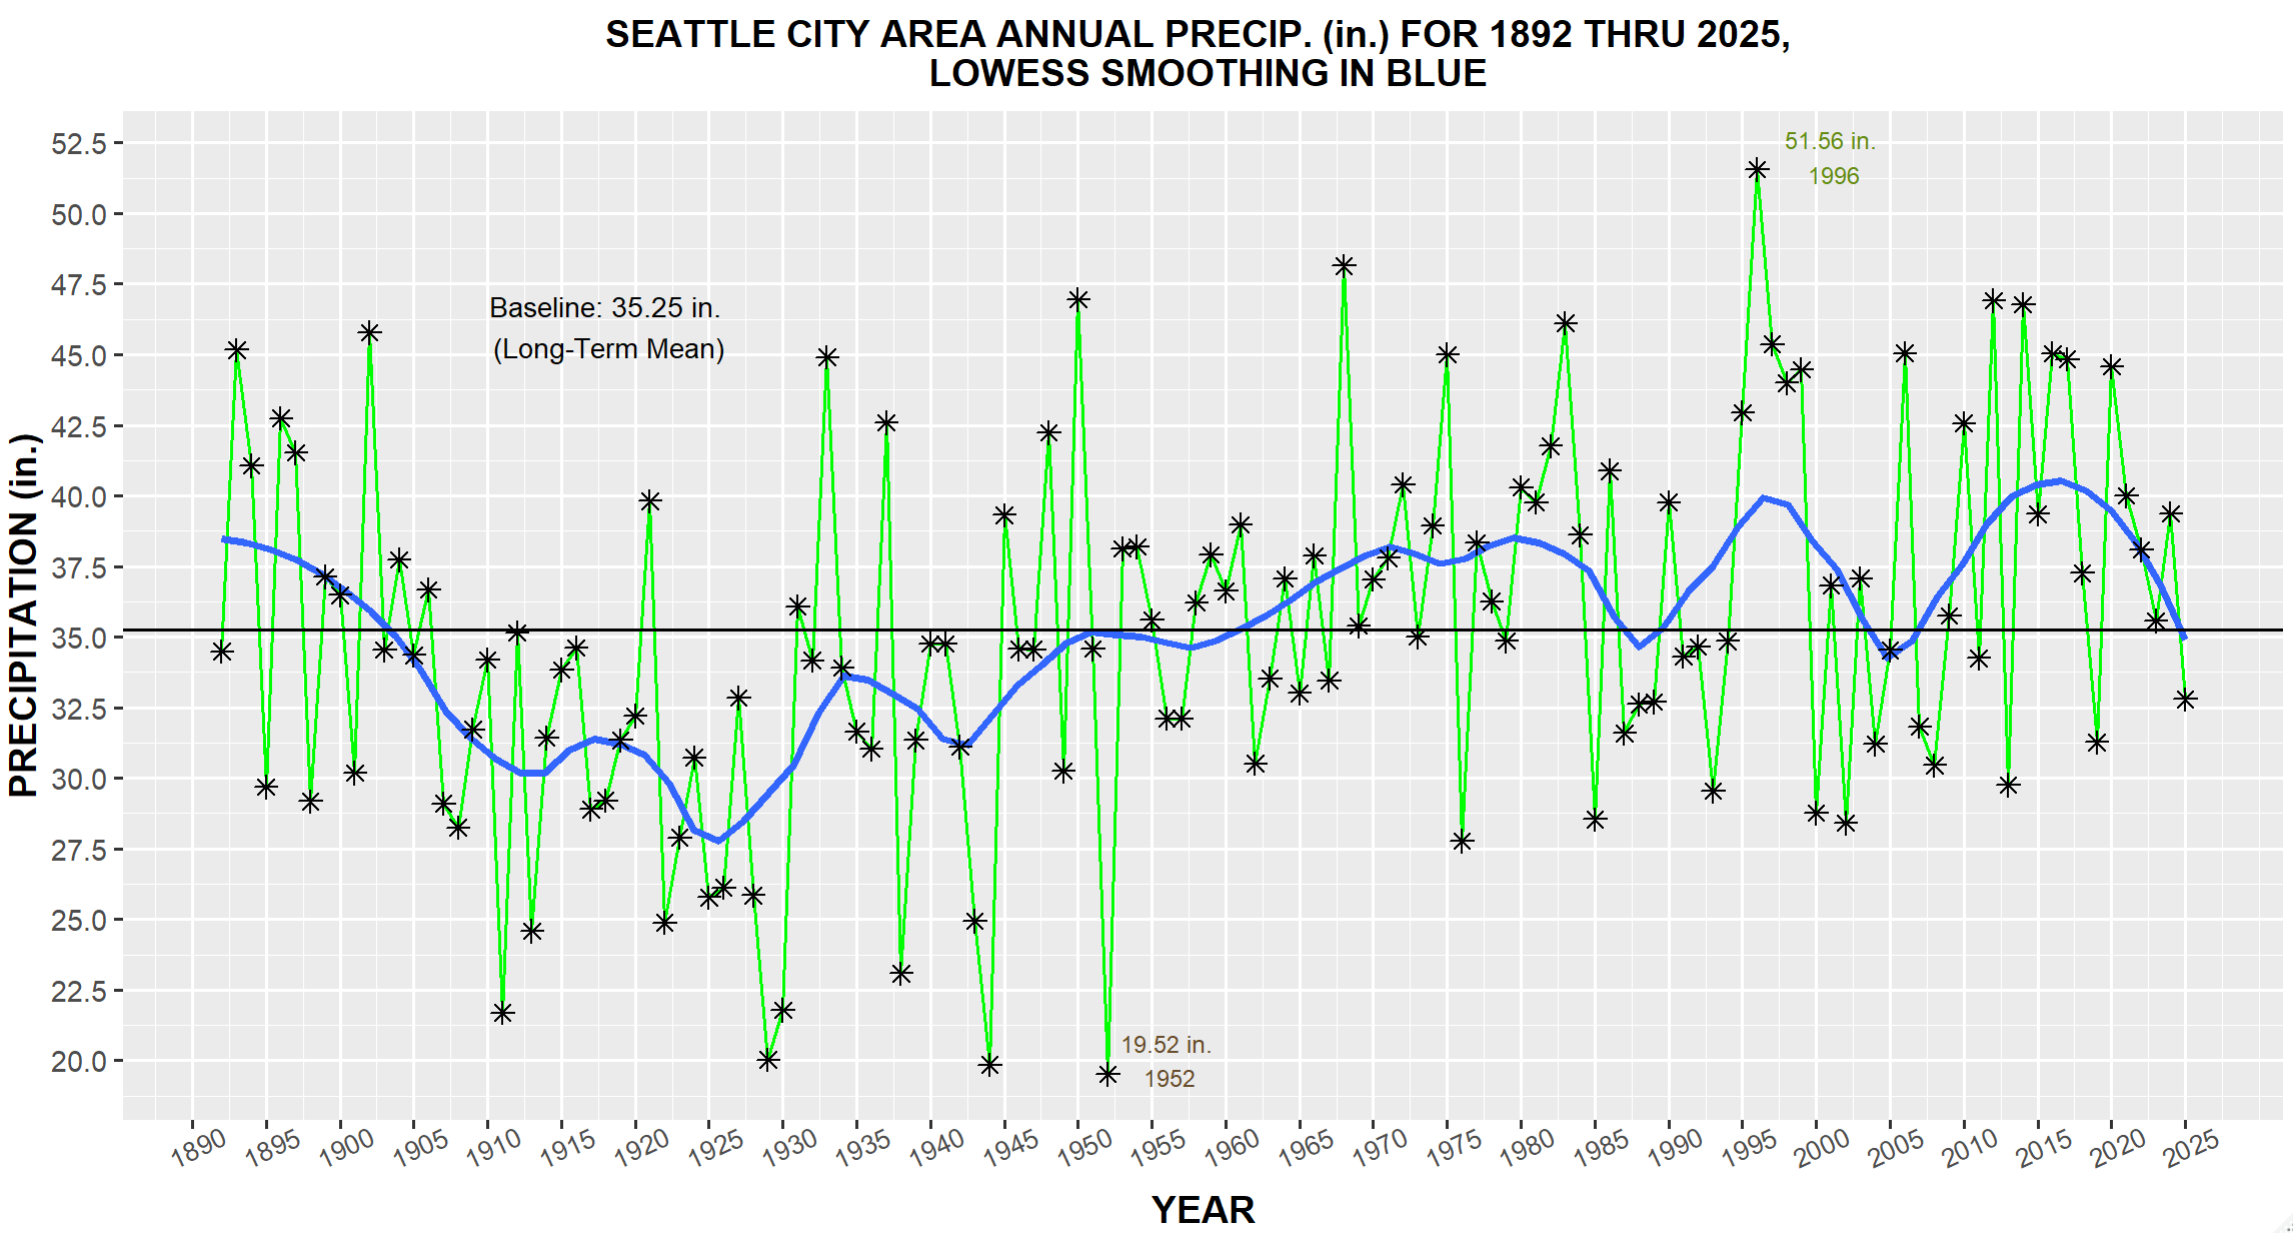
- Seattle City Area Annual Precipitation History (1892-2025) - NewNew (1/9/26)
Hour By Month Climograms & Other Charts:
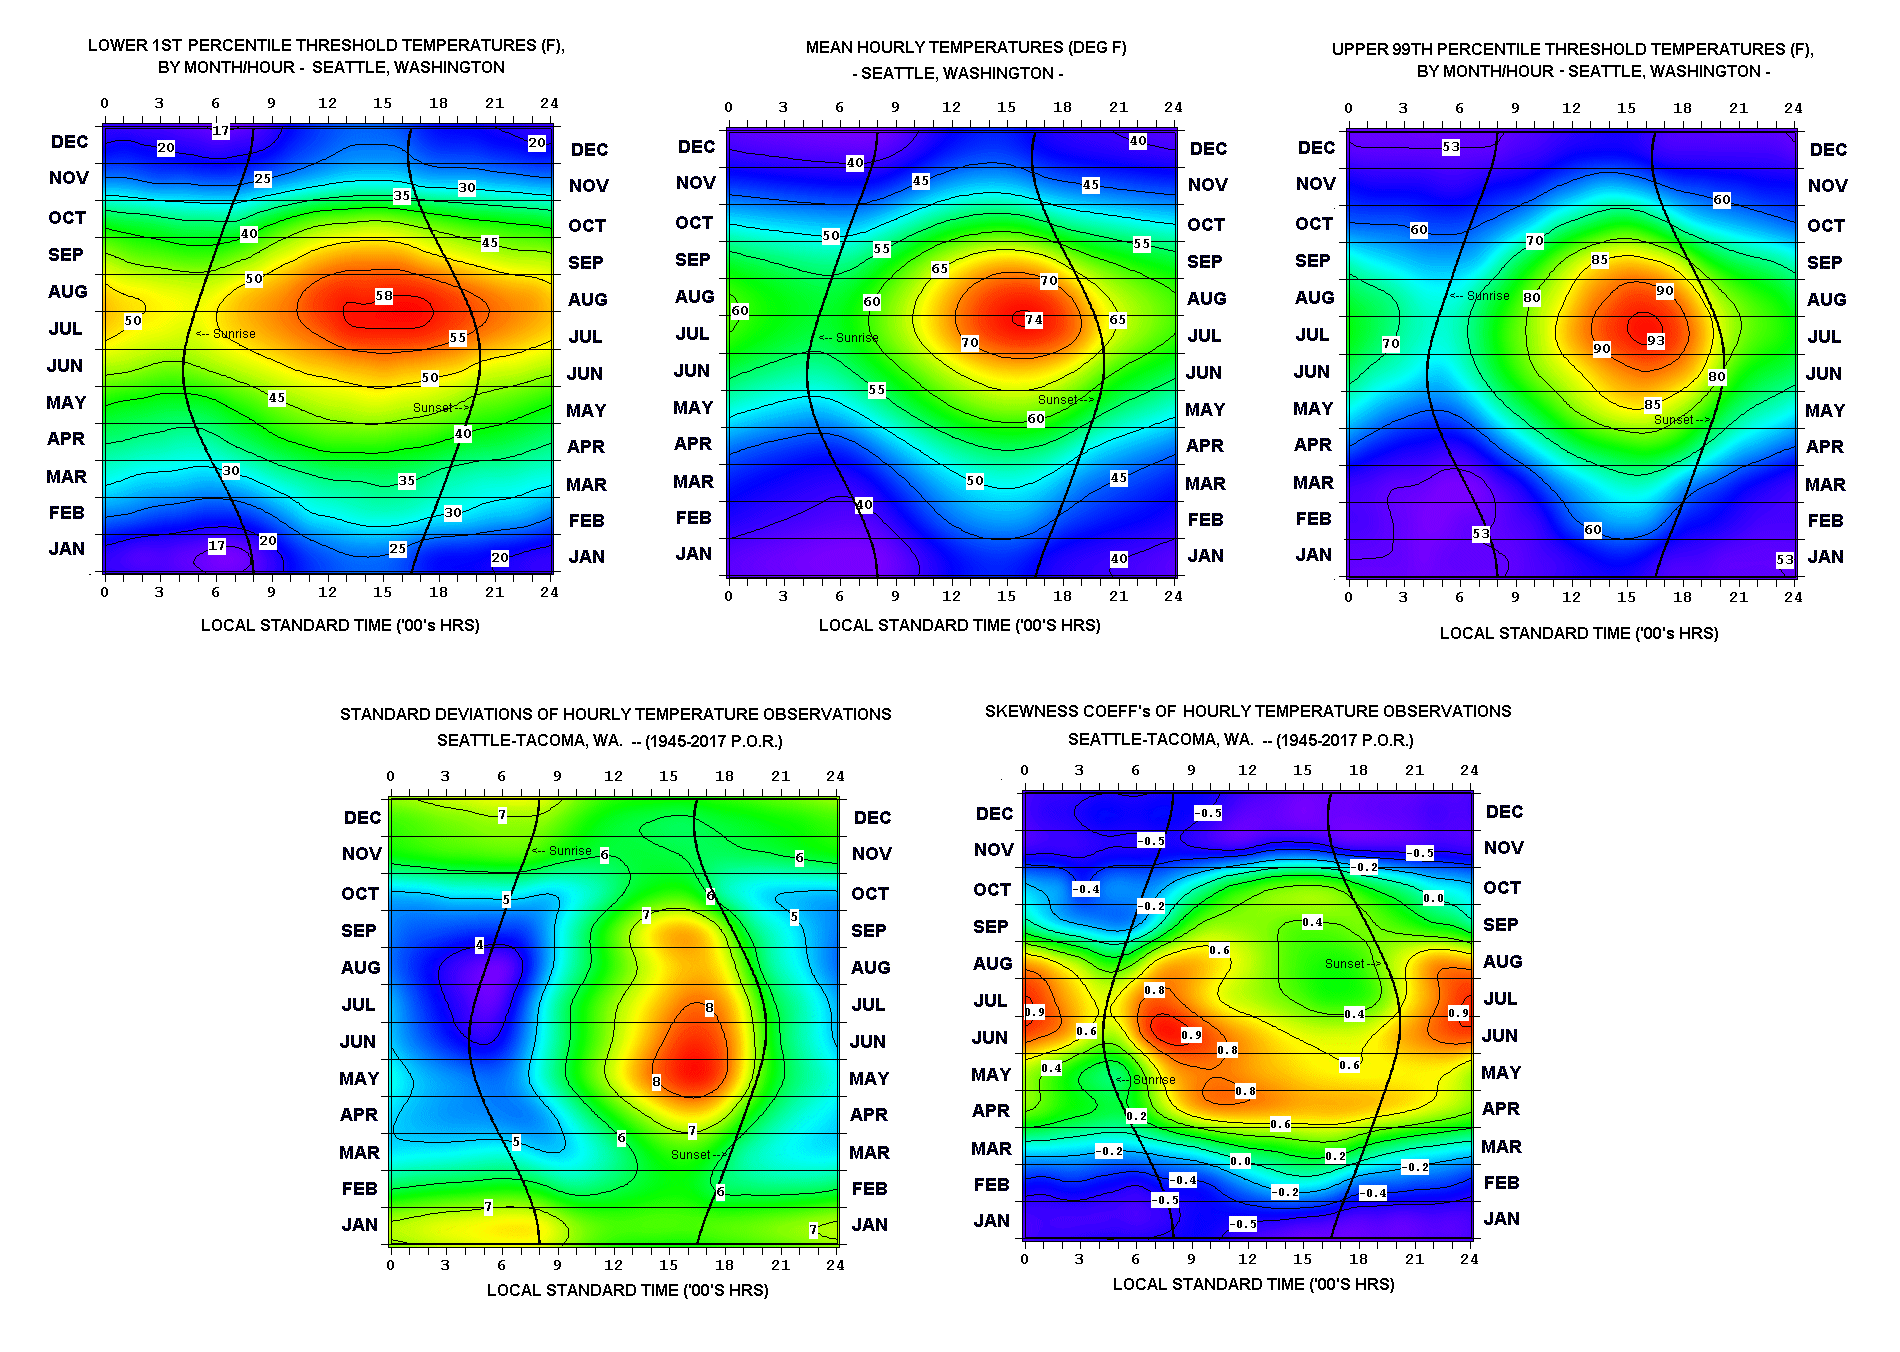
- Seattle Mean, Lower 1st Percentile, and Upper 99th Percentile Hour-By-Month Temperatures + Stdv's and Skewness Coeff's
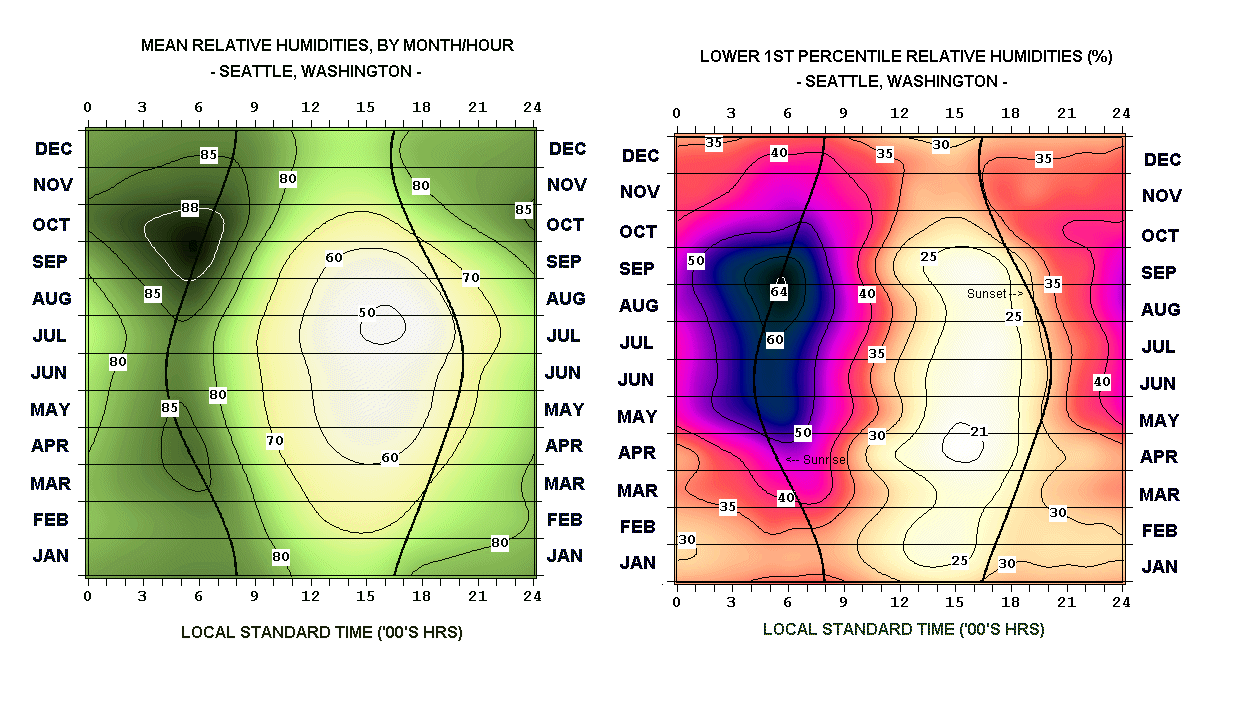
- Seattle Mean and Lower 1st Percentile Relative Humidities by Month/Hour
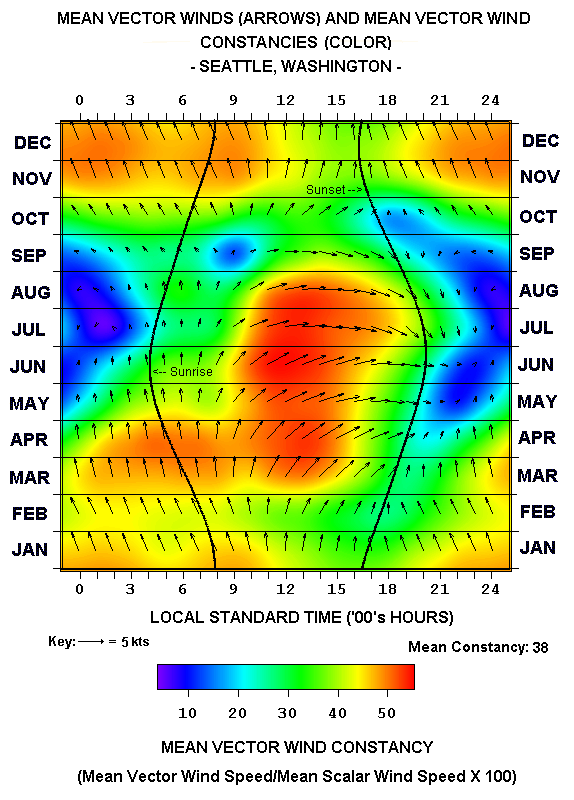
- Seattle Mean Vector Wind Directions, Speeds, and Constancies
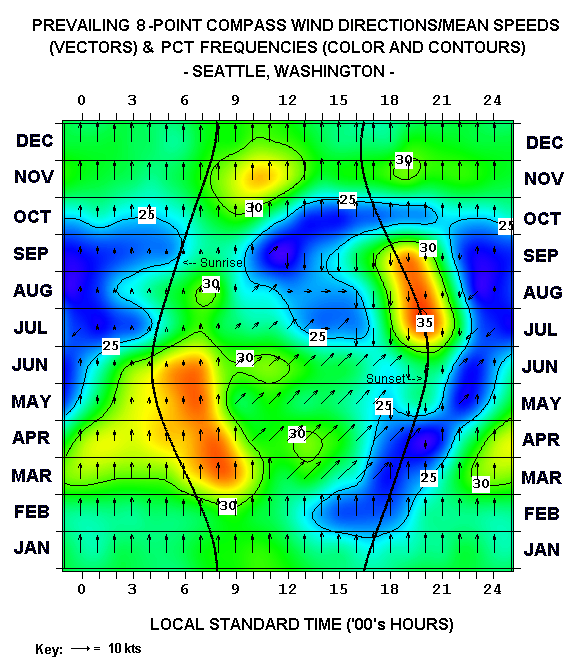
- Seattle Prevailing 8-Point Compass Wind Directions, Frequencies, and Mean Speeds
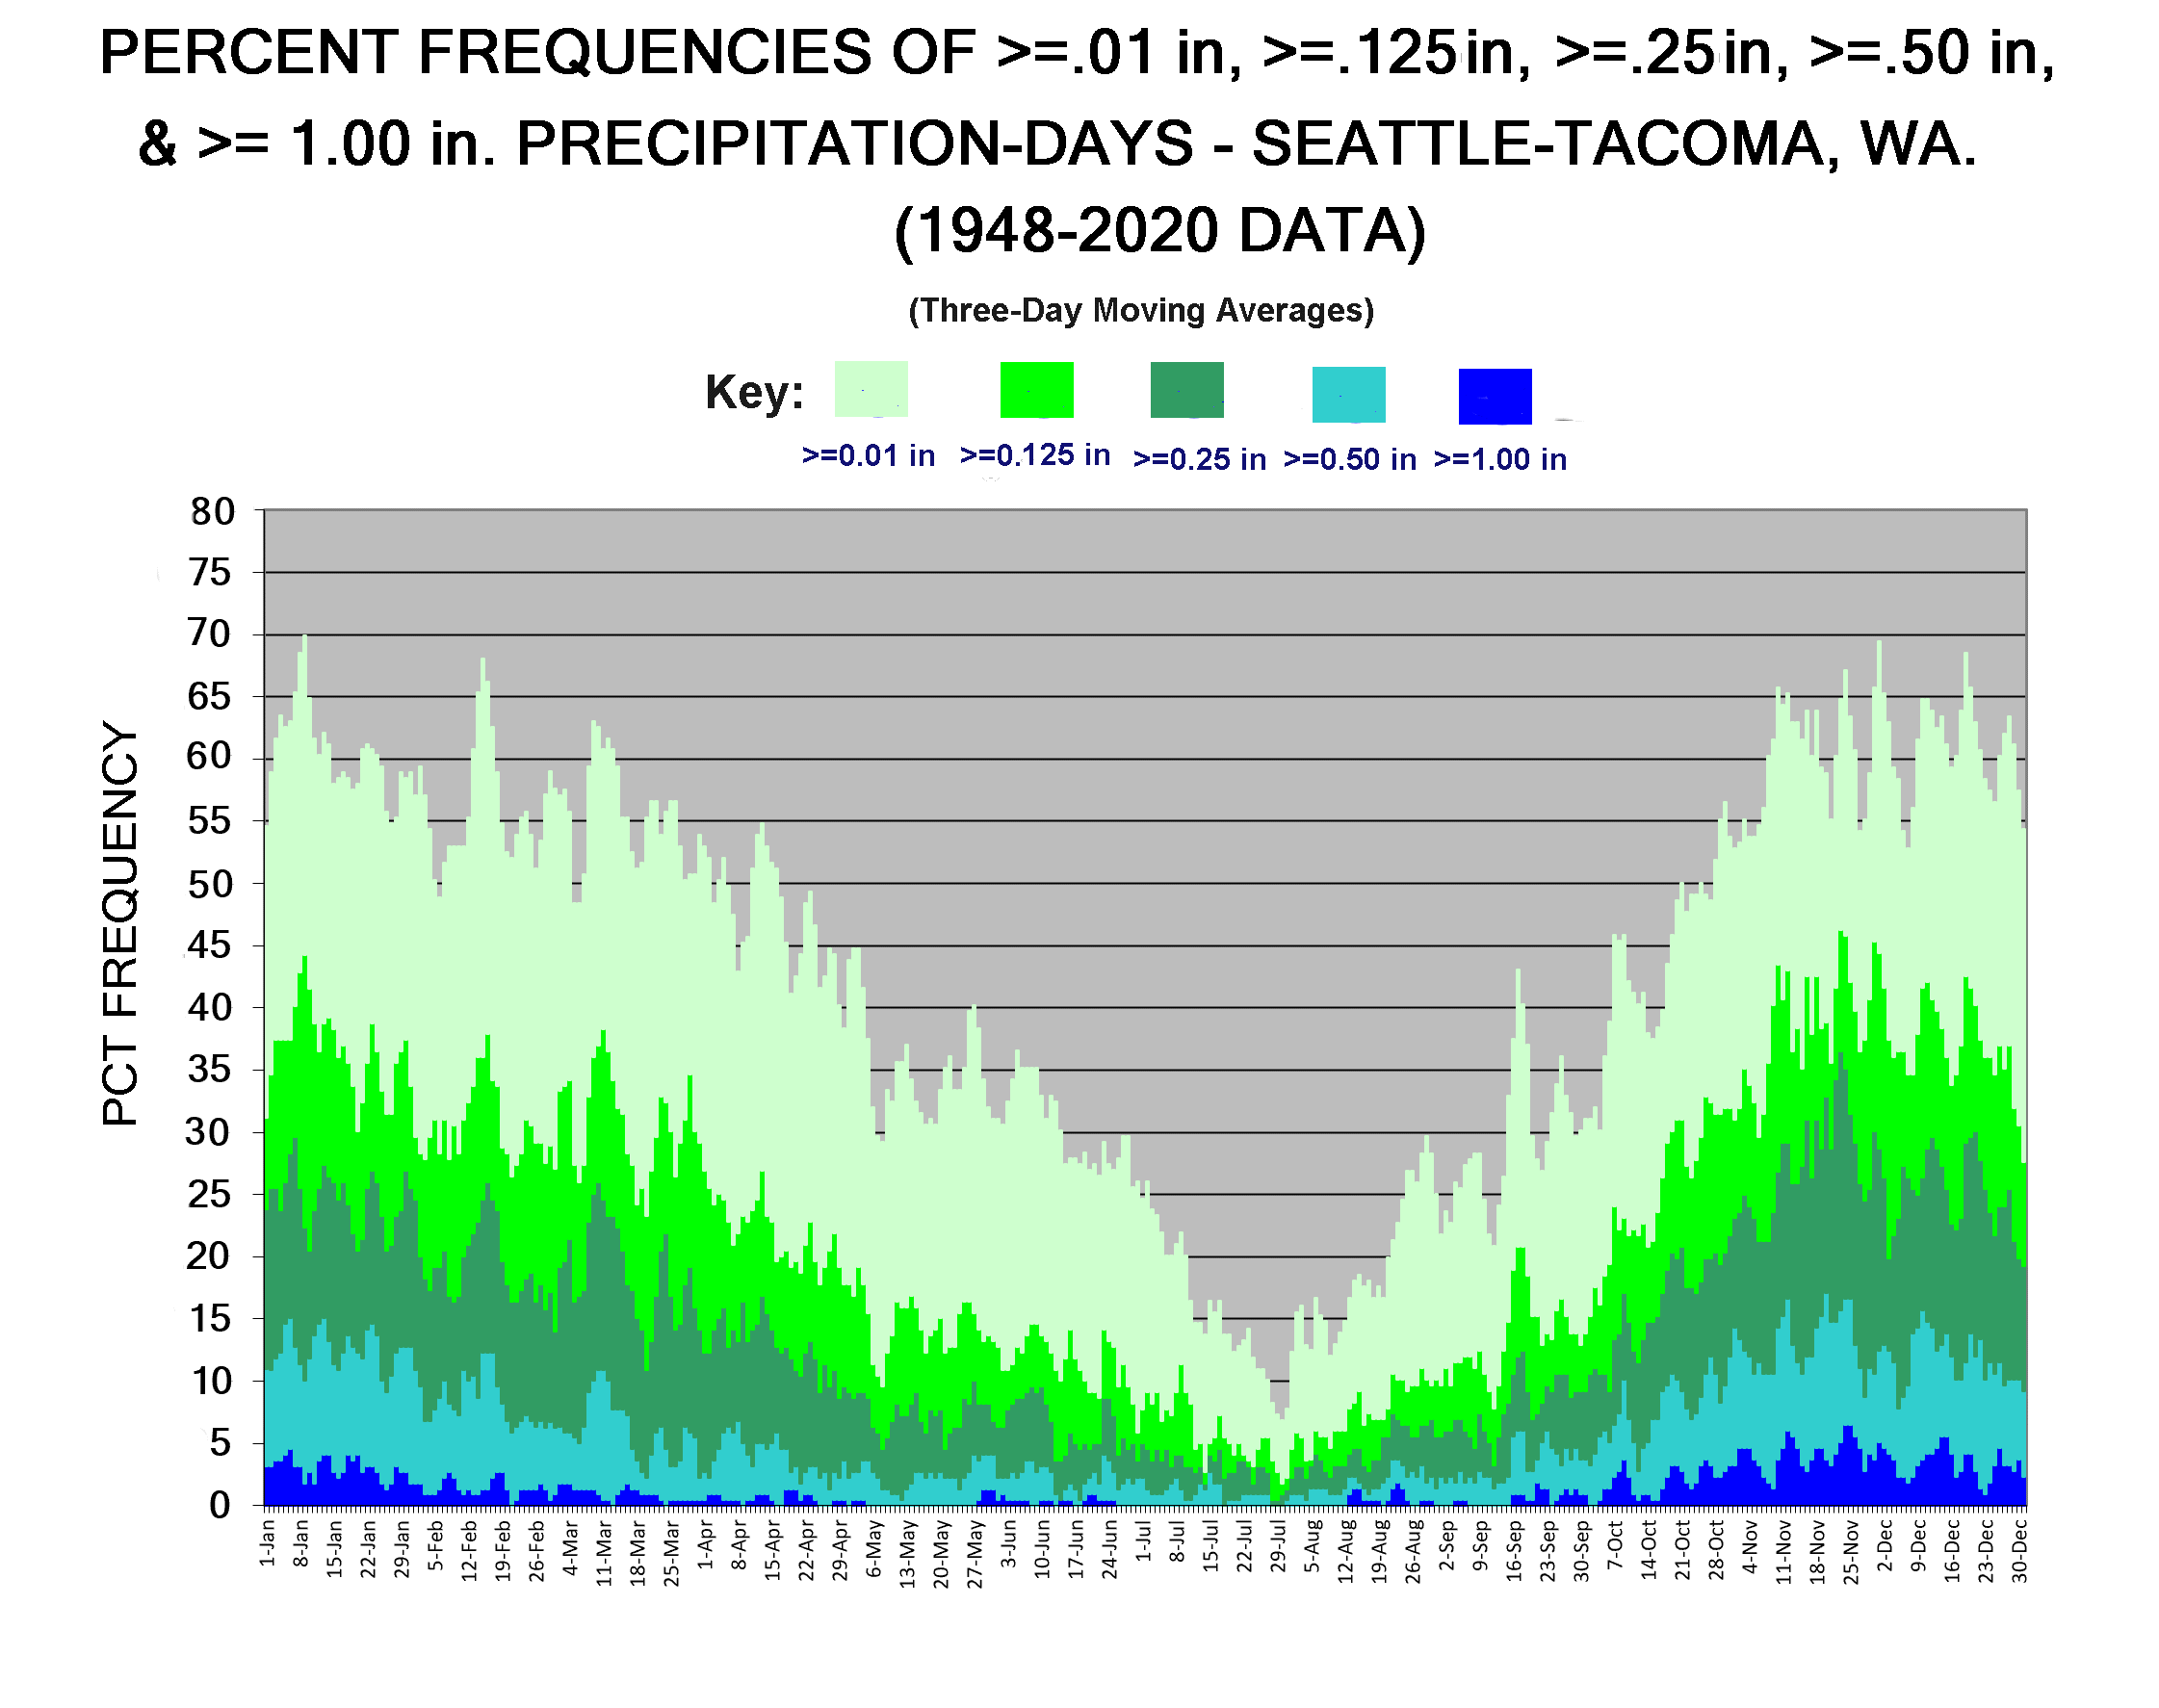
- Percent Frequencies of >=.01in", >=.125in", >=.25in", >=.50in, and >=1.00"in Precipitation-days
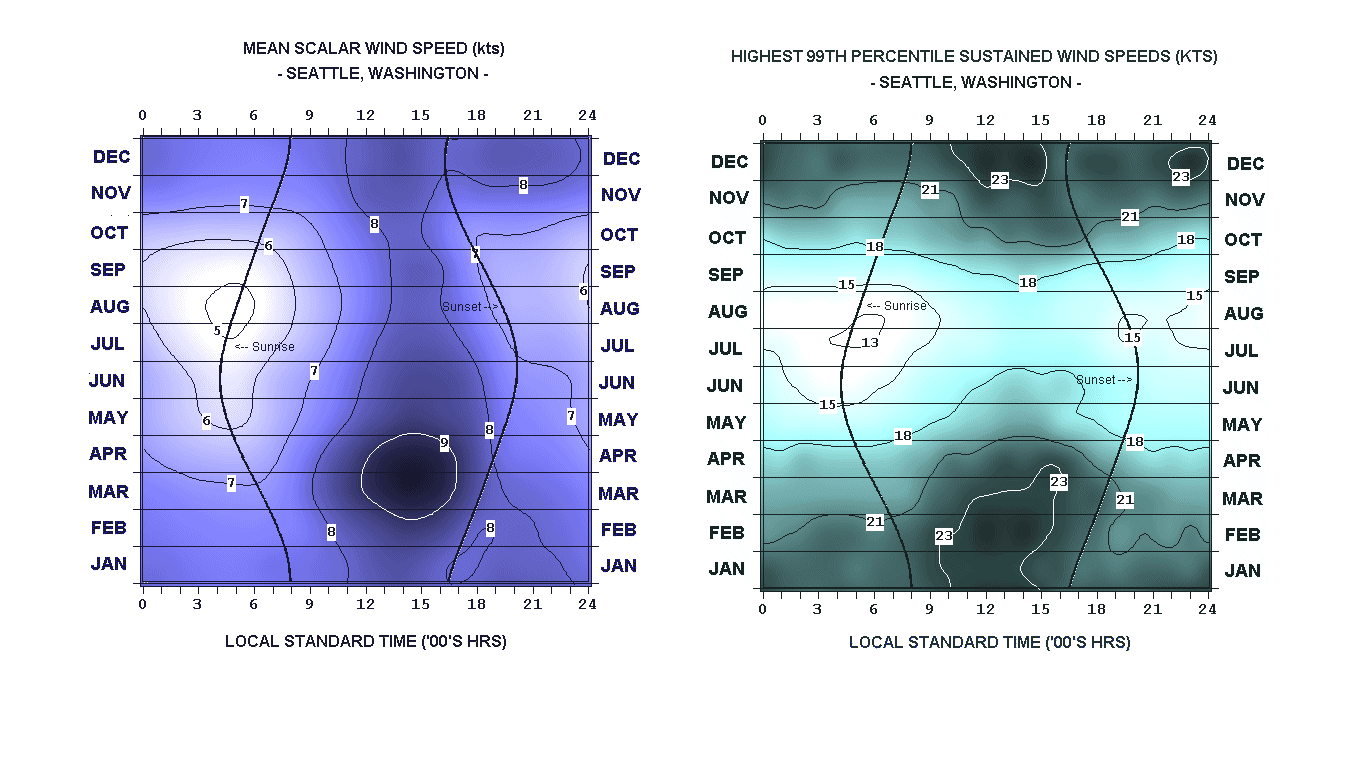
- Seattle Overall Mean Scalar Wind Speeds & Extreme Highest Sustained (99th Percentile Level
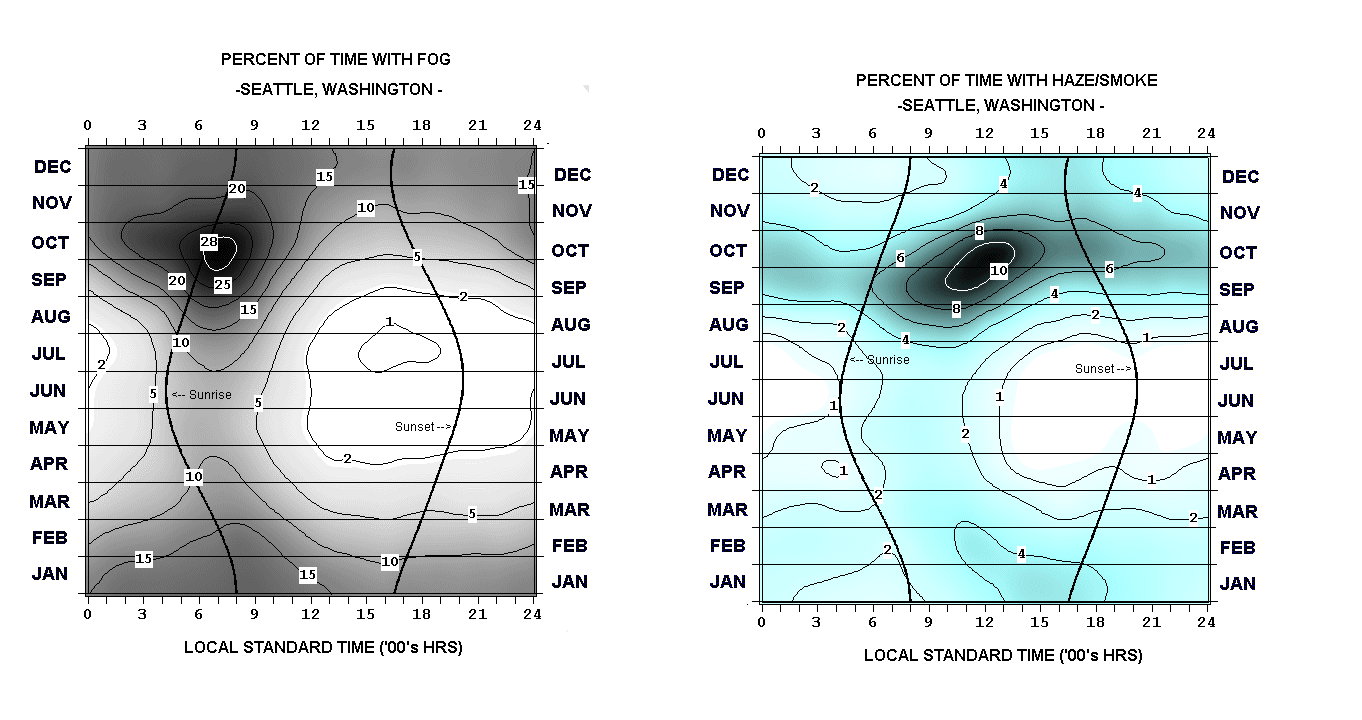
- Seattle Fog and Haze Incidence
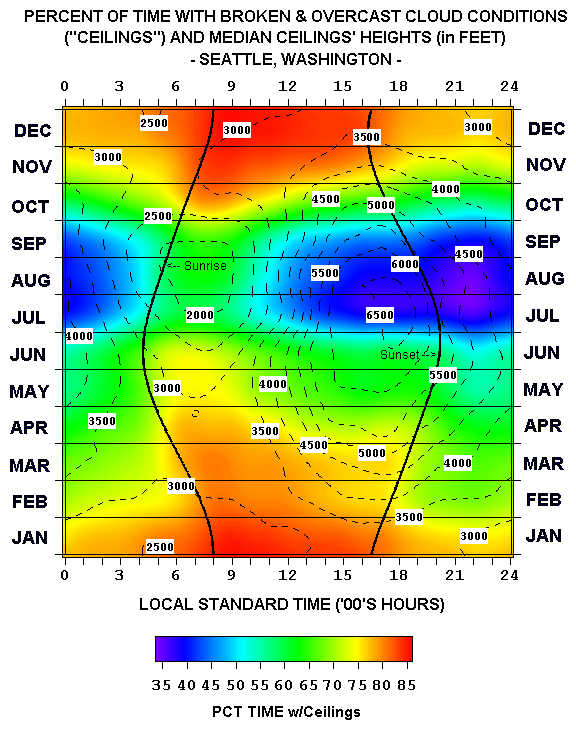
- Seattle Percent Frequencies with Cloud Ceilings & Median Ceilings’ Heights
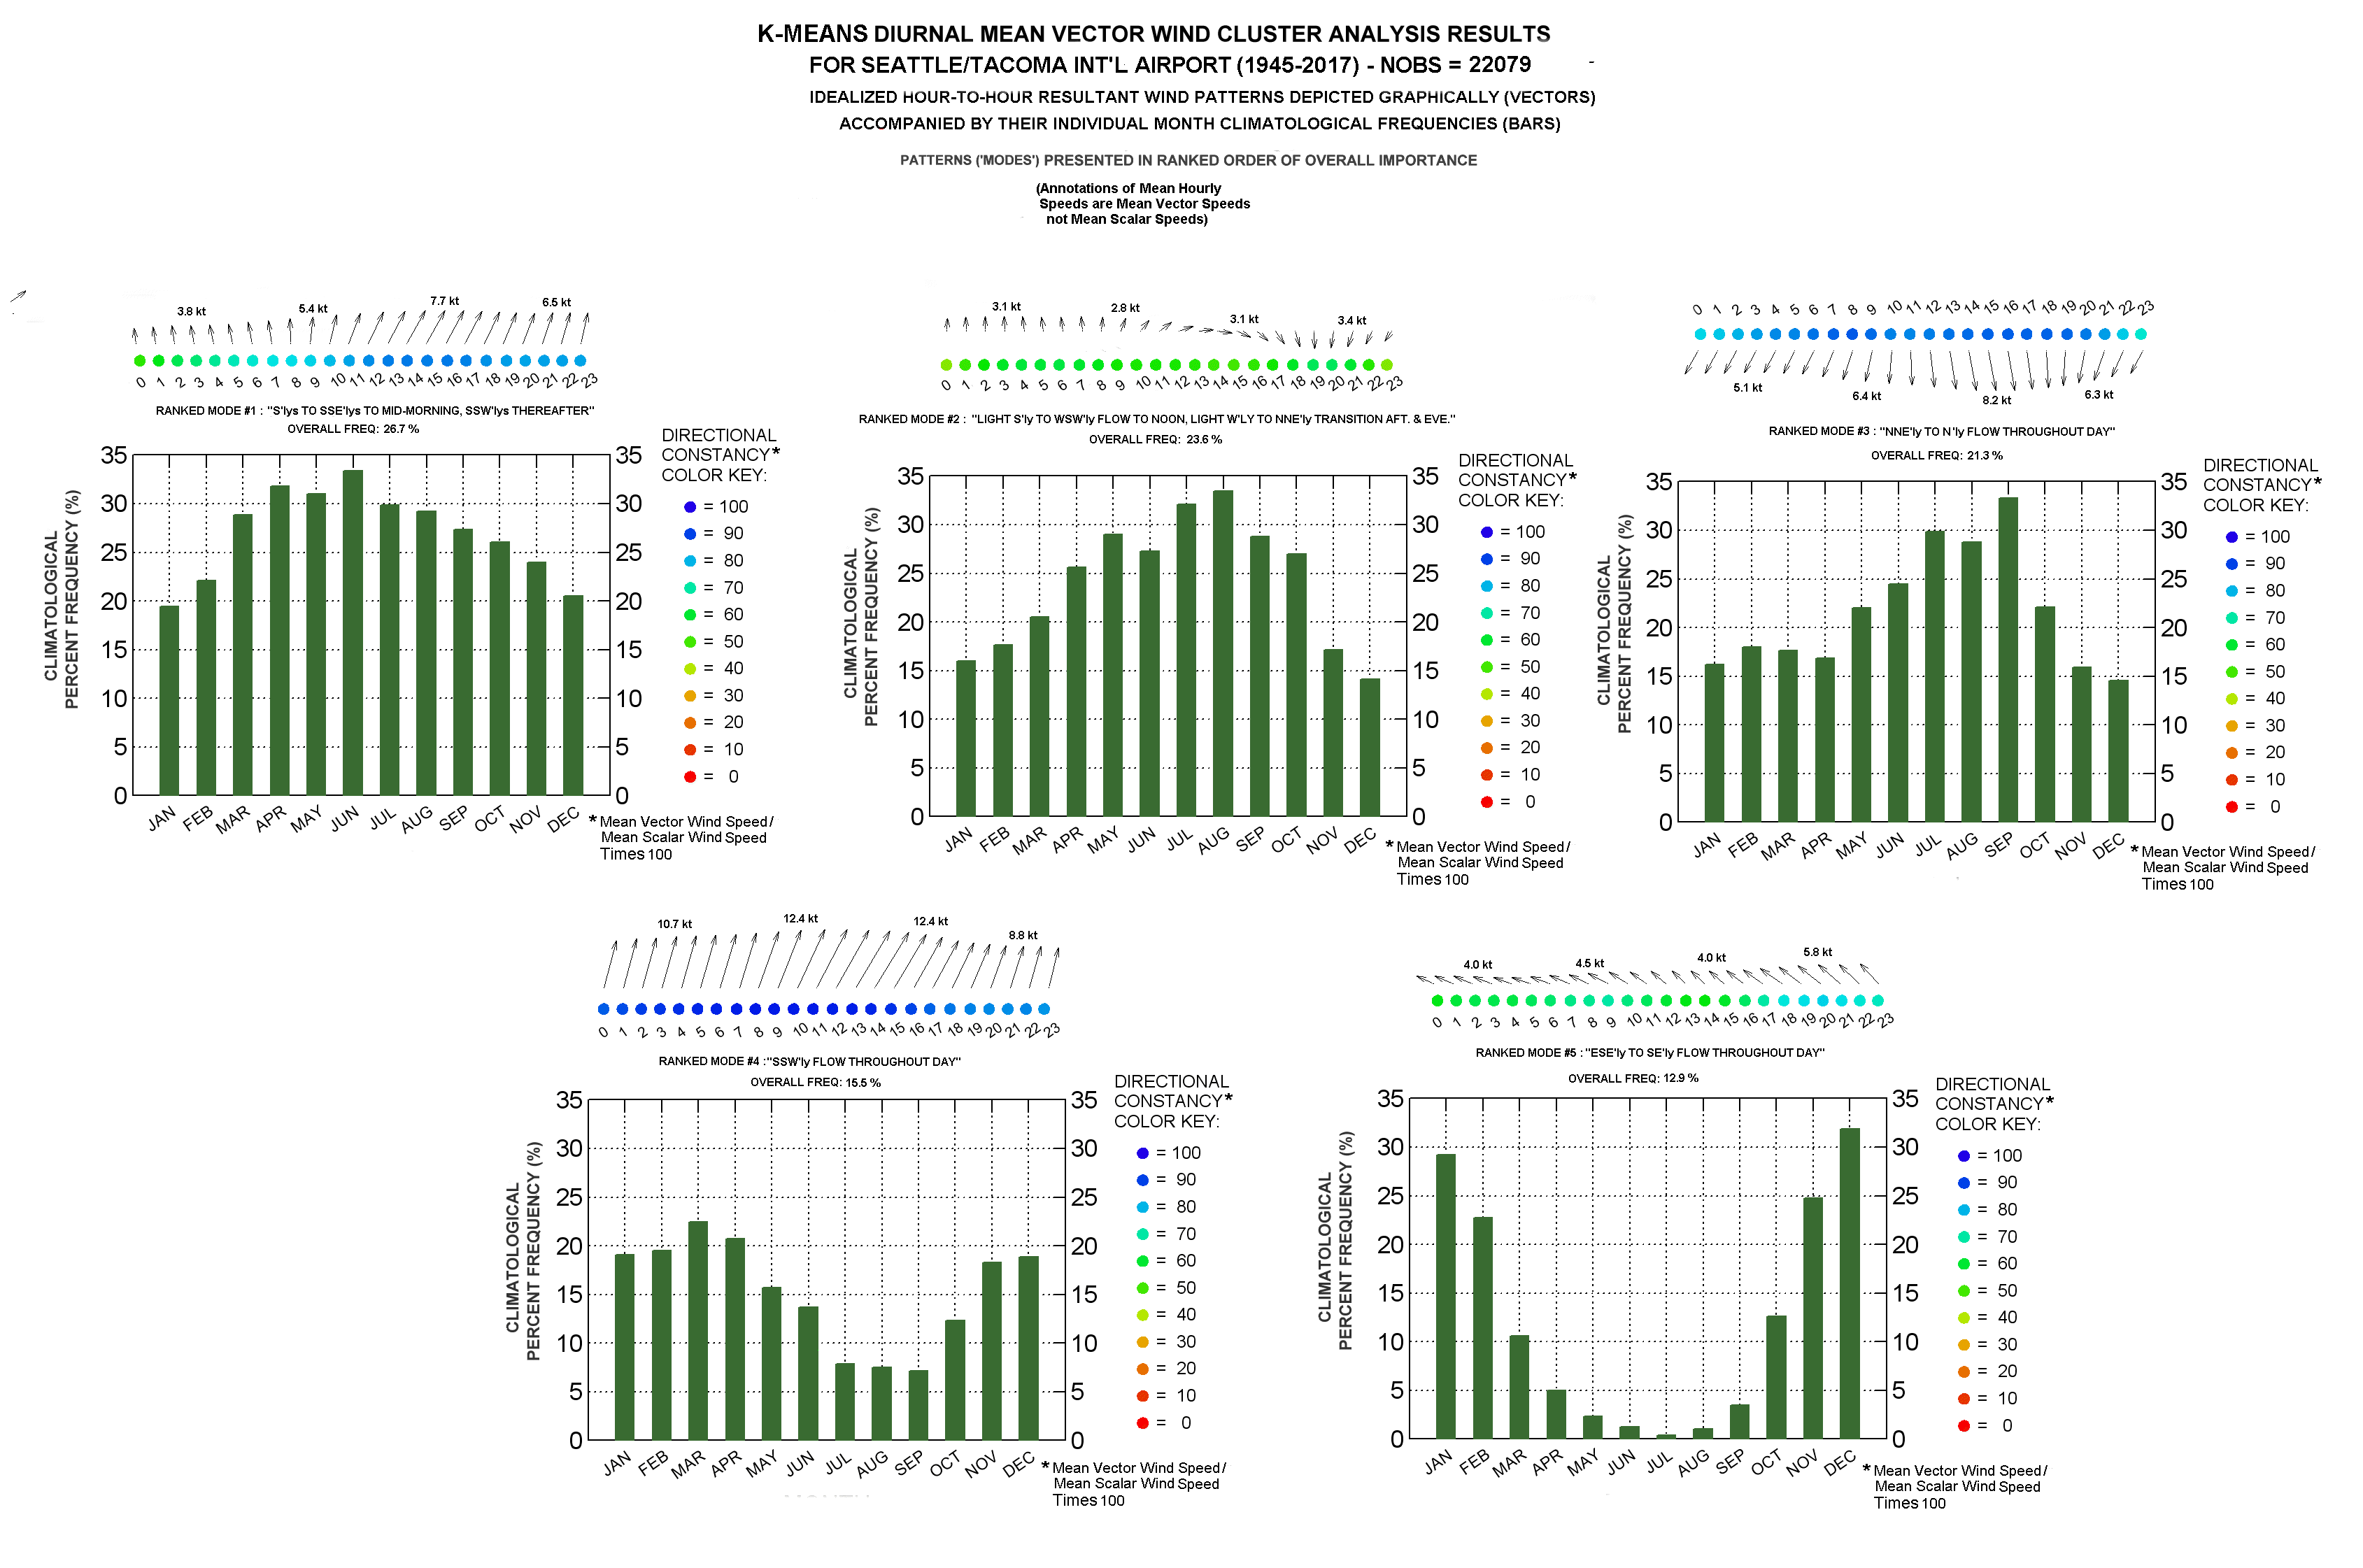
- K-Means Clustering Analysis of Seattle/Tacoma Diurnal Resultant Wind Patterns
Year-To-Year Graphs:
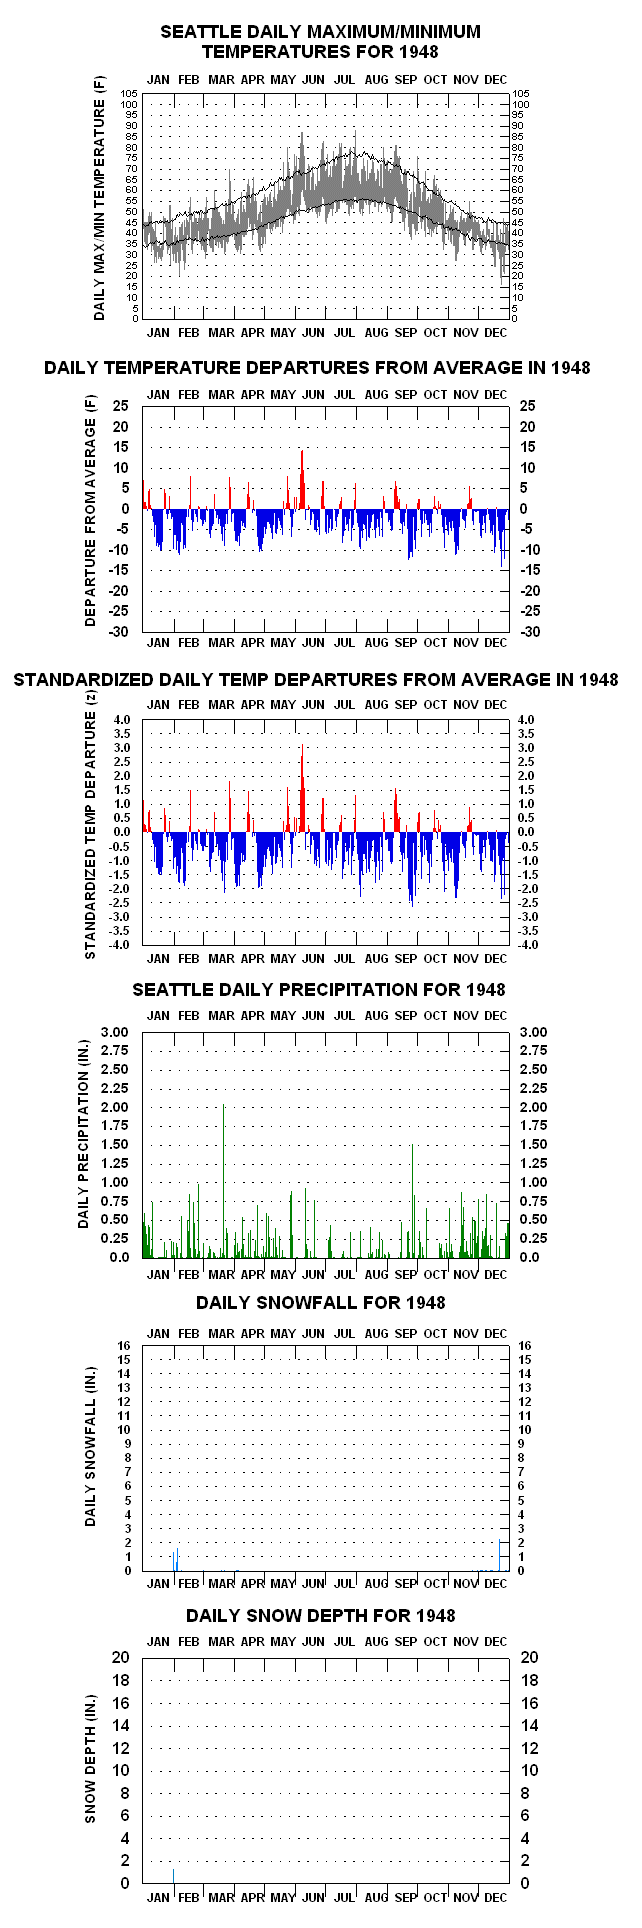
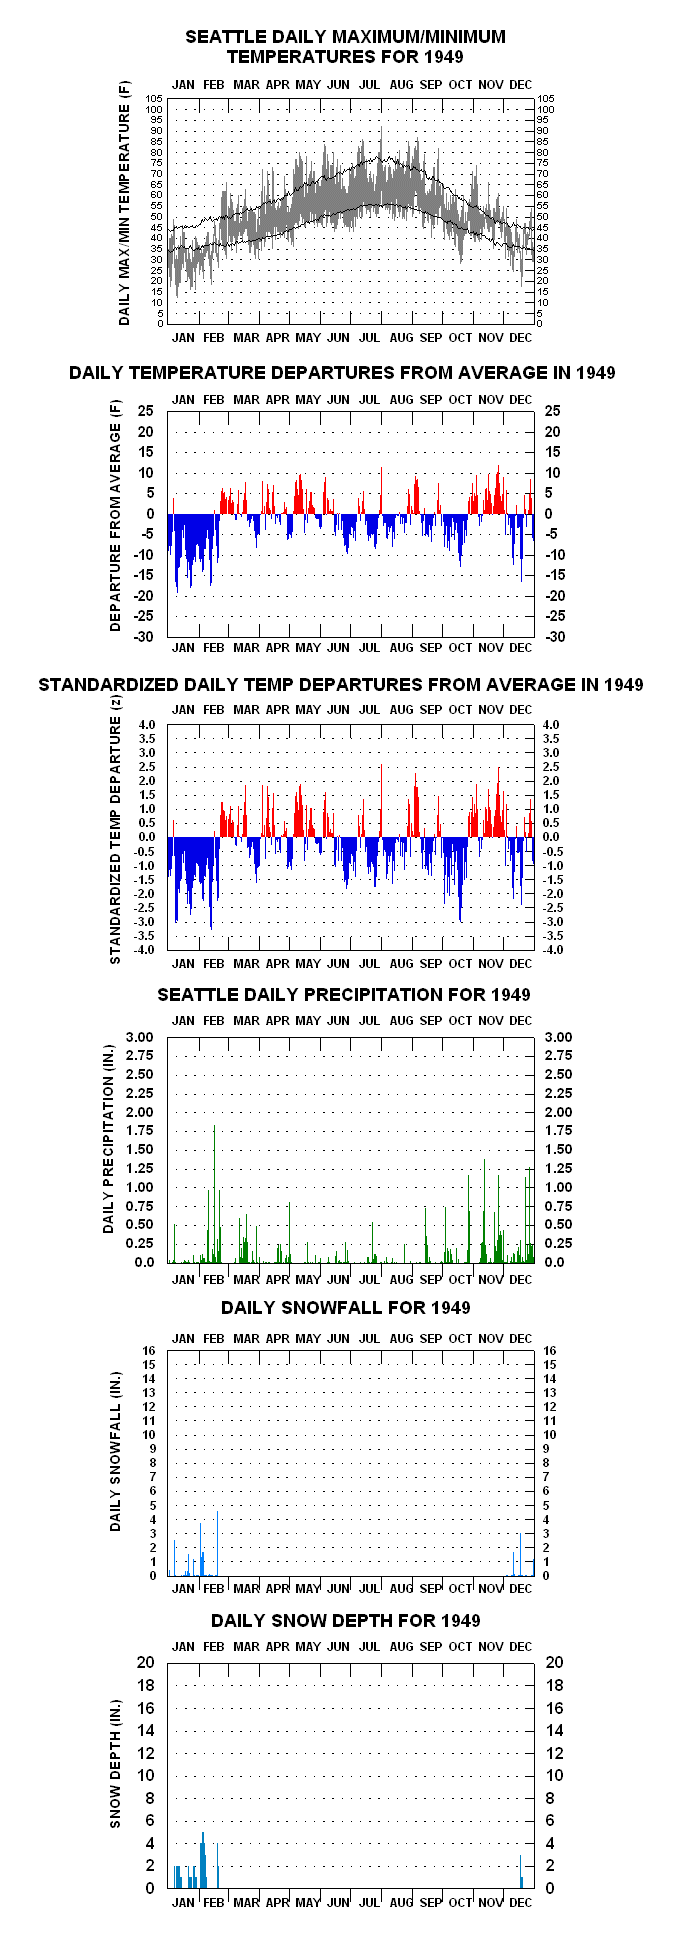
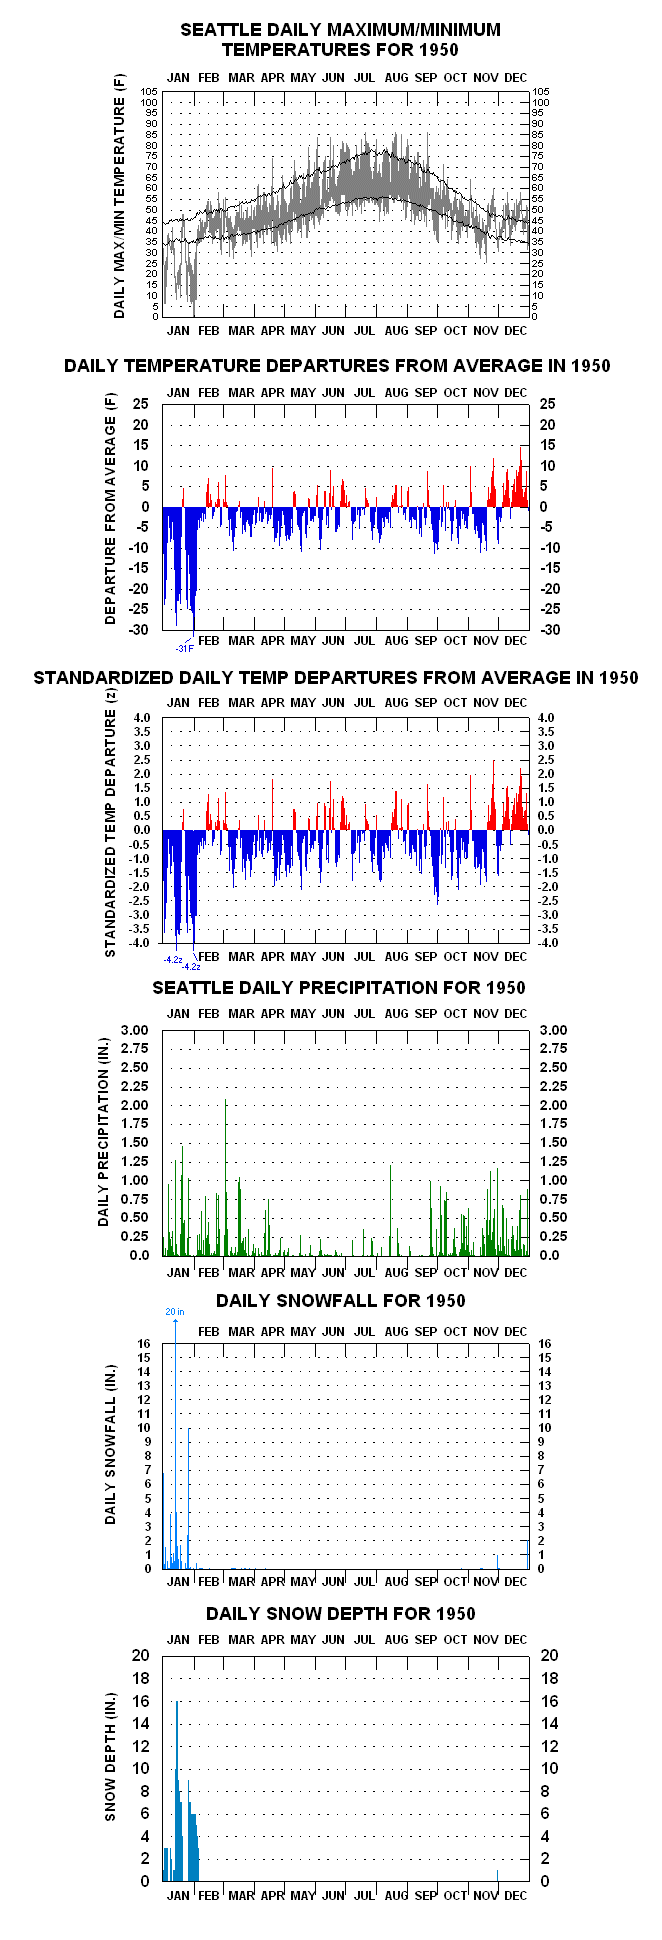
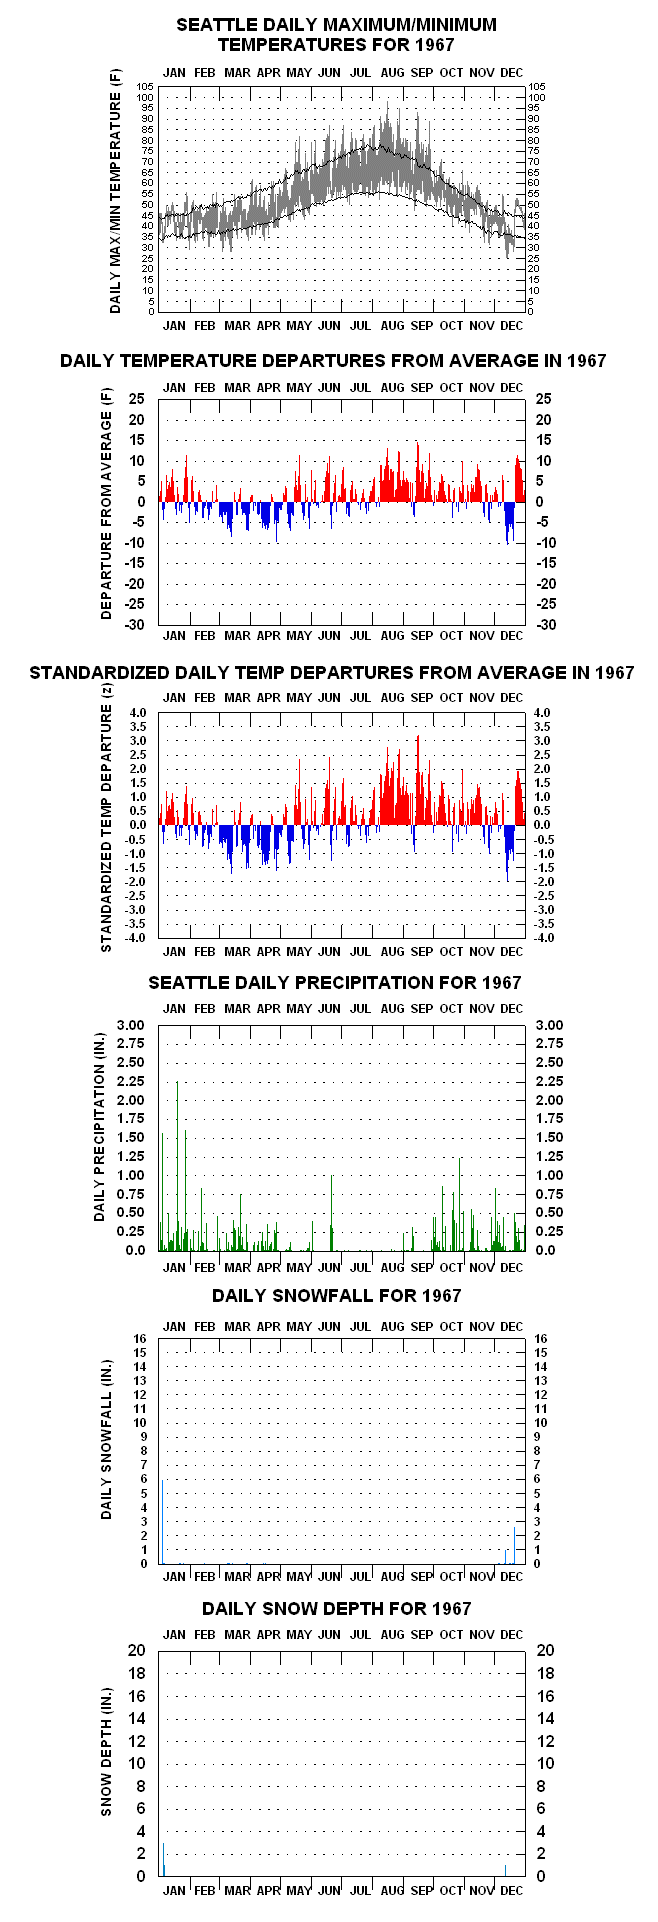
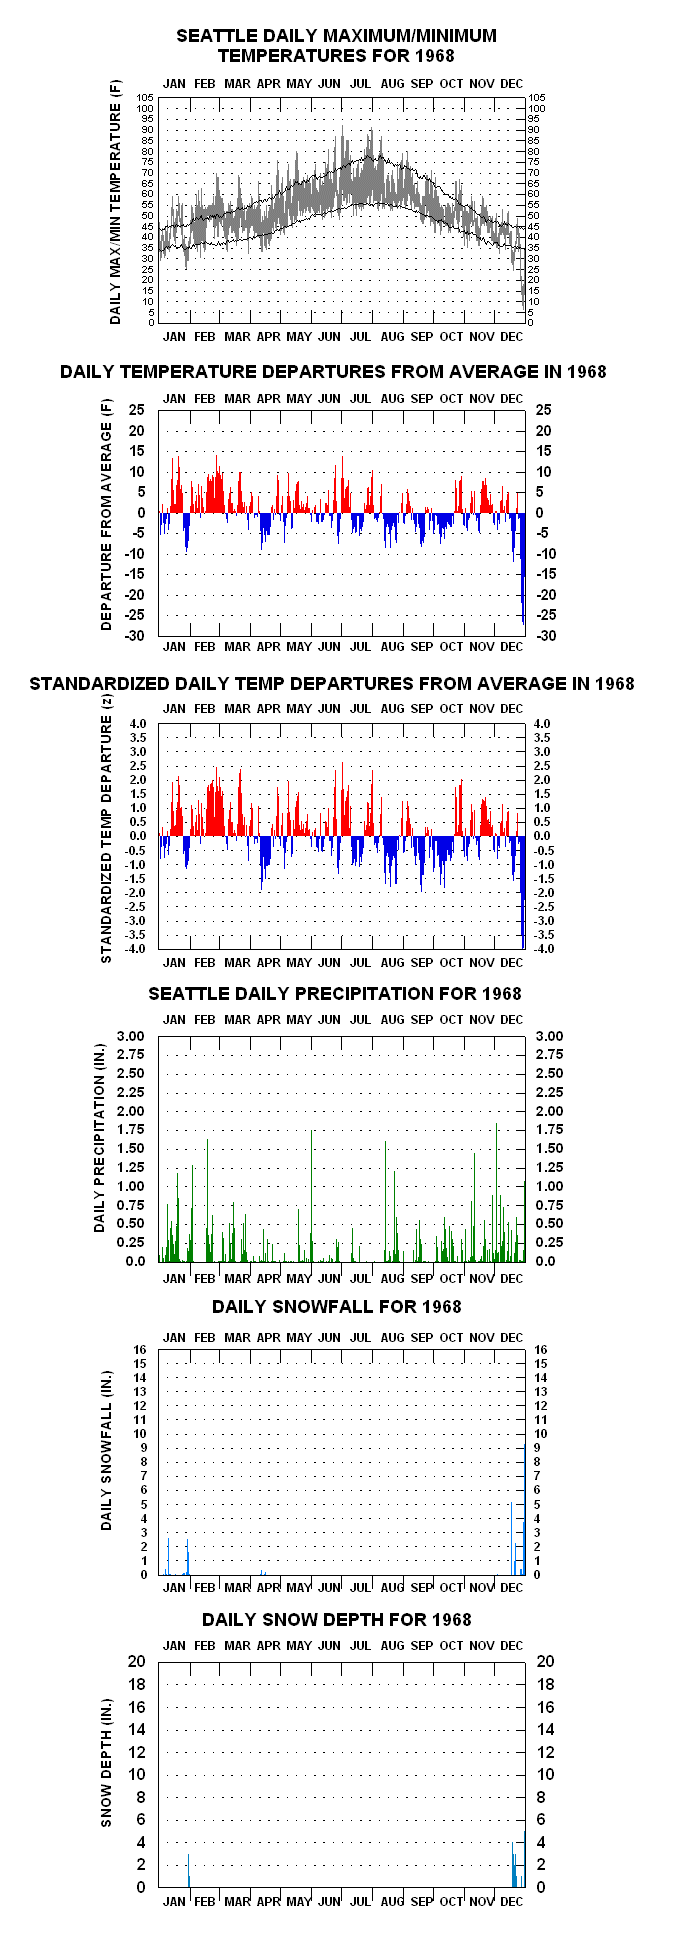
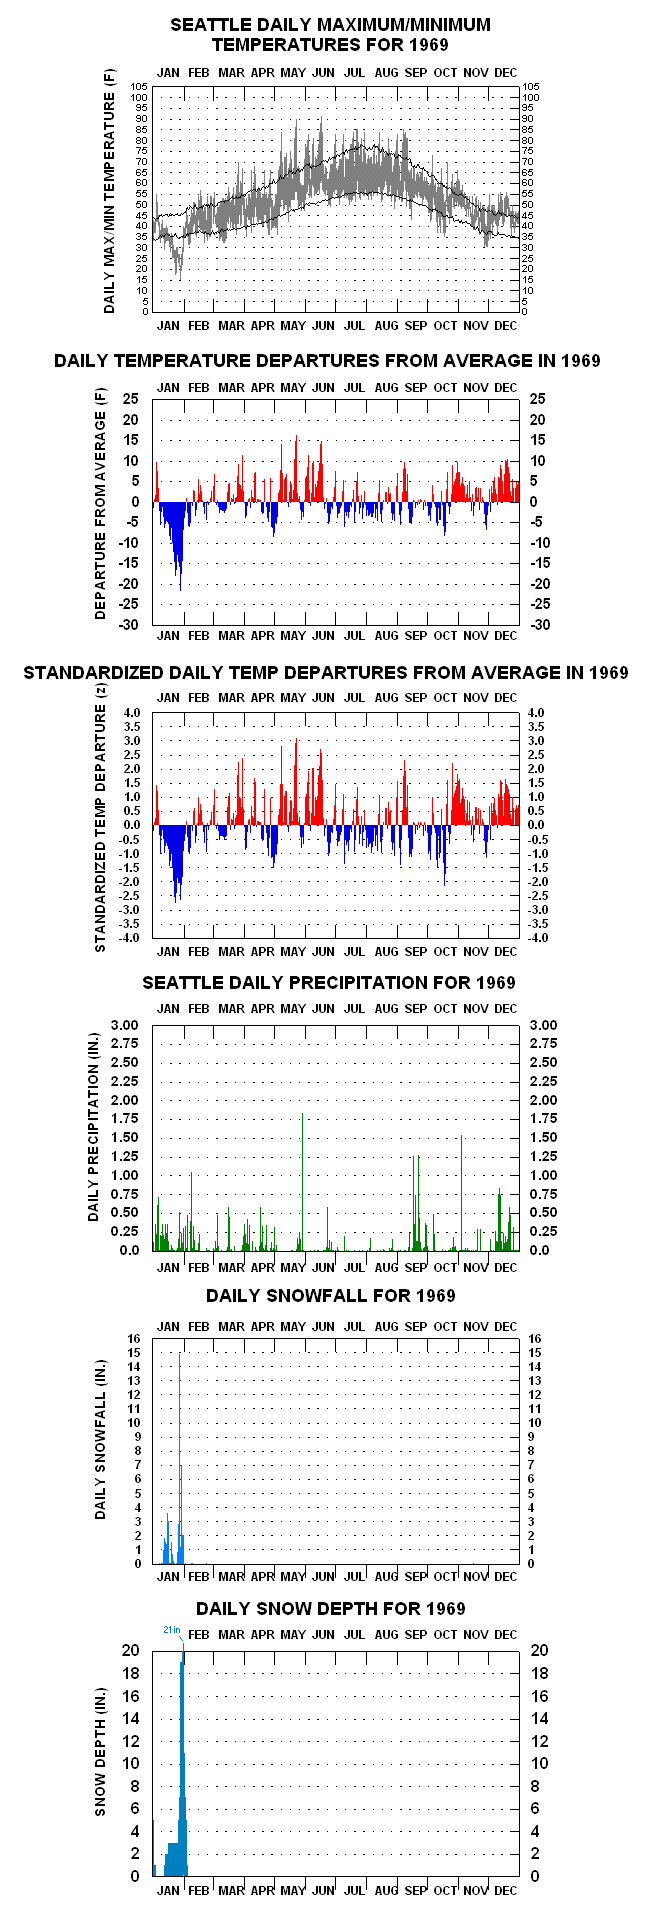
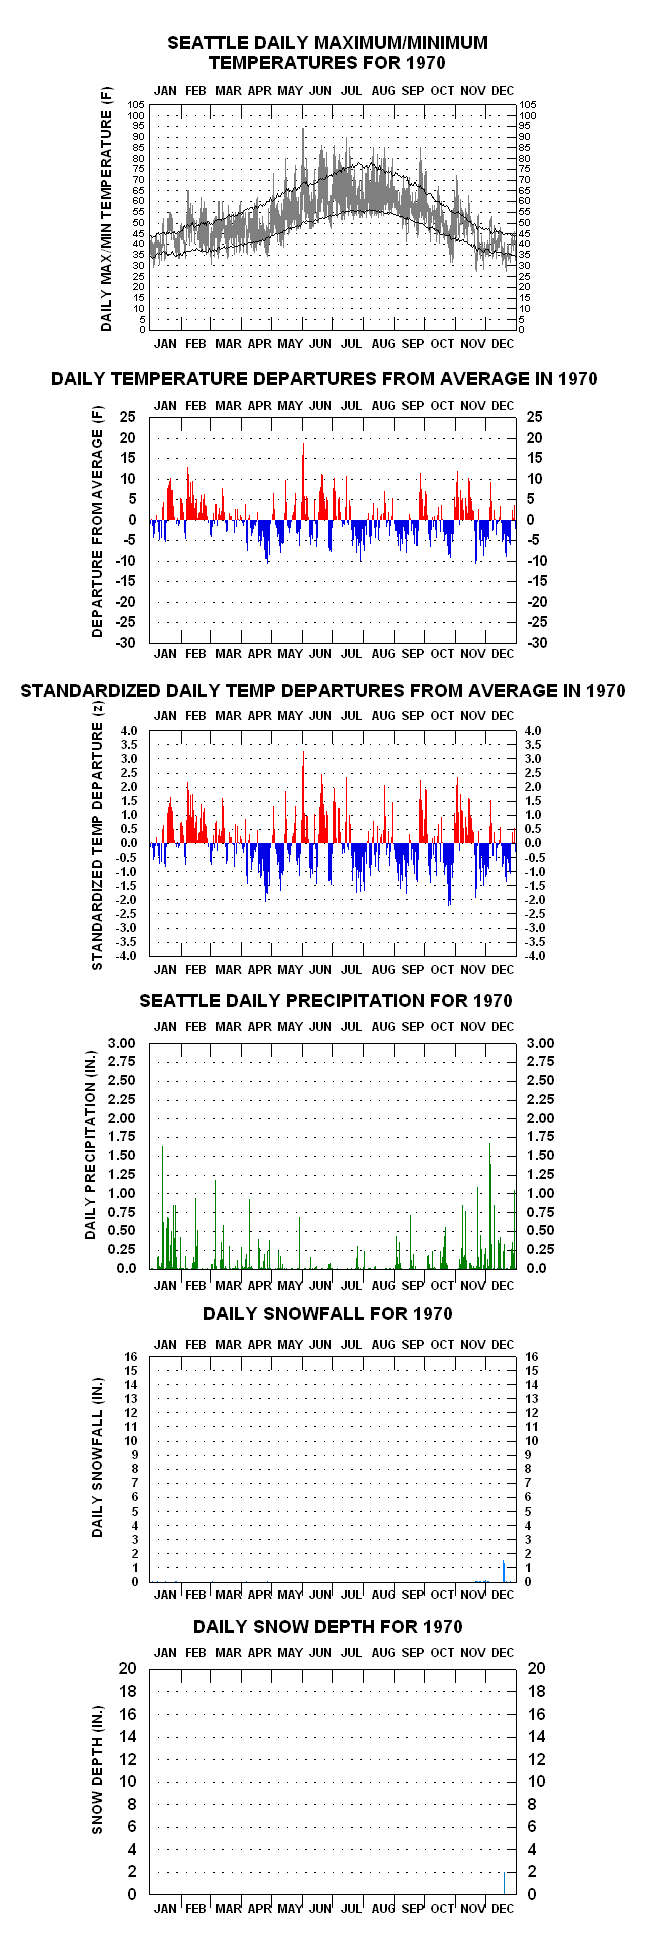
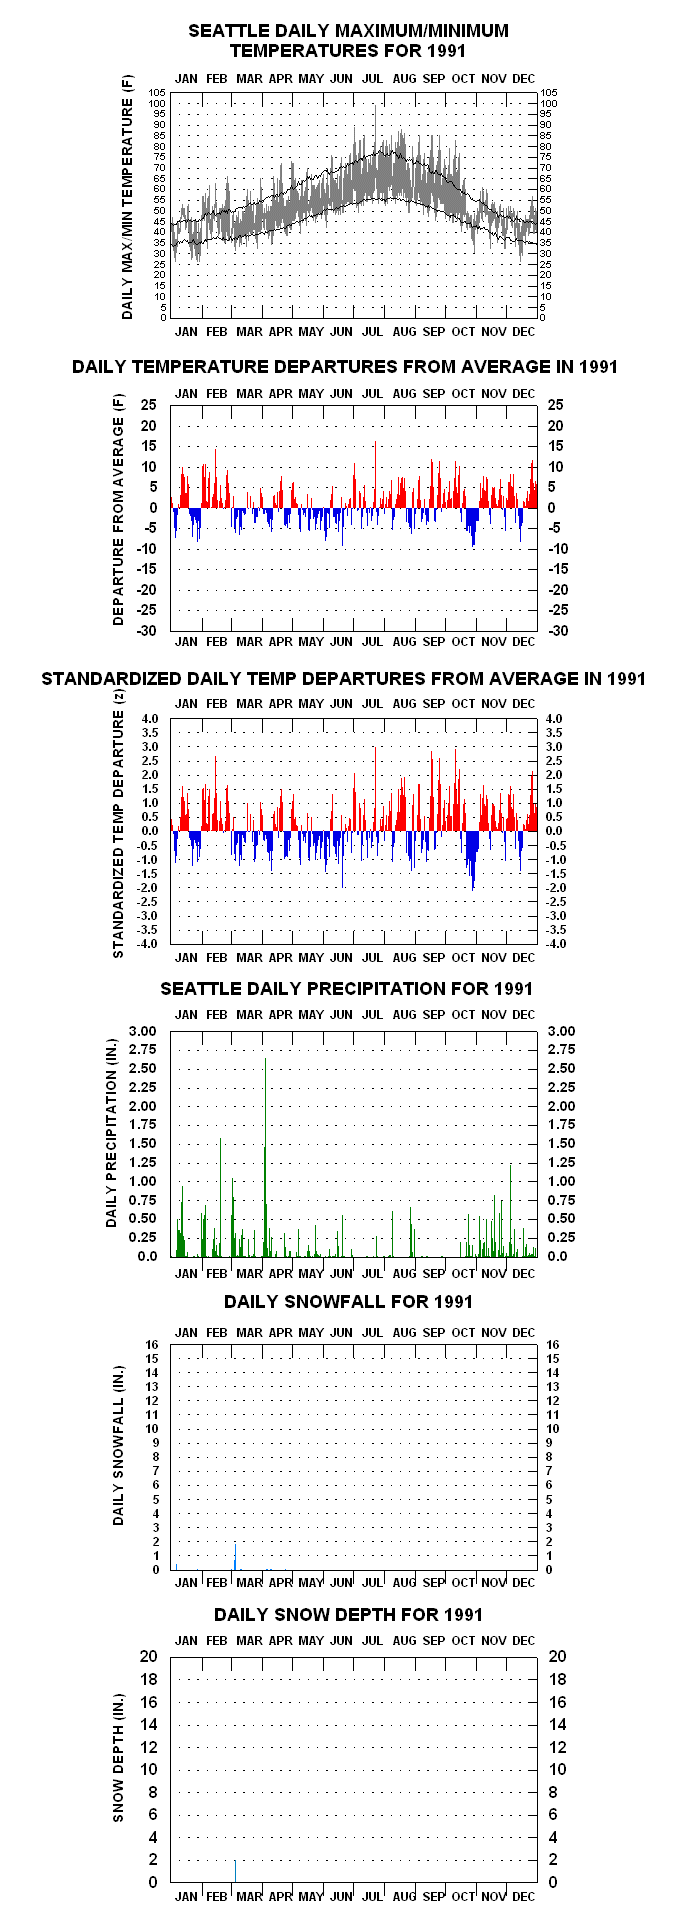
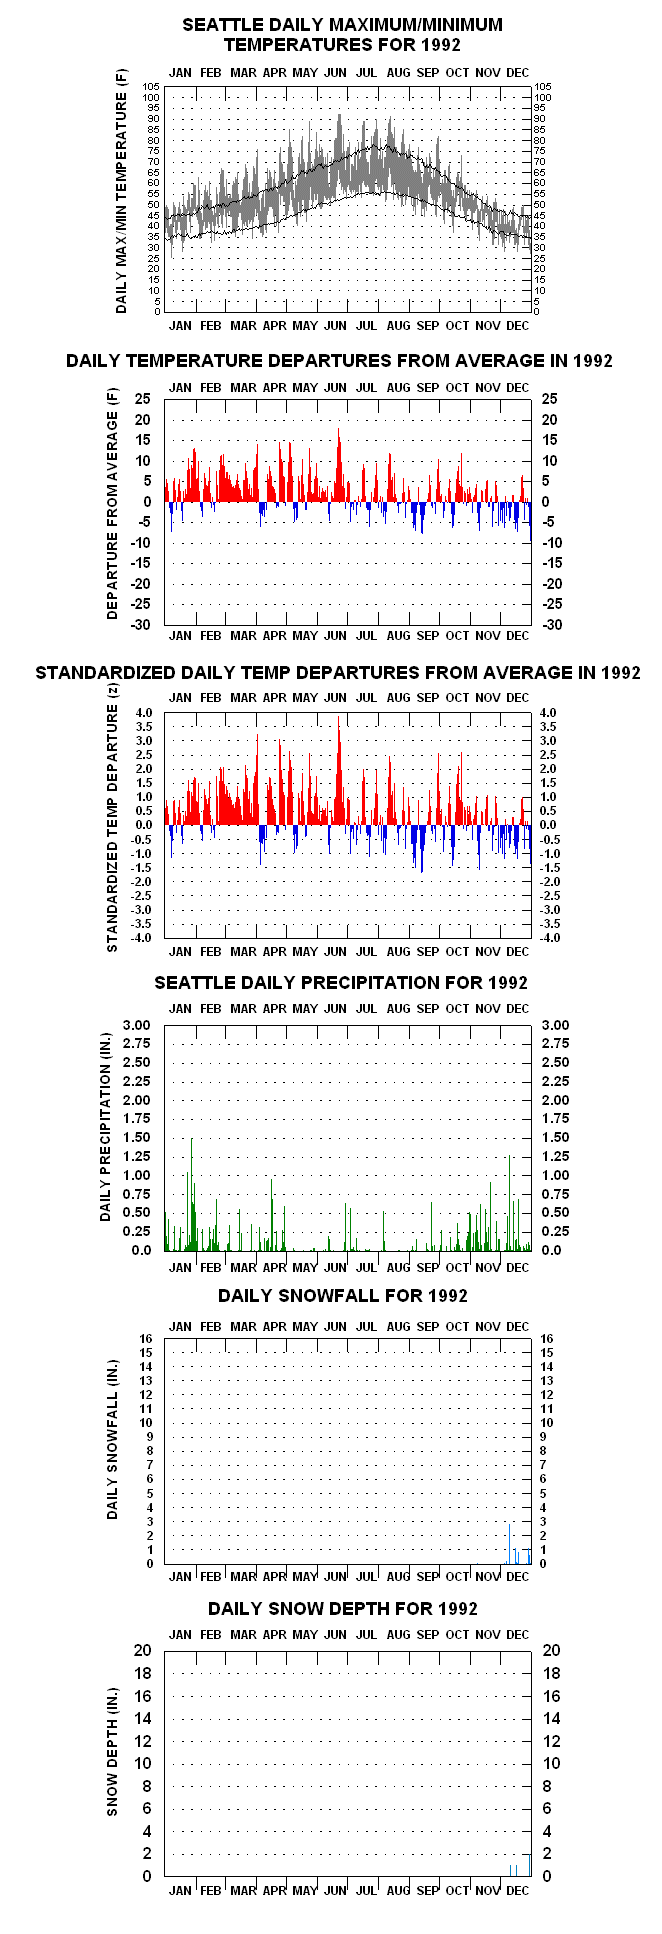
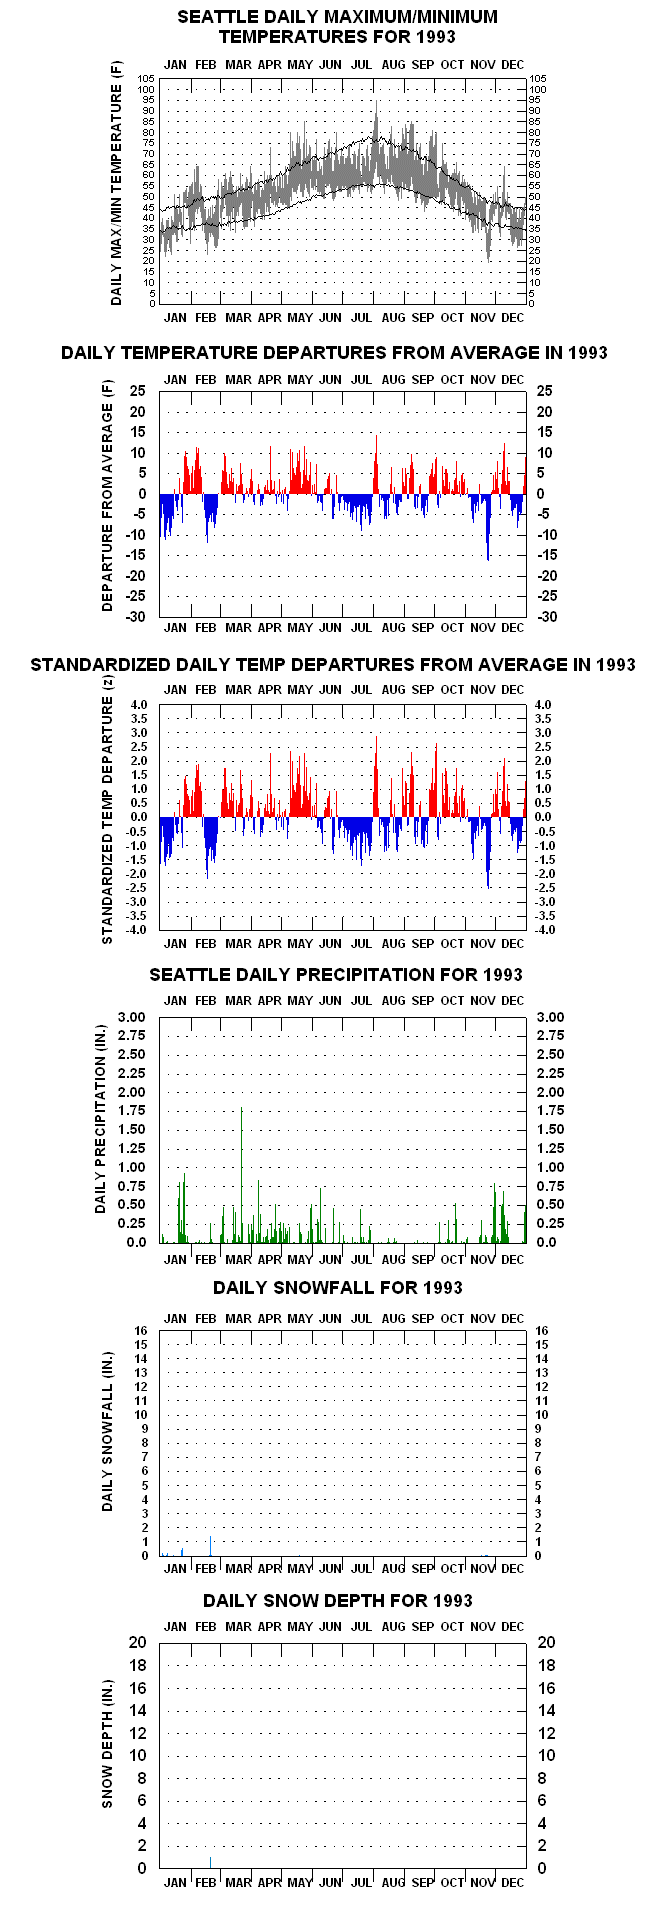
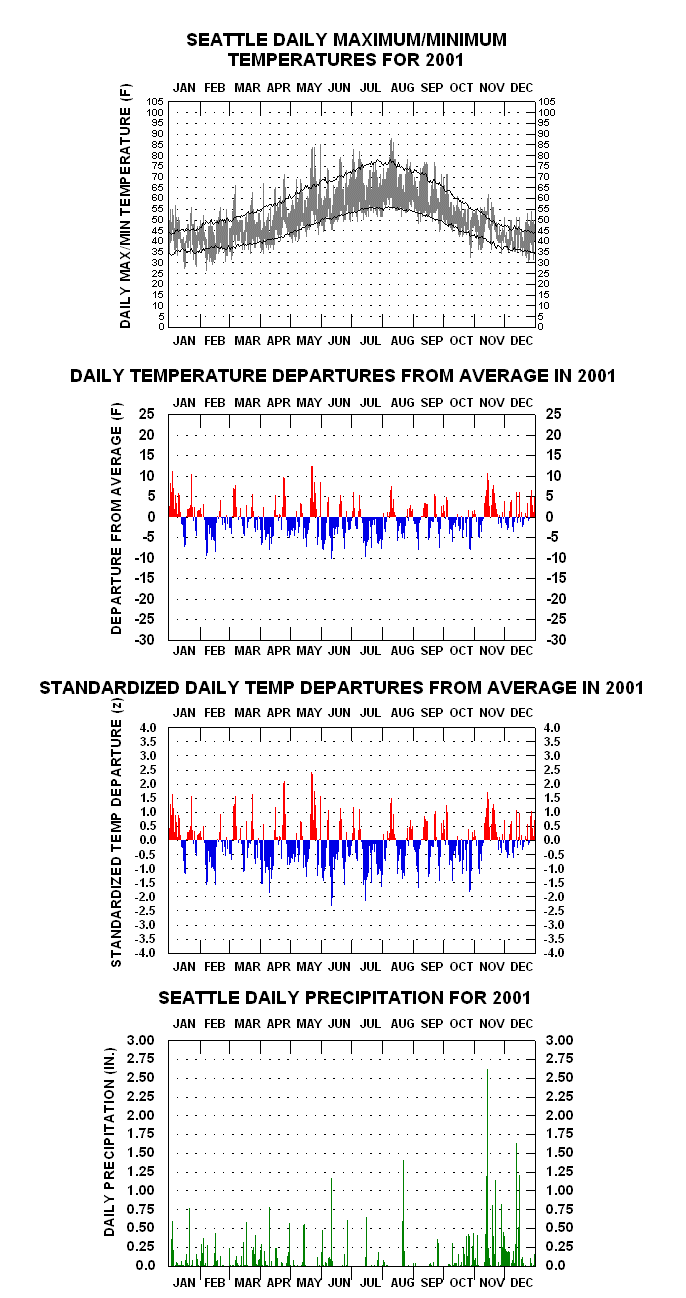
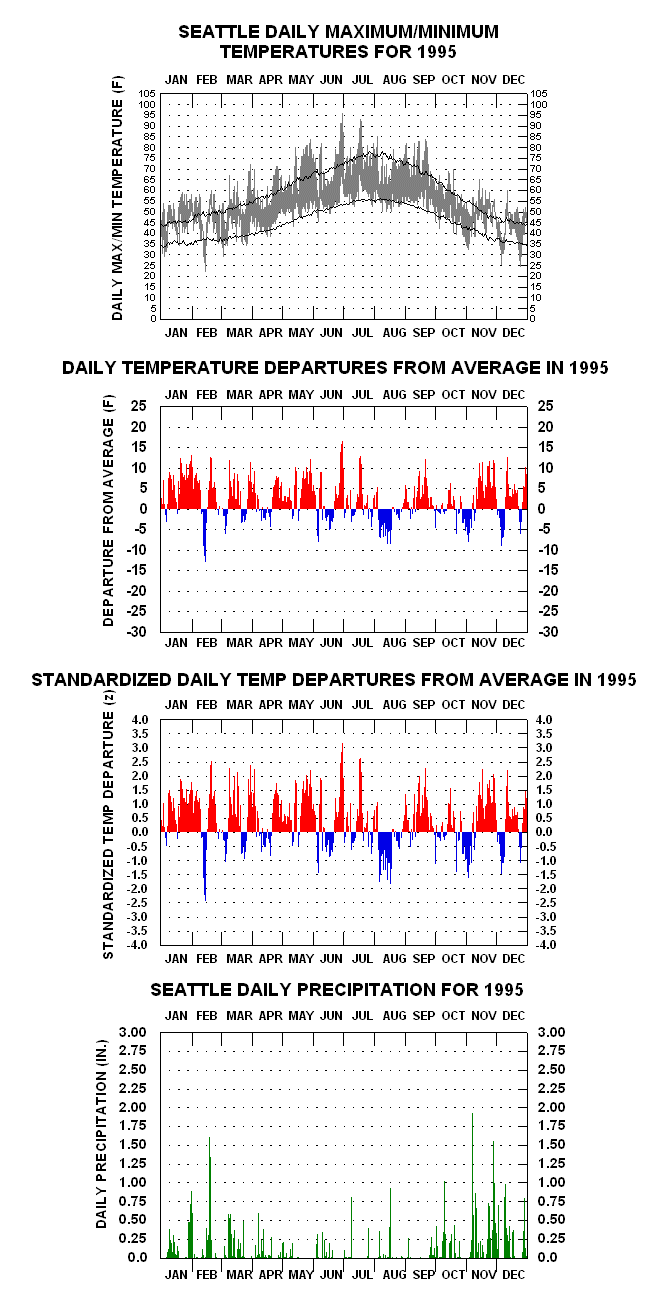
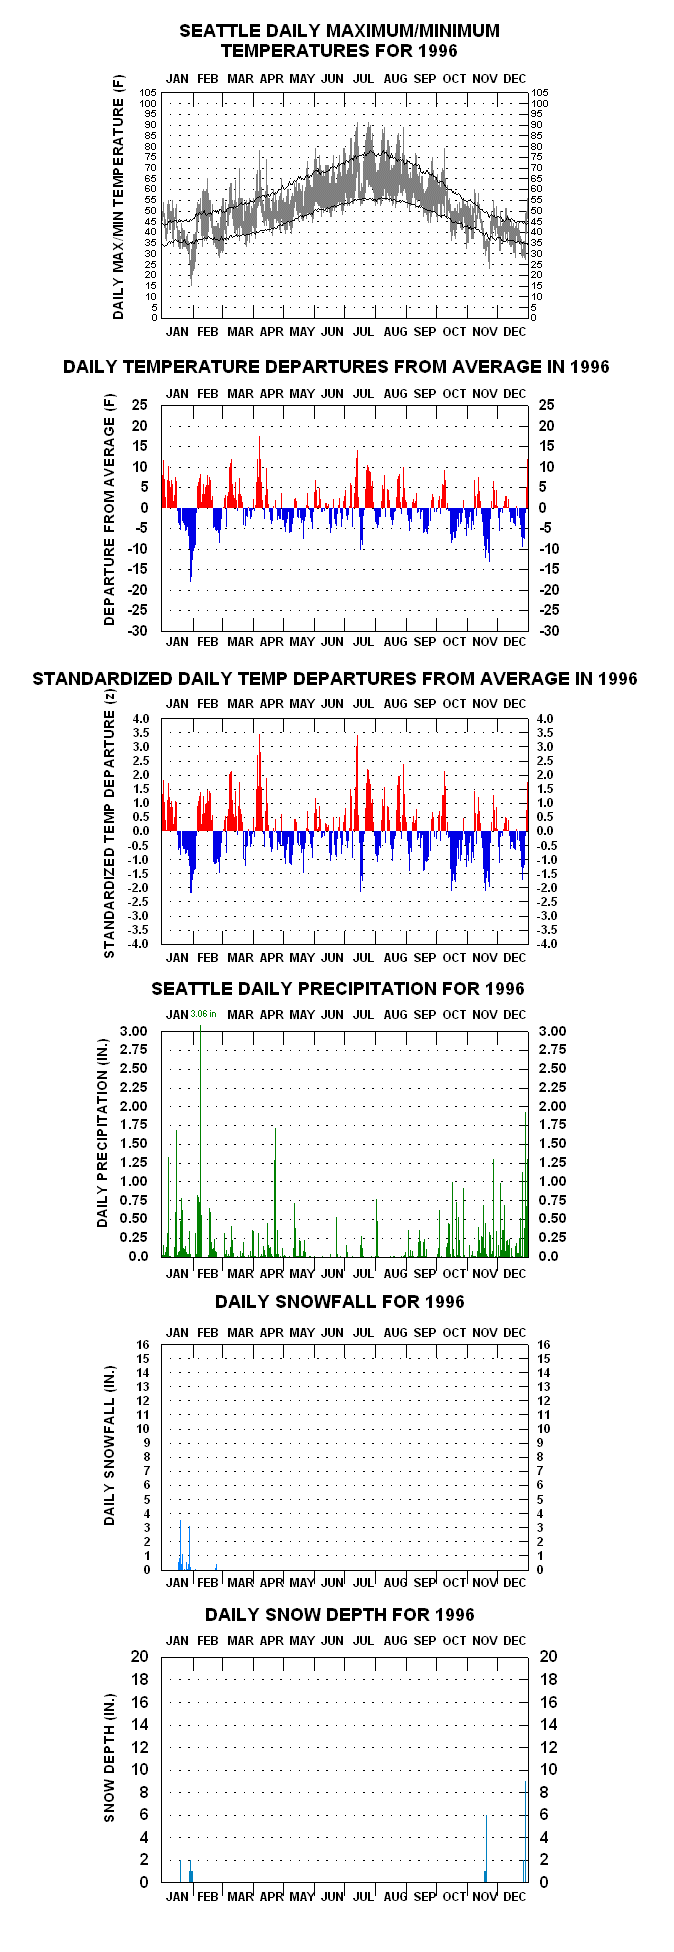
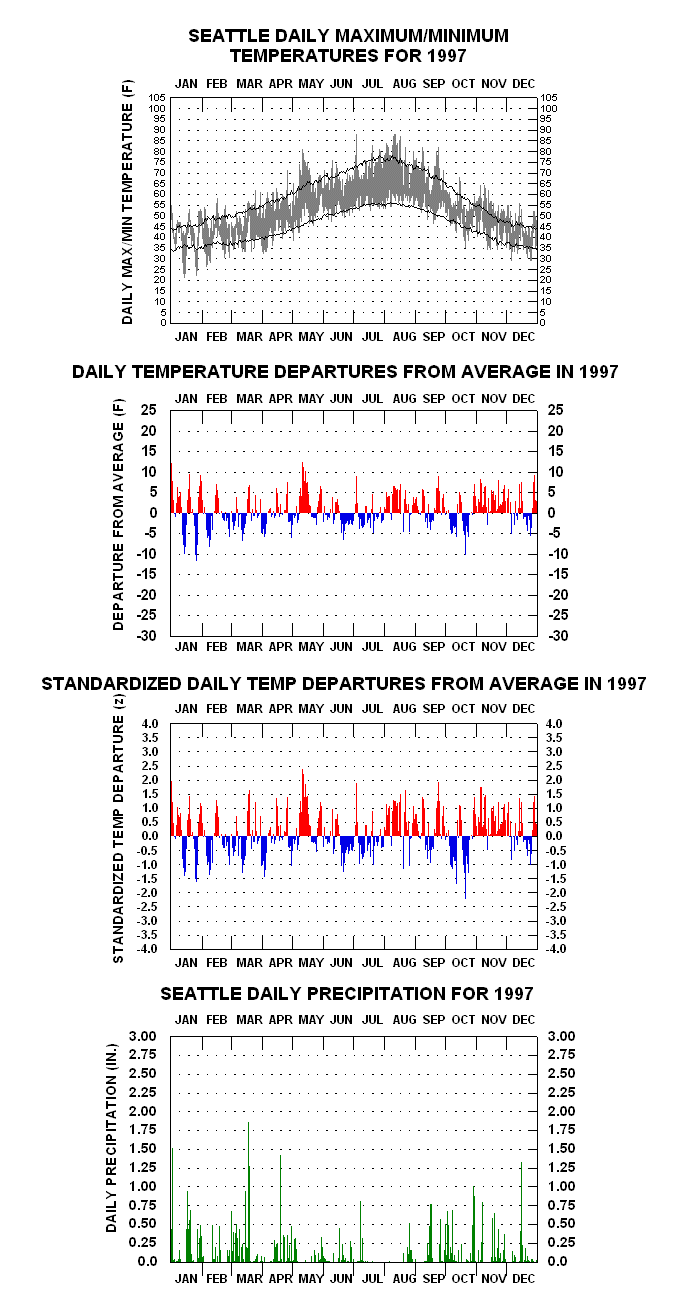
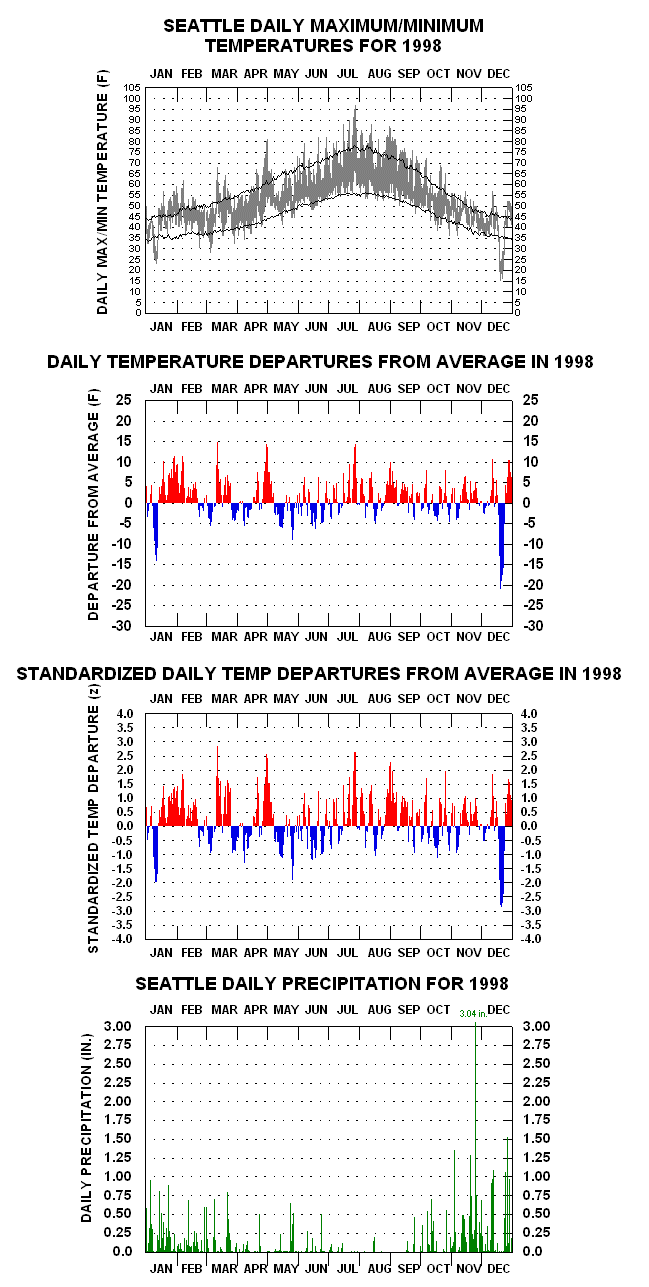
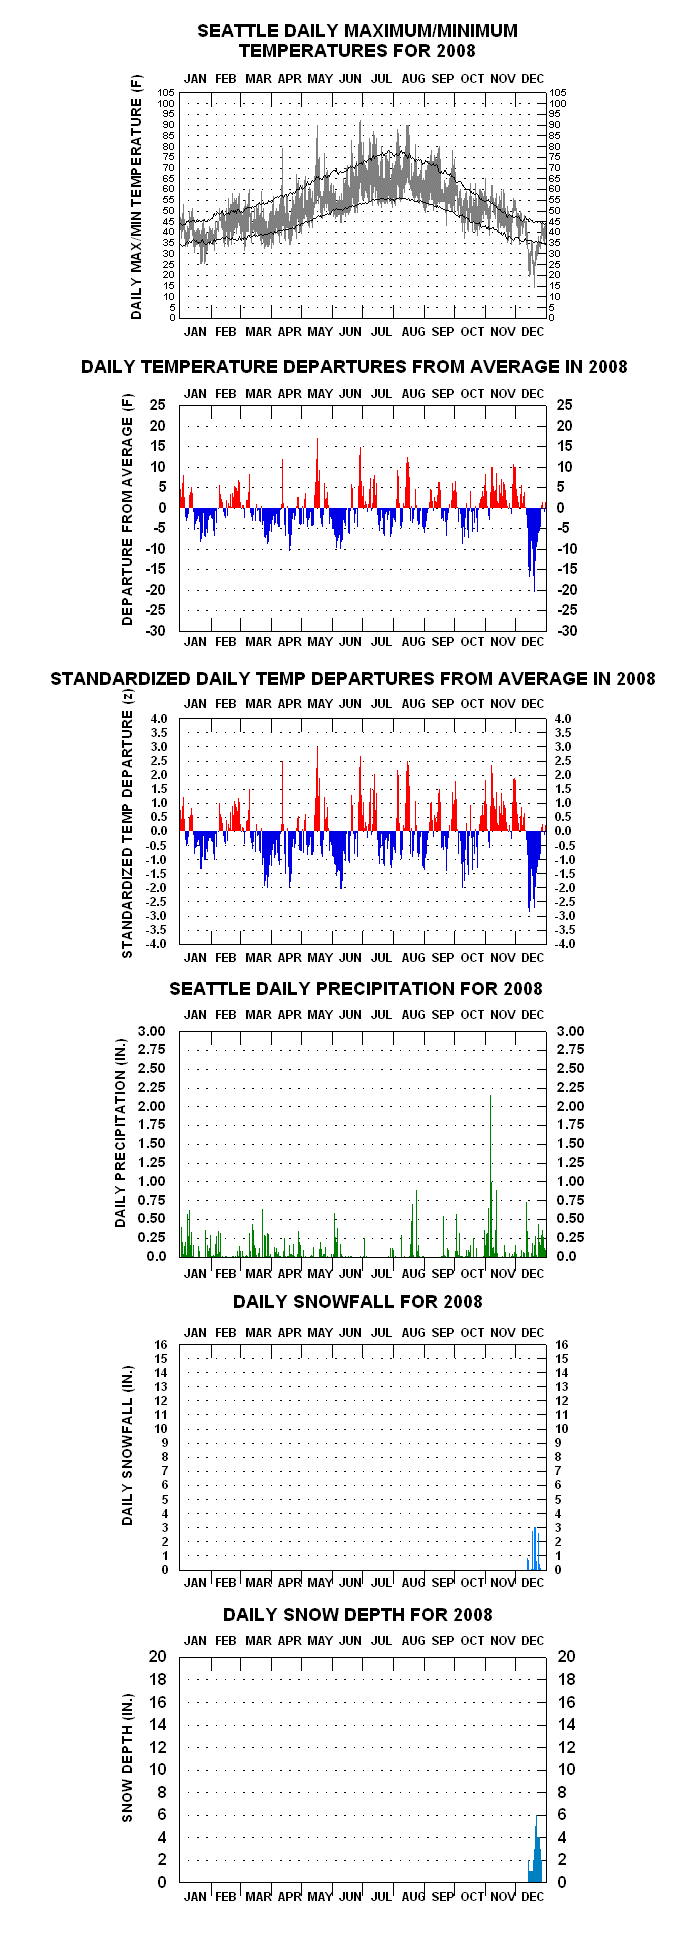
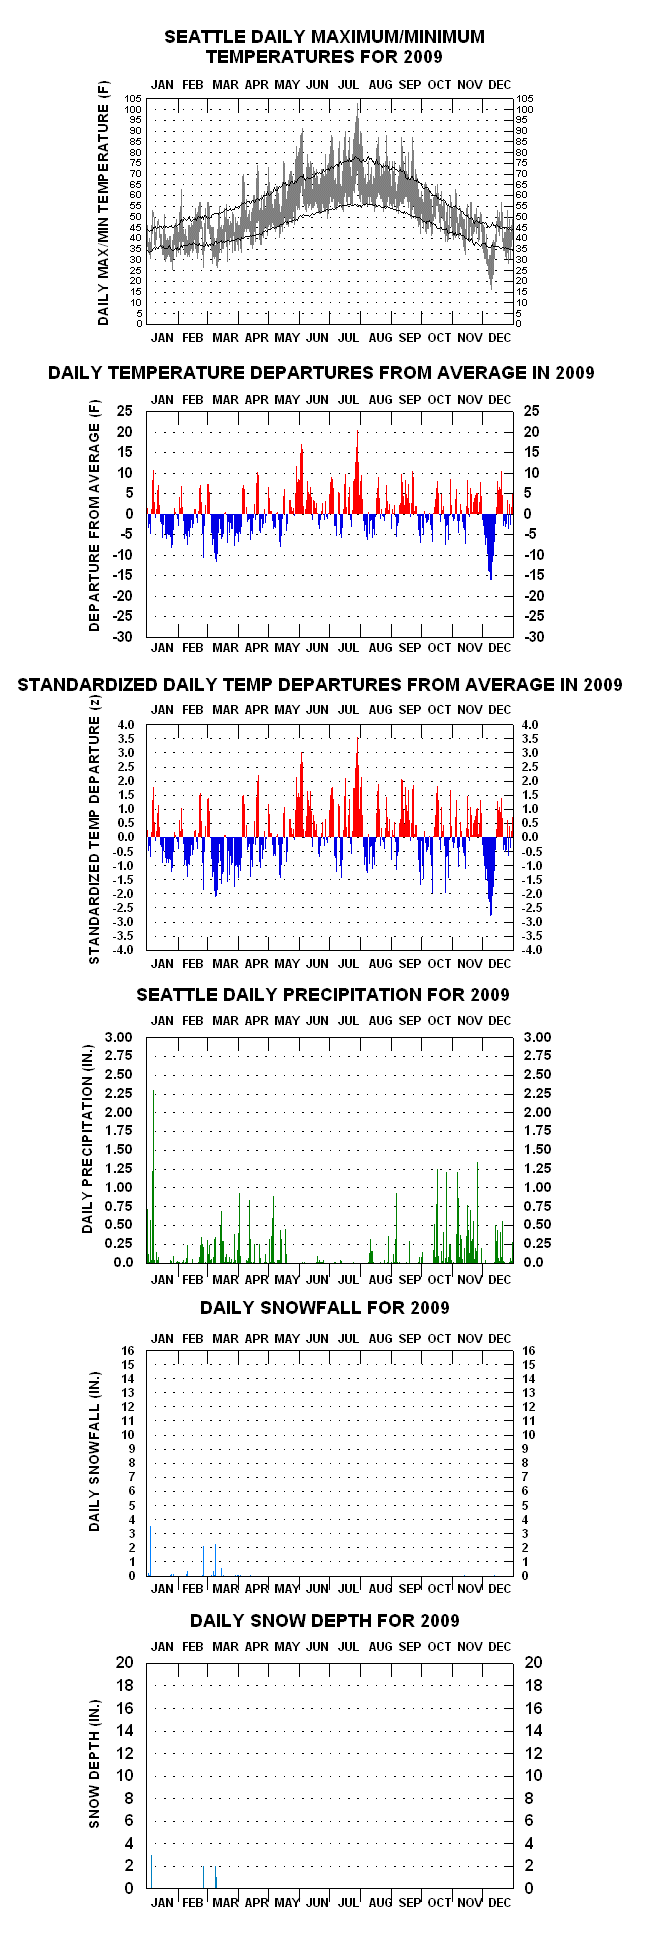
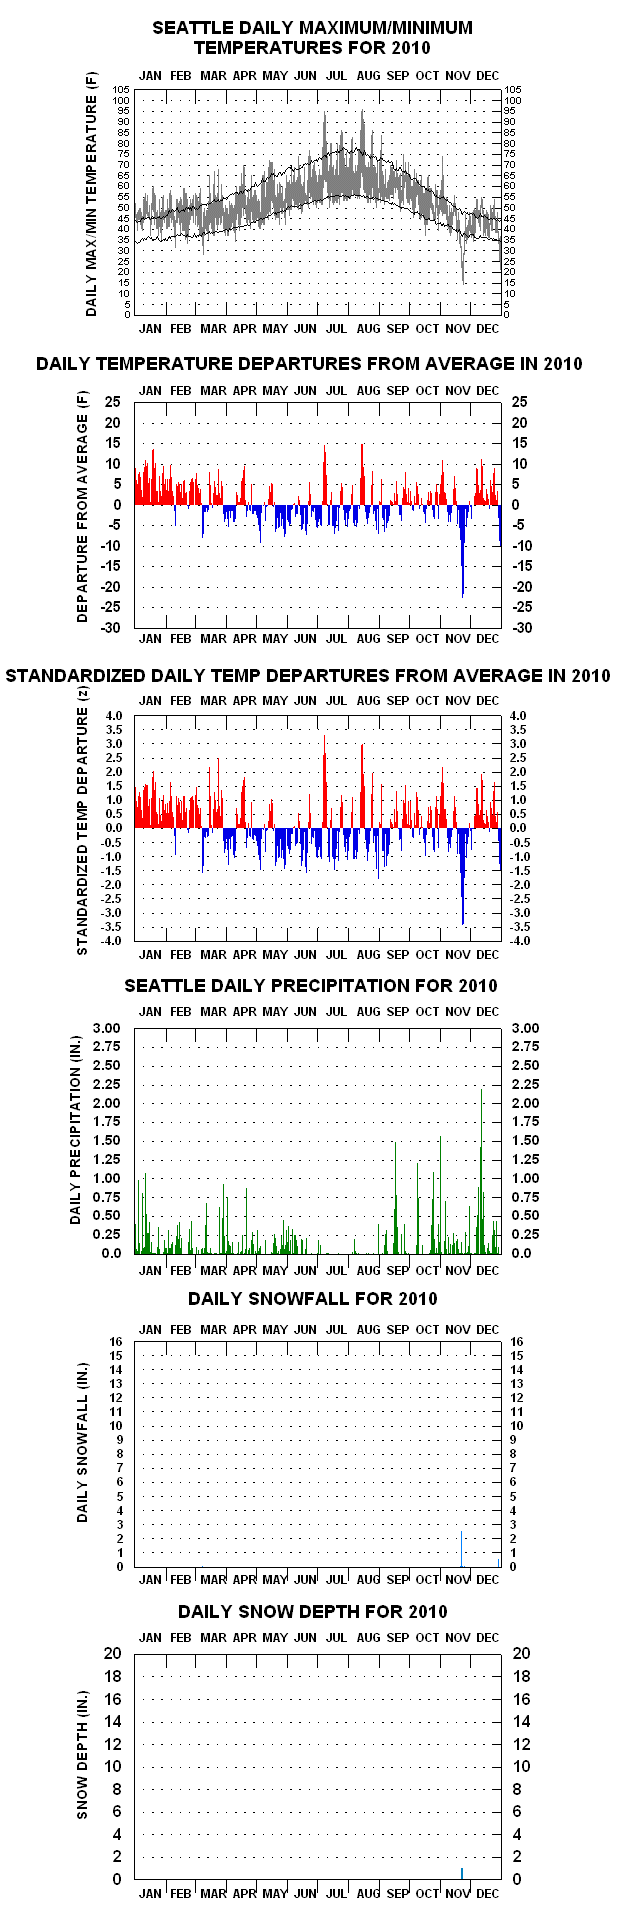
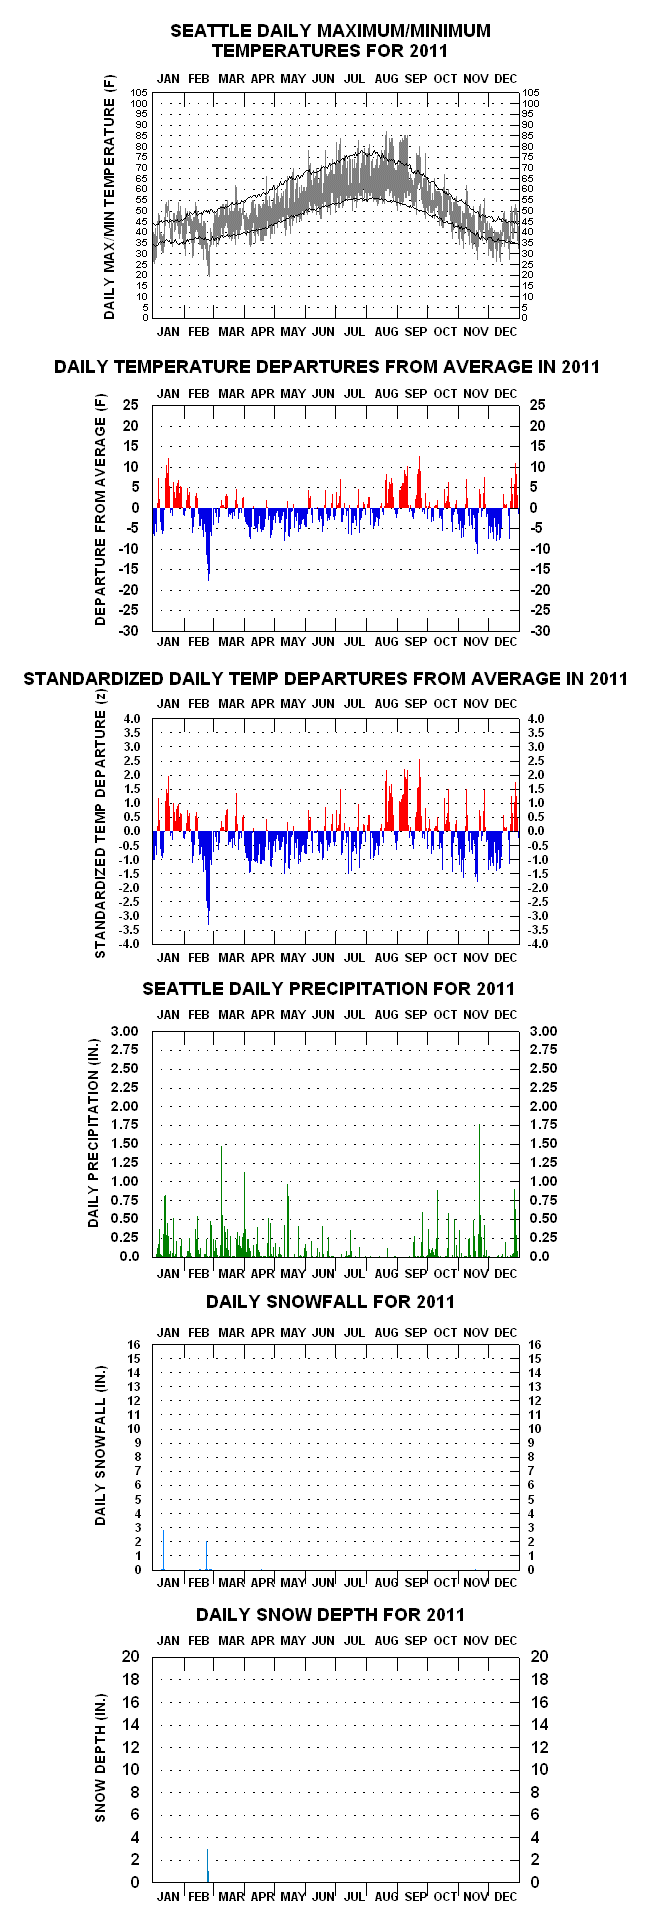
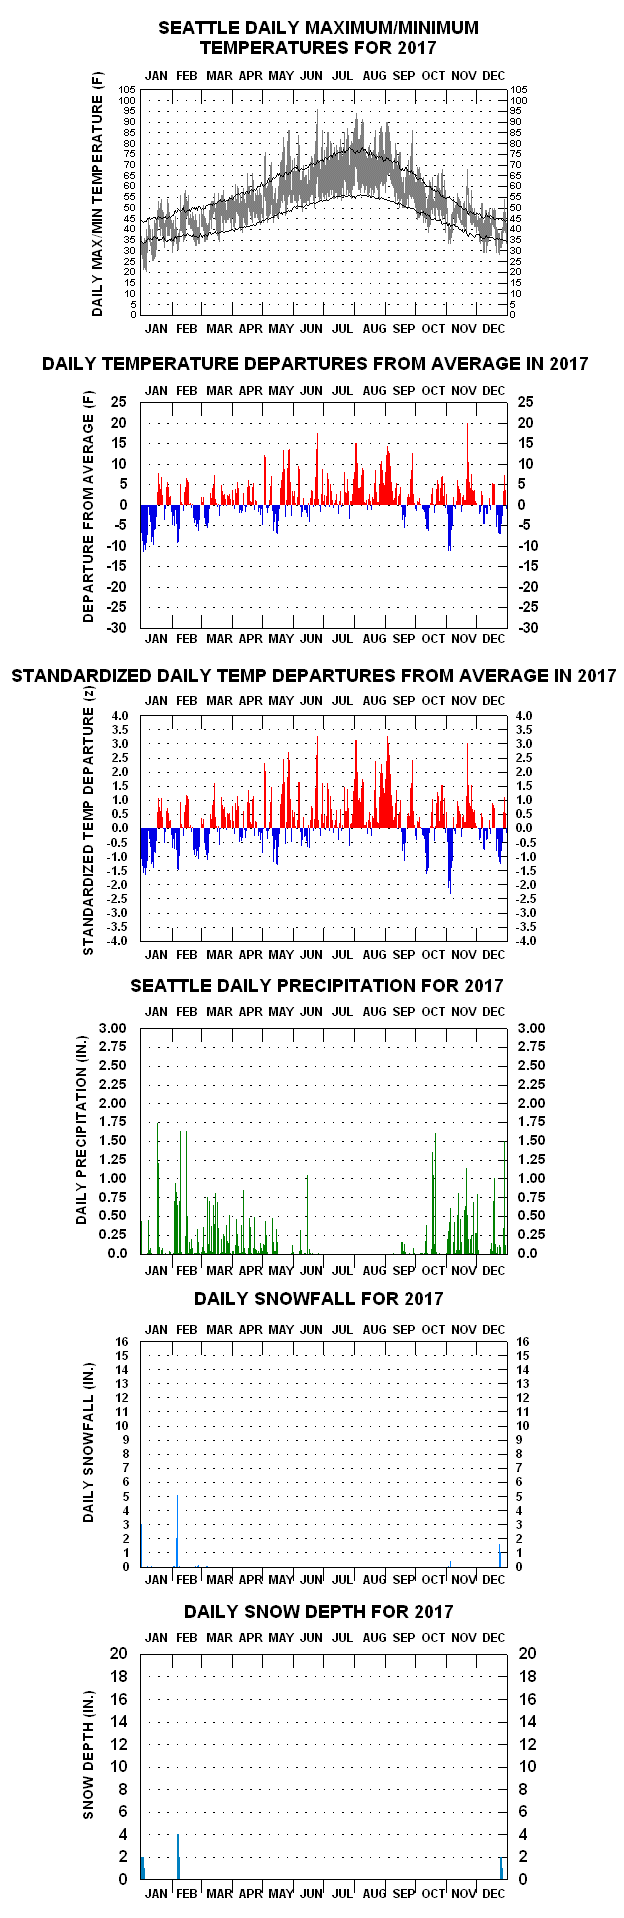
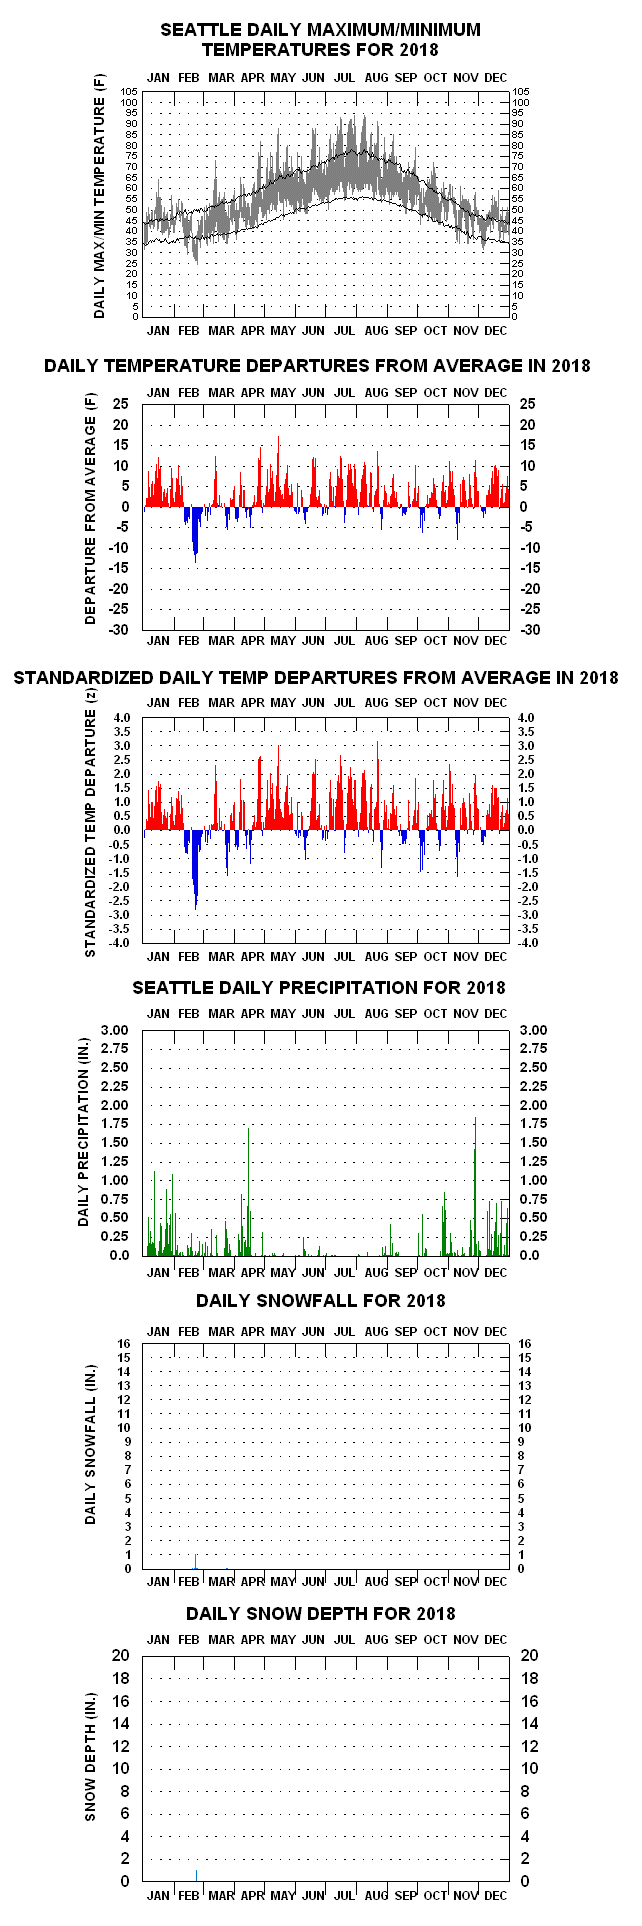
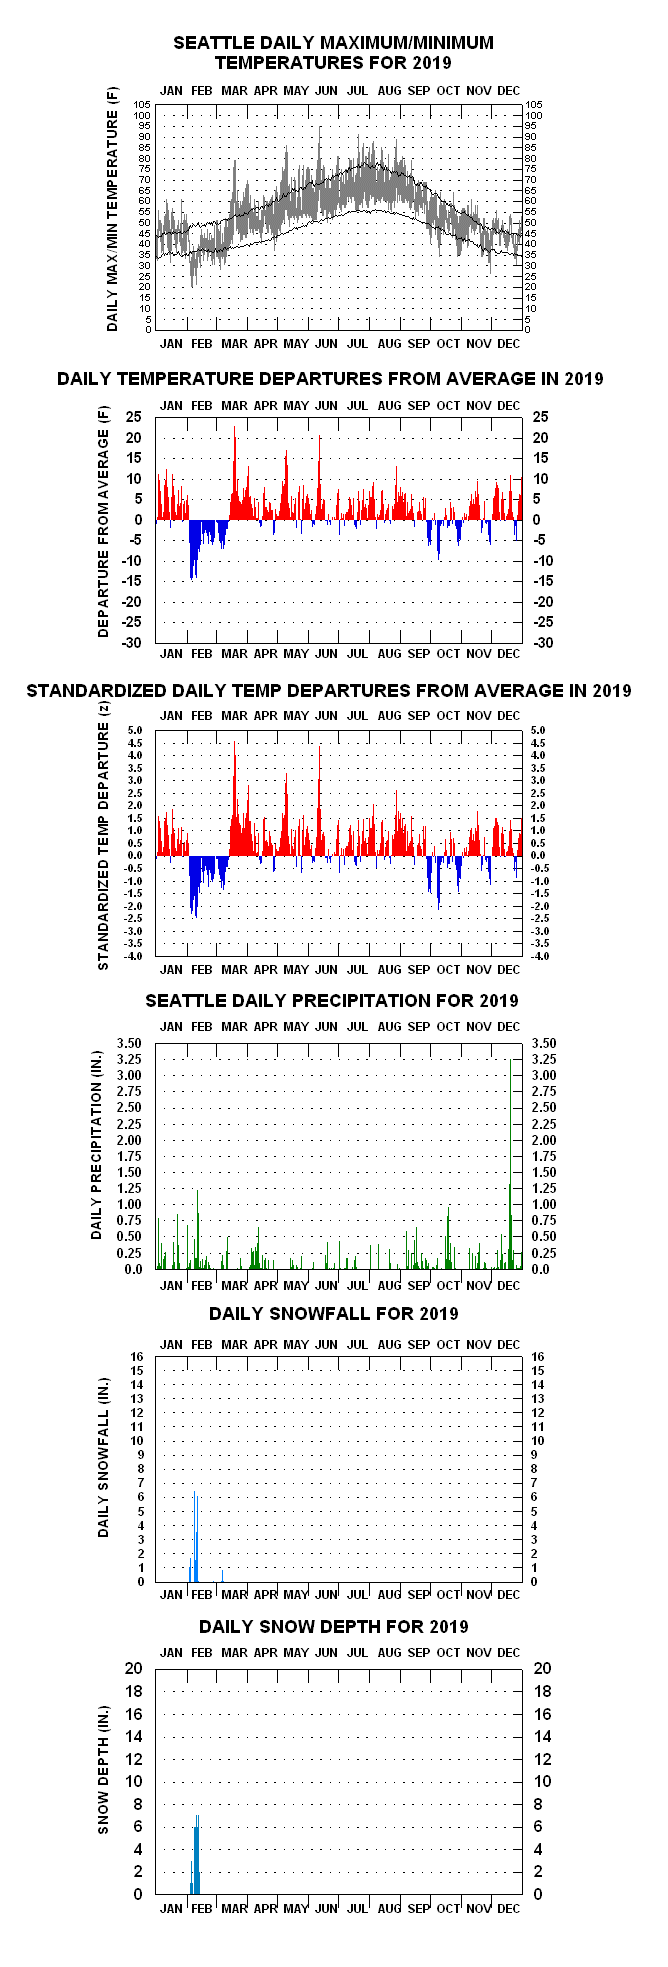
The uppermost graph below displays “floating-bars” of the daily maxima and minima. Each bar represents an individual day’s temperature range. Superimposed are two line traces, the upper one connecting 1948 to present mean daily maxima, the lower one 1948 to present mean daily minima. The bars depict the varying diurnal, synoptic, long-wave, and seasonal influences on temperature over time.
The second chart down shows the arithmetic departures of day-to-day mean temperatures less the corresponding 1948-present calendar-day average means. Vertical lines extending upward from the zero line indicate above average means for the day (colored red), those extending downward indicate below average daily means (colored blue). In the entire series, the most extreme departure of either sign is -31 F on 31 Jan 1950 (associated with a daily maximum: 20 F and daily minimum: 0 F)
(Note: Clicking on the floating-bar charts a second time after they appear on the screen will enlarge them even further).
The third chart down shows the second chart’s departures in deseasonalized or “standardized” form. Standardized anomalies are calculated by dividing the arithmetic anomaly by the climatological mean temperature standard deviation for the calendar day in question, creating “z-scores”. Through 2017, the most extreme z-score was -4.95 z, for 15 Nov 1955 .
The fourth chart down depicts daily rainfall, as high as 5.02 inches (20 Oct 2003), the fifth (when applicable) shows snowfall, as high as 20.0 inches (13 Jan 1950), and the sixth (when applicable) snow depth, as high as 21 inches (13 Jan 1969).
Year-To-Year Graphs — OLDER YEARS
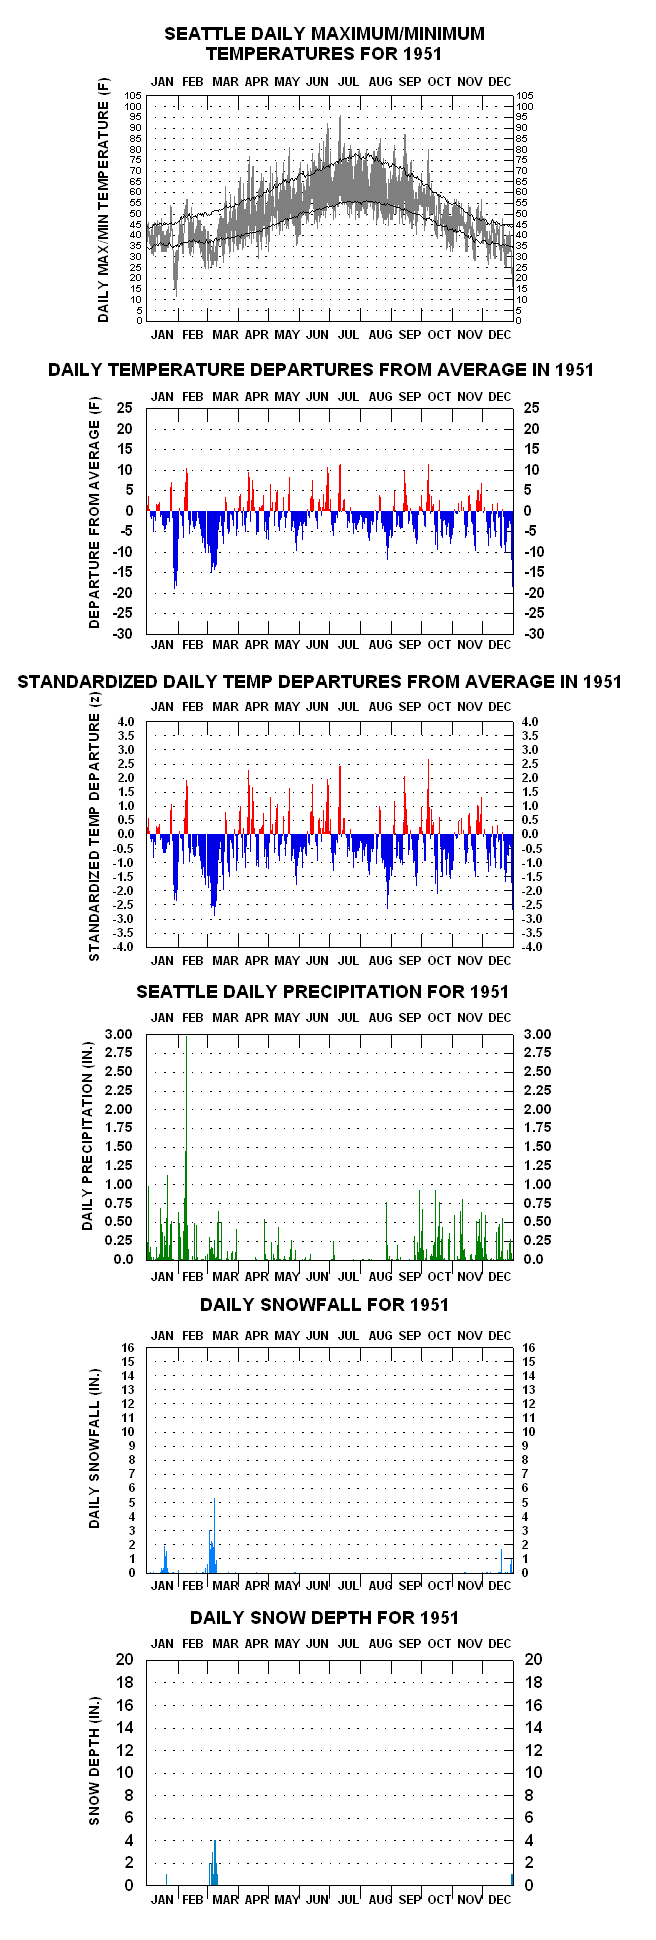
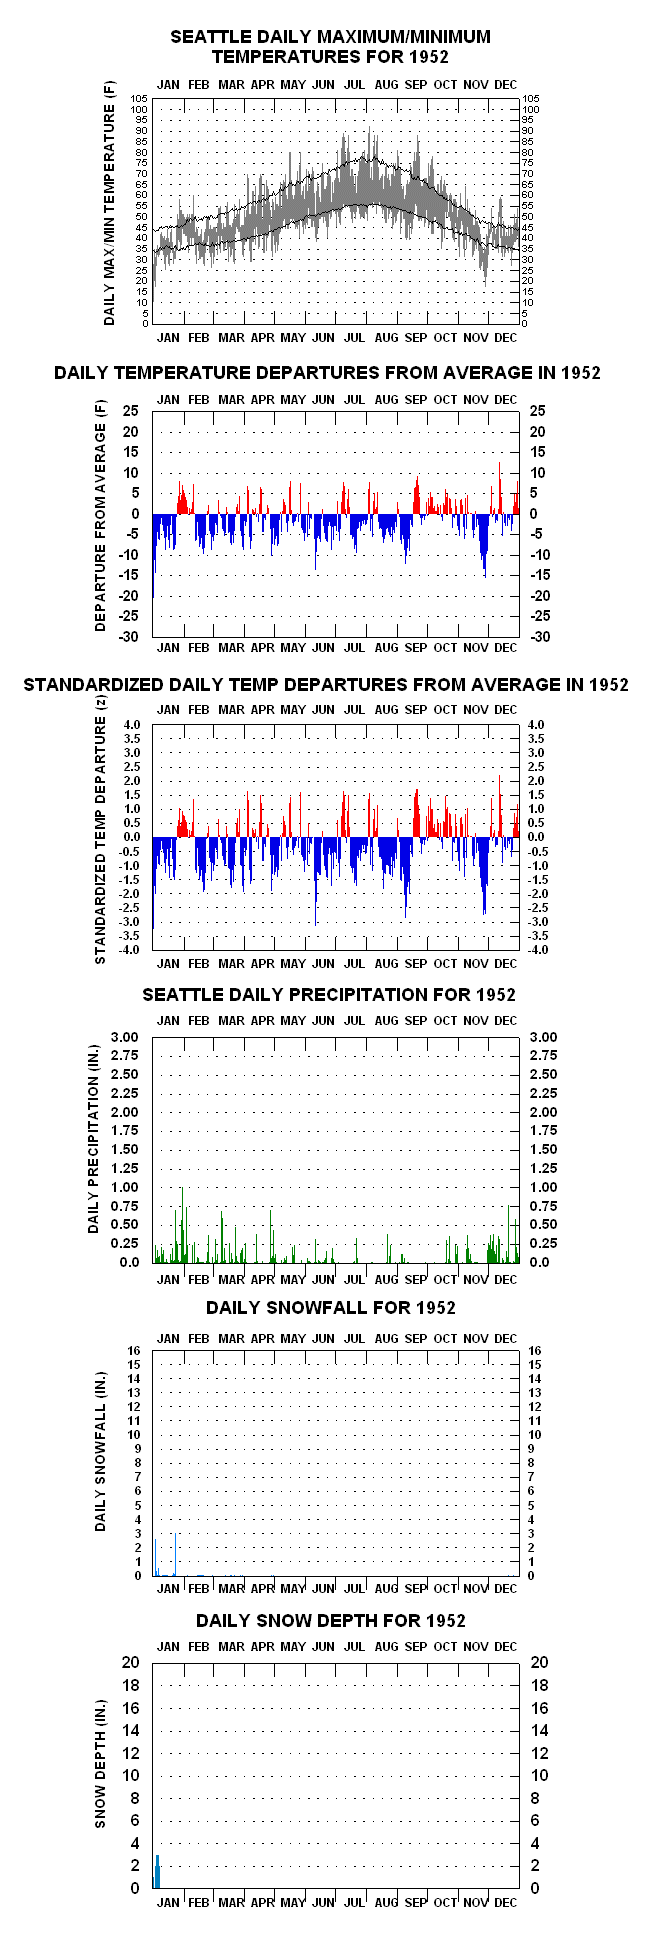
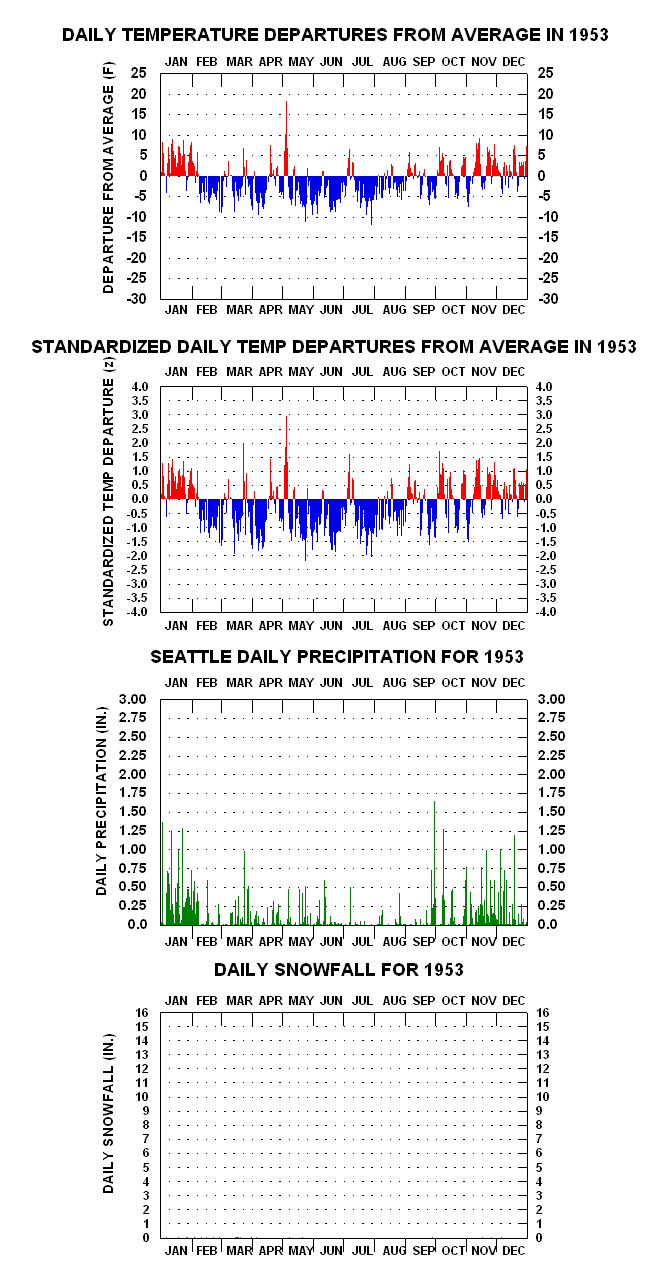
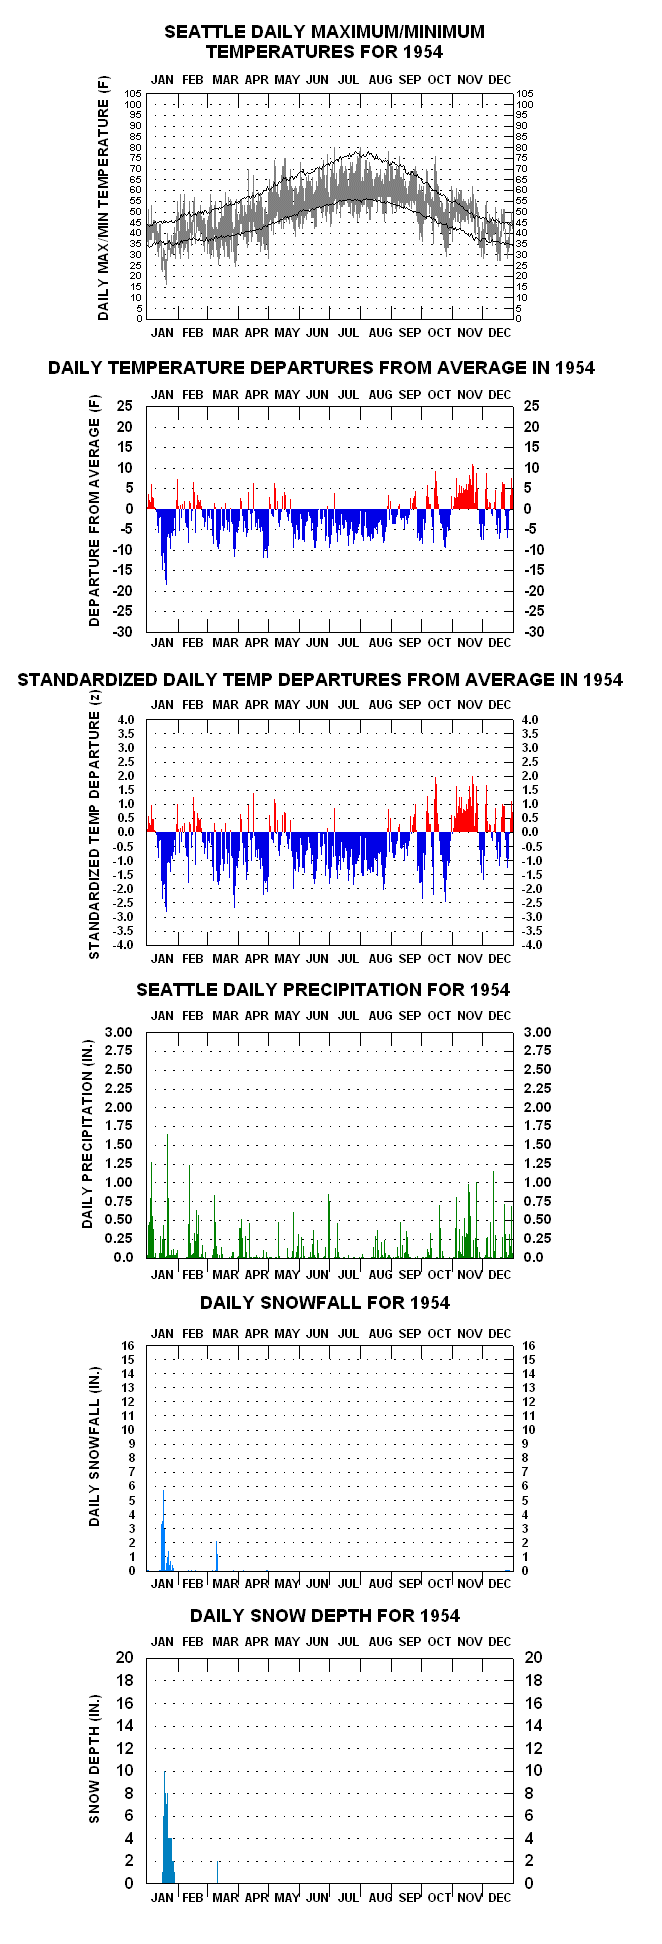
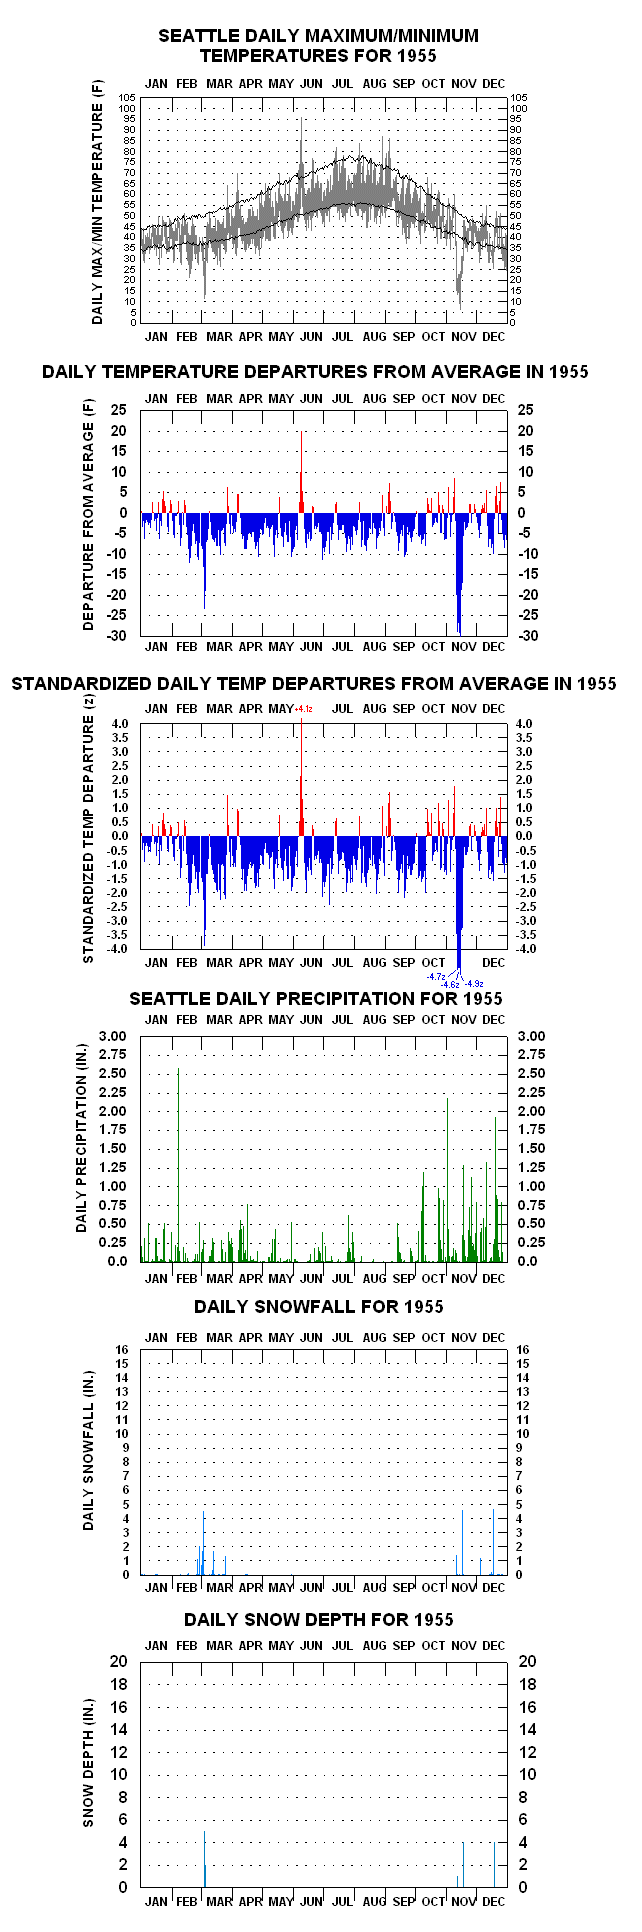
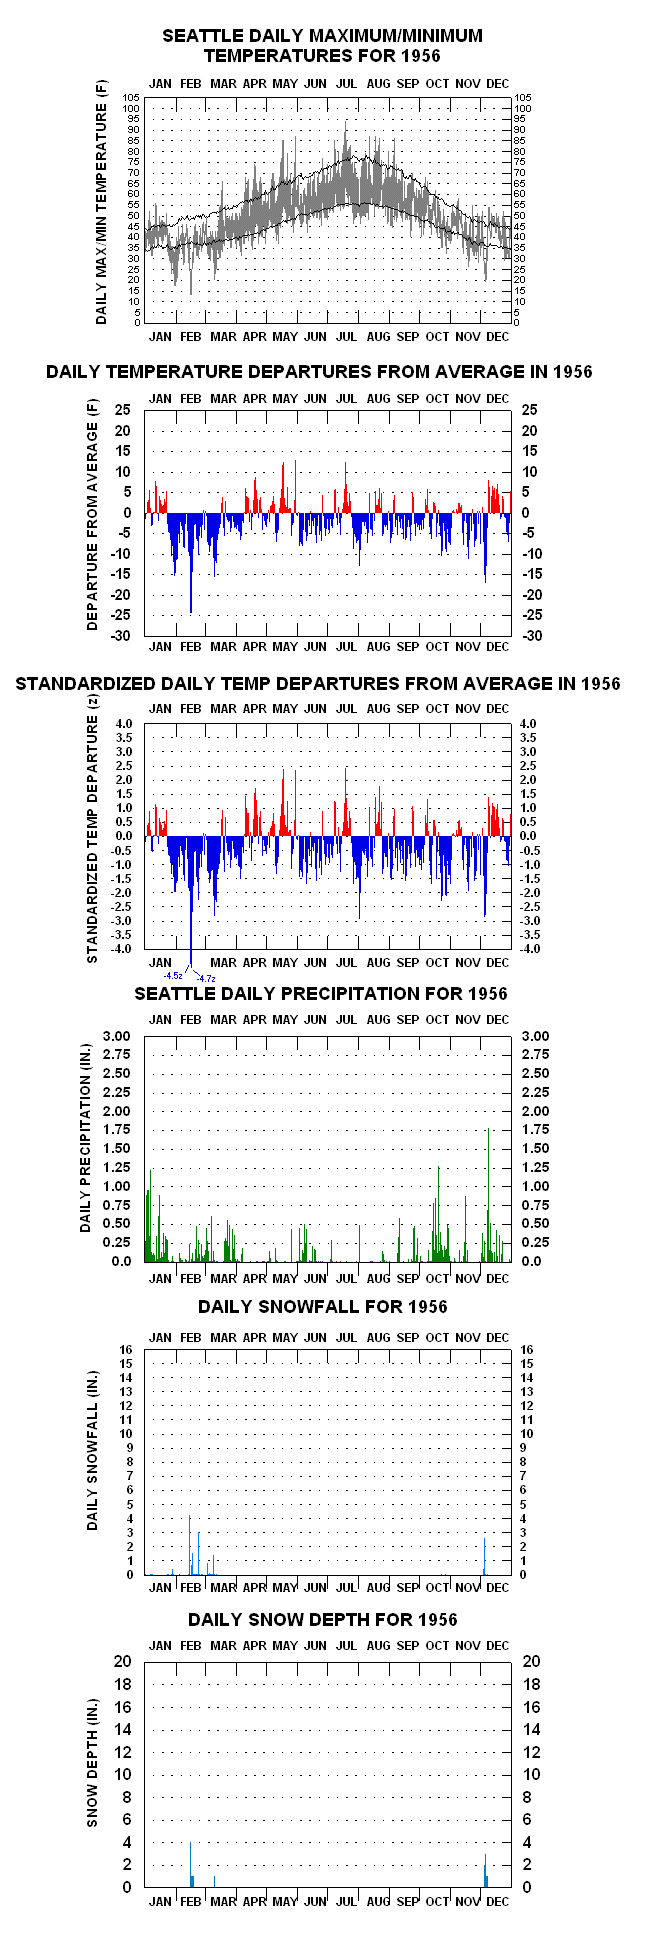
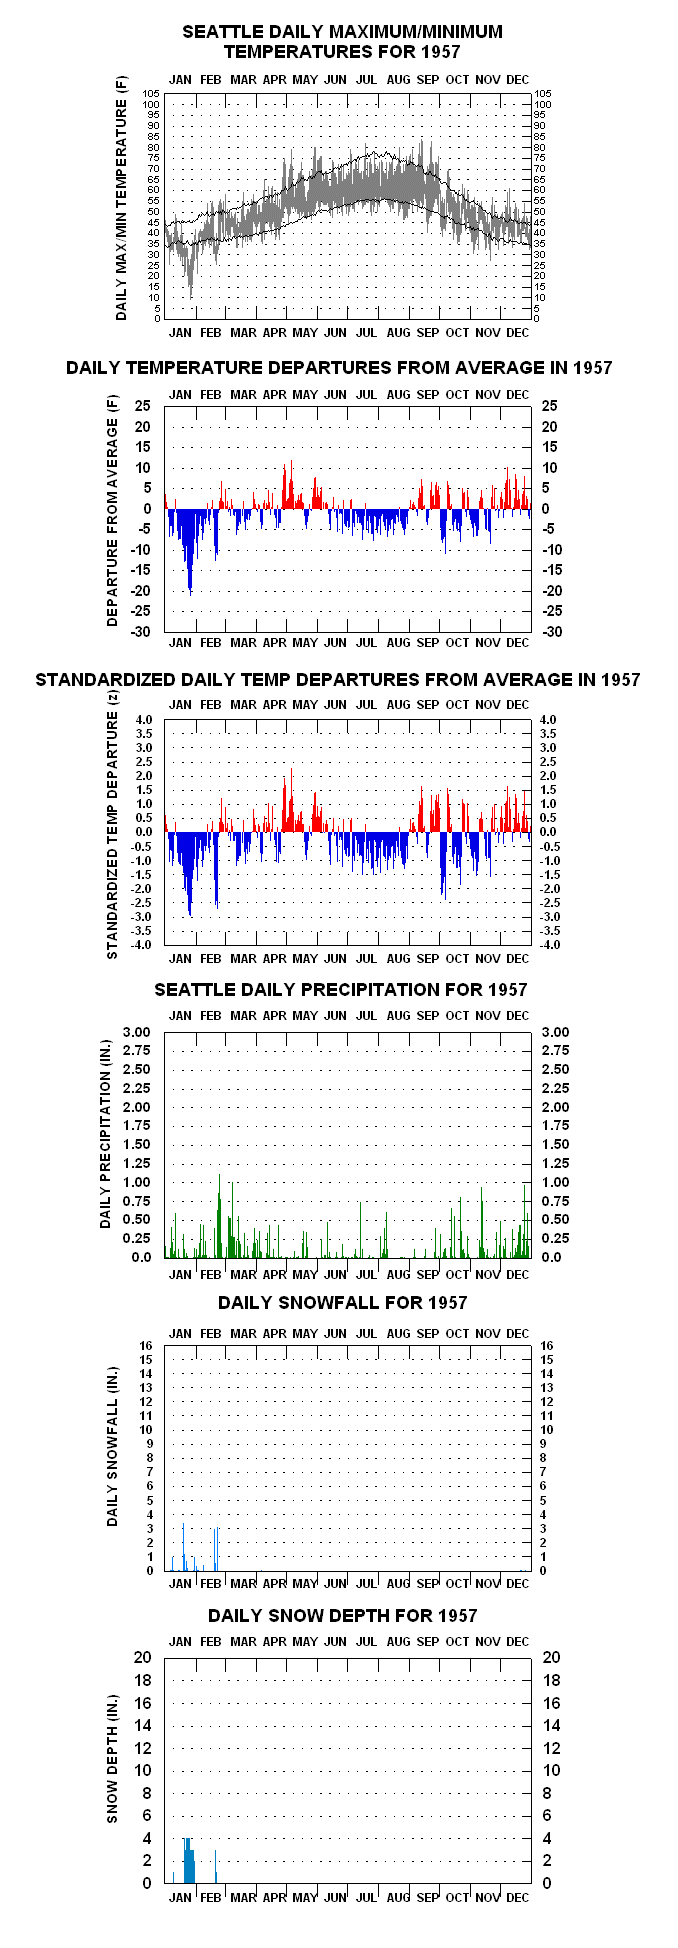
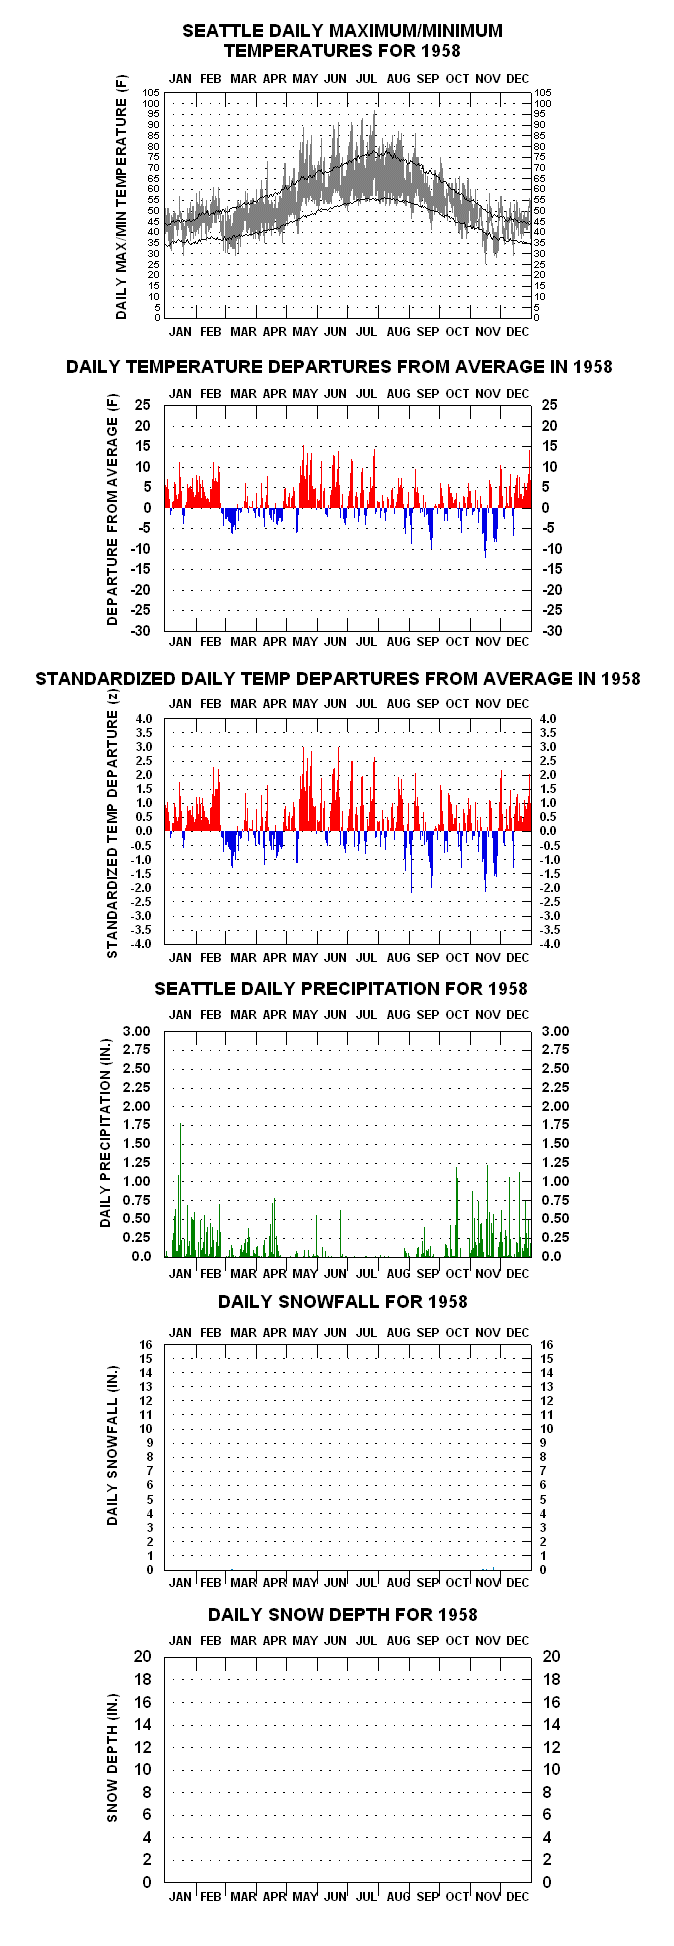
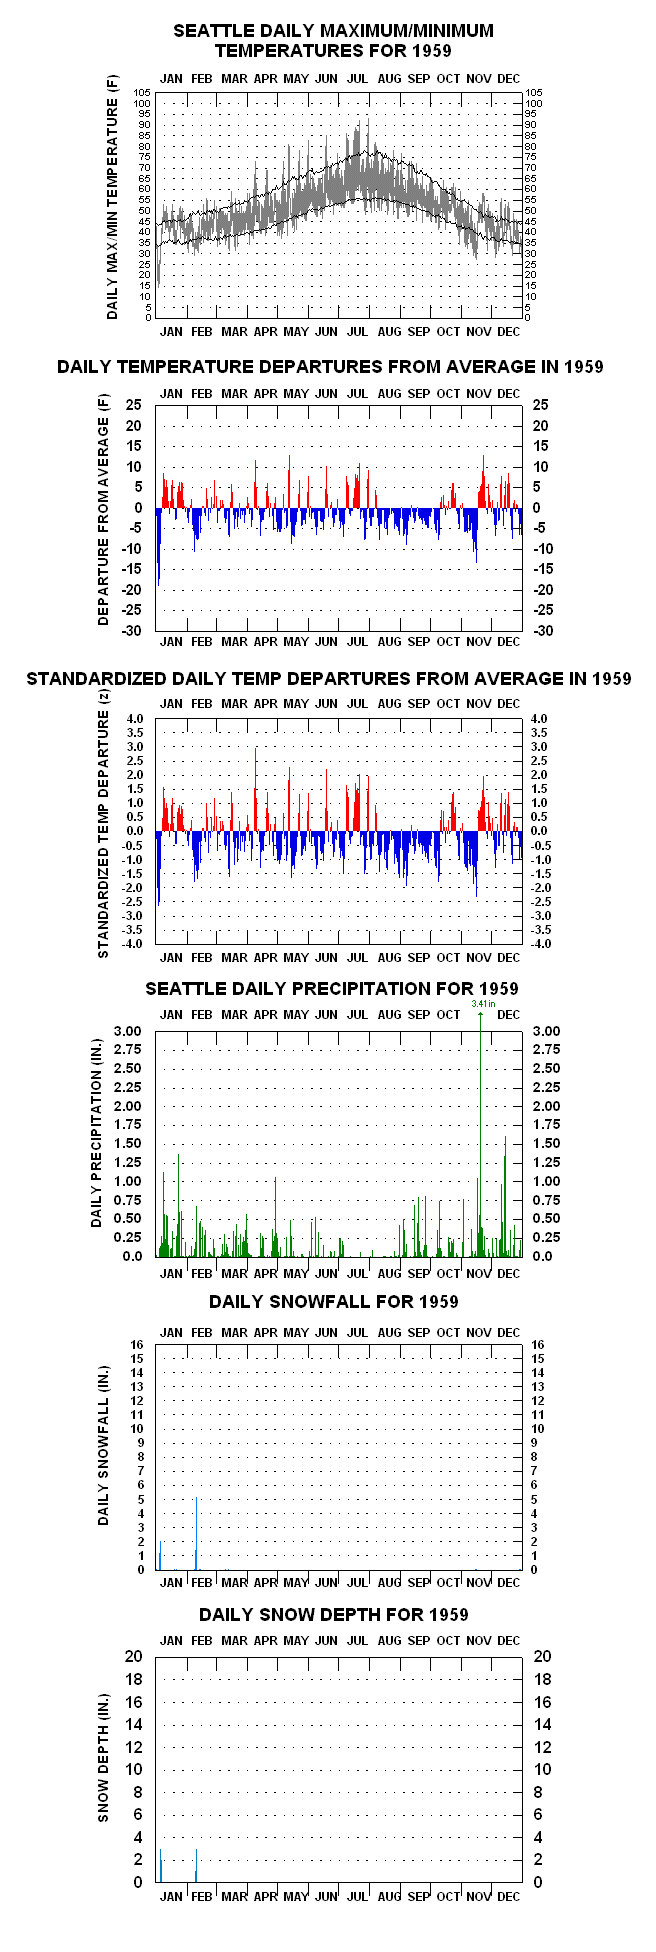
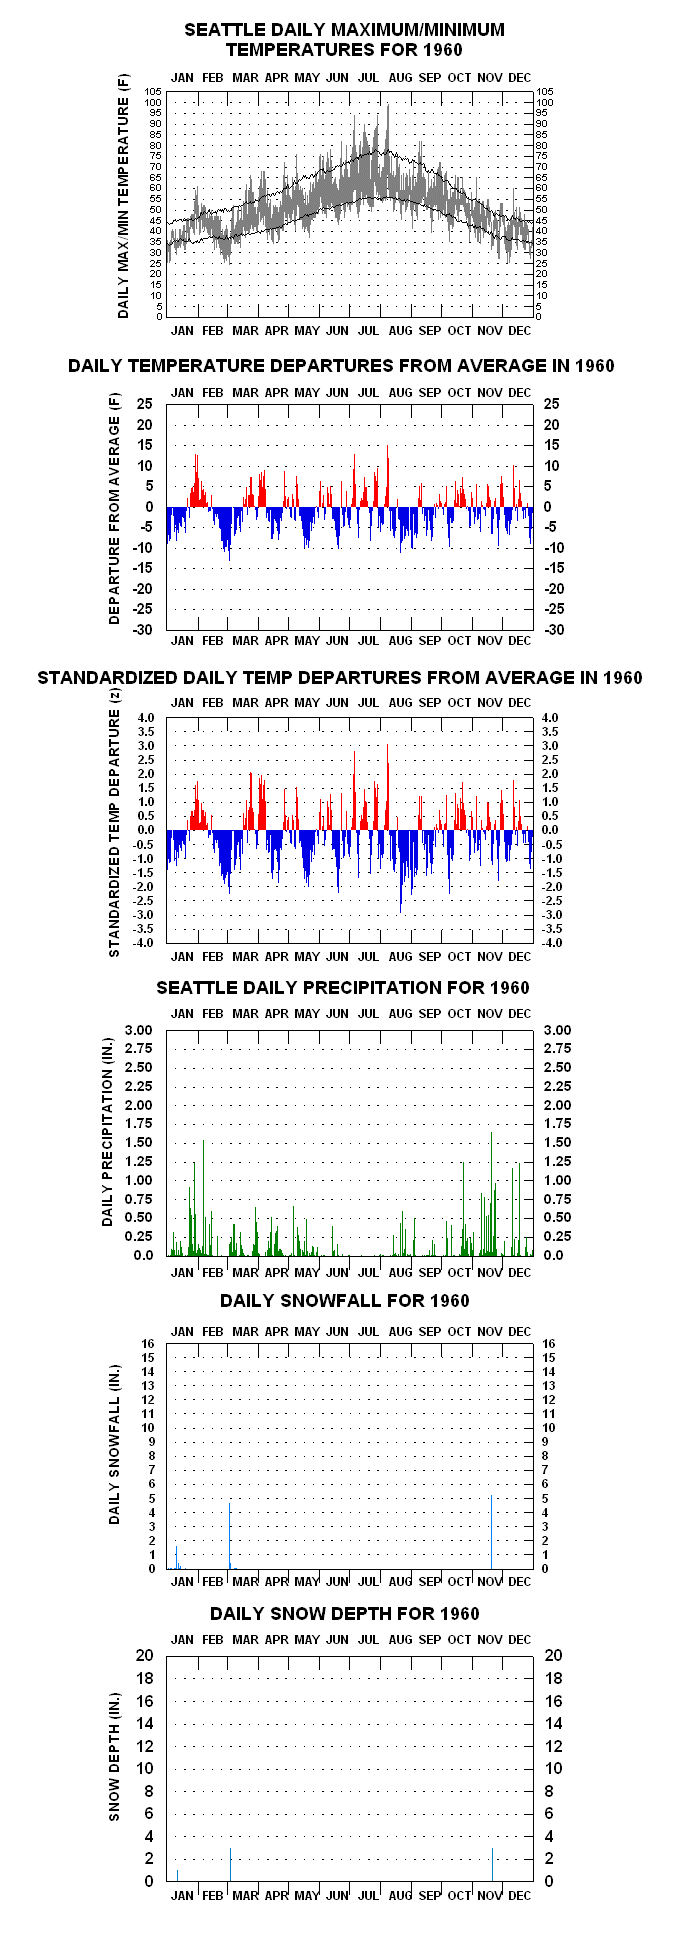
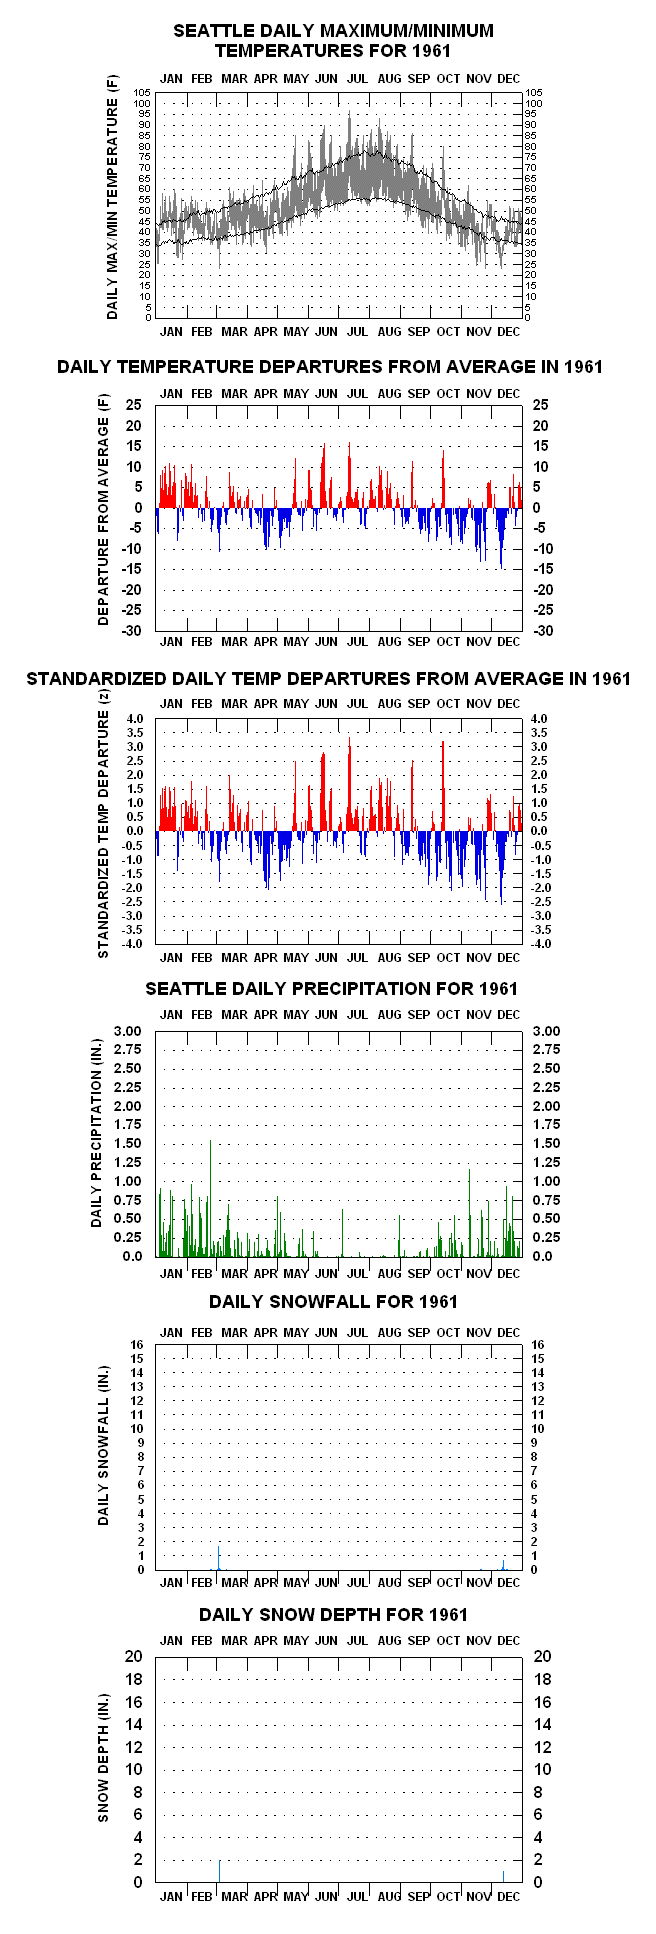
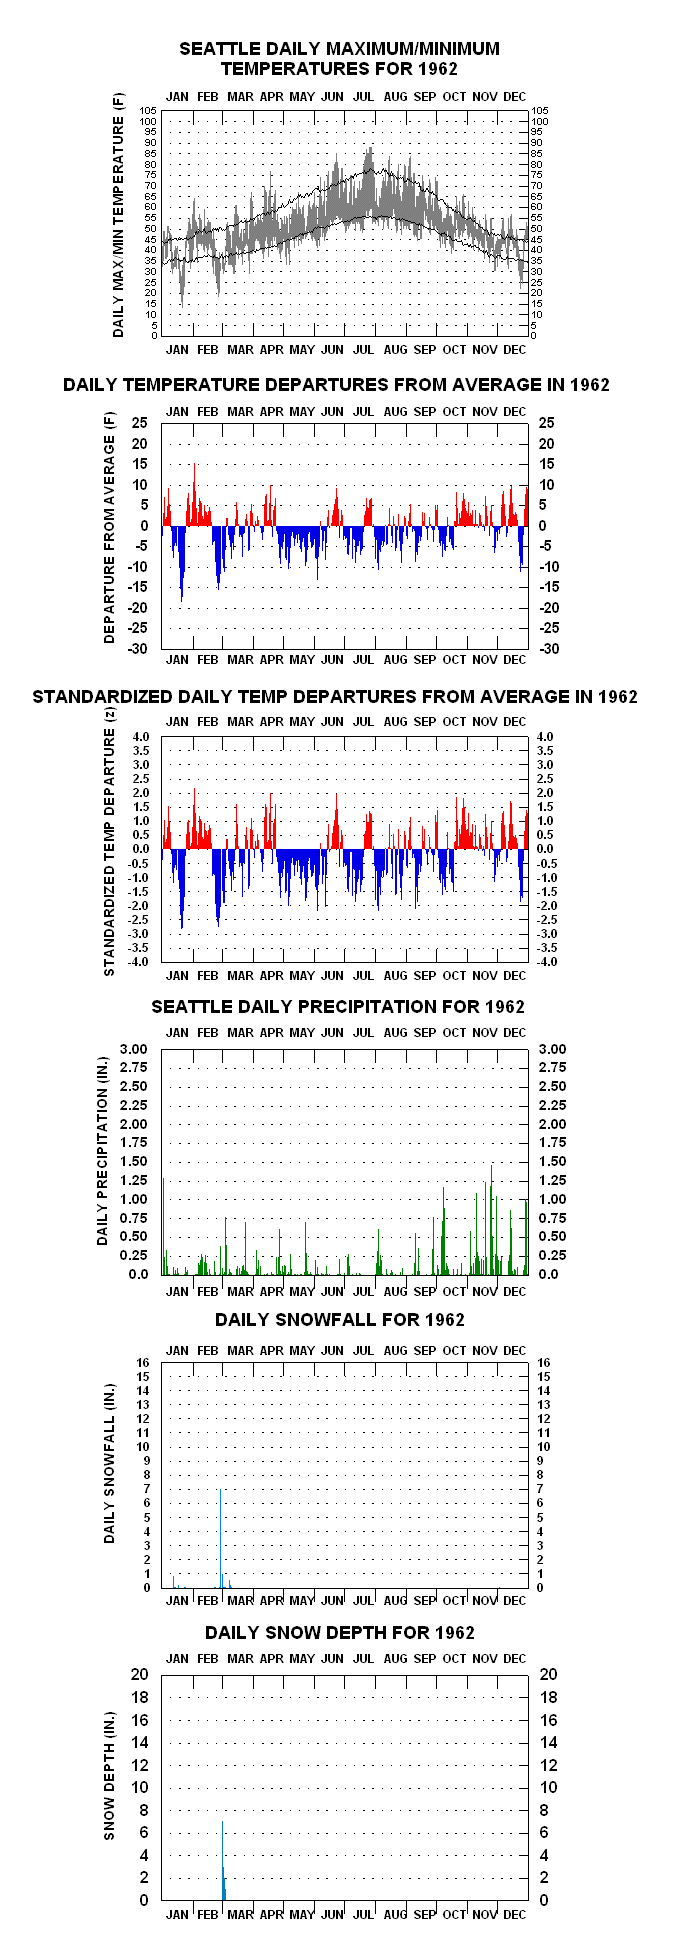
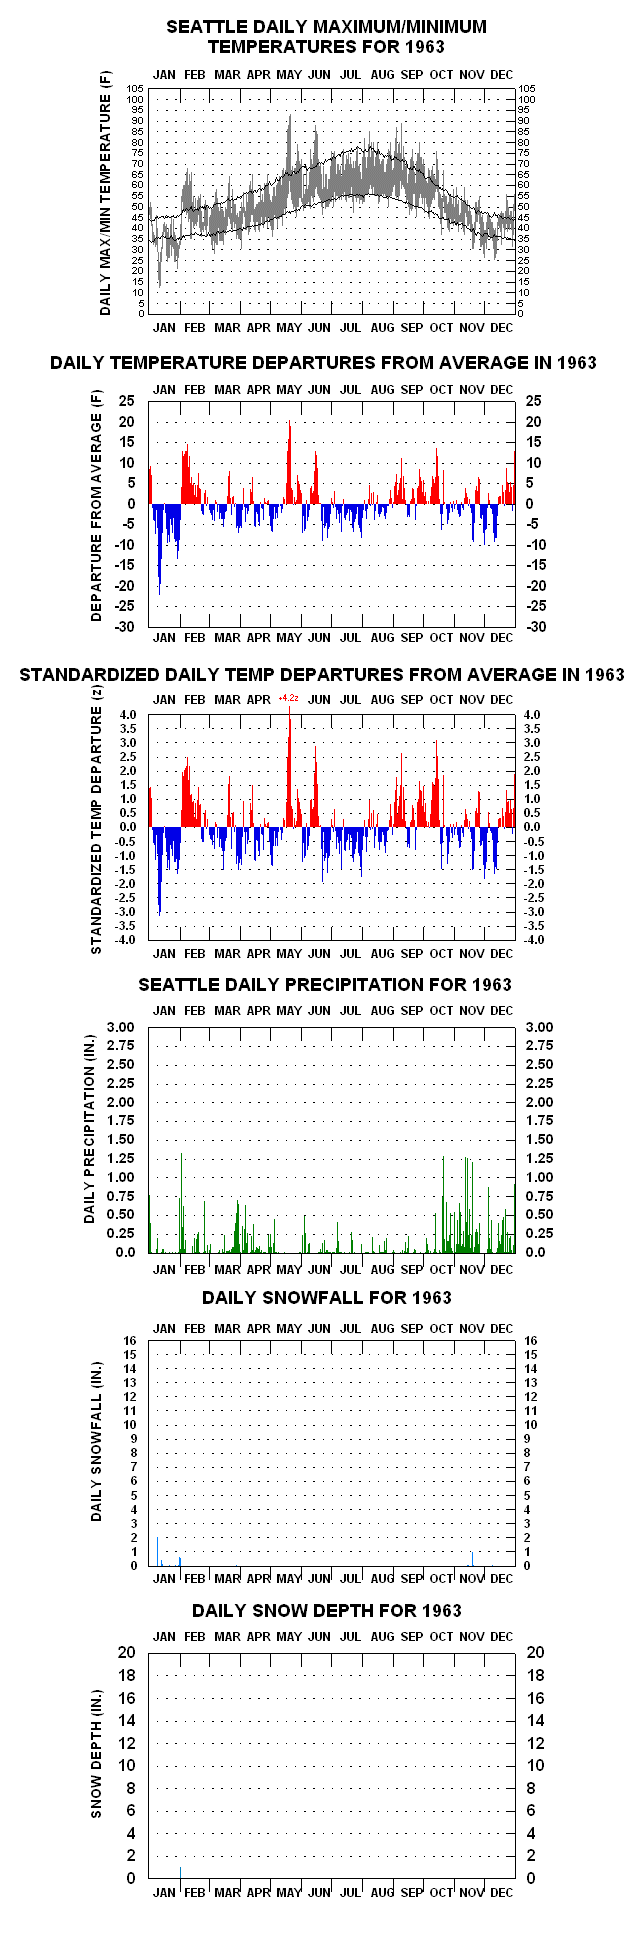
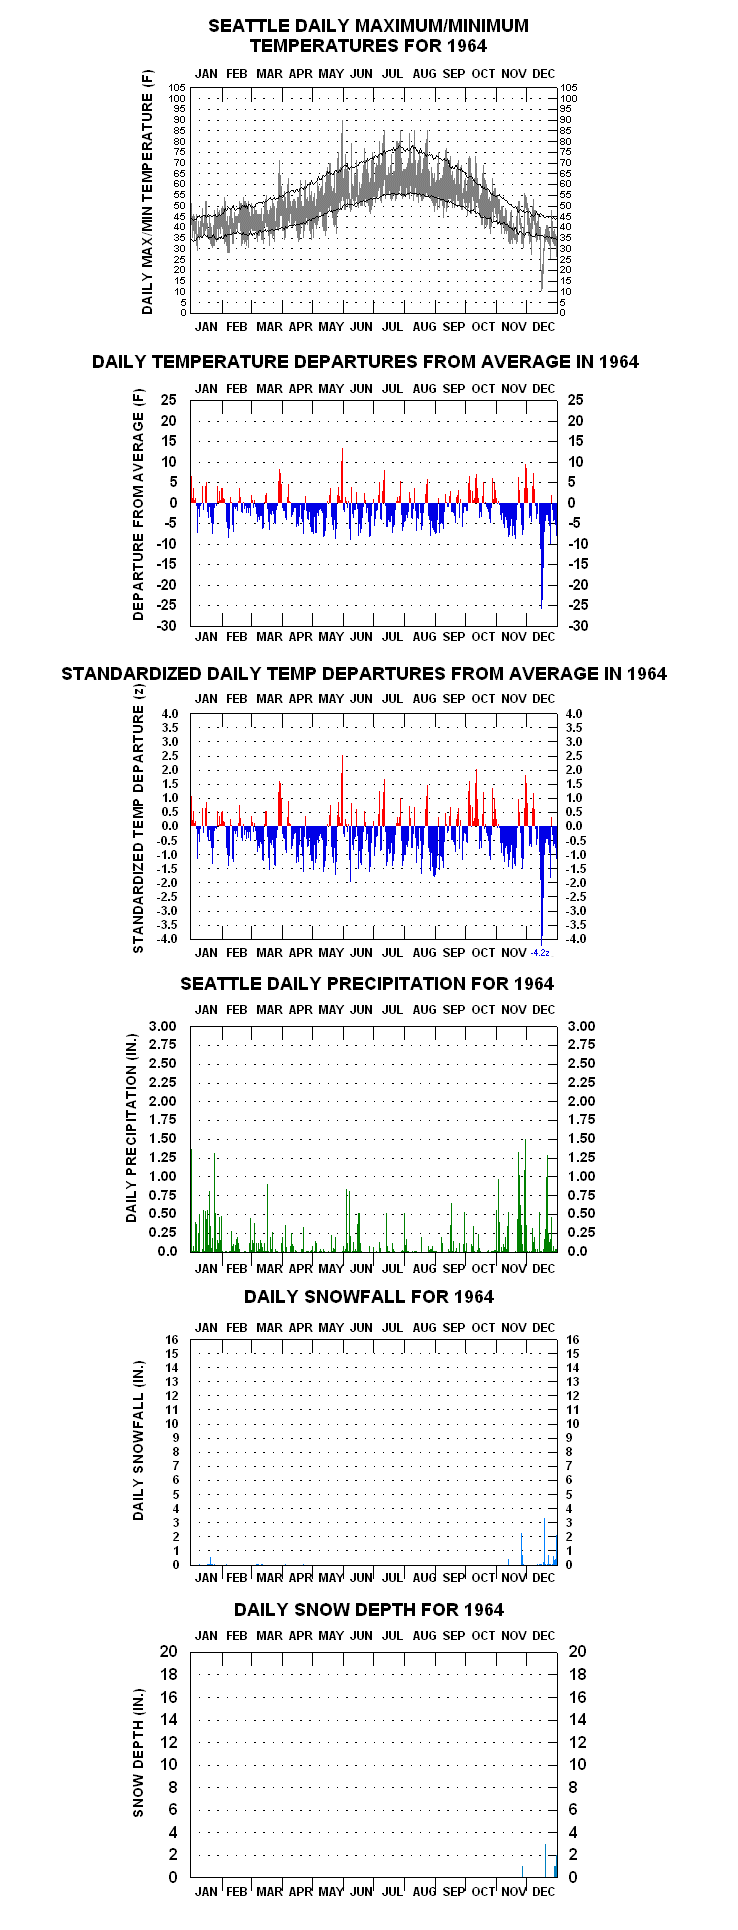
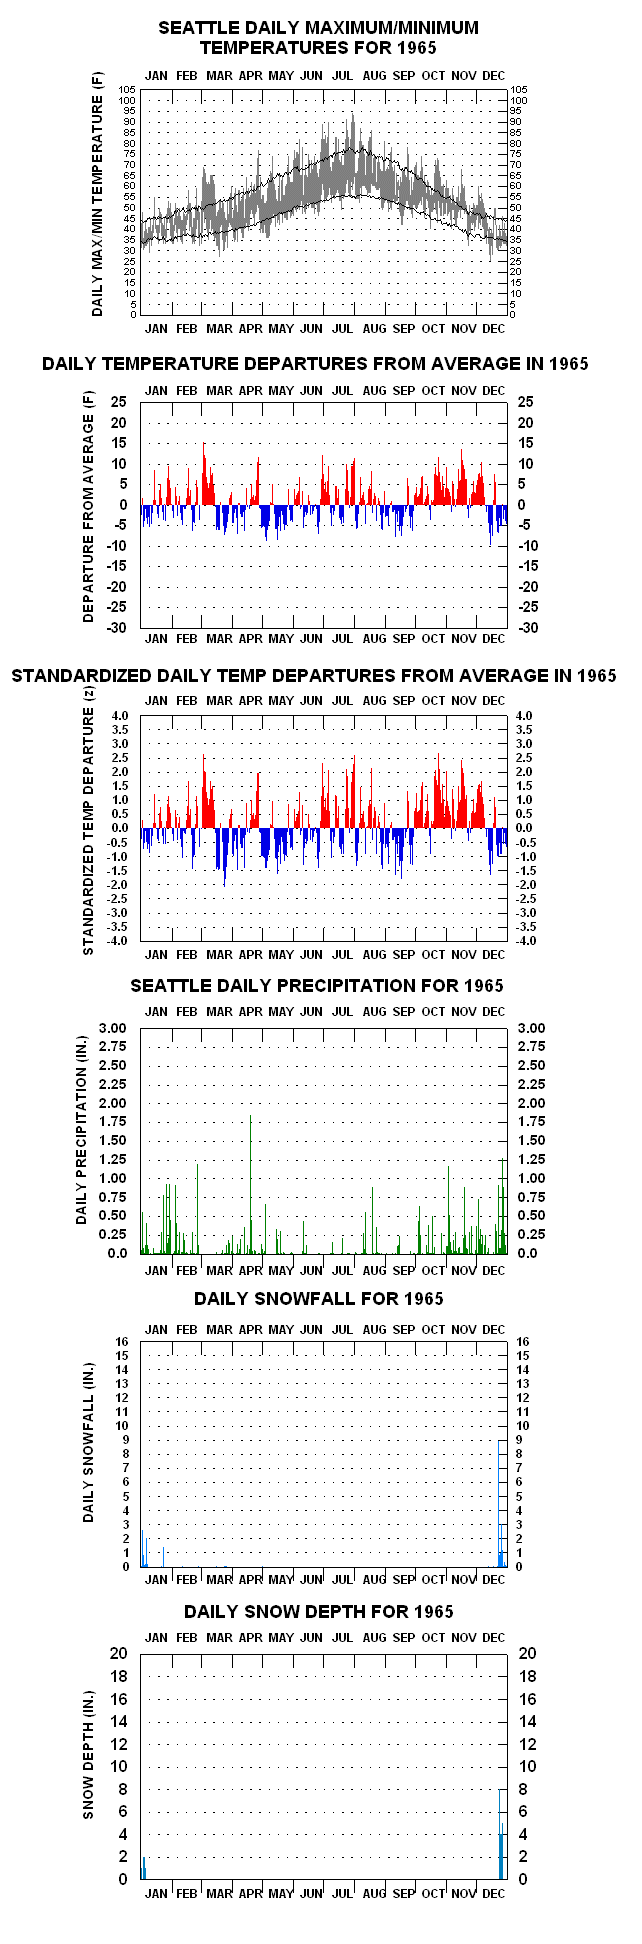
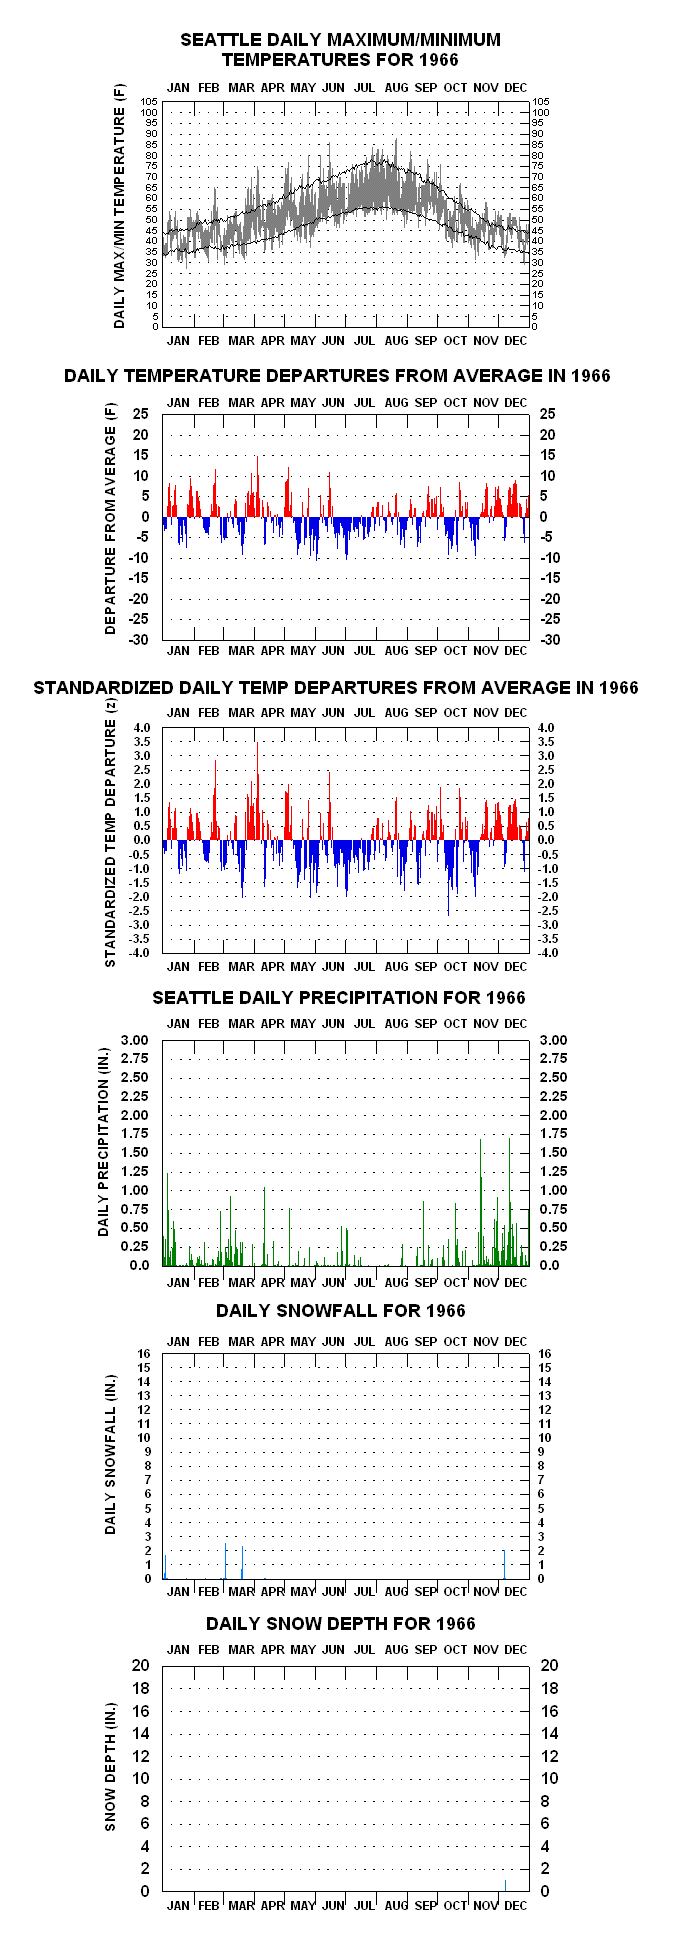
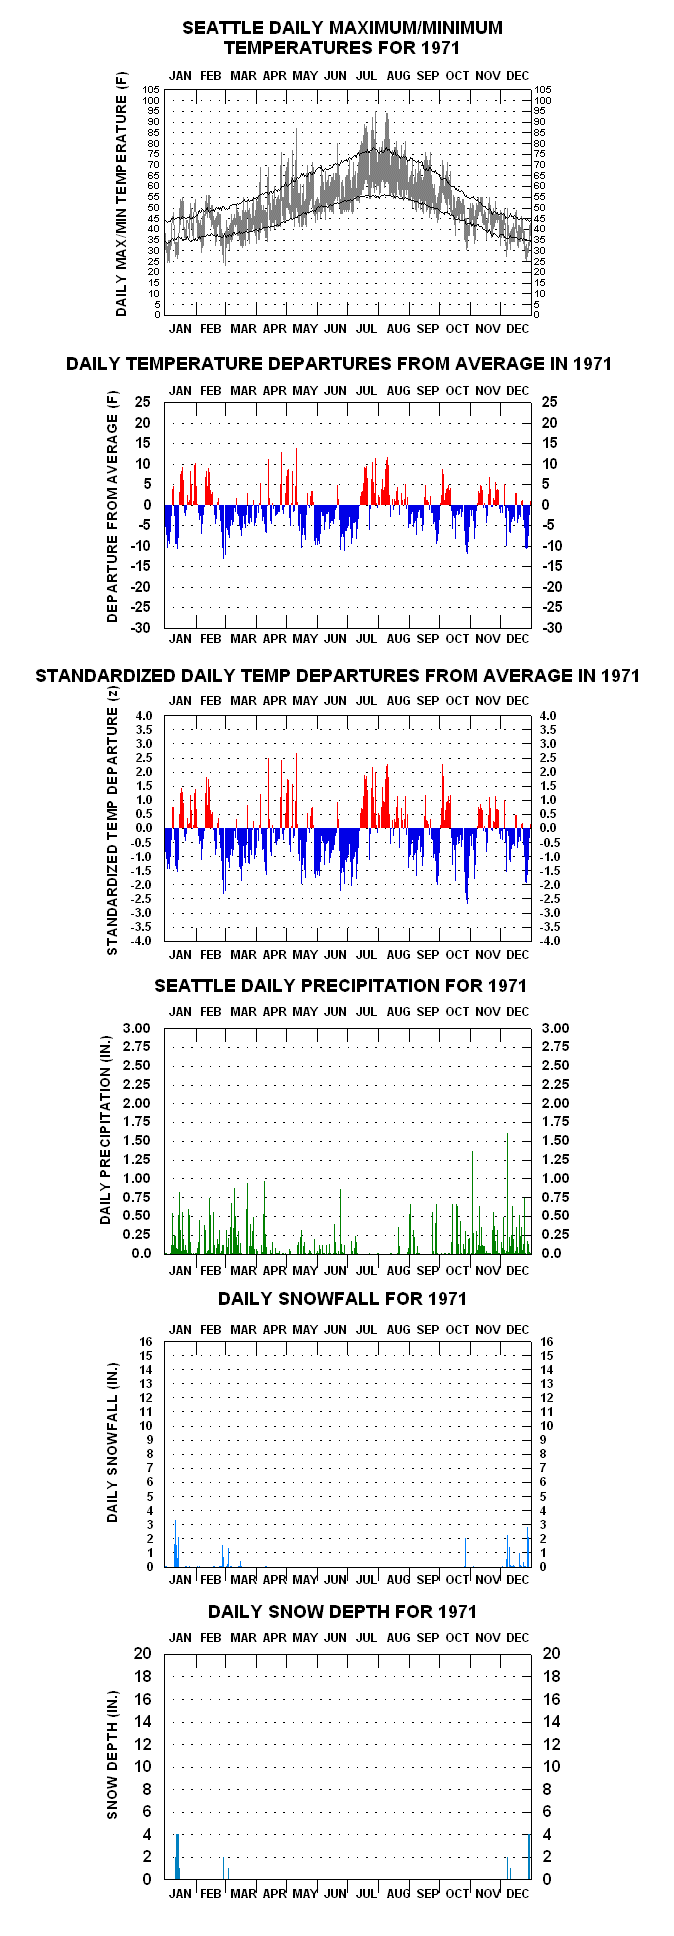
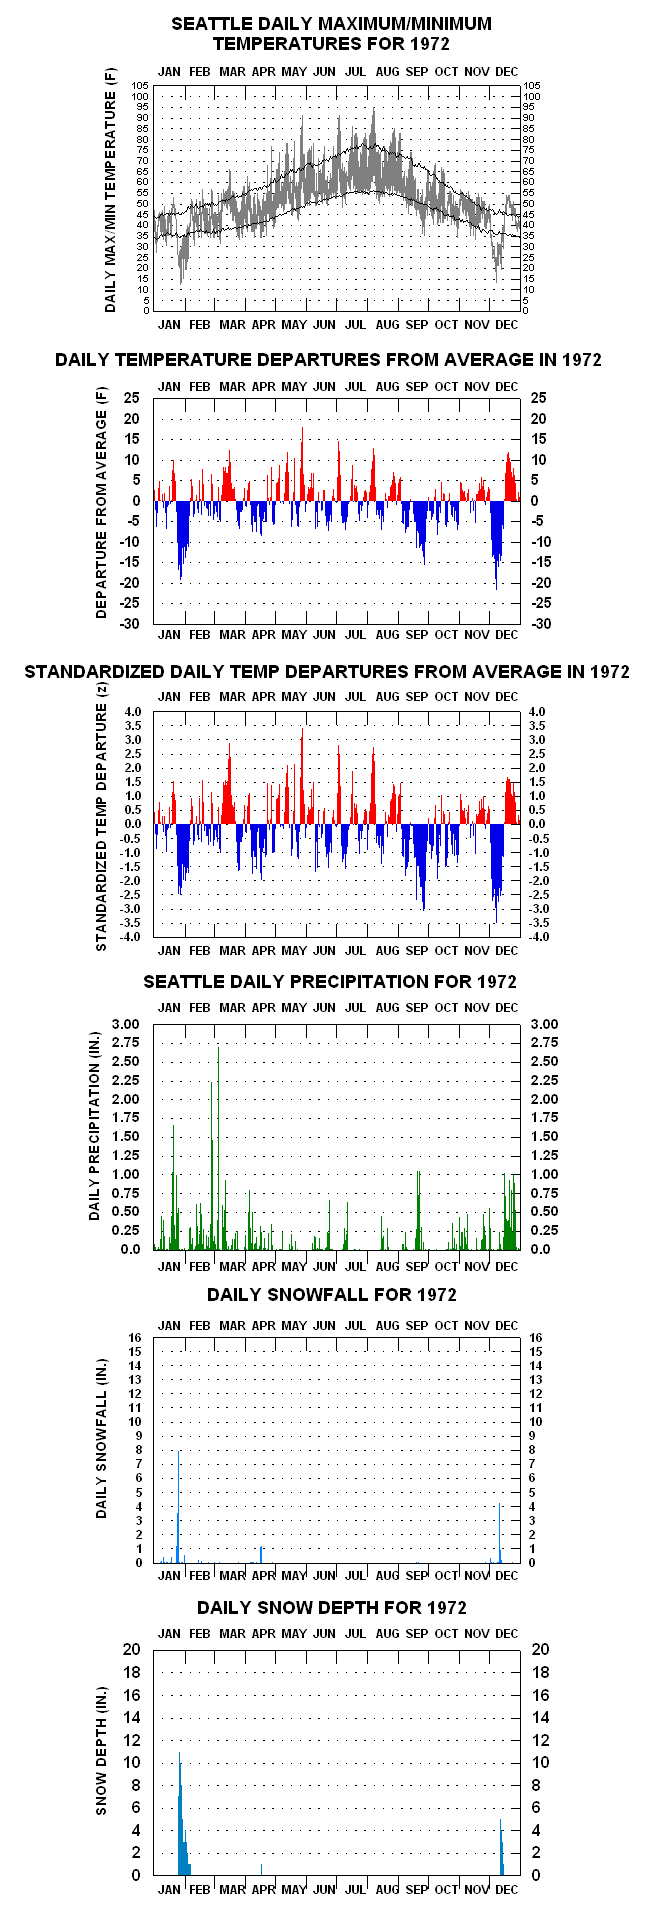
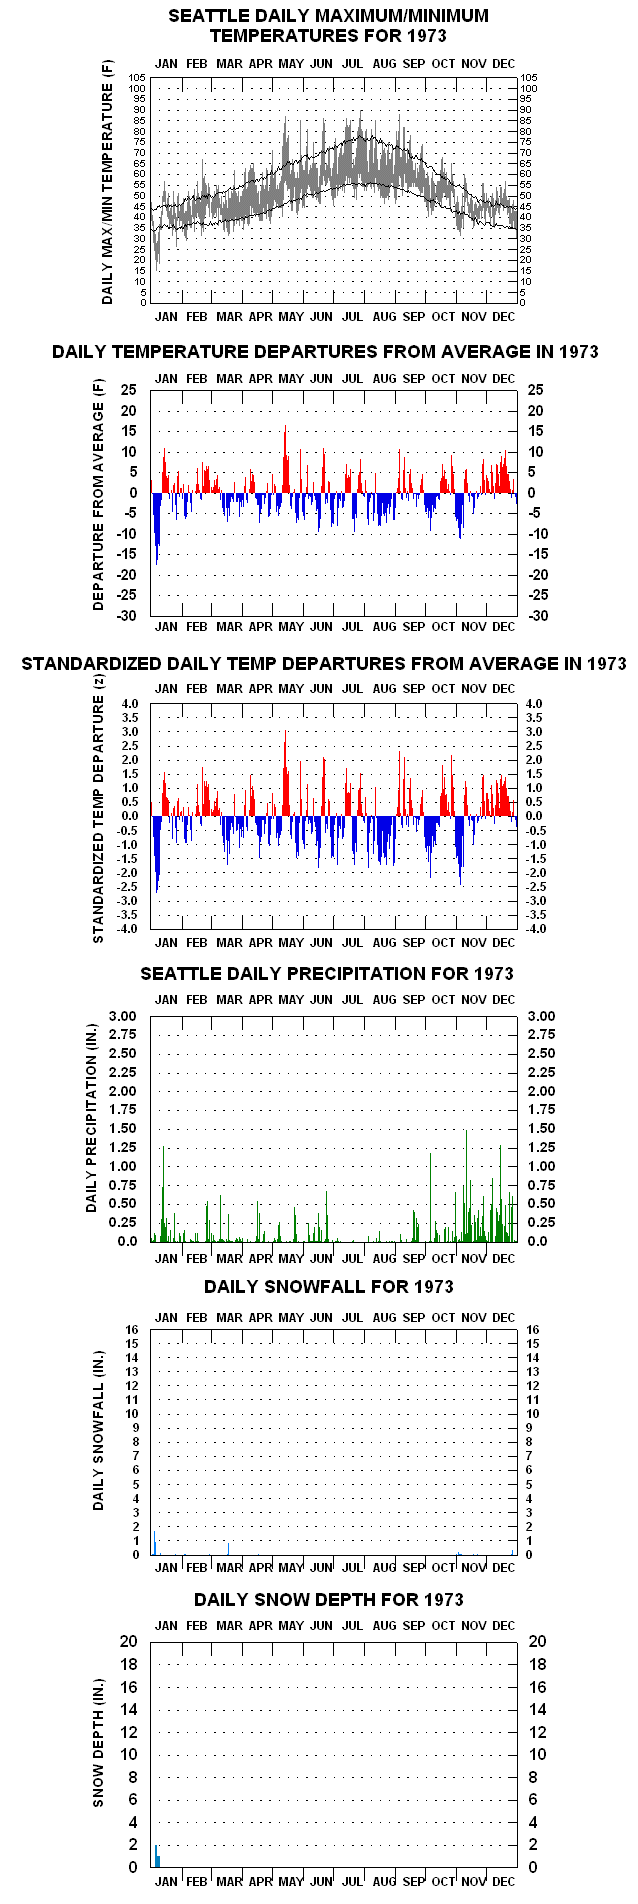
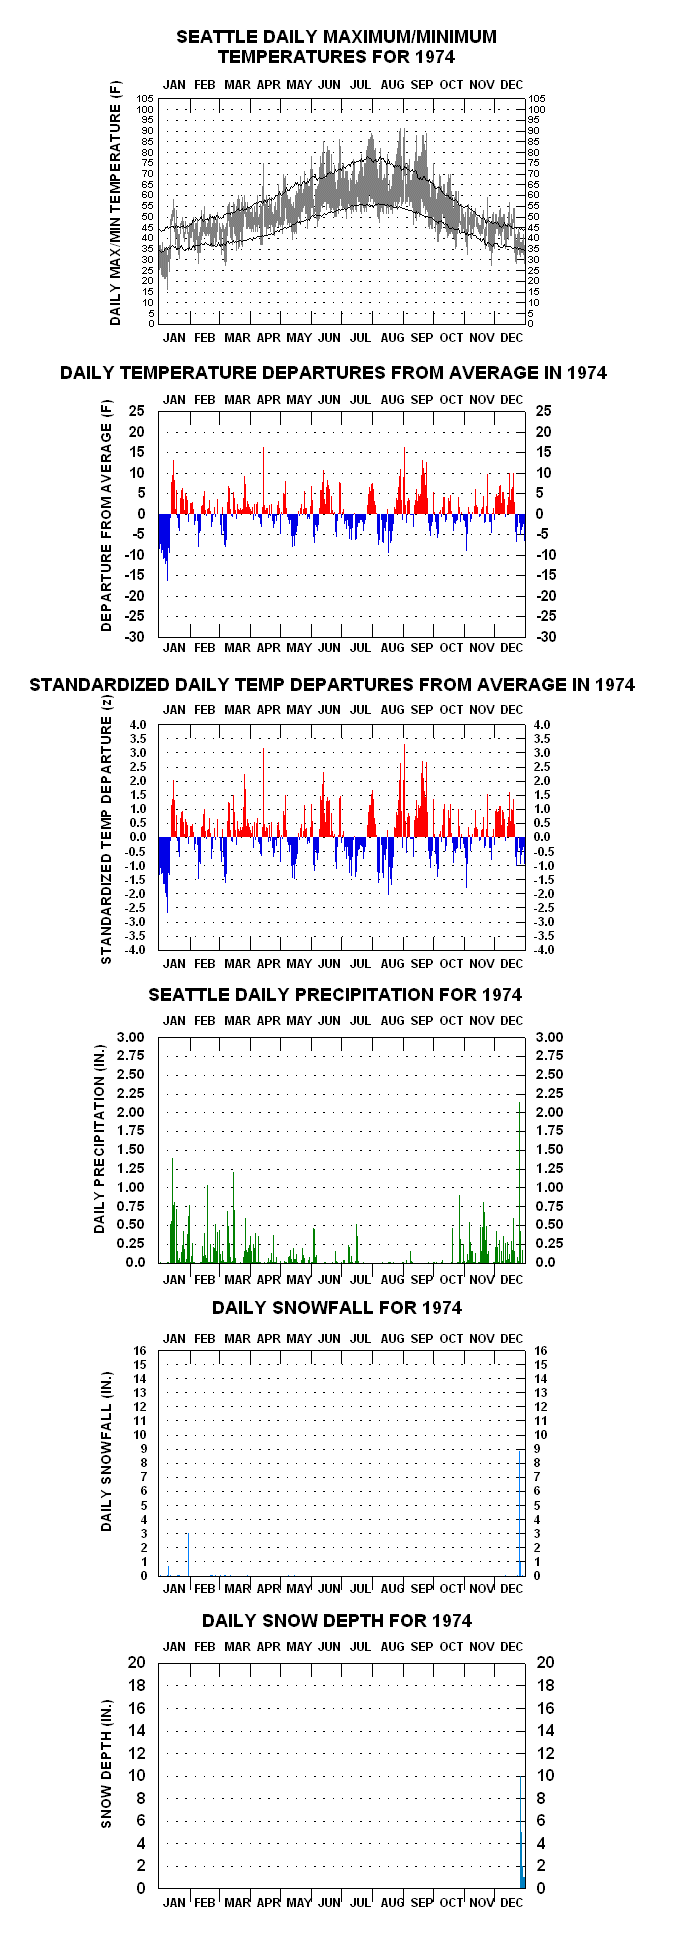
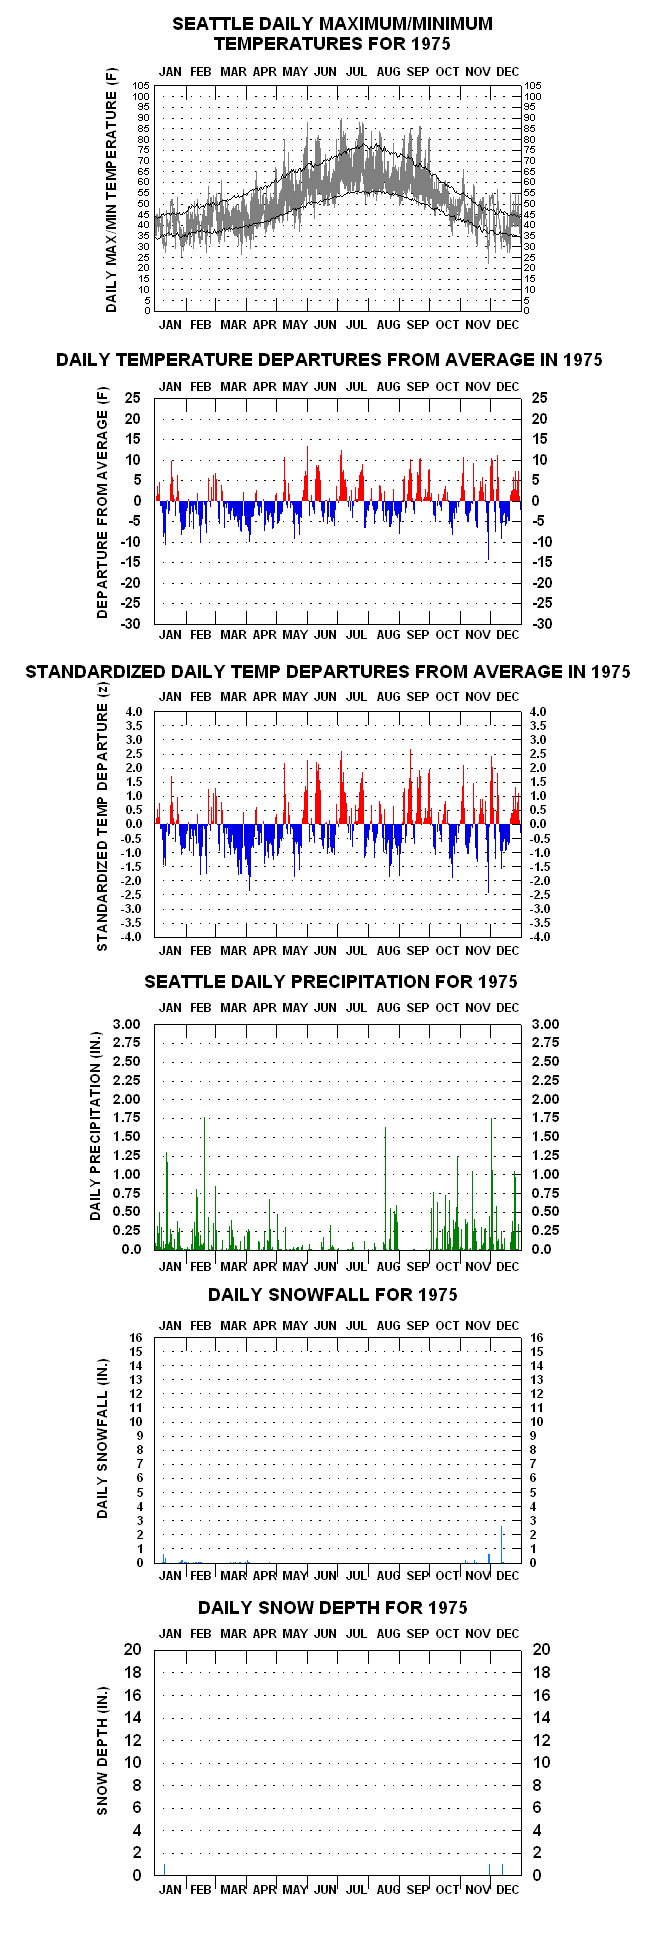
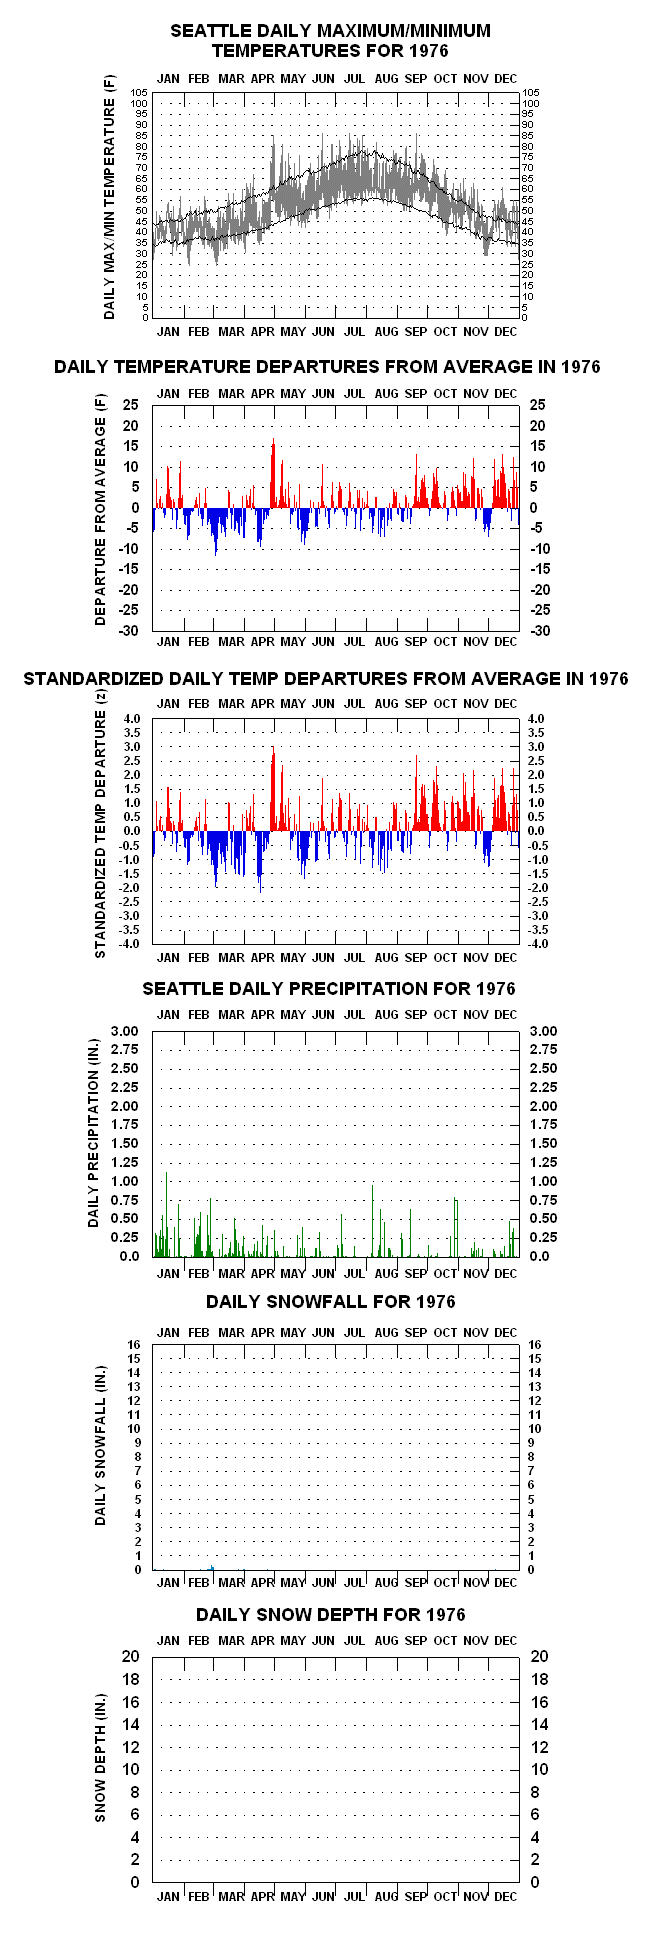
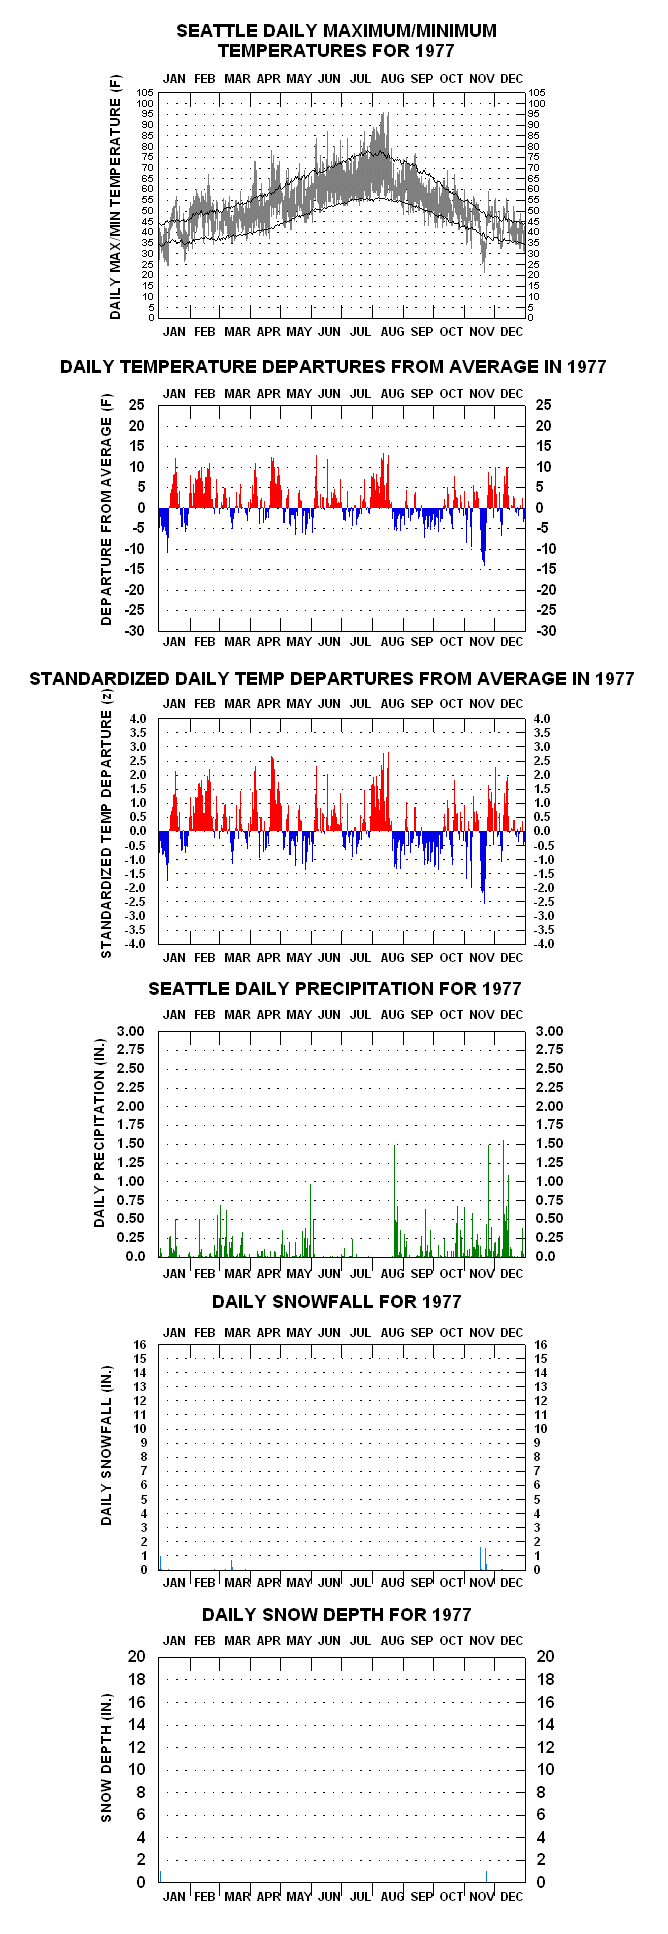
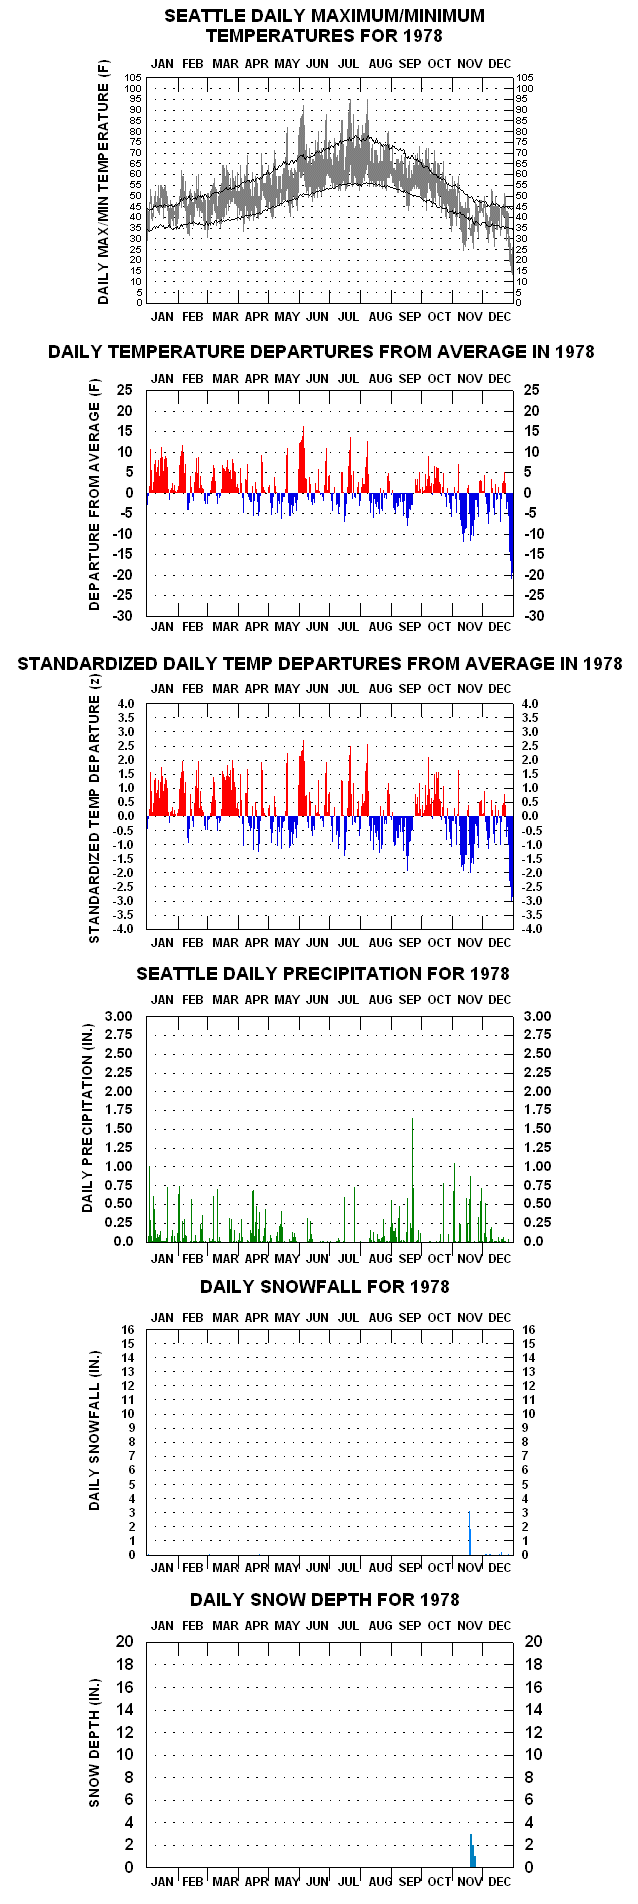
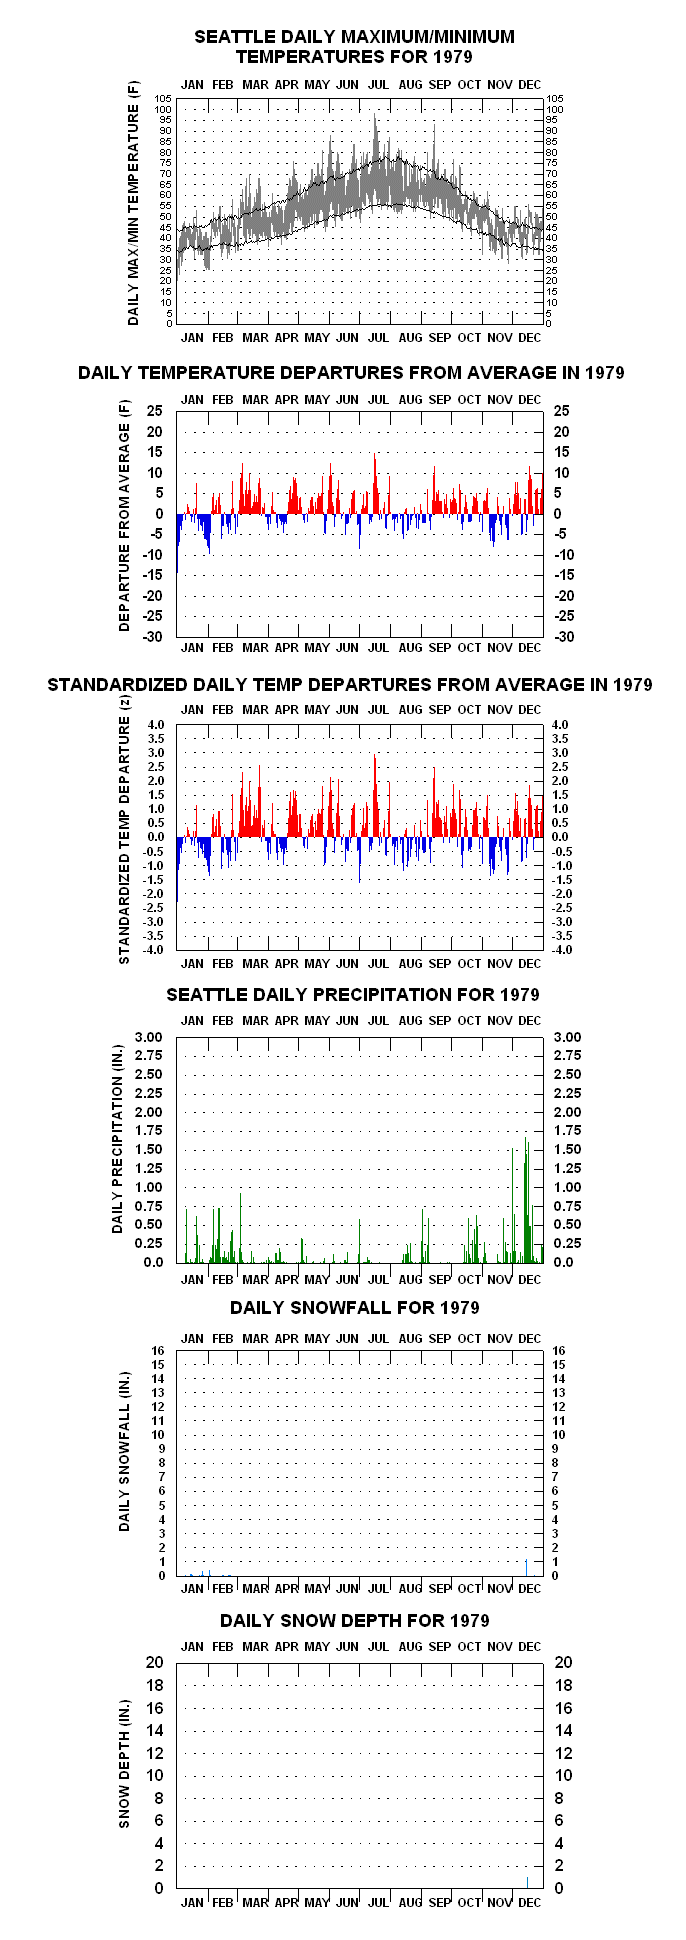
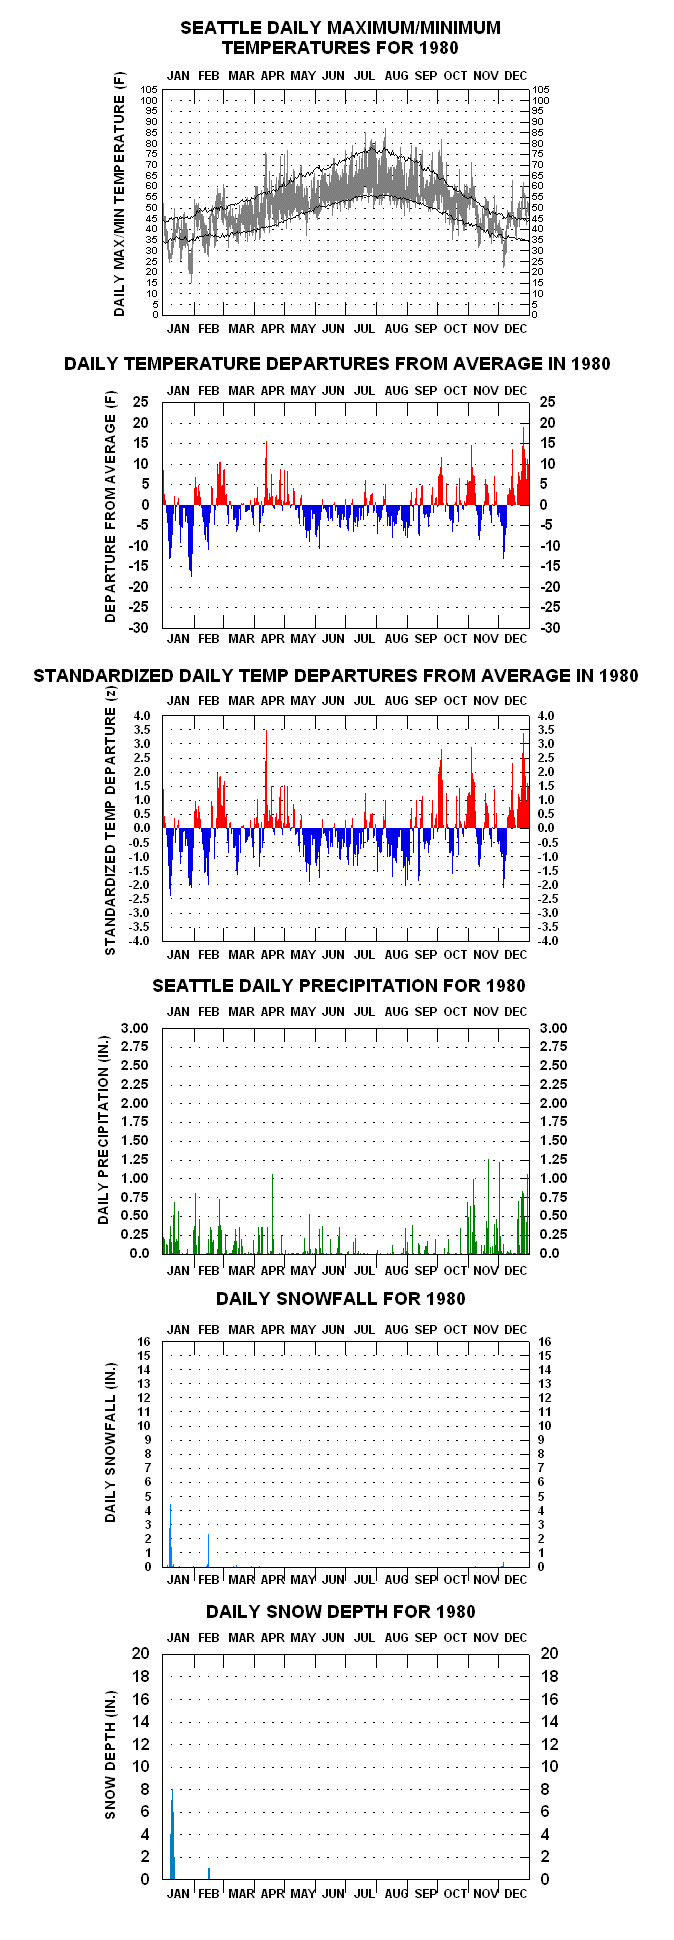
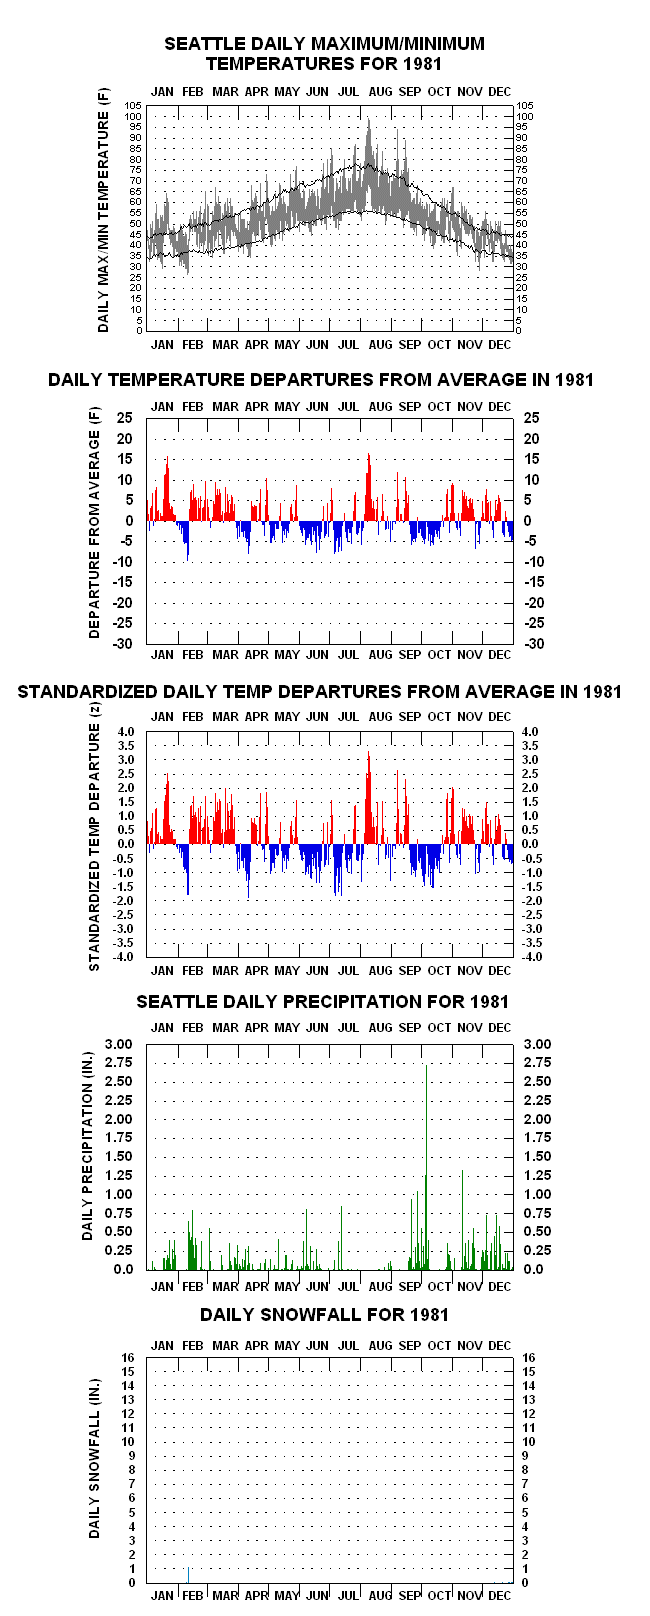
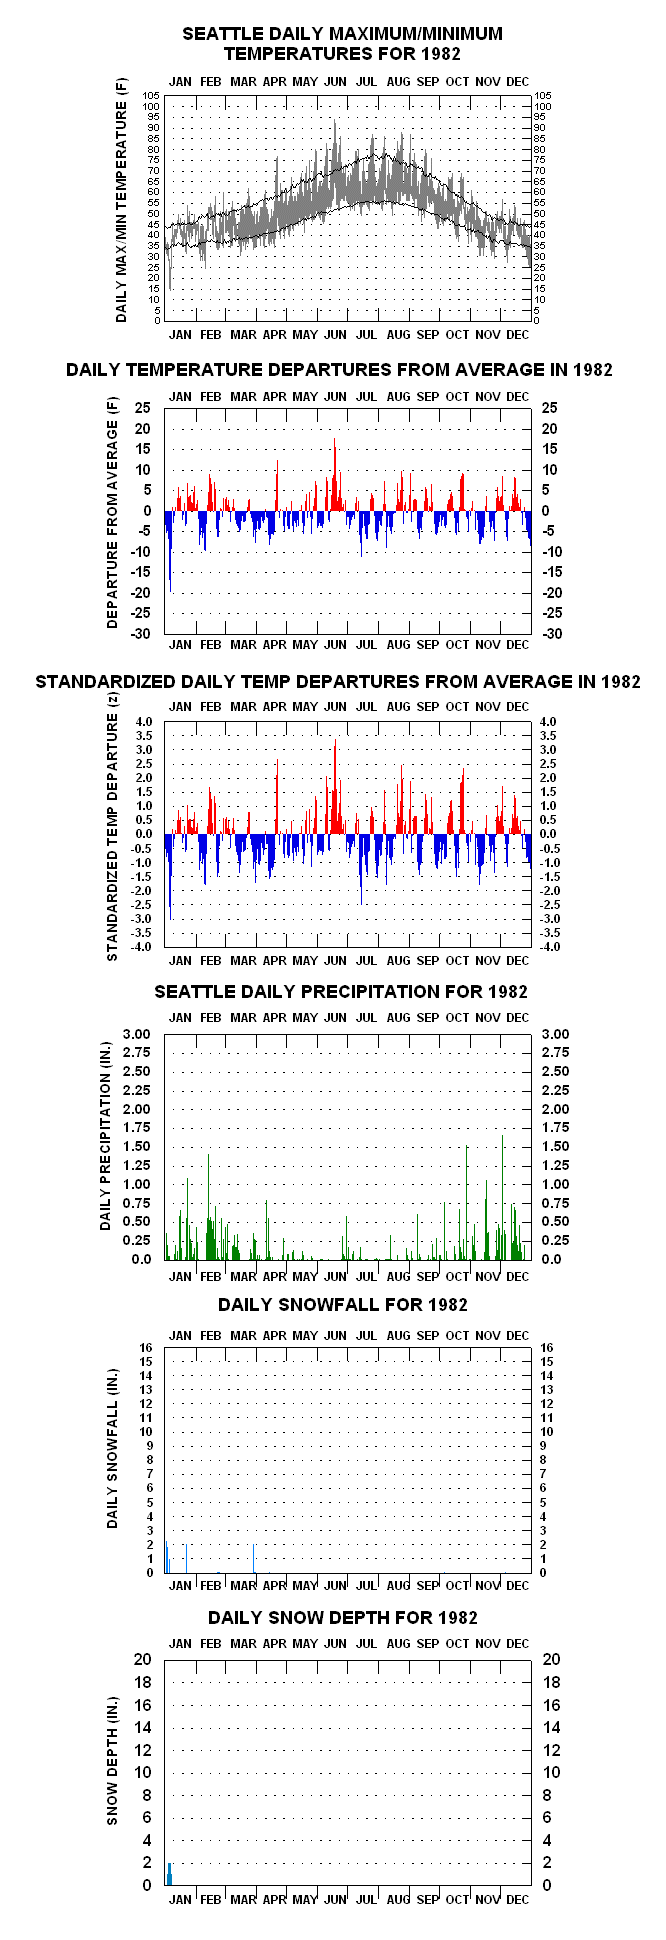
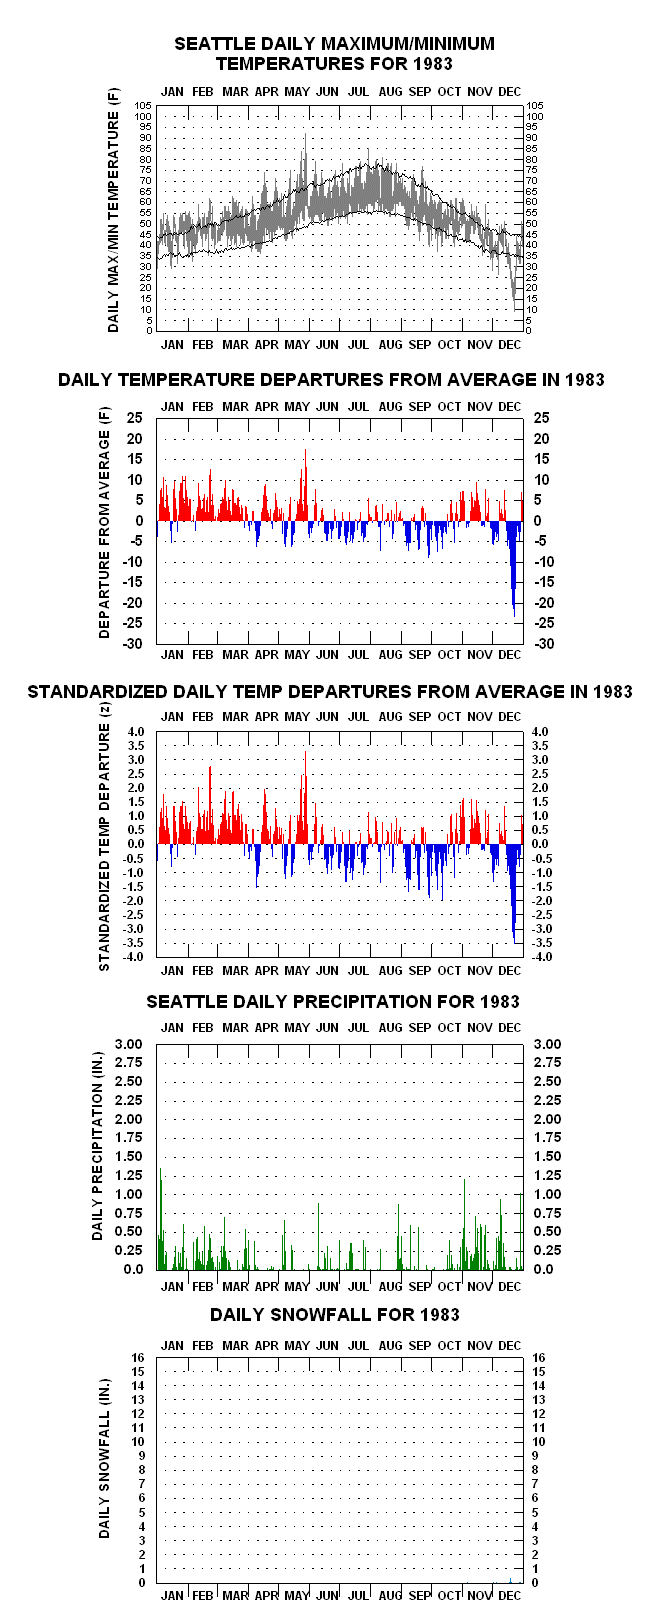
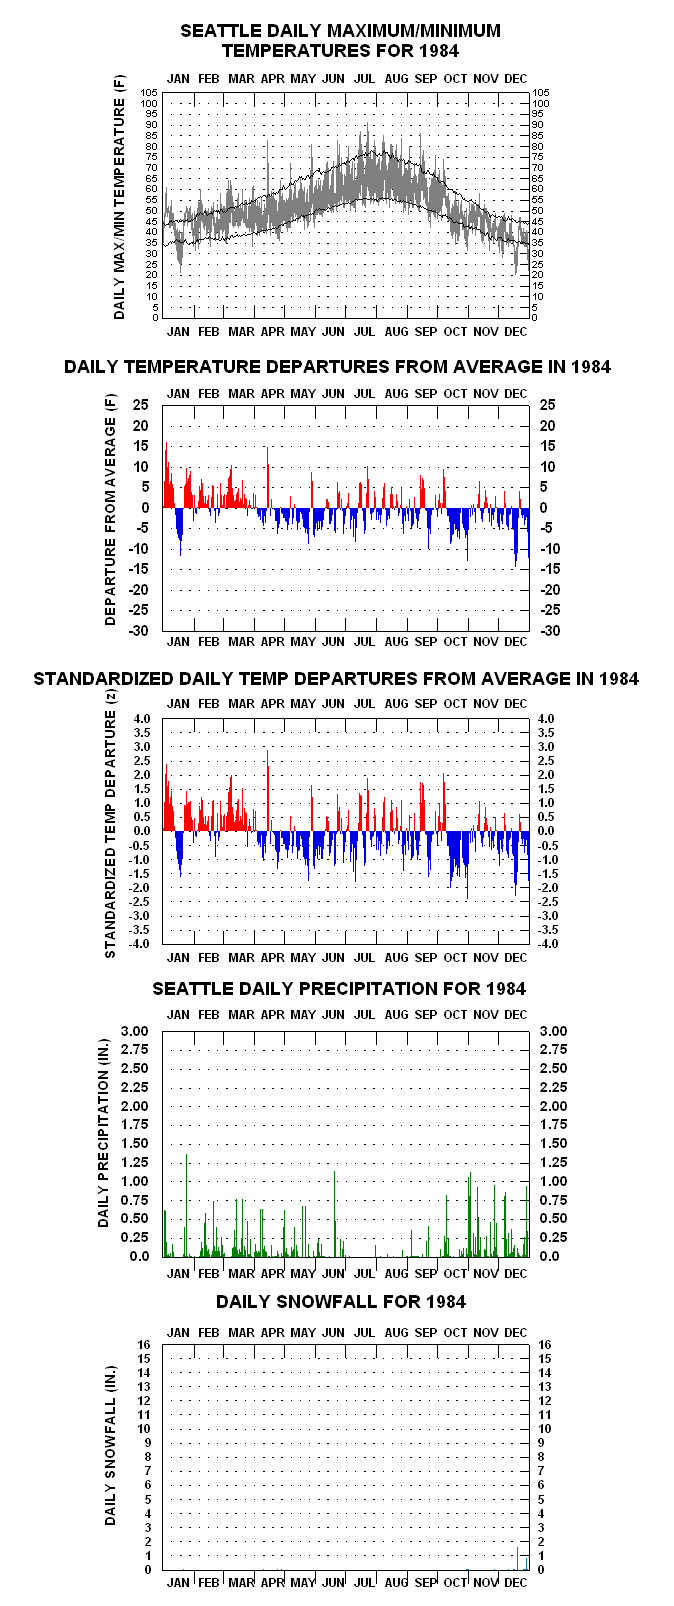
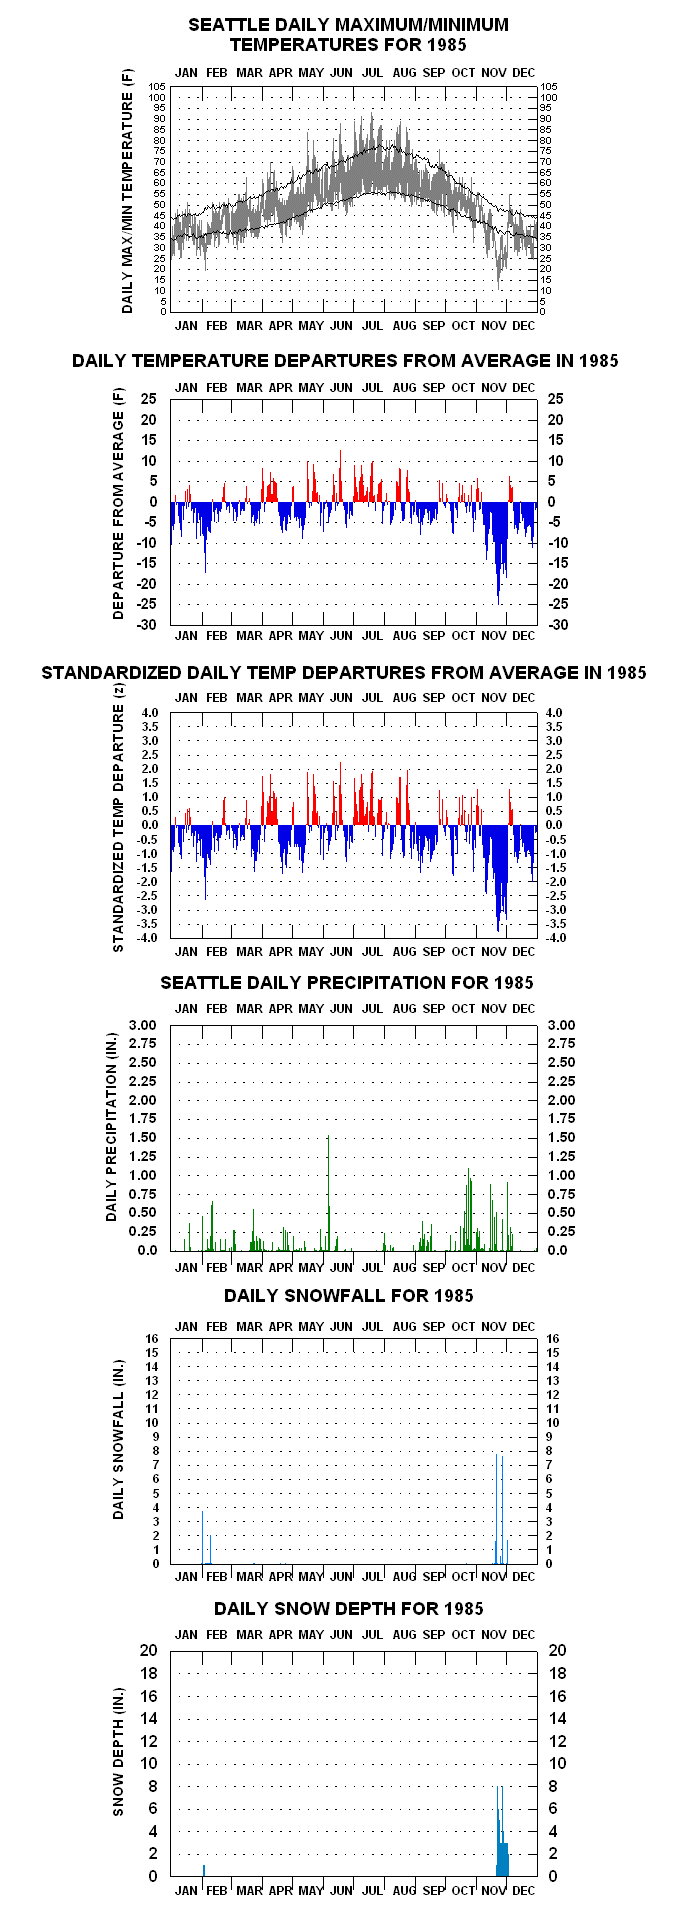
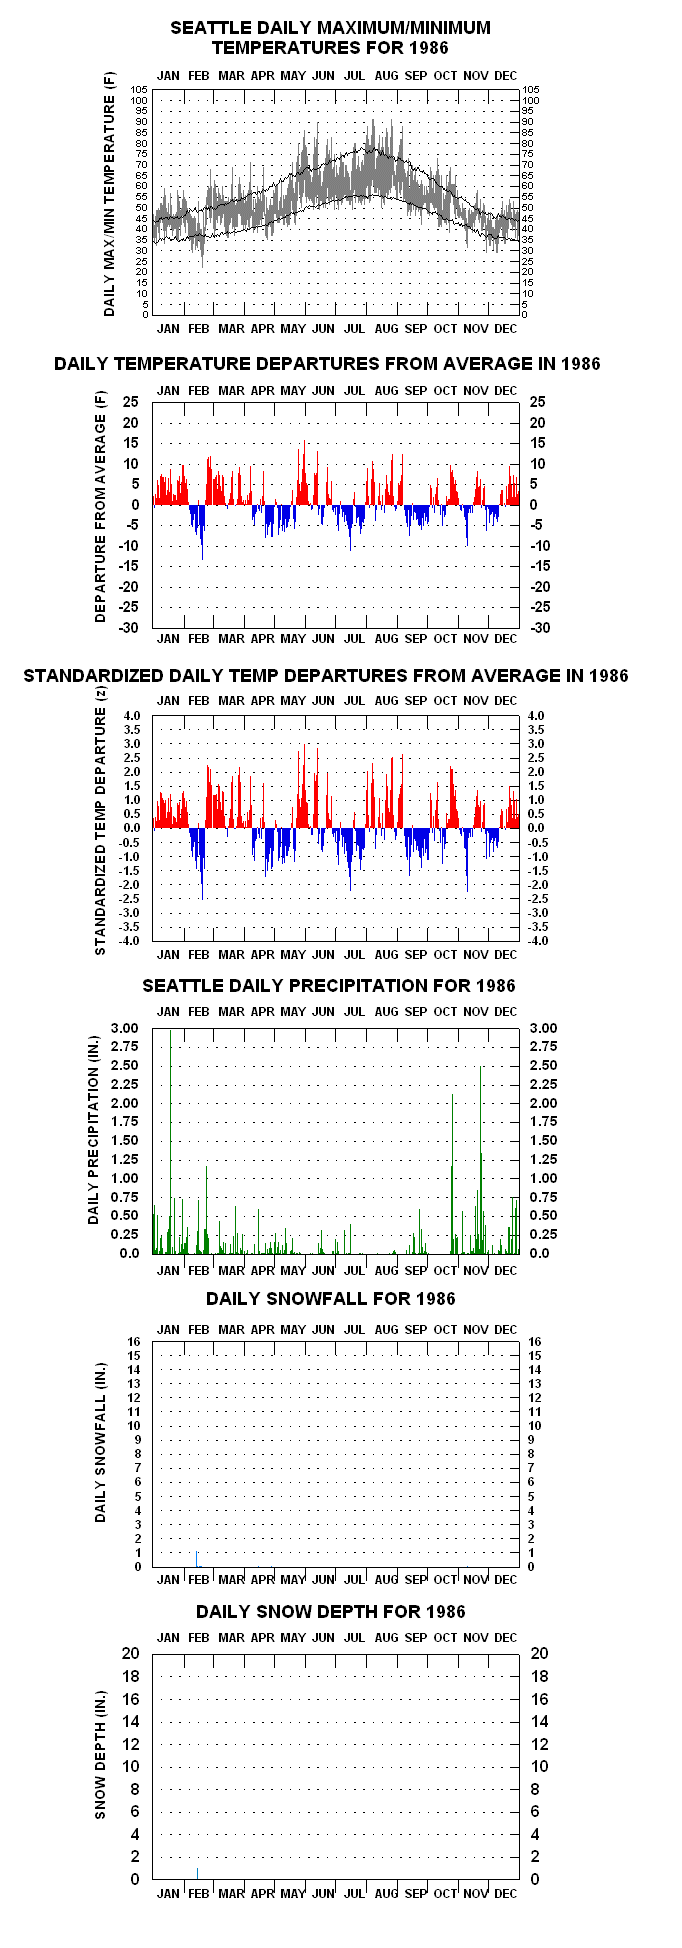
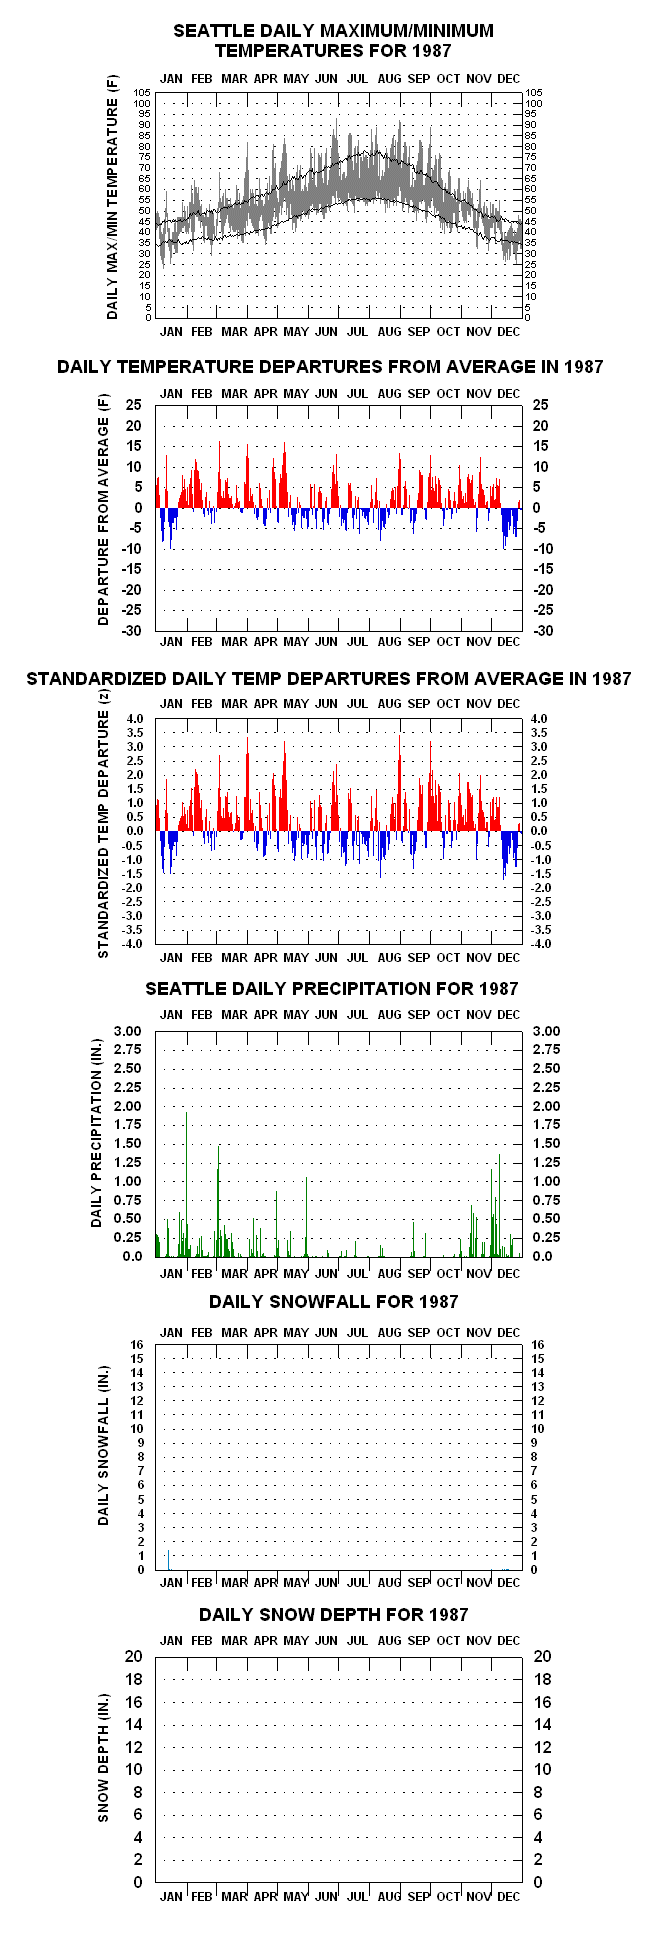
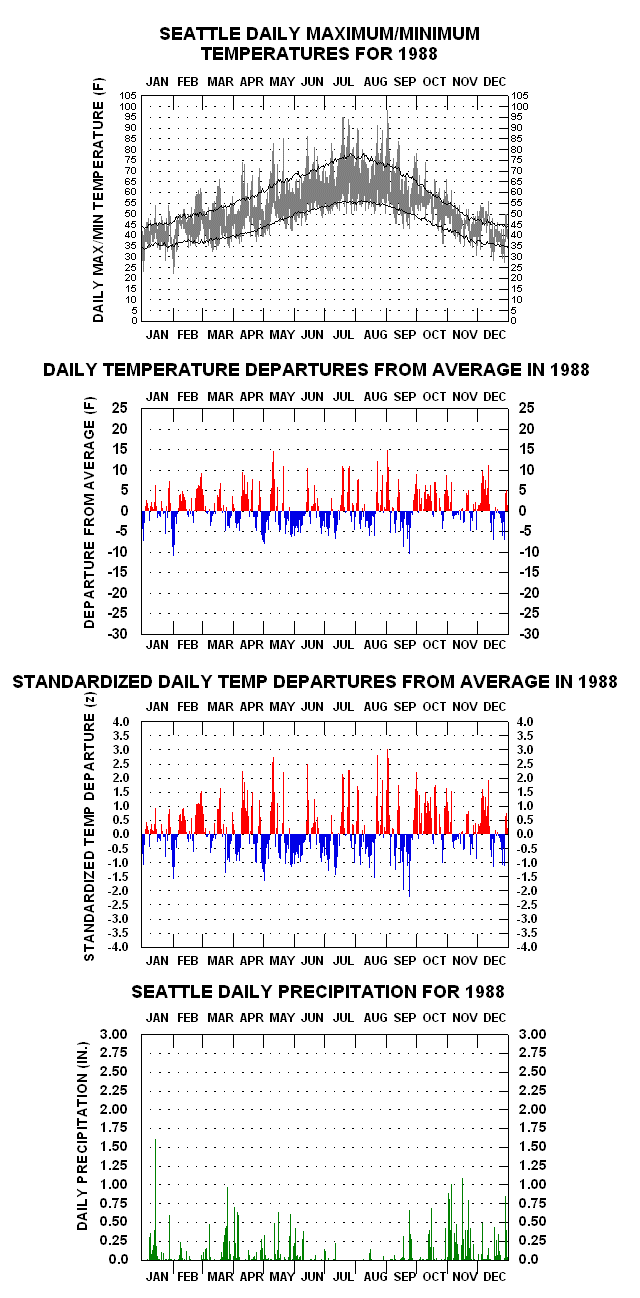
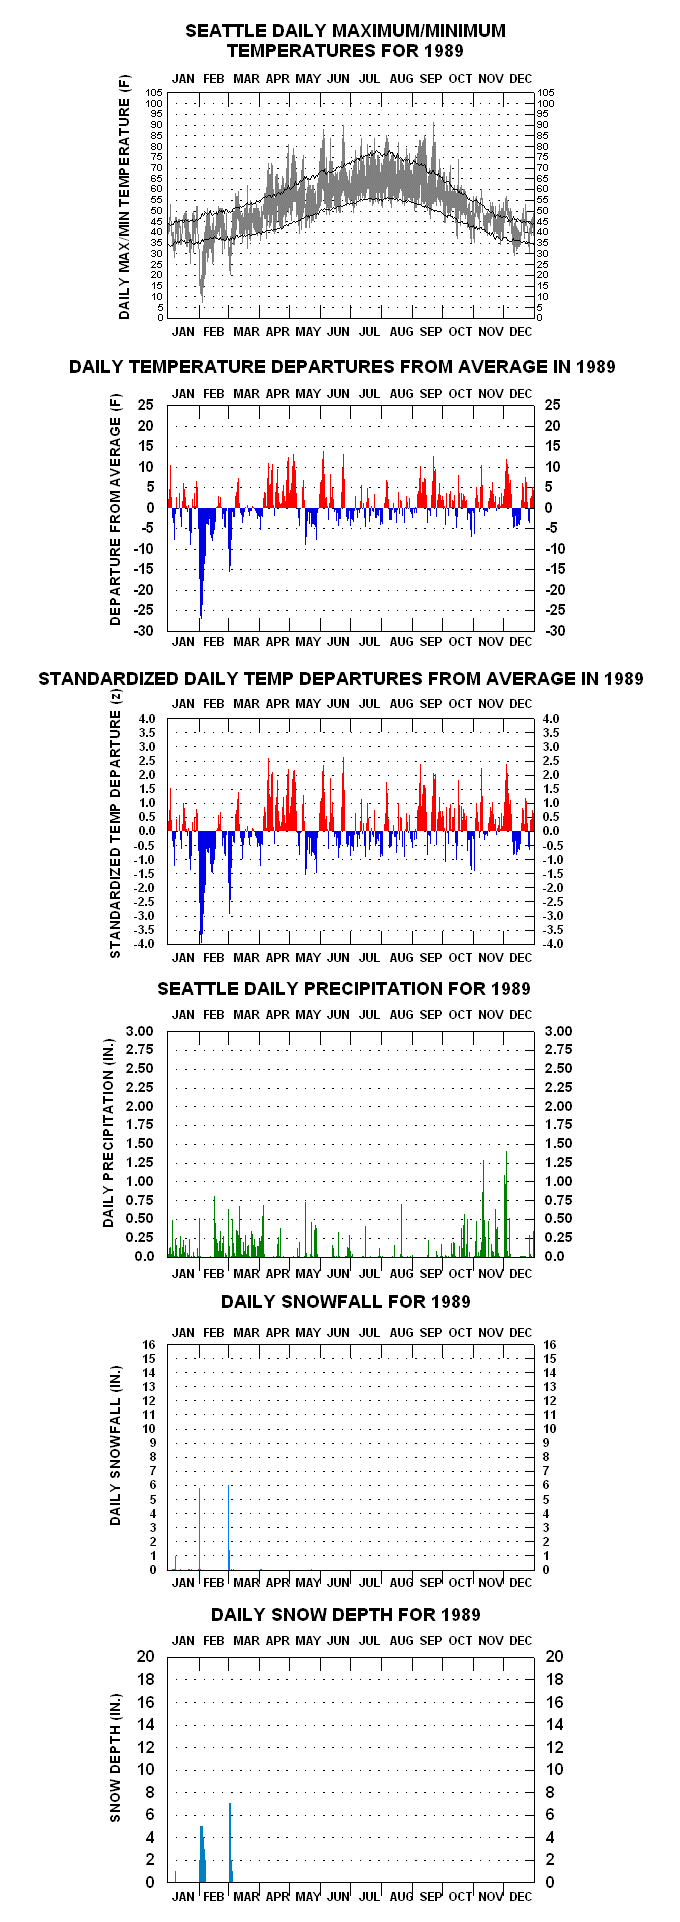
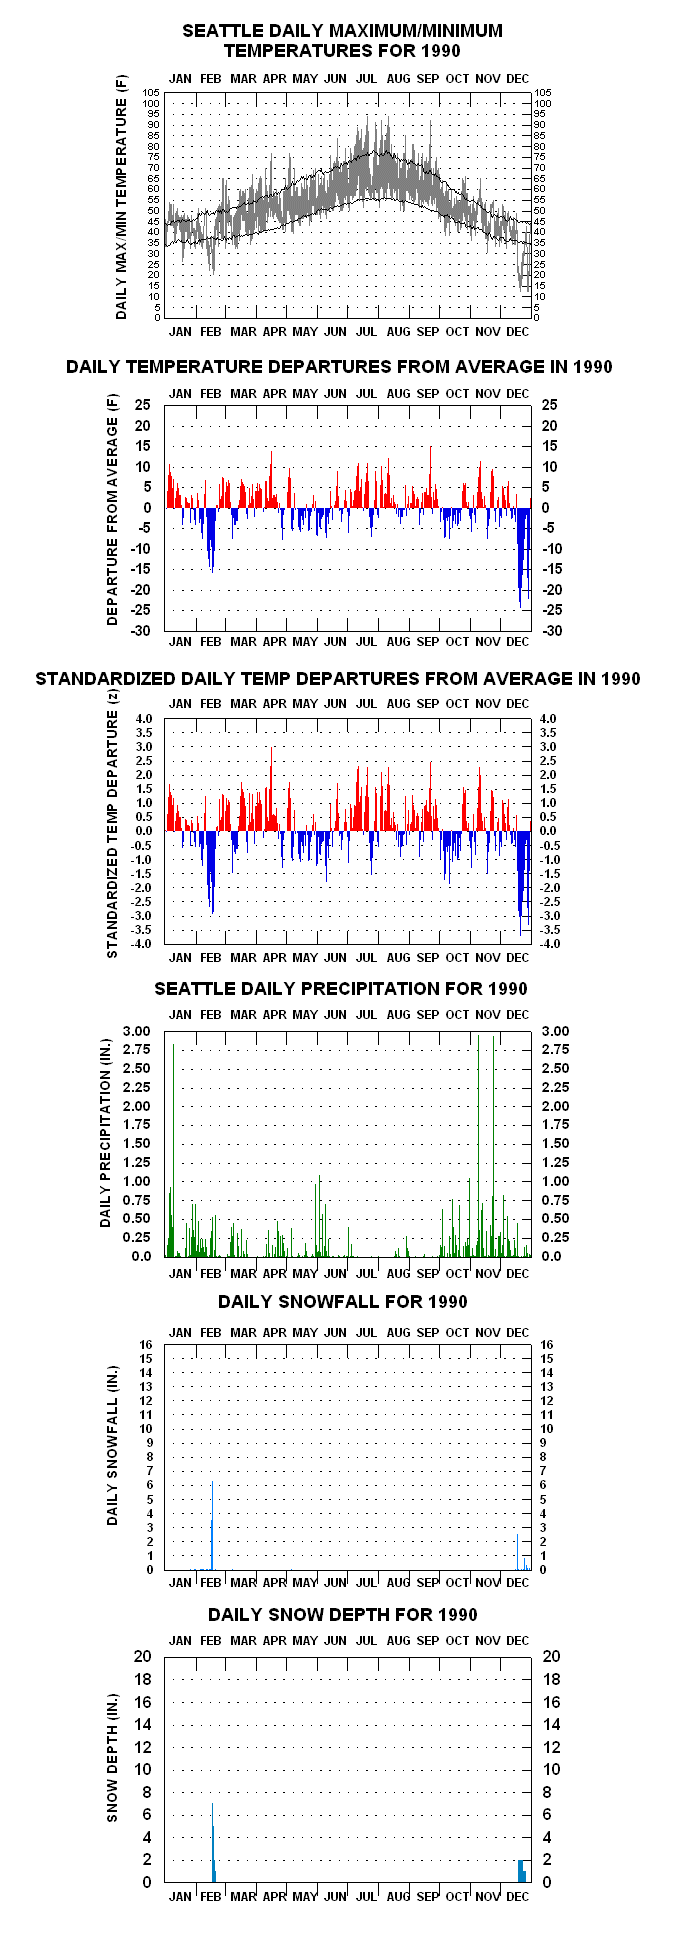
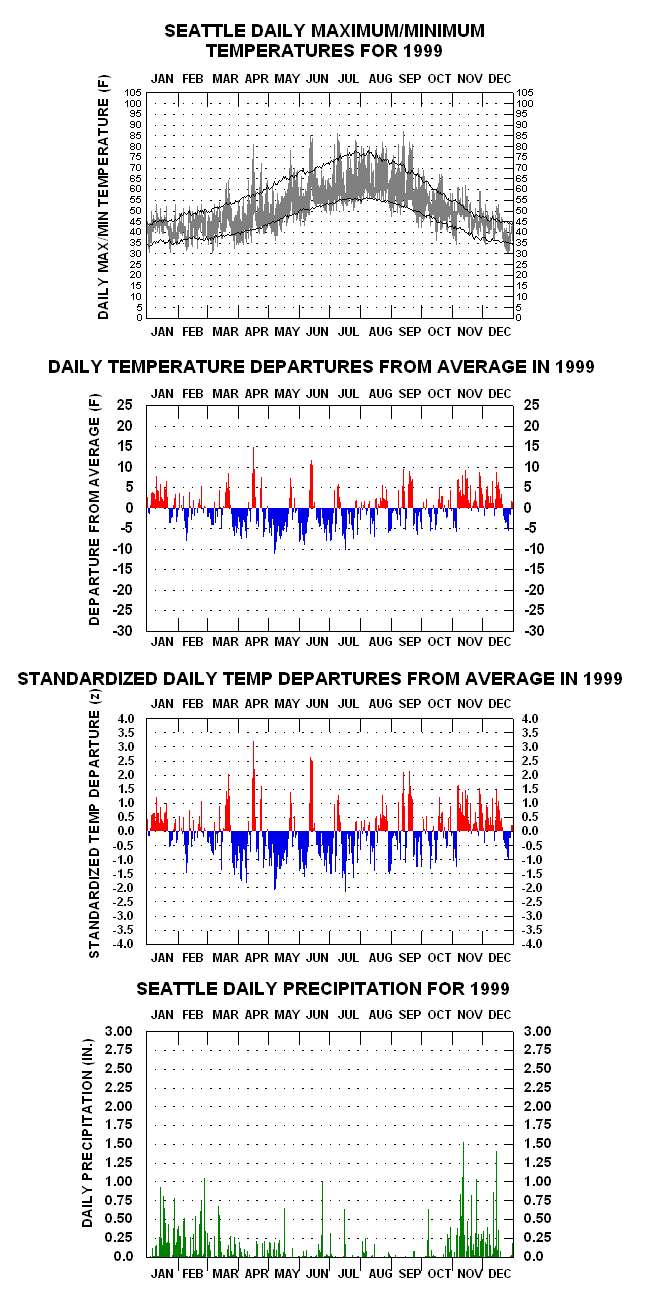
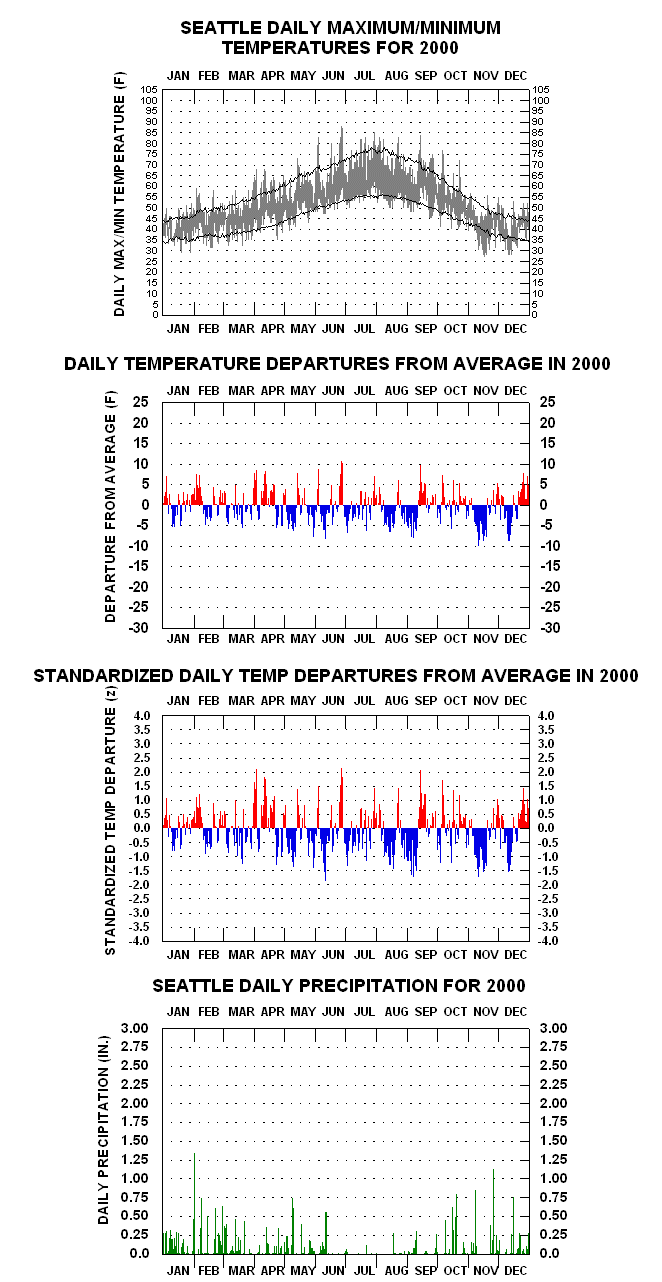
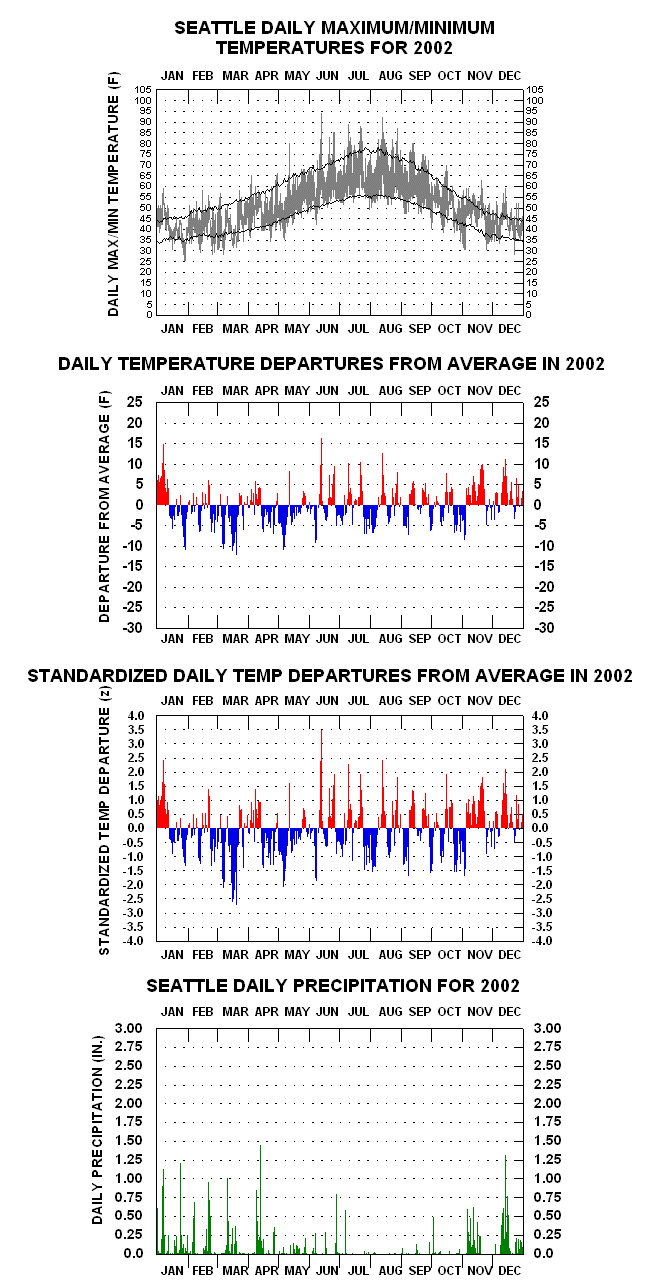
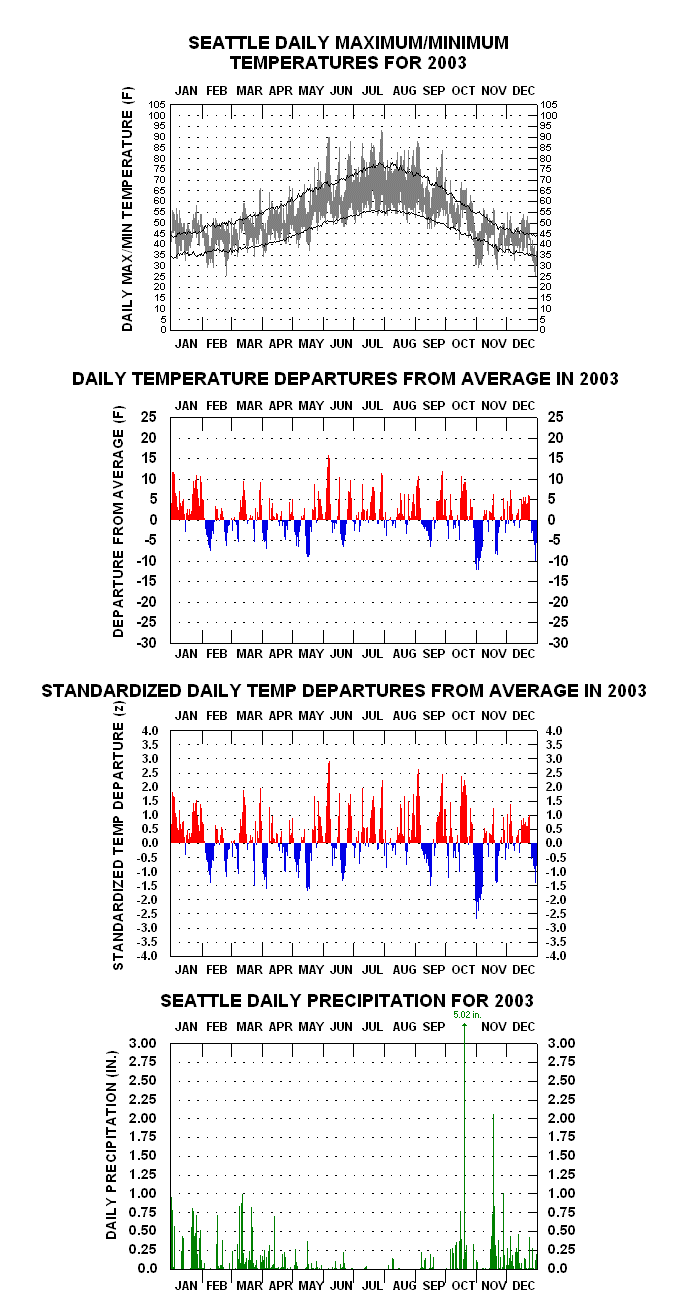
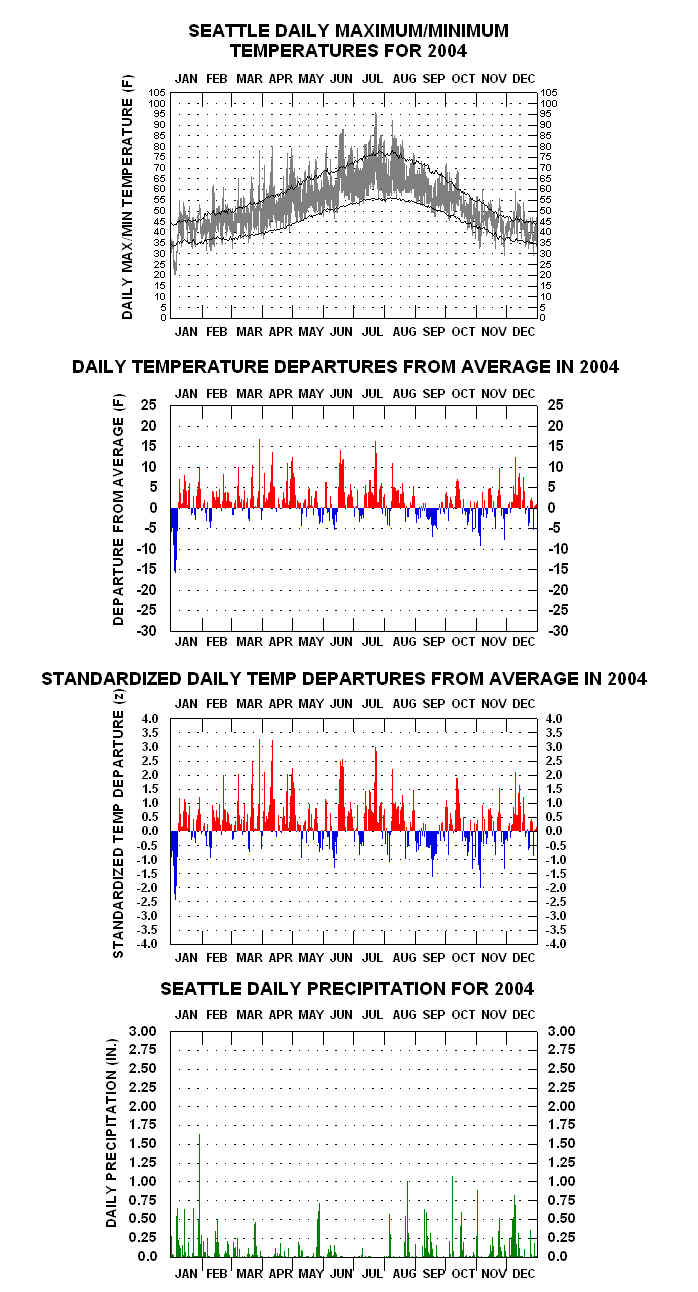
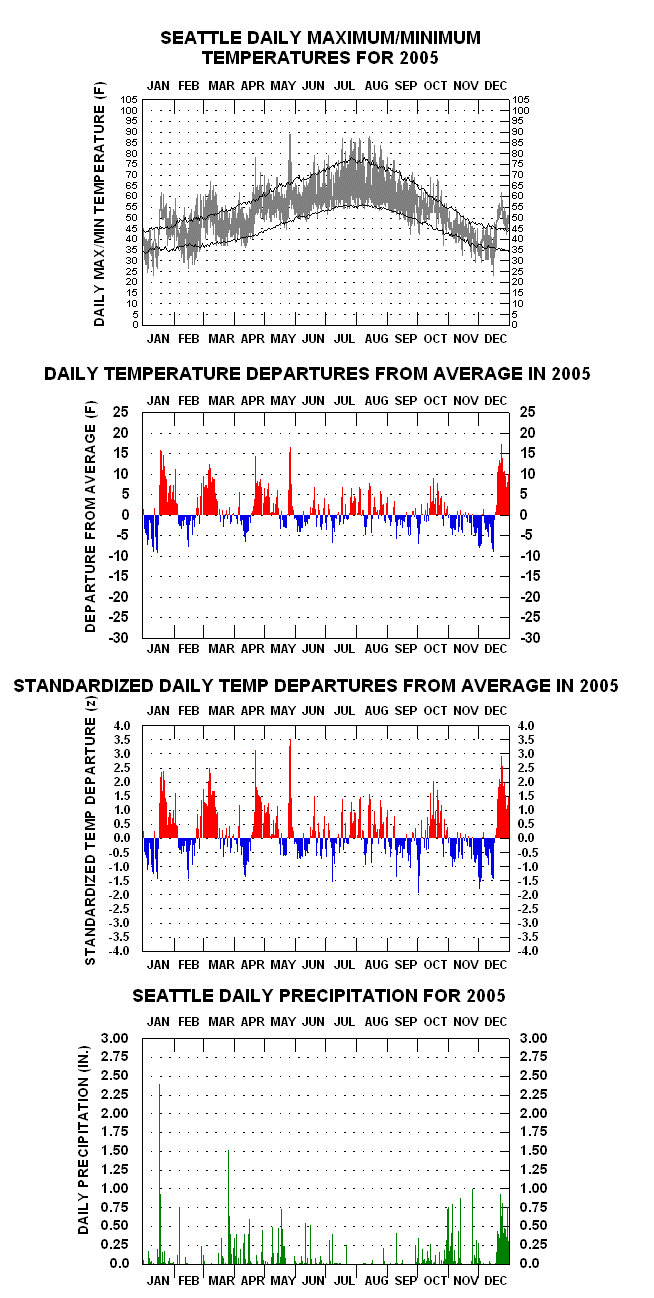
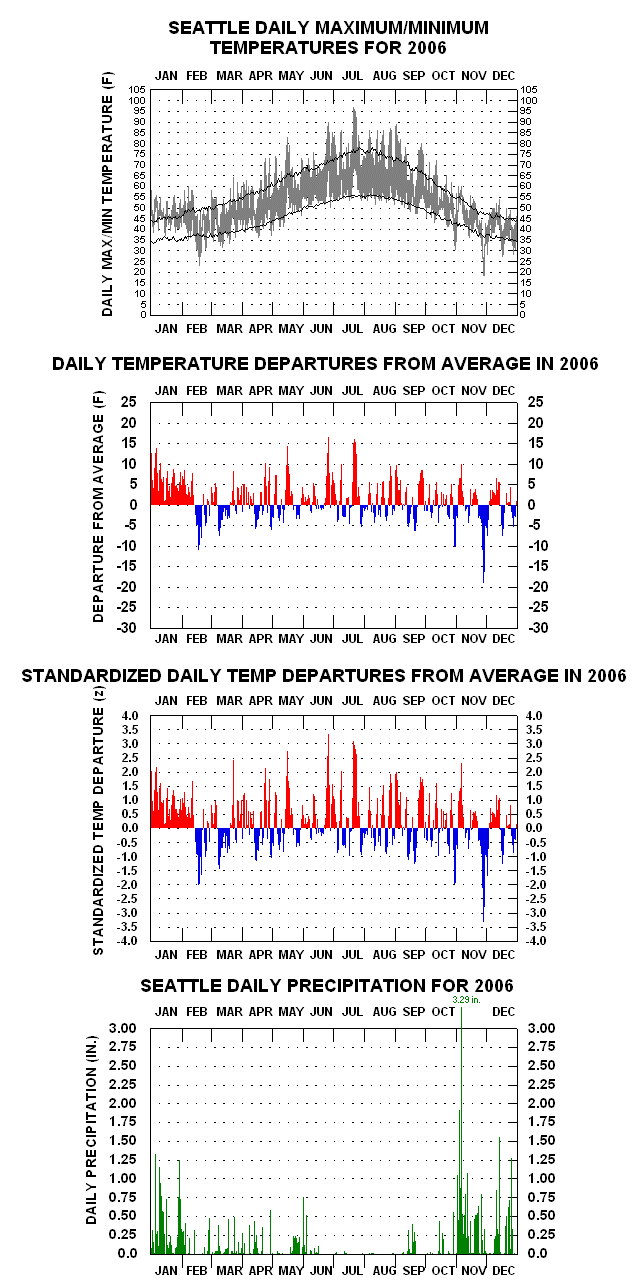
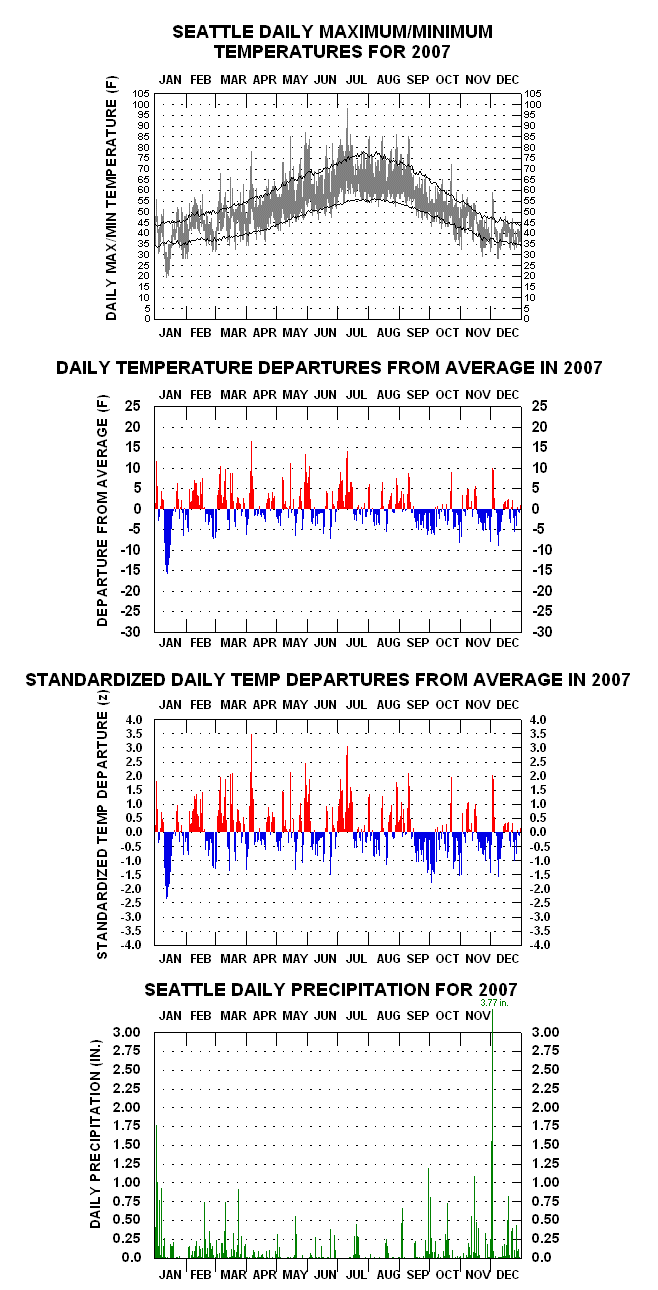
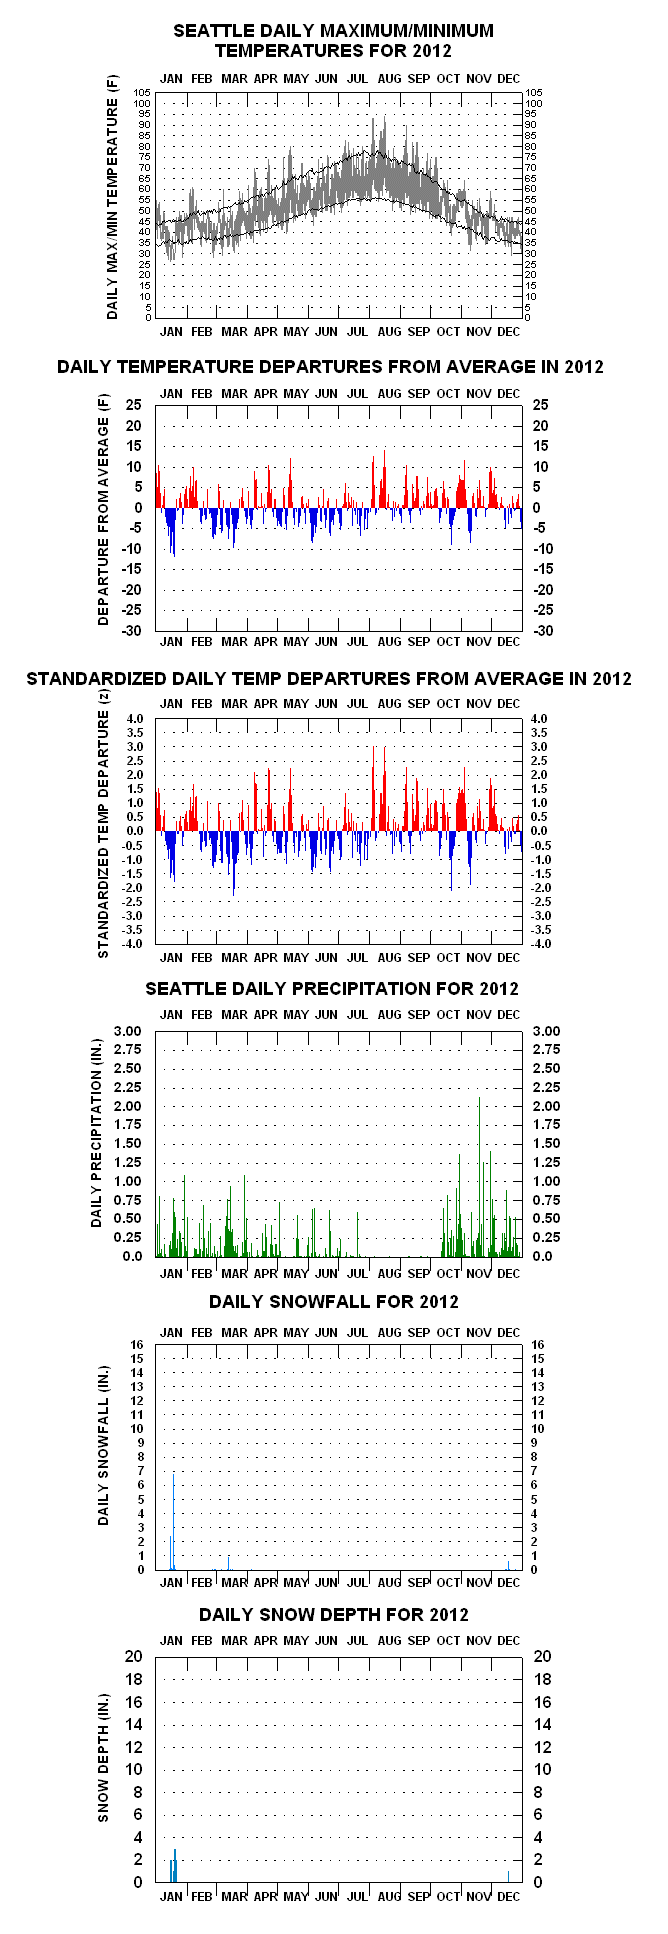
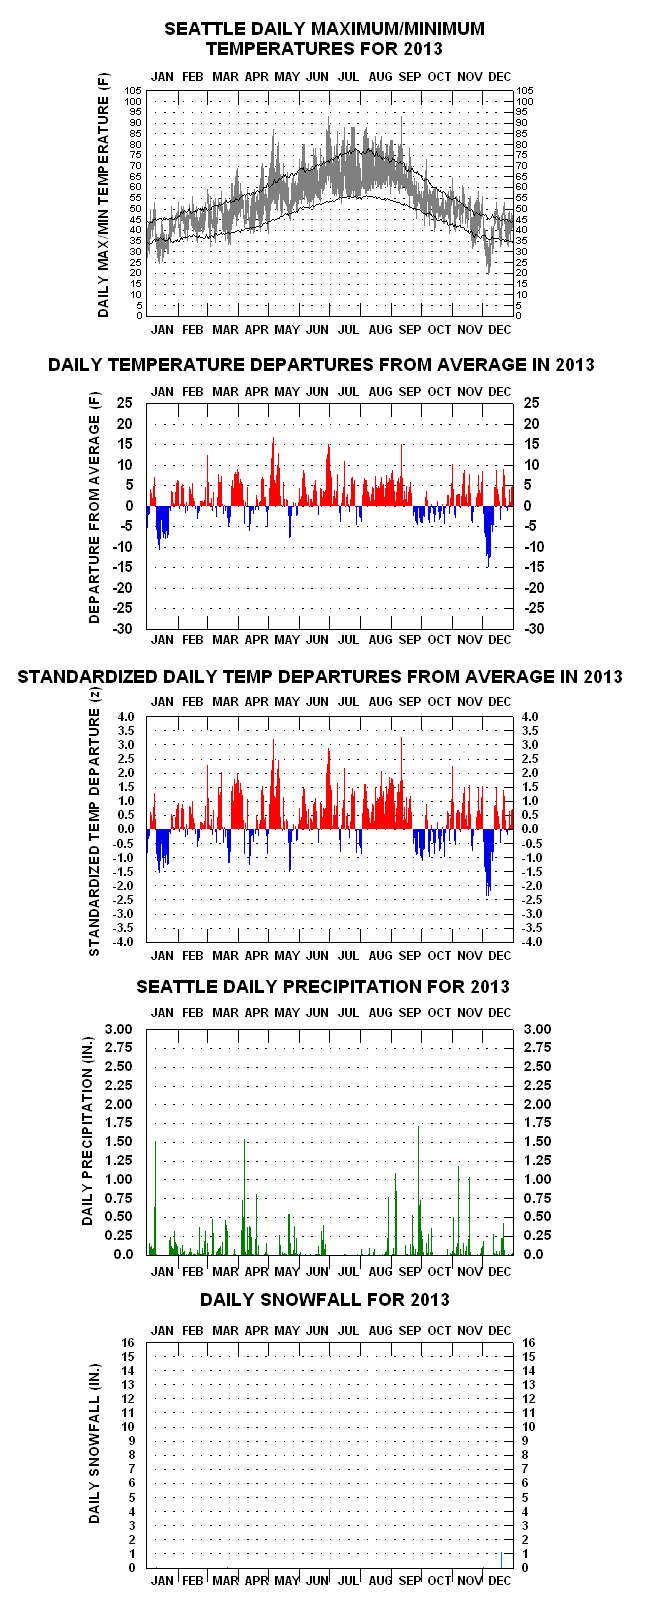
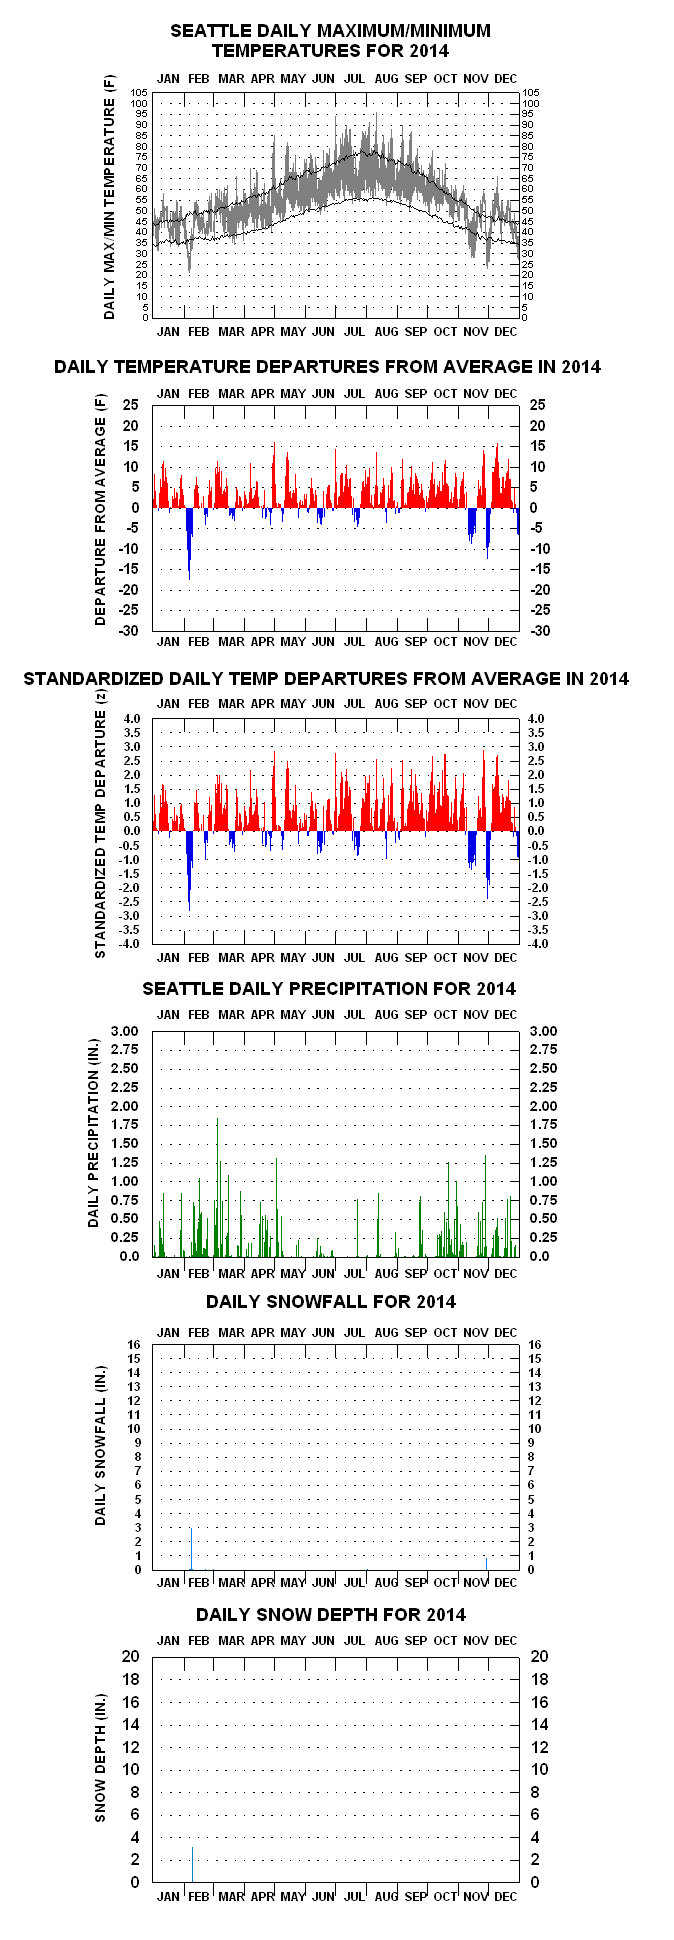
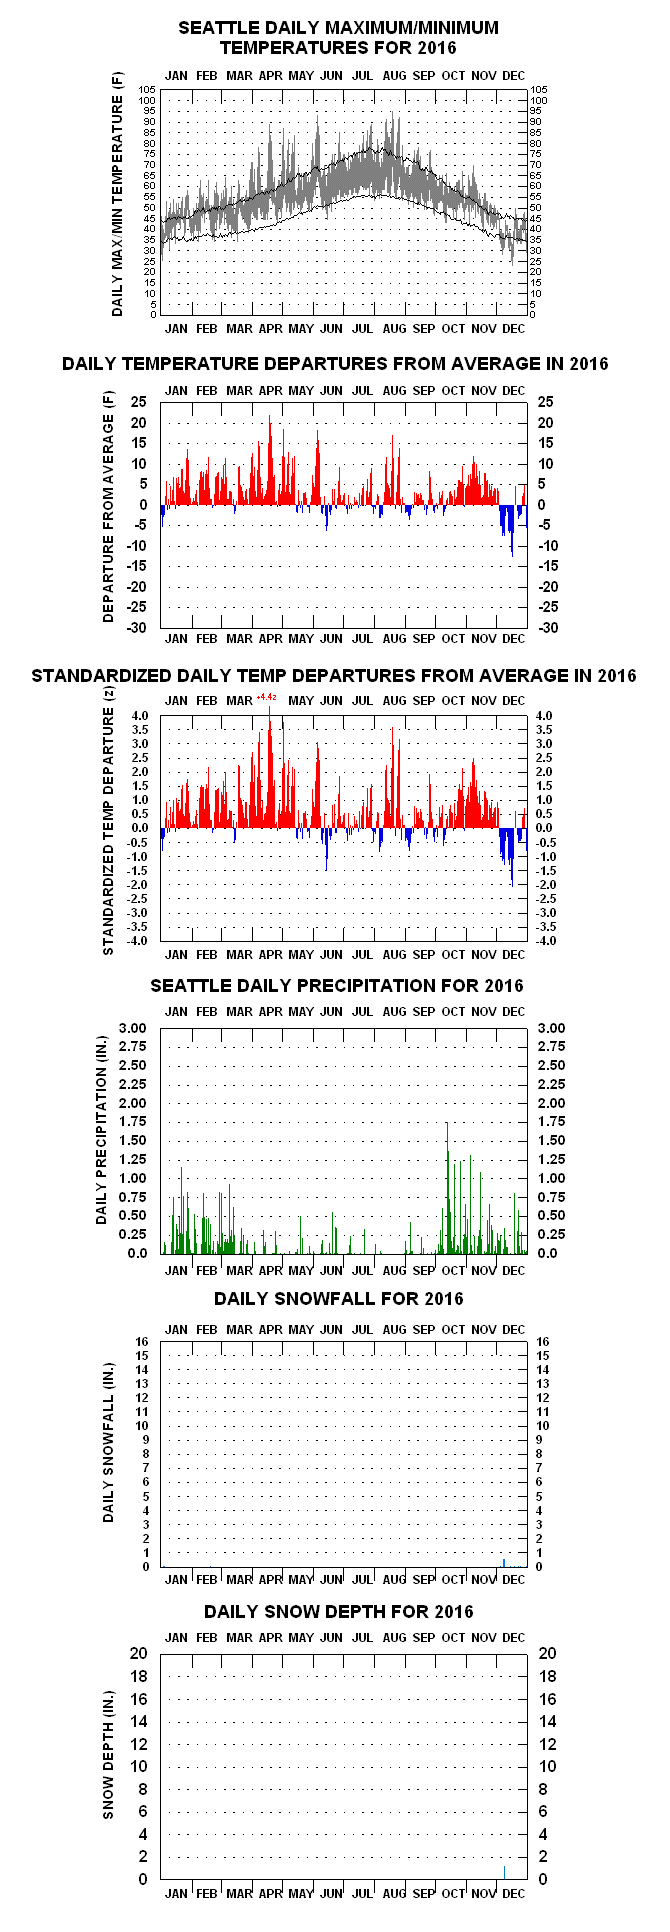
Links To Some Of The More Interesting Year-To-Year Patterns, With Accompanying Notes
89 F on 18 April breaks previous early-season-date-record for an 89 F reading by nearly a month.
Wettest Spring (Mar-May) in history (16.77").
103 F on 29 July sets new record hottest temperature. 103/71 F Max/Min hottest day (87.0 F Mean).
November wettest calendar month (15.63") in history.
Warmest Year to date (54.4 F) and until 2014.
100 F on 20 July highest yet in history.
Warmest Year to date (54.3 F).
Coldest November in history by more than 3 F. Also 2nd driest calendar year in history (25.13").
99 F on 8 August ties record hottest reading in history.
Driest Spring in history (Mar-May) - 3.24".
Pronounced cold spells in late-Jan/early Feb, Sept, and Dec.
Wettest Summer (Jun-Aug) in history (8.43").
99 F on 8 August, Highest reading to date.
Warmest Year to date (53.9 F).
Coldest year of Seattle-Tacoma History (48.0 F). Spectacular temperature plunge and ensuing six-day cold spell in early November.
January wettest calendar month (12.92") until November 2006 .
Driest calendar year in history (23.78"); also driest Fall (Sep-Nov) - 2.72".
January coldest calendar month in history (24.9 F); 0 F on 31st; 53.3" of snow recorded in month. Also wettest calendar year in history (55.14").
First seven weeks of year very cold with nearly 20" snow.
Data Collection 06Analytics
Sample Regimes, PCA Modes, PDFs & Extremes+
Rainfall+
Regimes+
Sample analysis: group years by recurring seasonal rainfall patterns for Seattle, then compare transitions between common, unusual and persistent regimes. This is sample Analytics content for layout and workflow testing. Replace it with the station’s verified analysis when the final material is ready.
Extremes+
Sample analysis: review the upper and lower tails of the rainfall record for Seattle and identify years that merit detailed chart interpretation. This is sample Analytics content for layout and workflow testing. Replace it with the station’s verified analysis when the final material is ready.
Temperature+
PCA Modes+
Sample analysis: demonstrate how leading modes can separate broad temperature variability from shorter-lived anomalies at Seattle. This is sample Analytics content for layout and workflow testing. Replace it with the station’s verified analysis when the final material is ready.
Extremes+
Sample analysis: review the upper and lower tails of the temperature record for Seattle and identify years that merit detailed chart interpretation. This is sample Analytics content for layout and workflow testing. Replace it with the station’s verified analysis when the final material is ready.
Continue Exploring
Compare Climate History Across Every Station
Browse domestic and international climate archives, long-term trends and original statistical visualizations.