

Station Overview
Graphical Climatology of Downtown Phoenix AZ: Daily Temperatures and Rainfall, by Year (1896 - Present)
The following is a graphical climatology of Downtown Phoenix, Arizona temperatures and precipitation, from 1896 into 2026. Included are summary overview charts followed by 131-year-to-year graphs depicting daily temperatures, temperature anomalies, and rainfall for each and every year. The 1896-to-present period of record includes observations made by the Weather Service or affiliates from 1896 to May 1933, and at Sky Harbor Airport from June 1933 thereafter. The data were downloaded and processed from the NOAA National Center for Environmental Information (NCEI) and the NWS-Phoenix site (NOWDATA archives and F-6 reports).
Explore the Climate Data
Use these shortcuts to move directly to the principal charts, analyses and historical records.
Climate Overview Graphs — RECENT YEARS
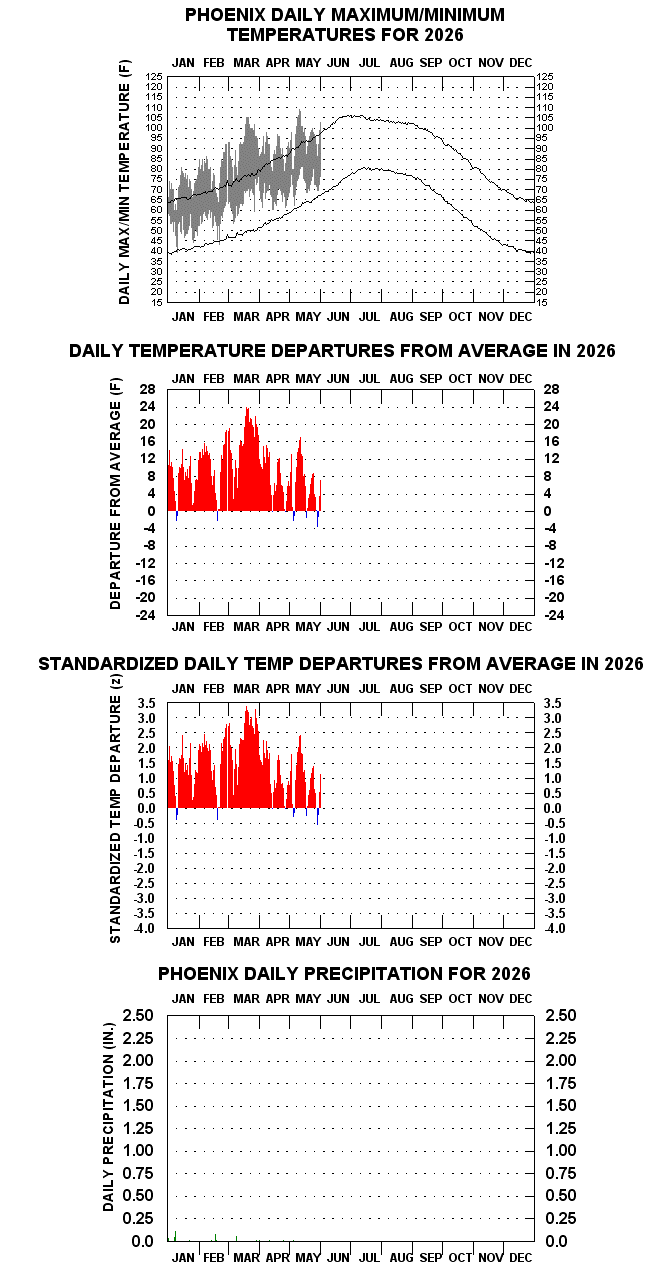
- 2026 Daily Temperature and Precipitation Charts for Downtown Phoenix NewNew (5/31/26)
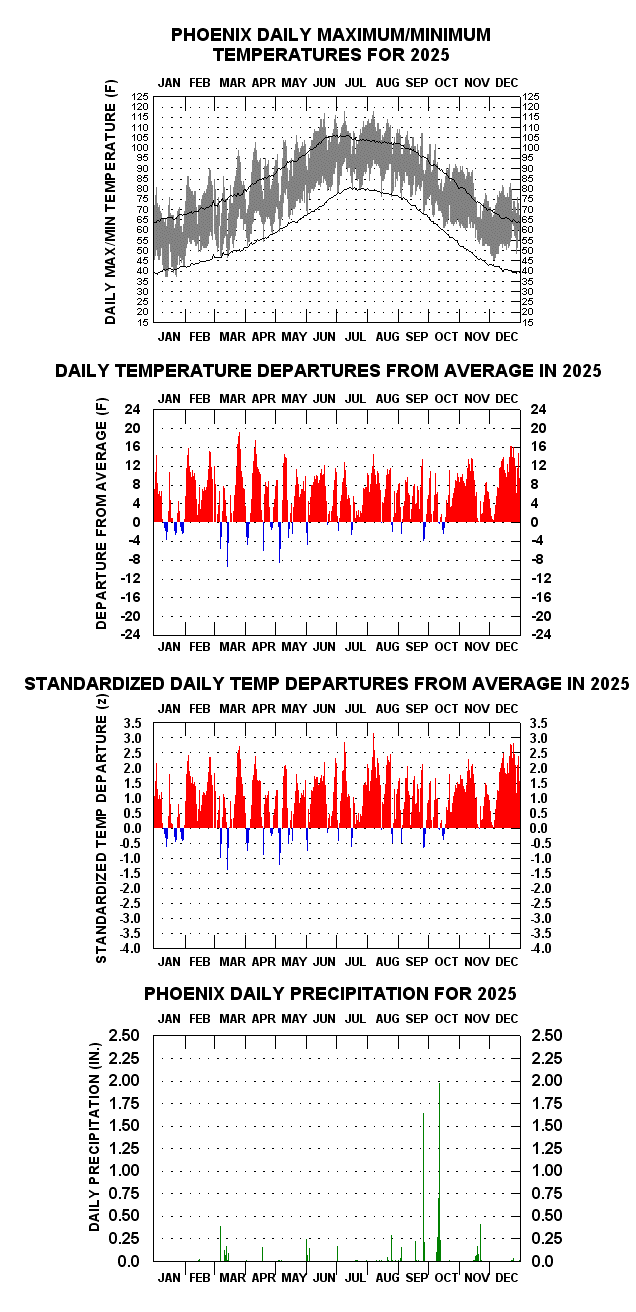
- 2025 Daily Temperature and Precipitation Chart for Downtown Phoenix NewNew (12/31/25)
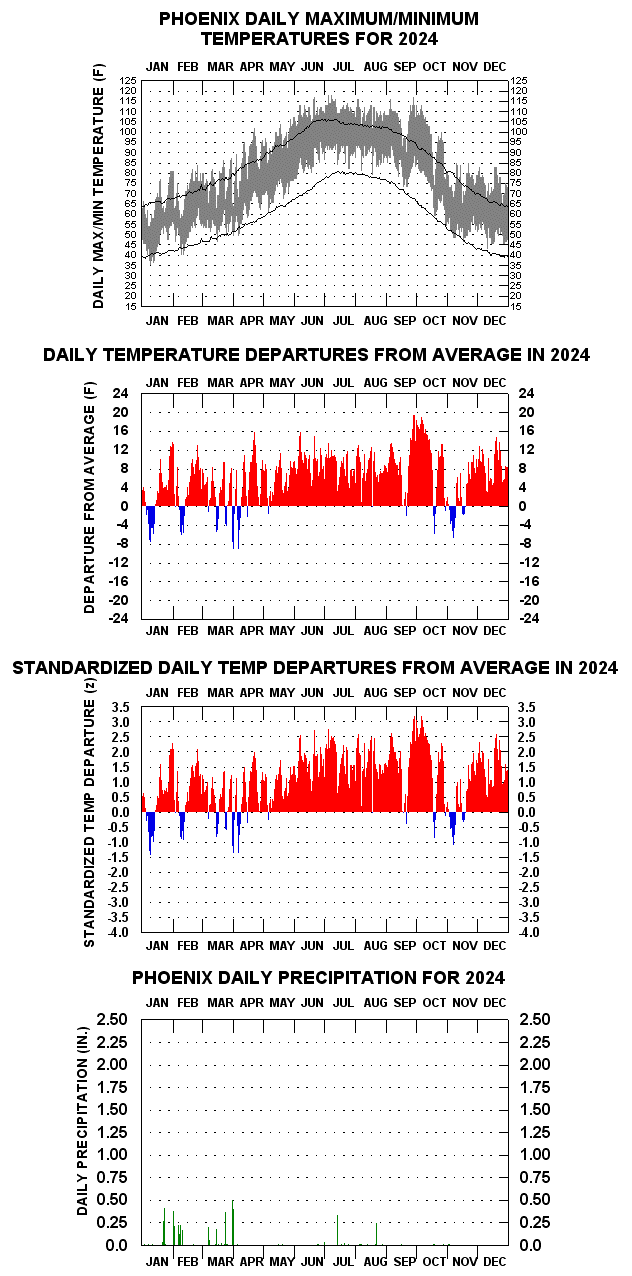
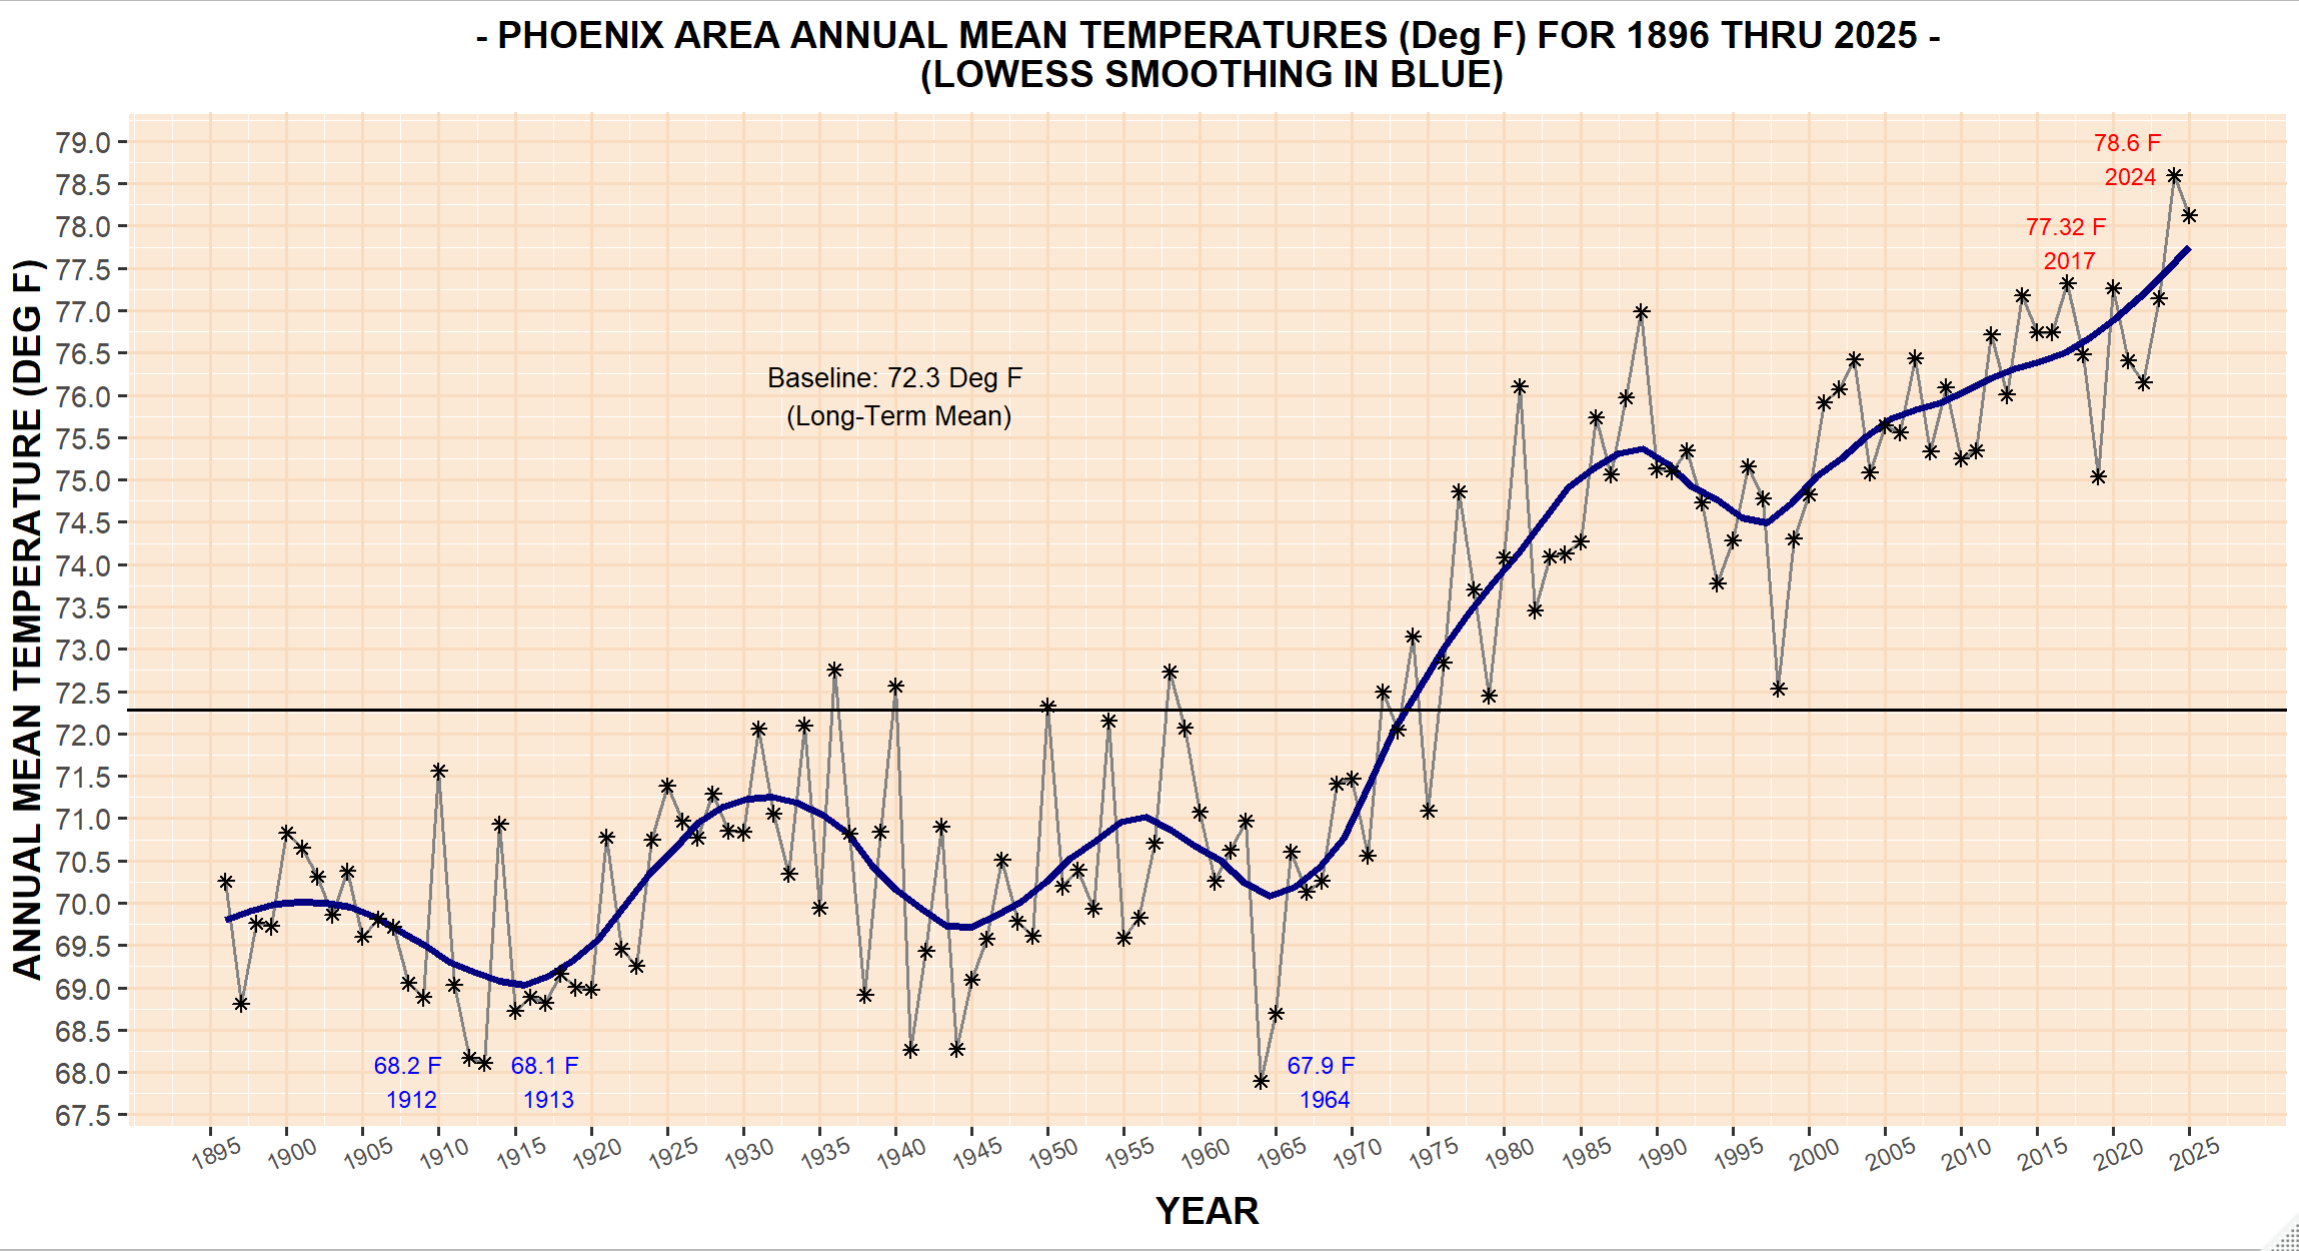
- 2024 Daily Temperature and Precipitation Chart for Downtown PhoenixWarmest Year in History (78.6 F)- Surpasses 2017 by 1.3 F
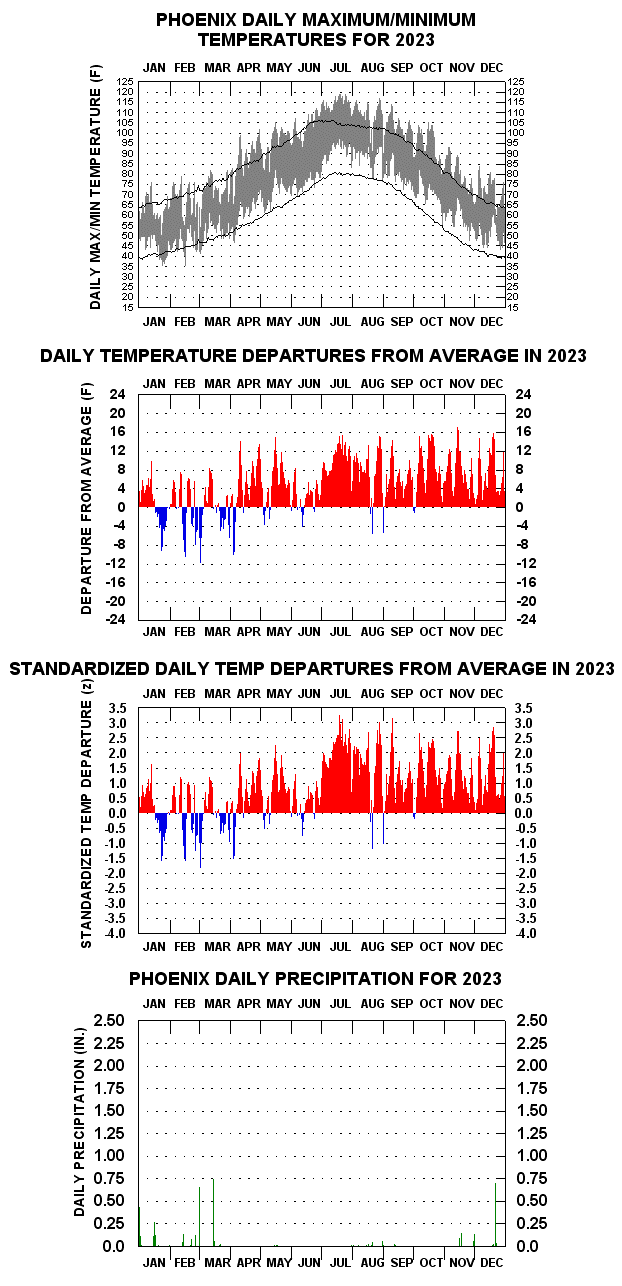
- 2023 Daily Temperature and Precipitation Chart for Downtown Phoenix
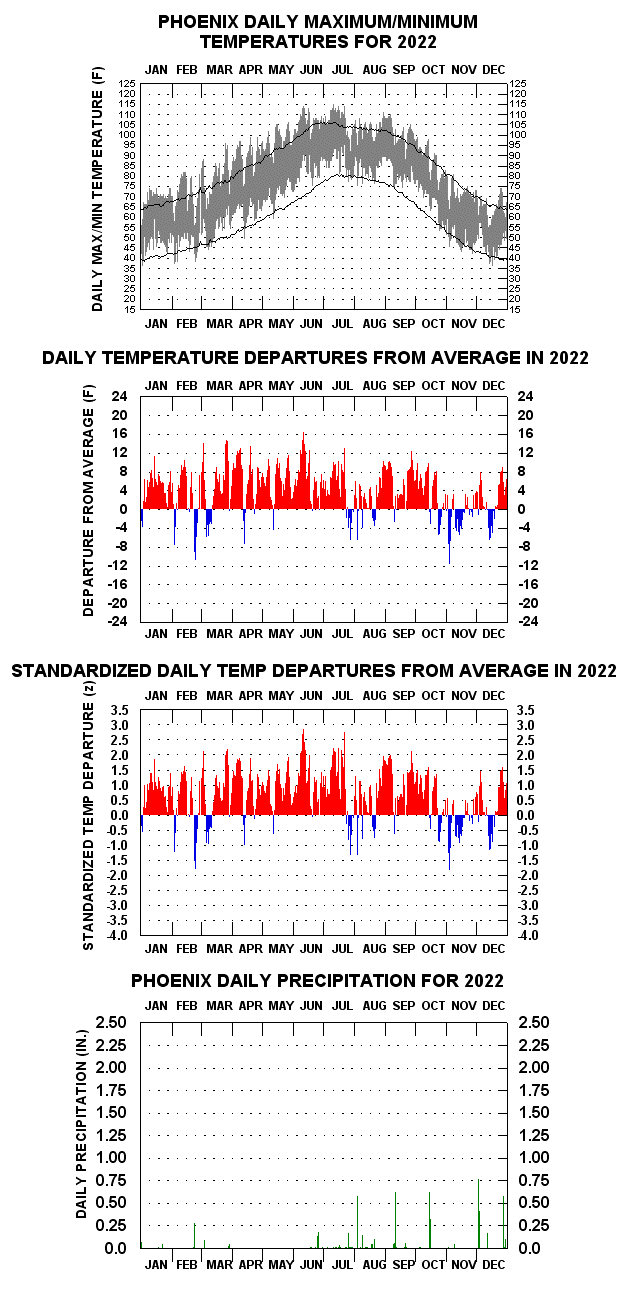
- 2022 Daily Temperature and Precipitation Chart for Downtown Phoenix
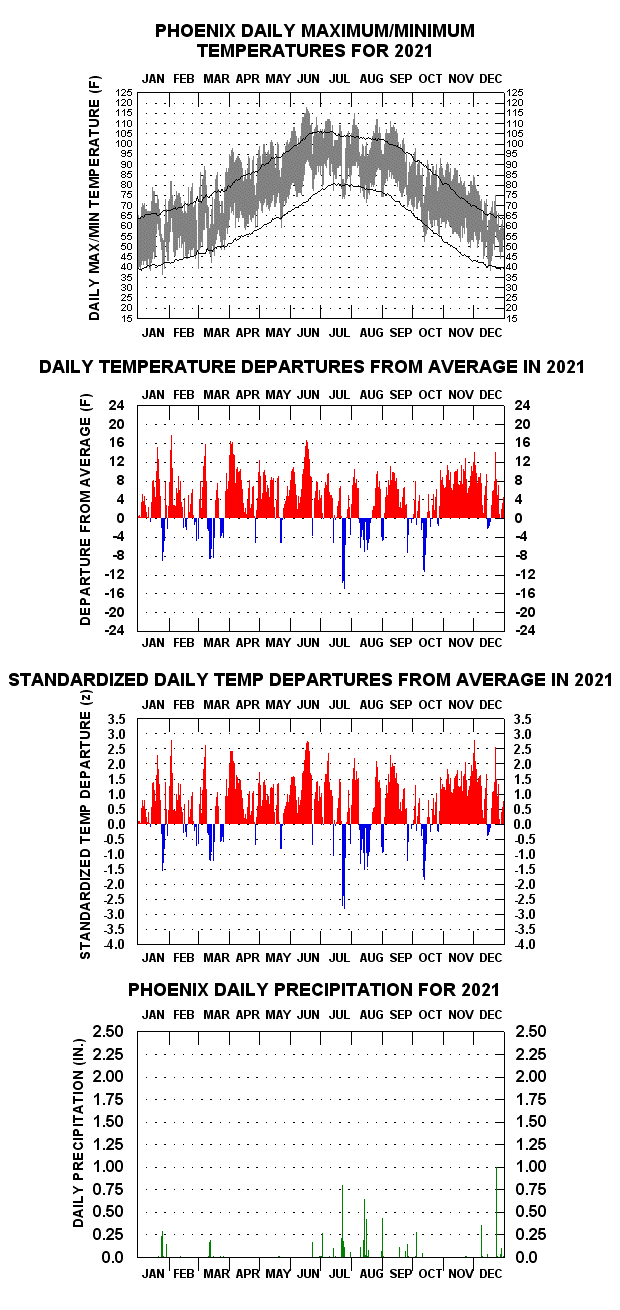
- 2021 Daily Temperature and Precipitation Chart for Downtown Phoenix
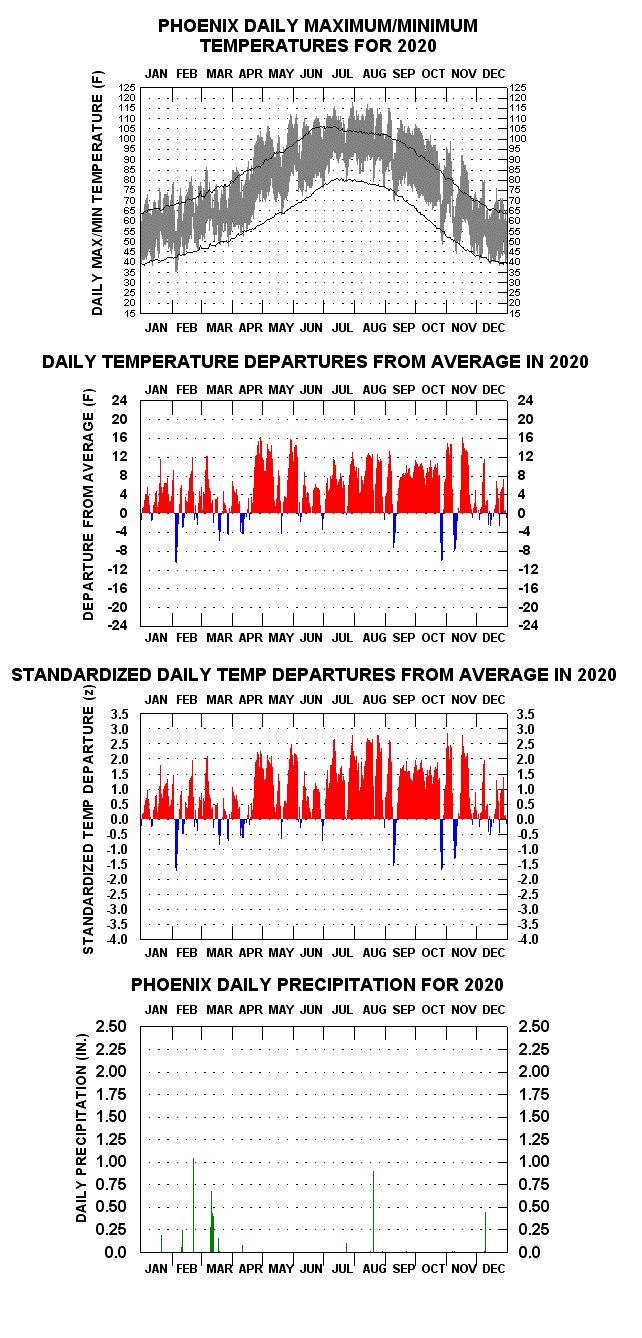
- 2020 Daily Temperature and Precipitation Chart for Downtown Phoenix
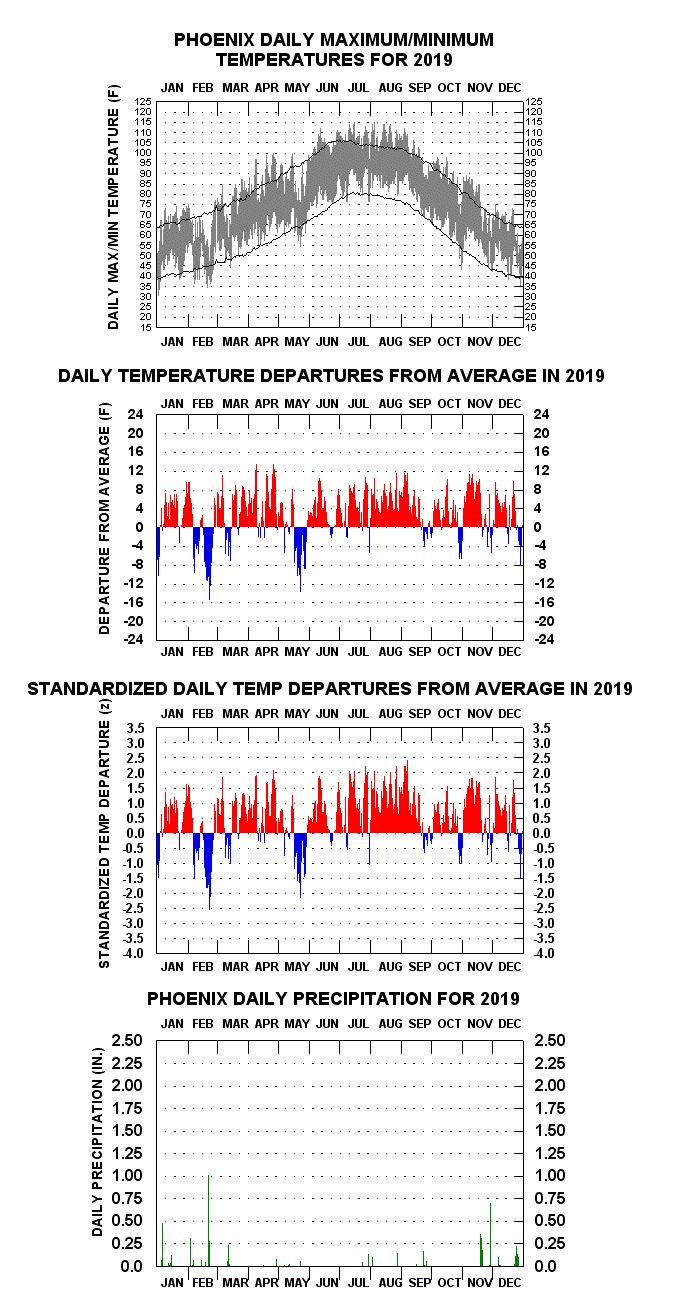
- 2019 Daily Temperature and Precipitation Chart for Downtown Phoenix
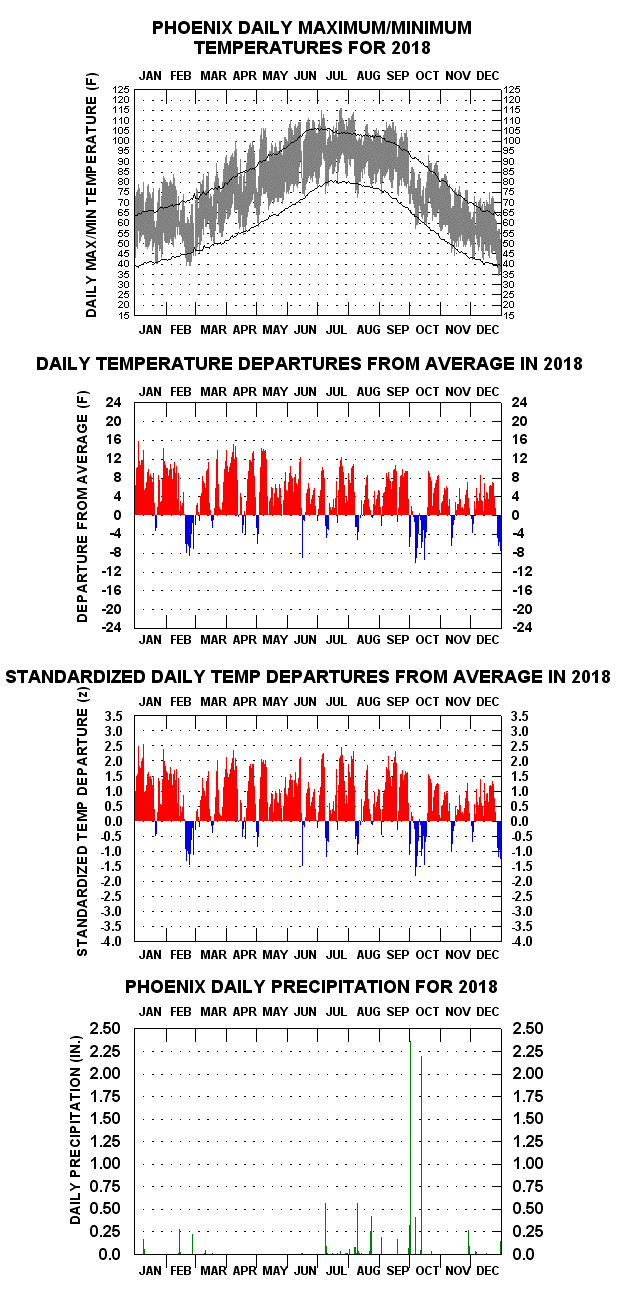
- 2018 Daily Temperature and Precipitation Chart for Downtown Phoenix
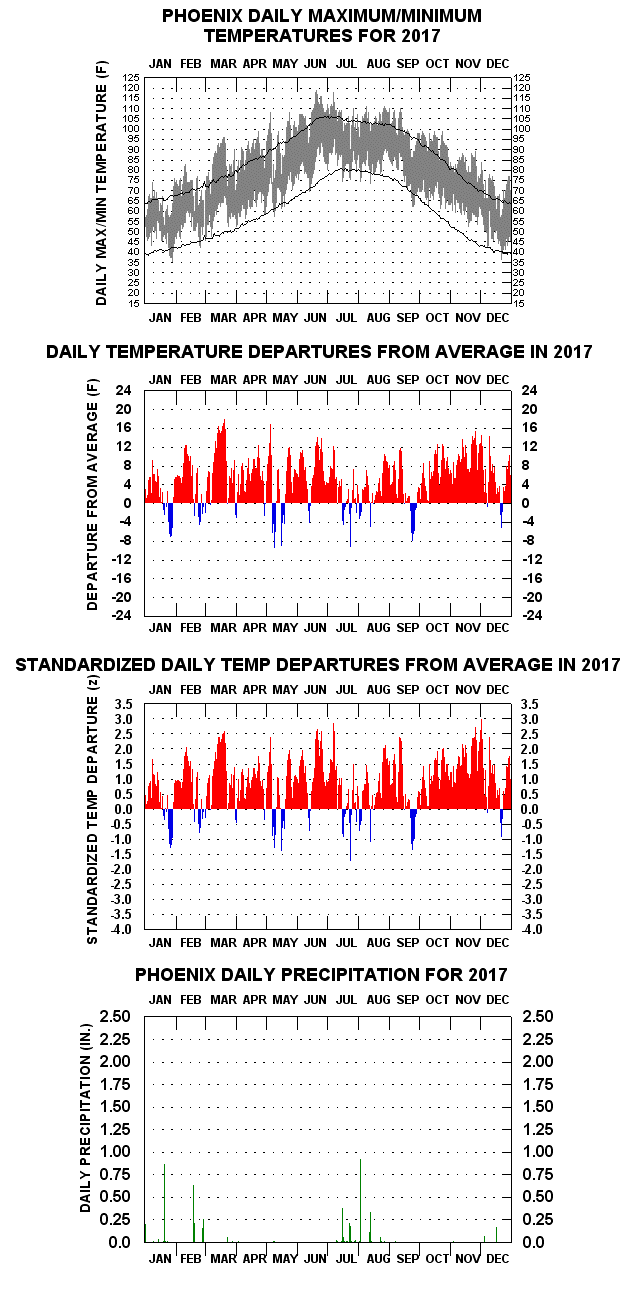
- 2017 Daily Temperature and Precipitation Chart for Downtown Phoenix
Historical Series
- Downtown Phoenix Annual Mean Temperature History (1896-2025 New)New (1/8/26)
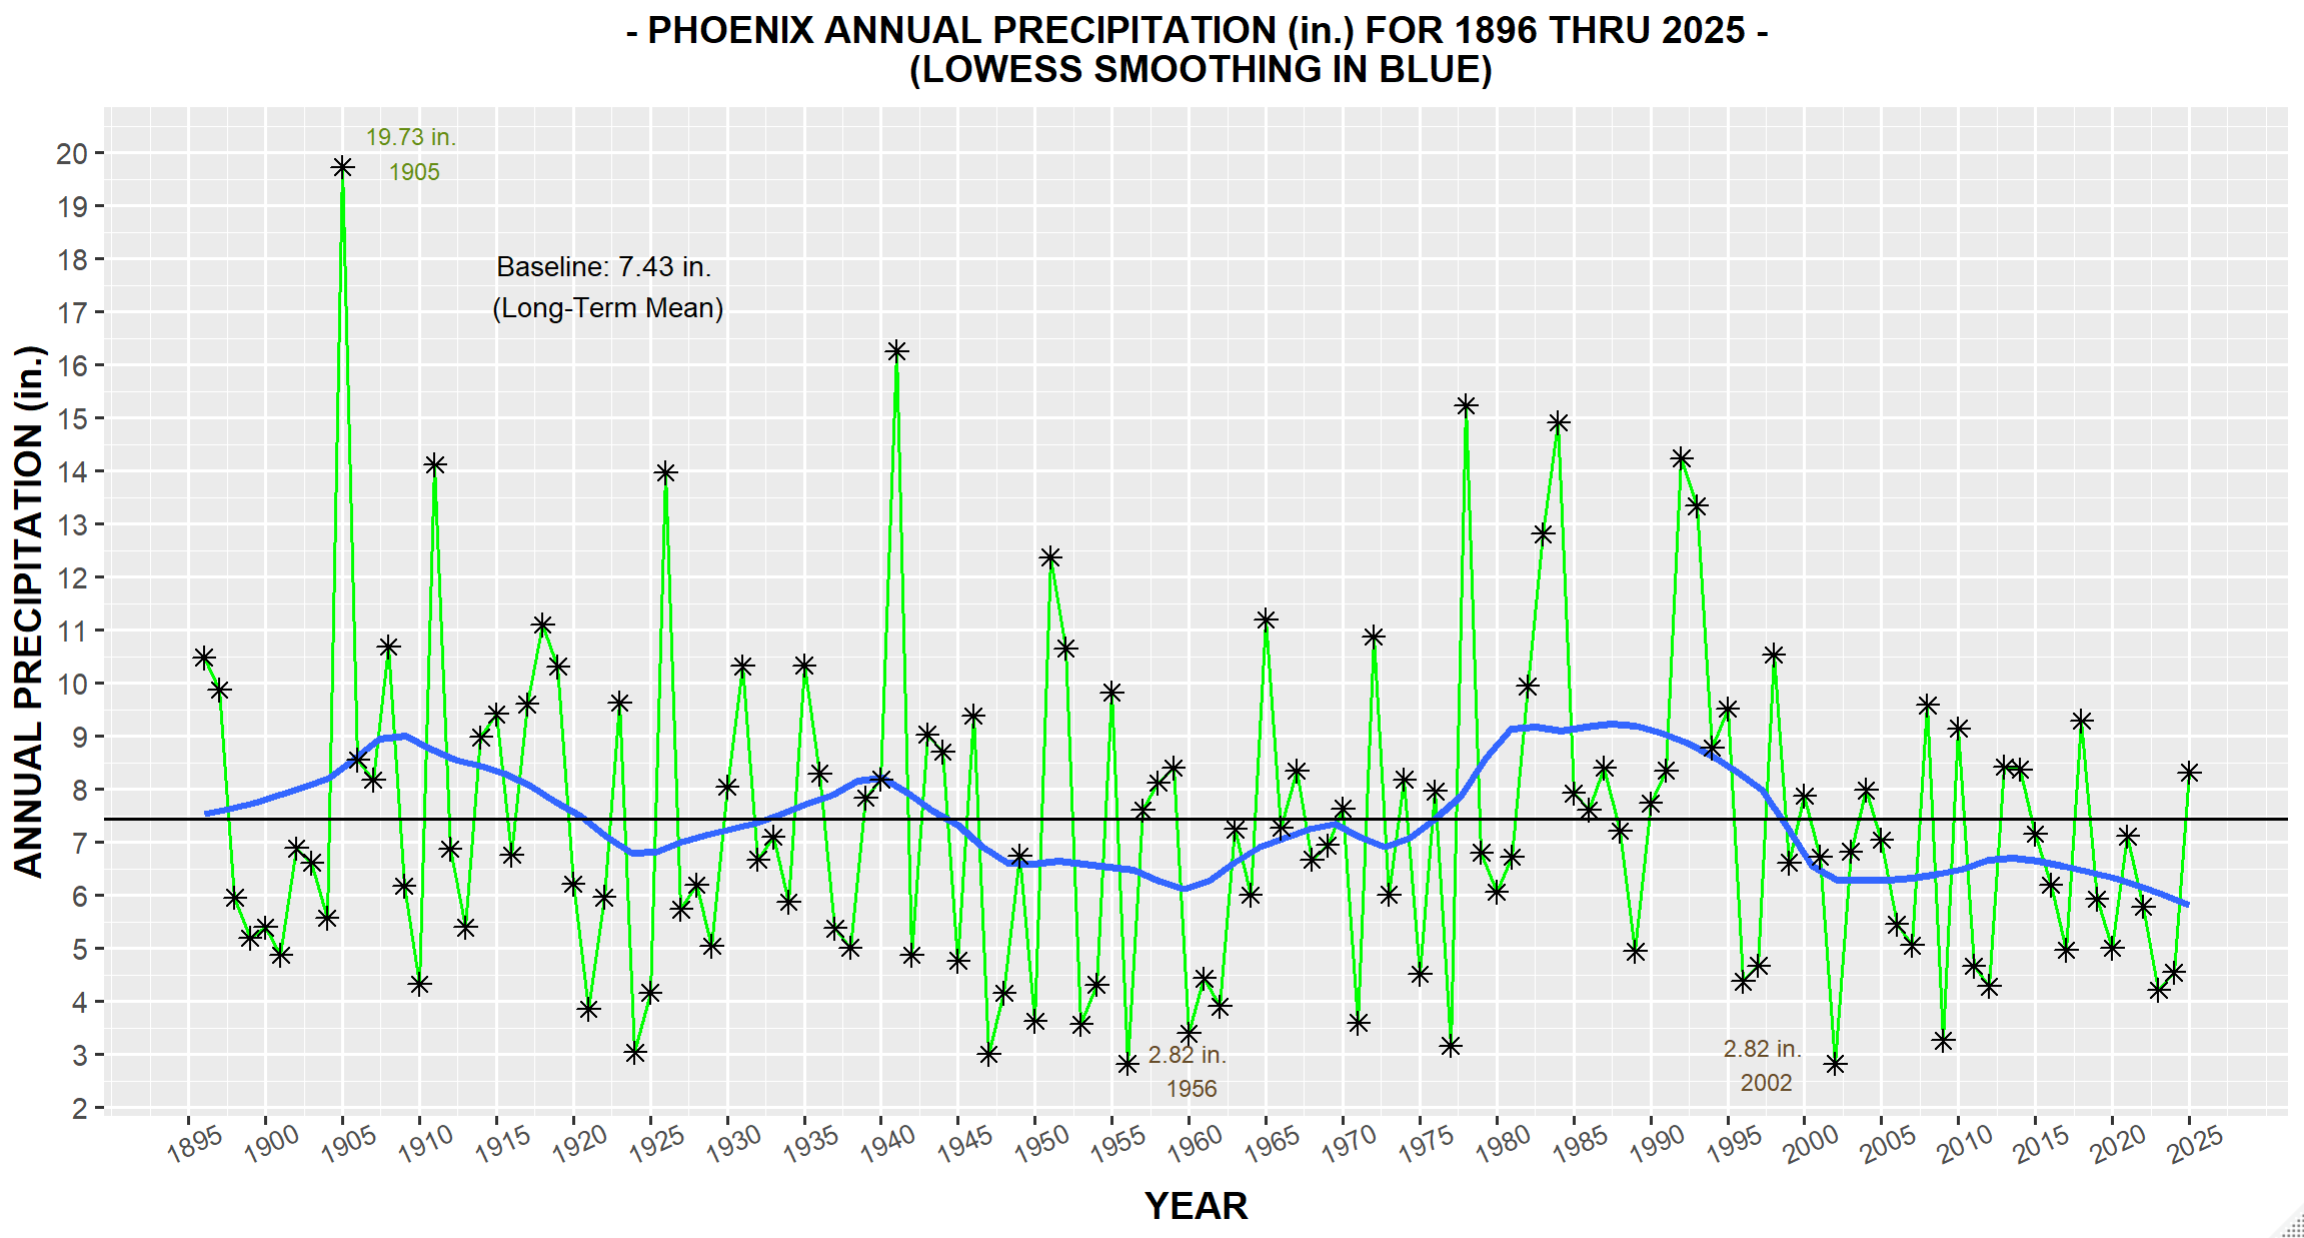
- Downtown Phoenix Calendar Year Precipitation History (1896-2025) NewNew (1/8/26)
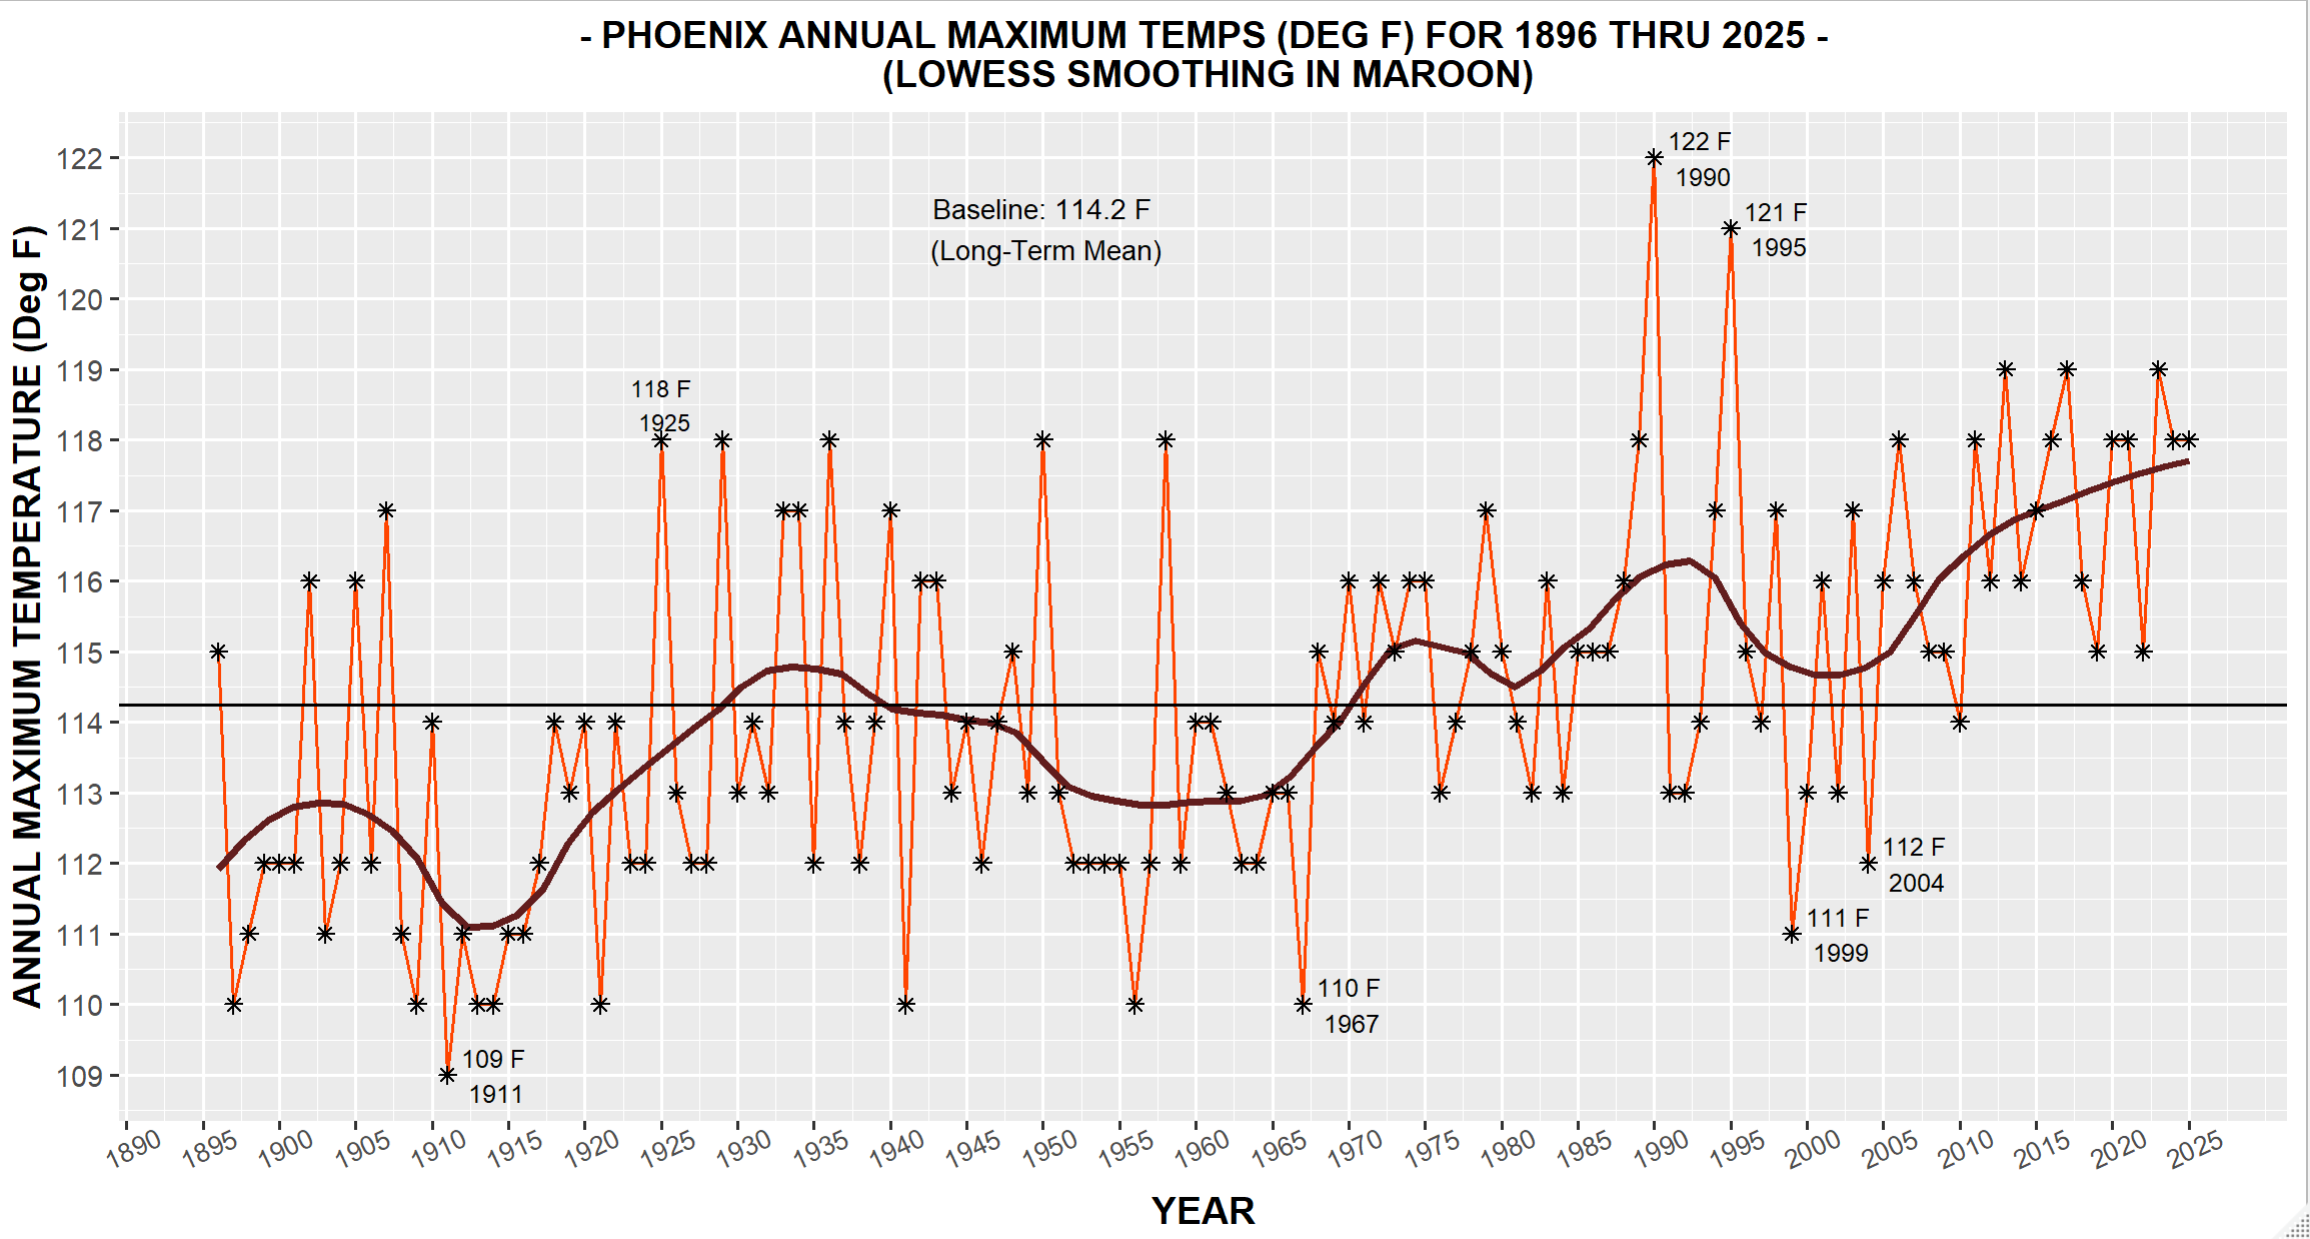
- Downtown Phoenix Annual Maximum Temps (1896-2025) NewNew (1/8/26)
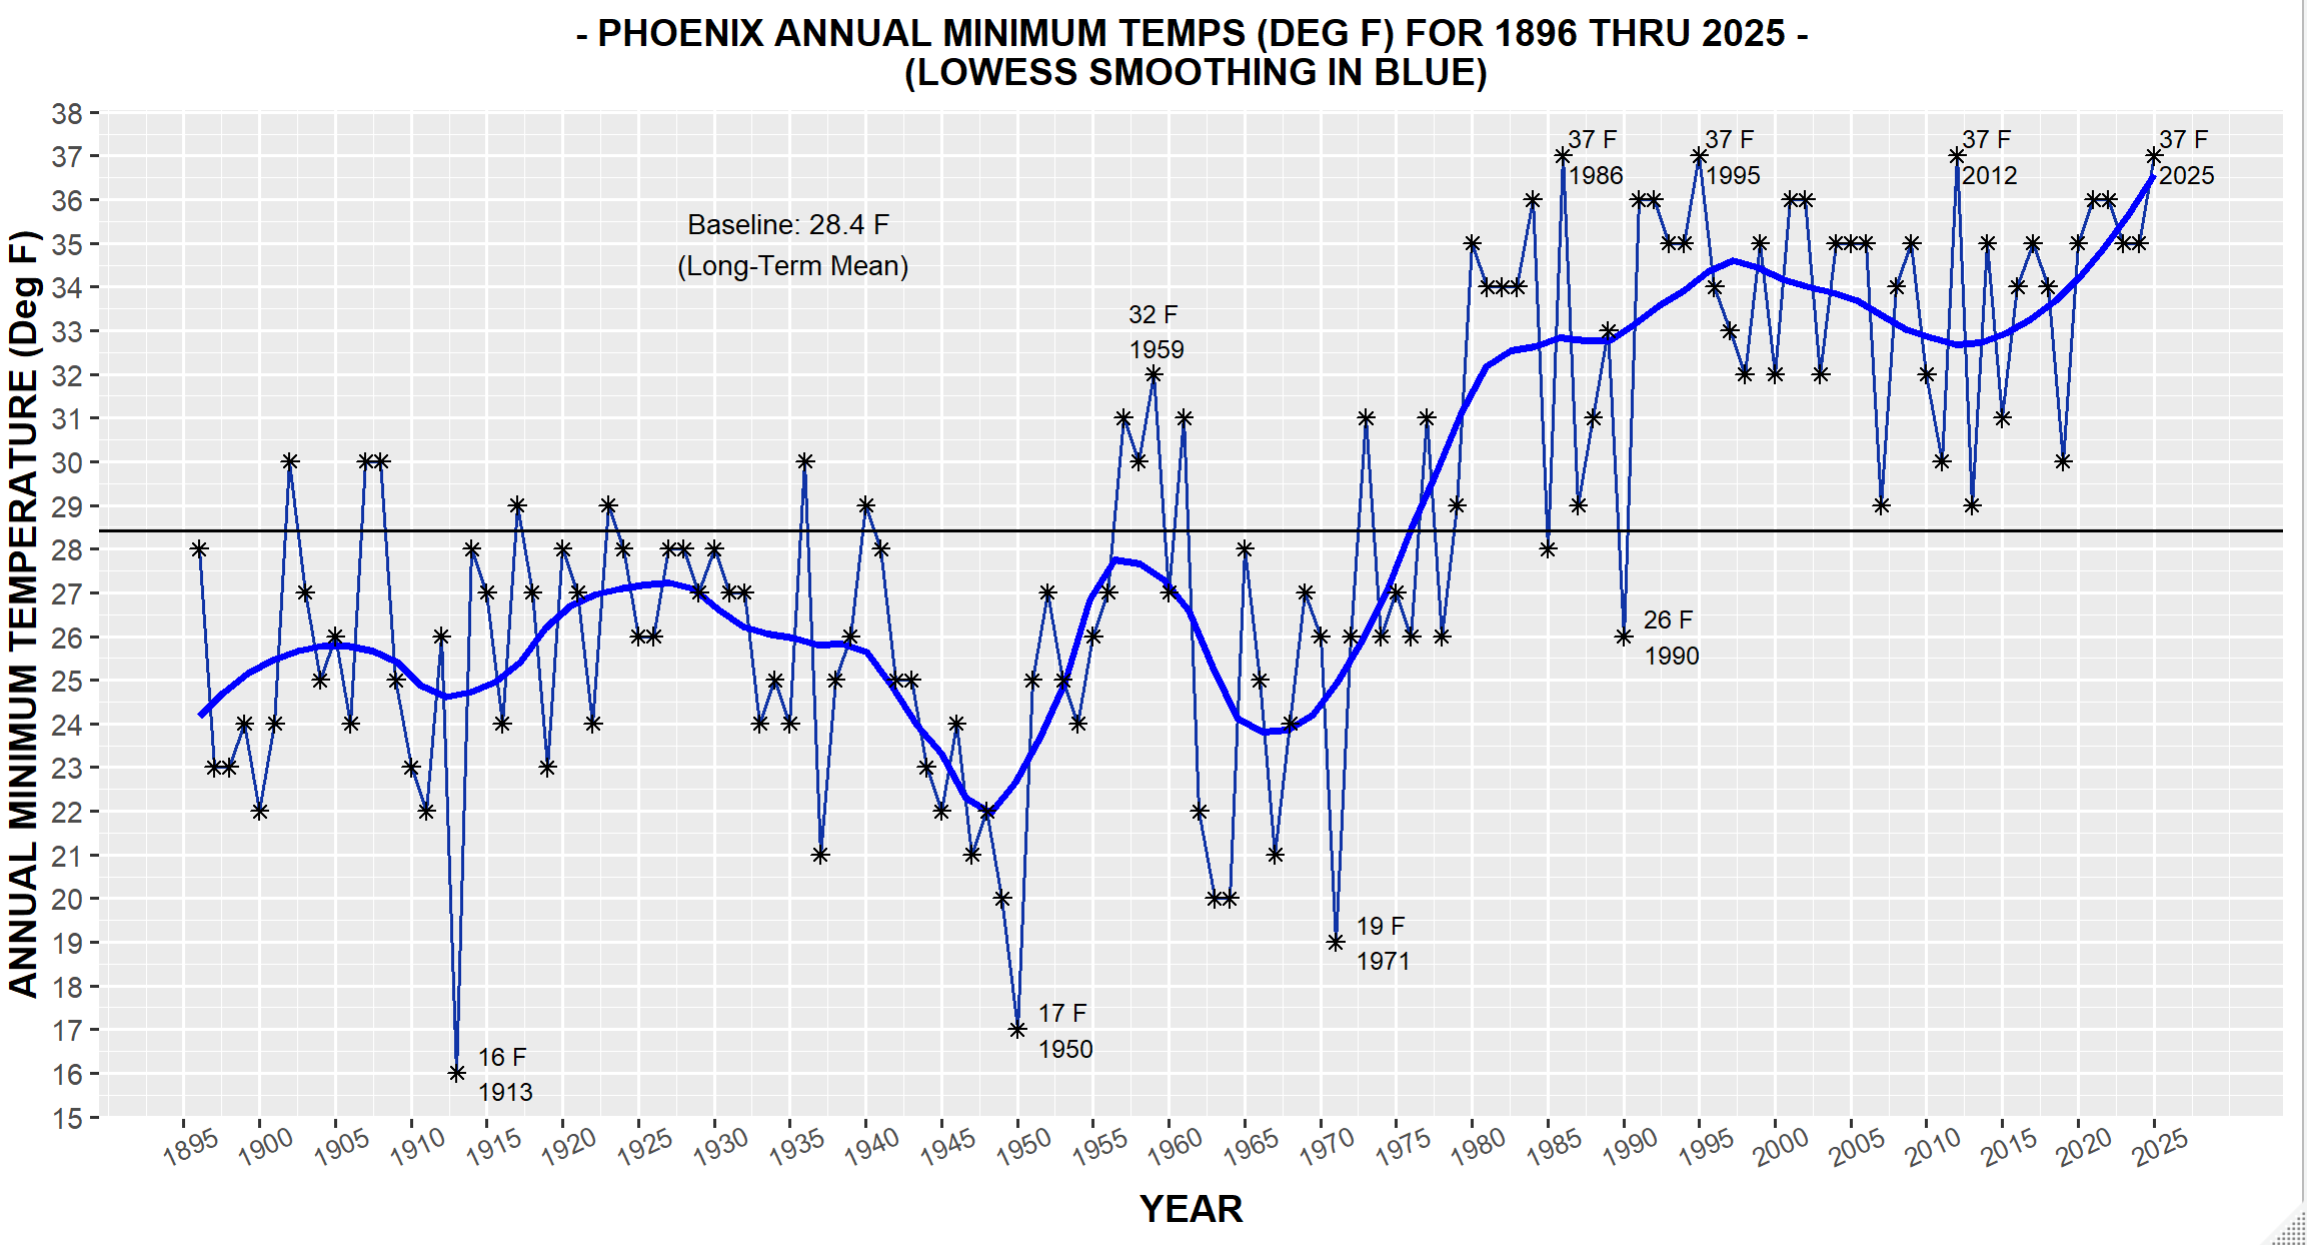
- Downtown Phoenix Annual Minimum Temps (1896-2025) NewNew (1/8/26)
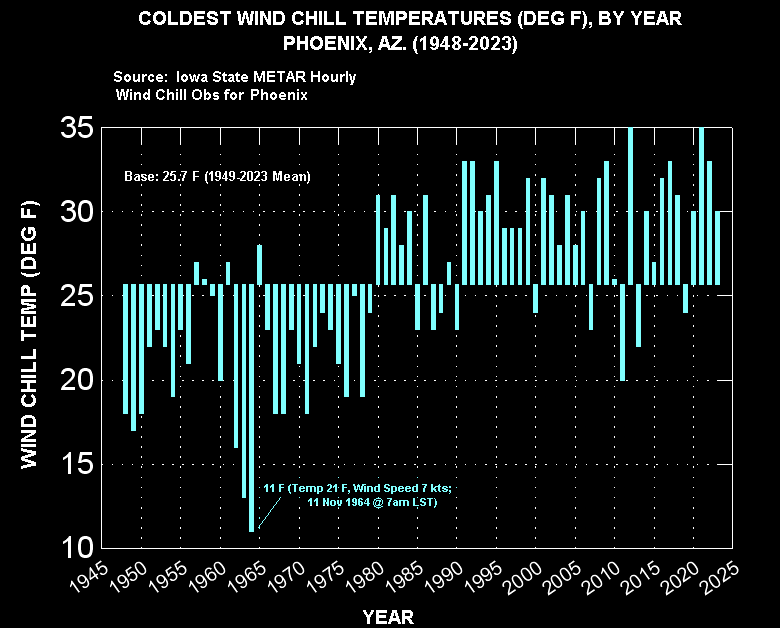
- Downtown Phoenix Annual Minimum Wind Chill Temperatures (1948-2023) NewNew (9/3/23)
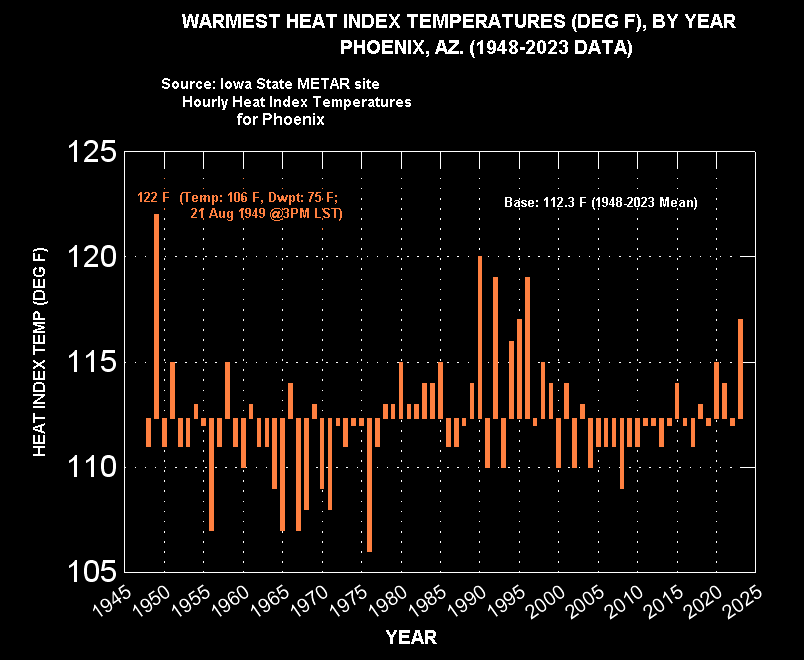
- Downtown Phoenix Annual Maximum Heat Index Temperatures (1948-2023) NewNew (9/3/23)
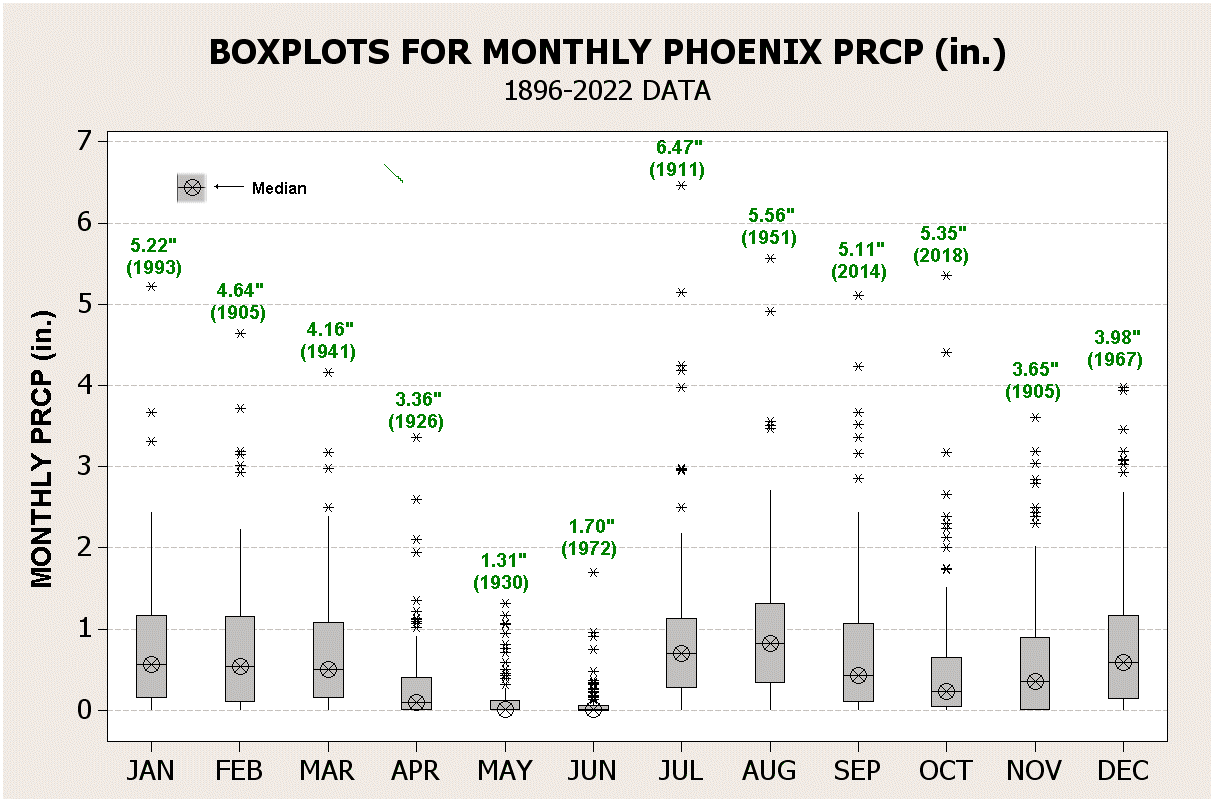
- Boxplot of Phoenix Monthly Precipitation Distributions (1896-2022)
Climograms for Phoenix (Based on Data from 1973 On)
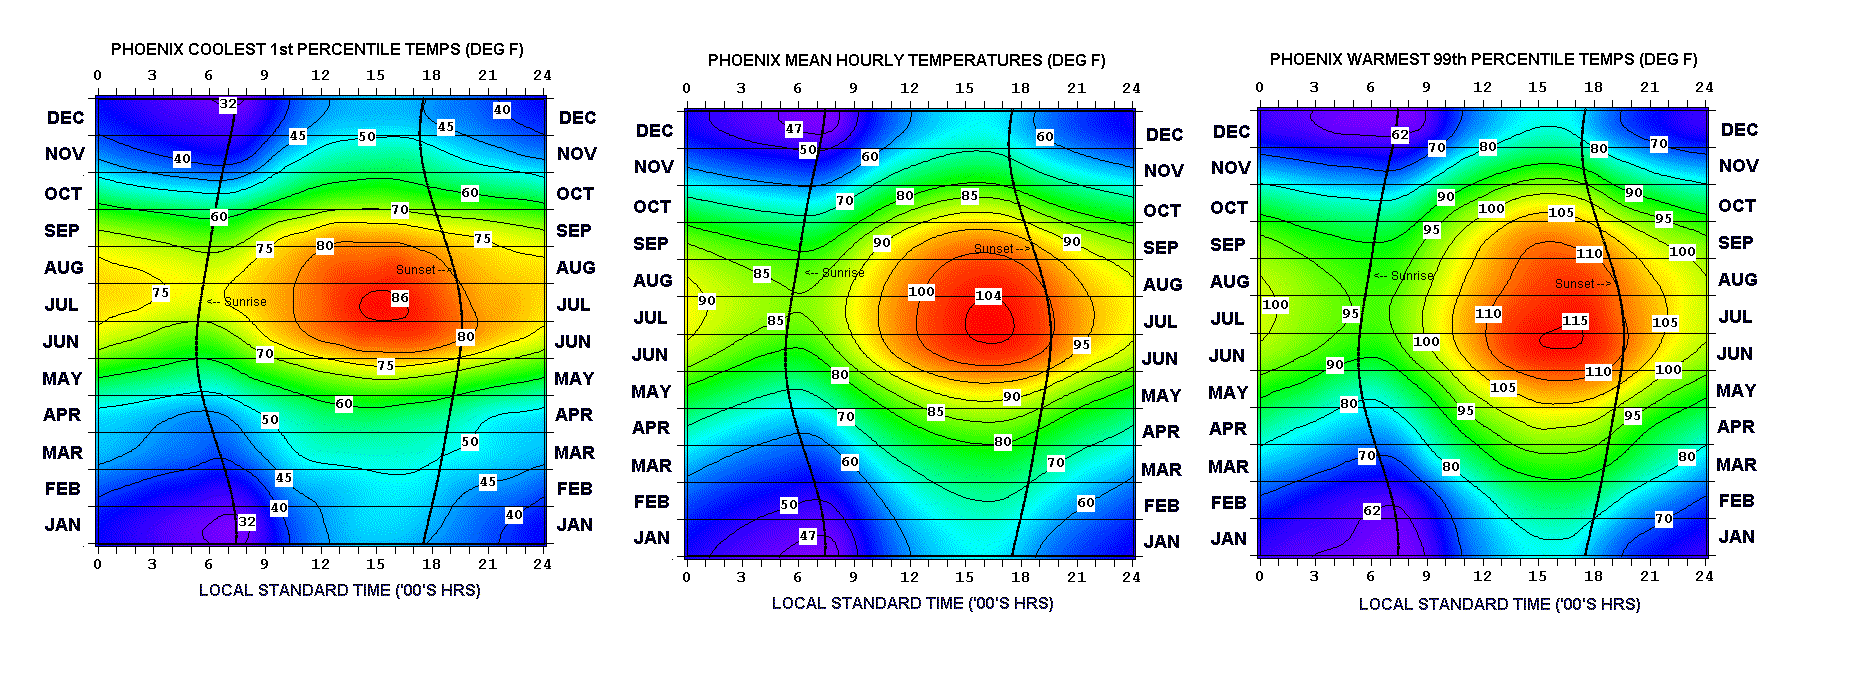
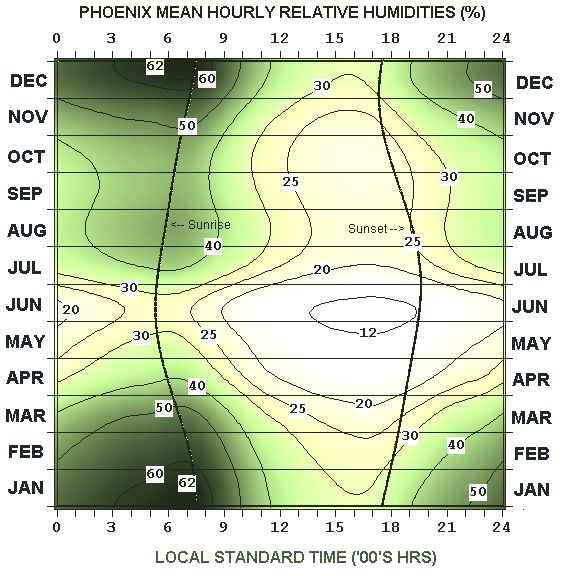
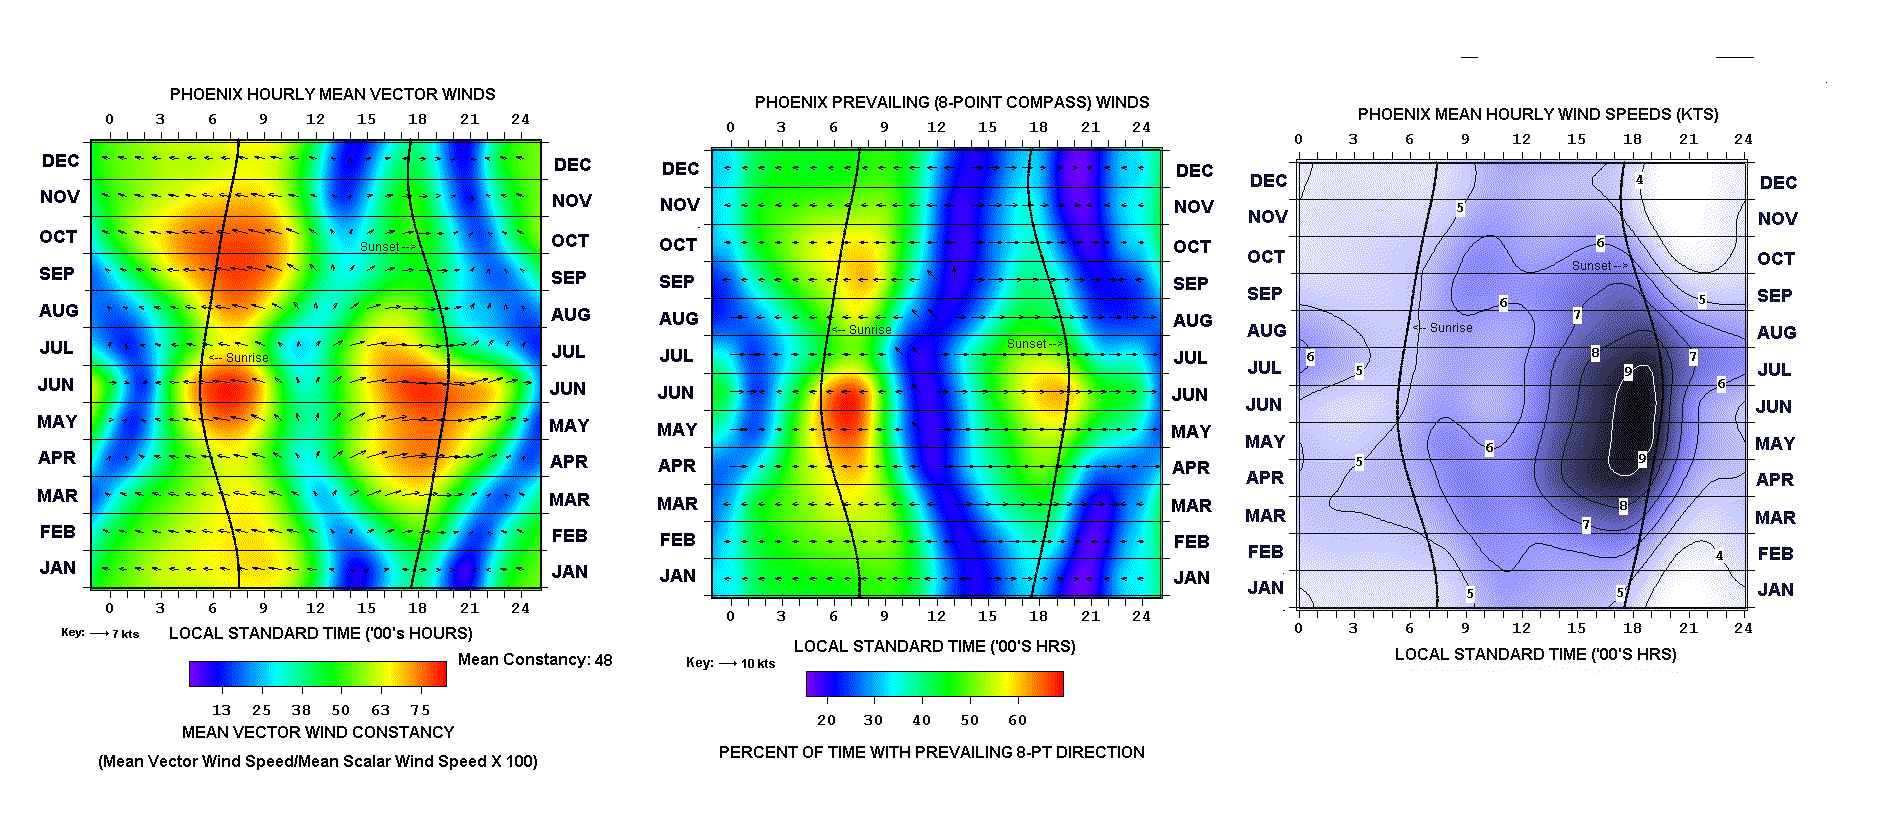
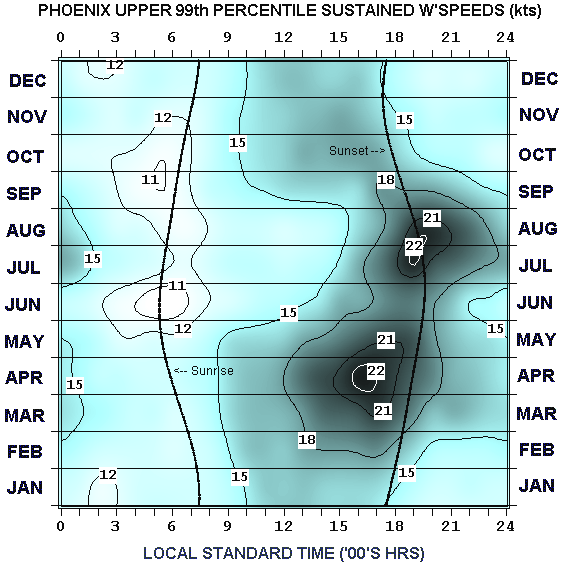
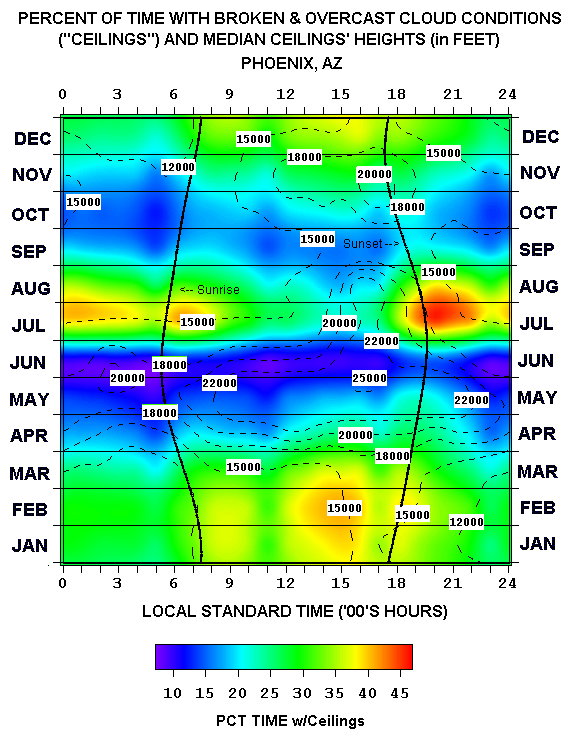
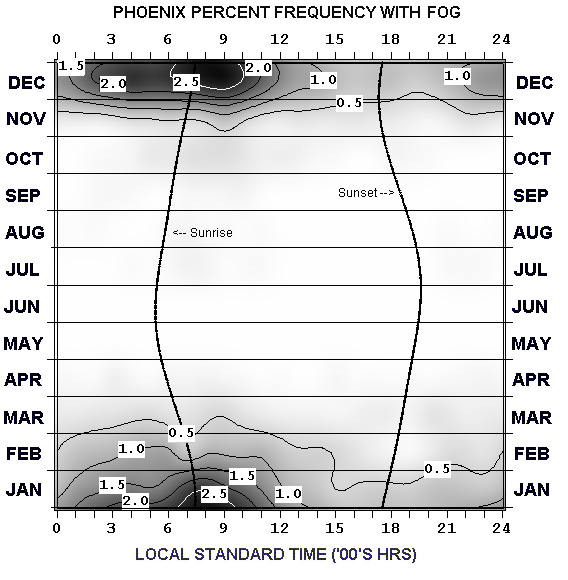
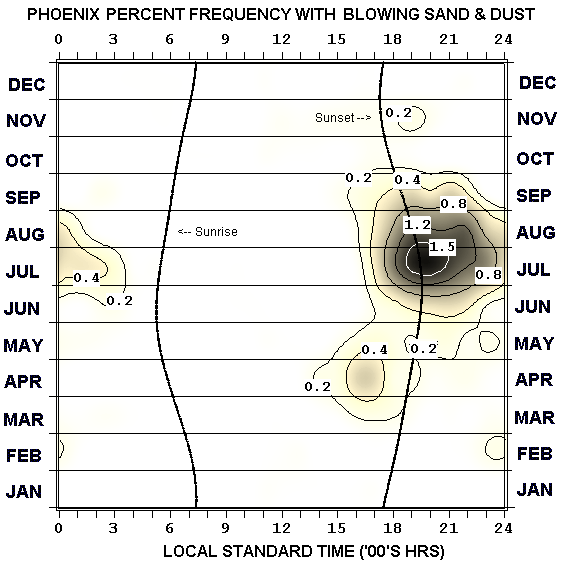
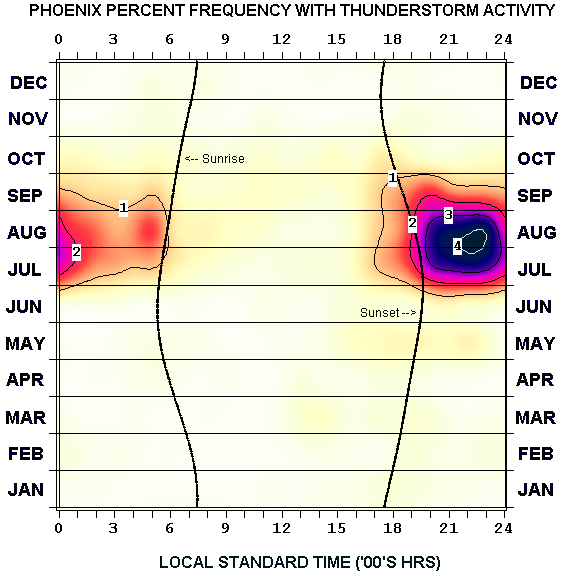
Other Summary Climate Charts:
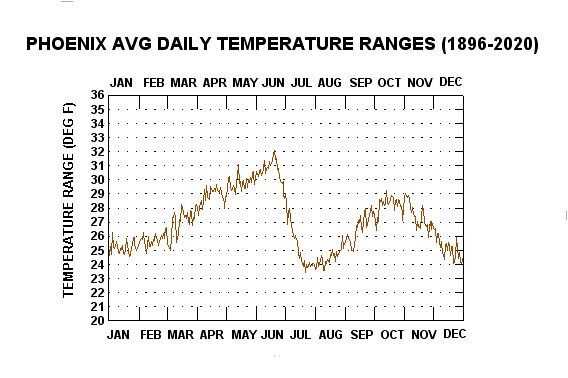
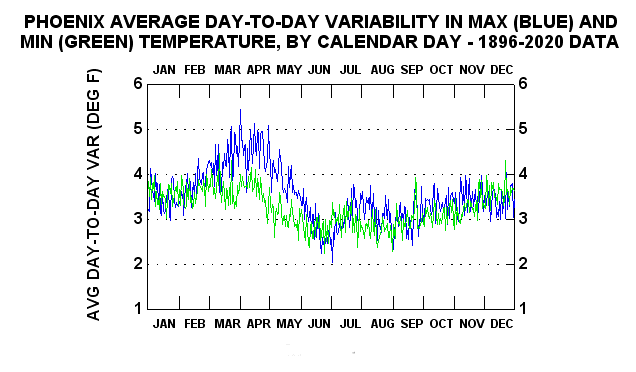
Year-To-Year Graphs - Interpretation
The uppermost chart for a given year’s page (accessed by the links below) are “floating-bars” of the year's daily maxima and minima temperatures. Superimposed on the bars are two line traces, the upper one connecting long-term (1896-2020) mean daily maxima, the lower one mean daily minima.
The second chart down shows the day-to-day mean temperature anomalies (daily mean temperature less the corresponding long-term 1896-2020 climatological mean). Departures extending upward in red from the zero line depict above average means for the day, those extending downward in blue indicate below average anomalies. Reflecting the warming temperature trend that Phoenix has experienced, since the 1970's , daily mean temperature anomalies have become progressively more "red", some of the most recent years almost exclusively so on an individual daily basis.
(Note: Clicking on the floating-bar charts a second time after they appear on the screen will enlarge them further).
Year-To-Year Graphs — OLDER YEARS
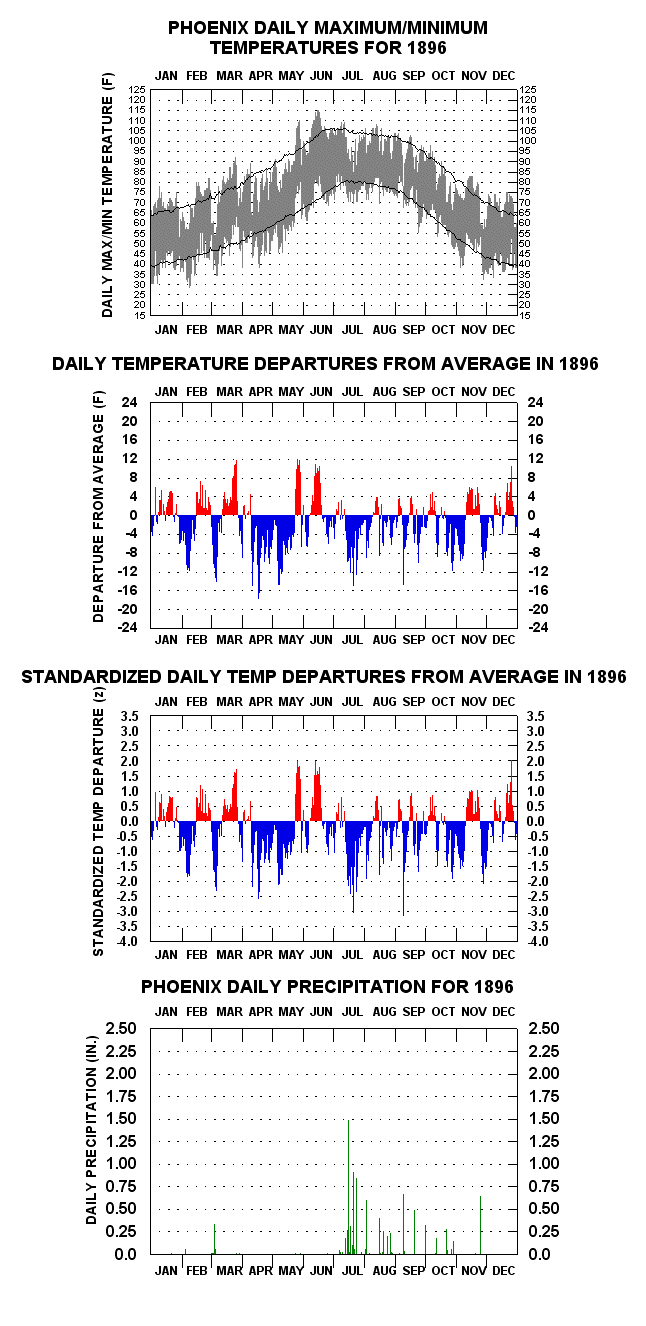
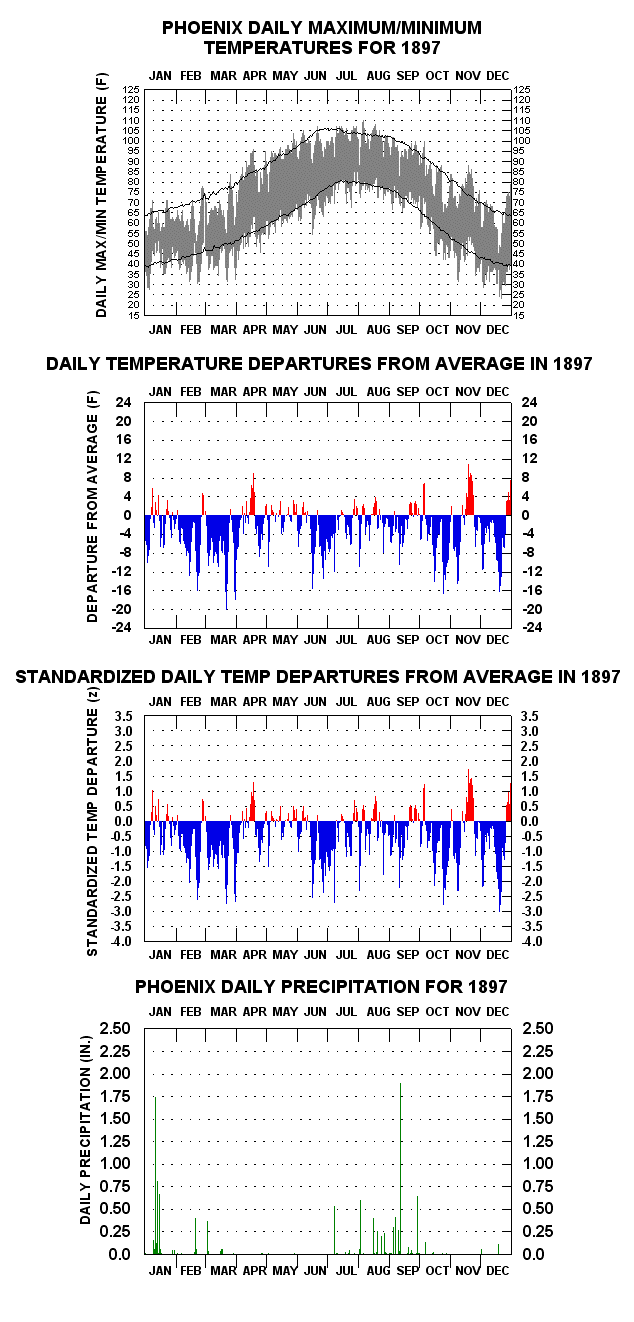
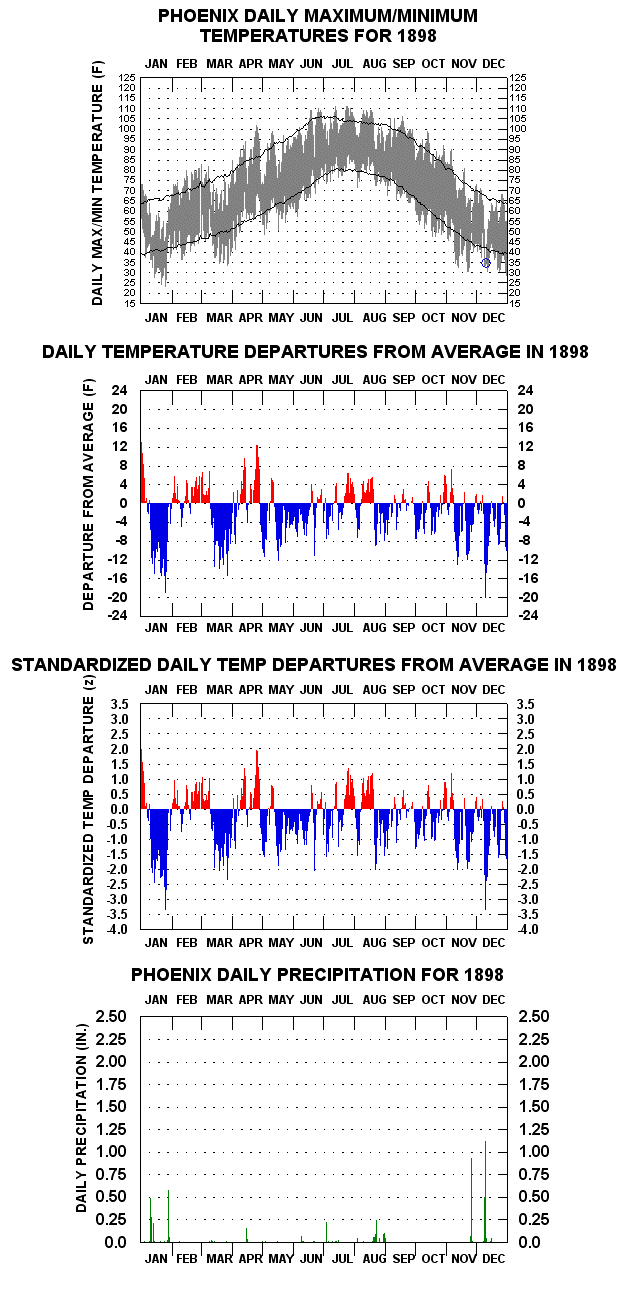
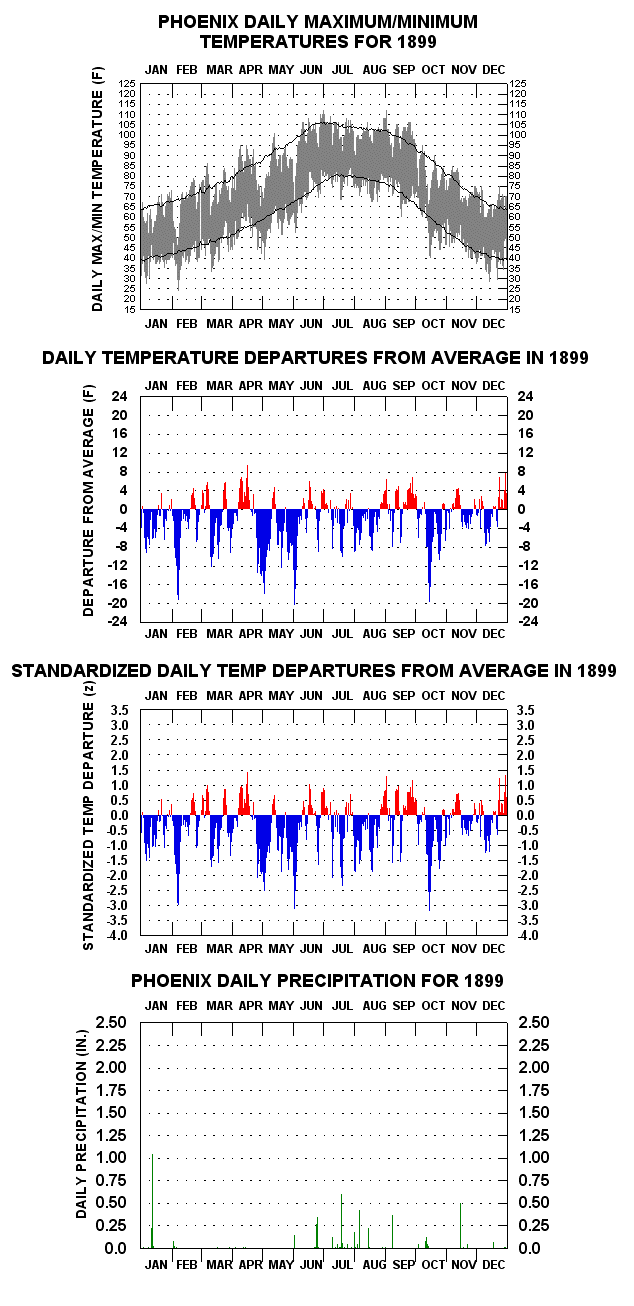
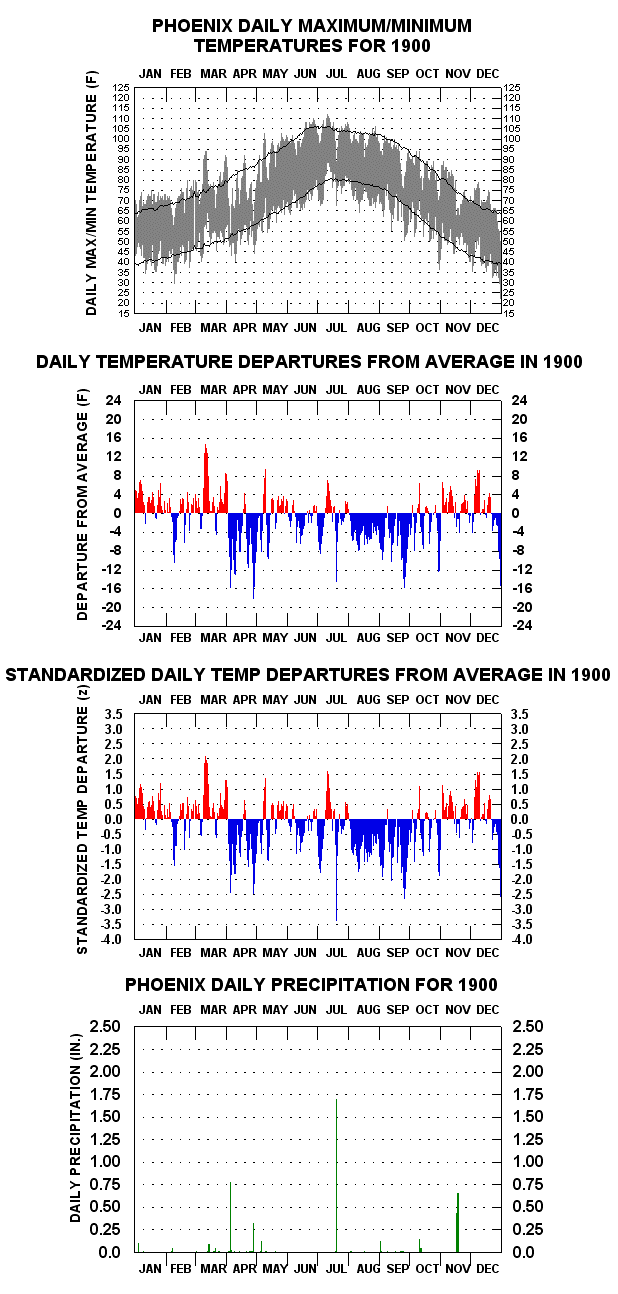
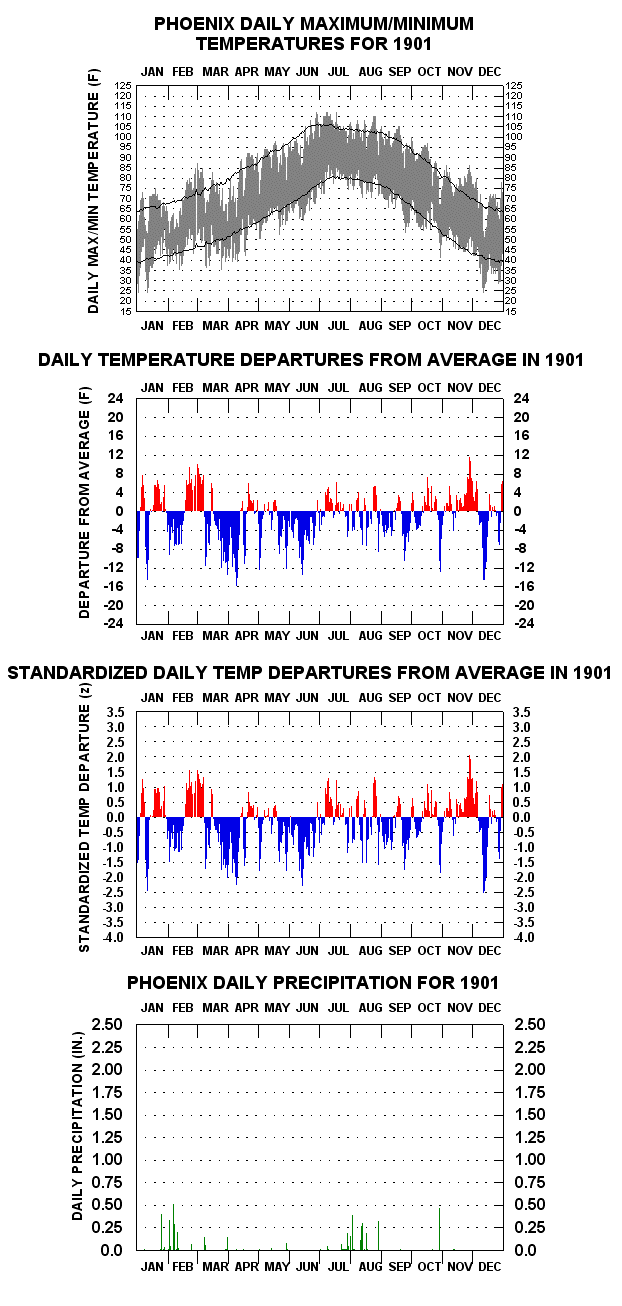
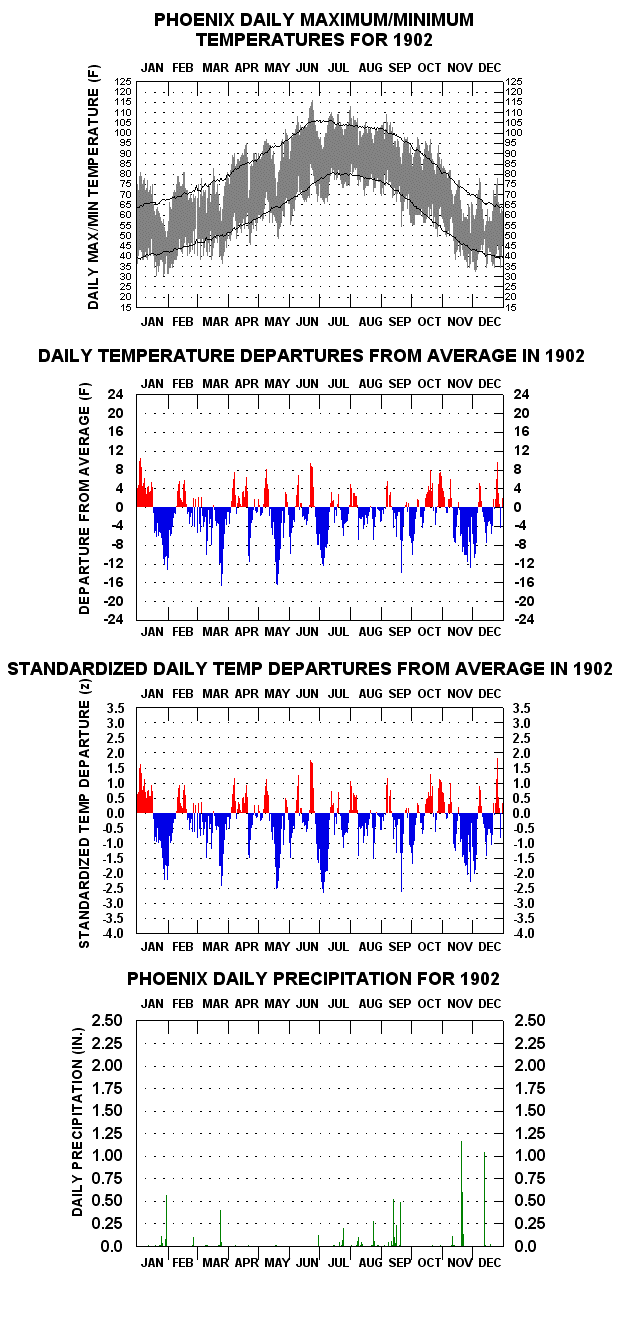
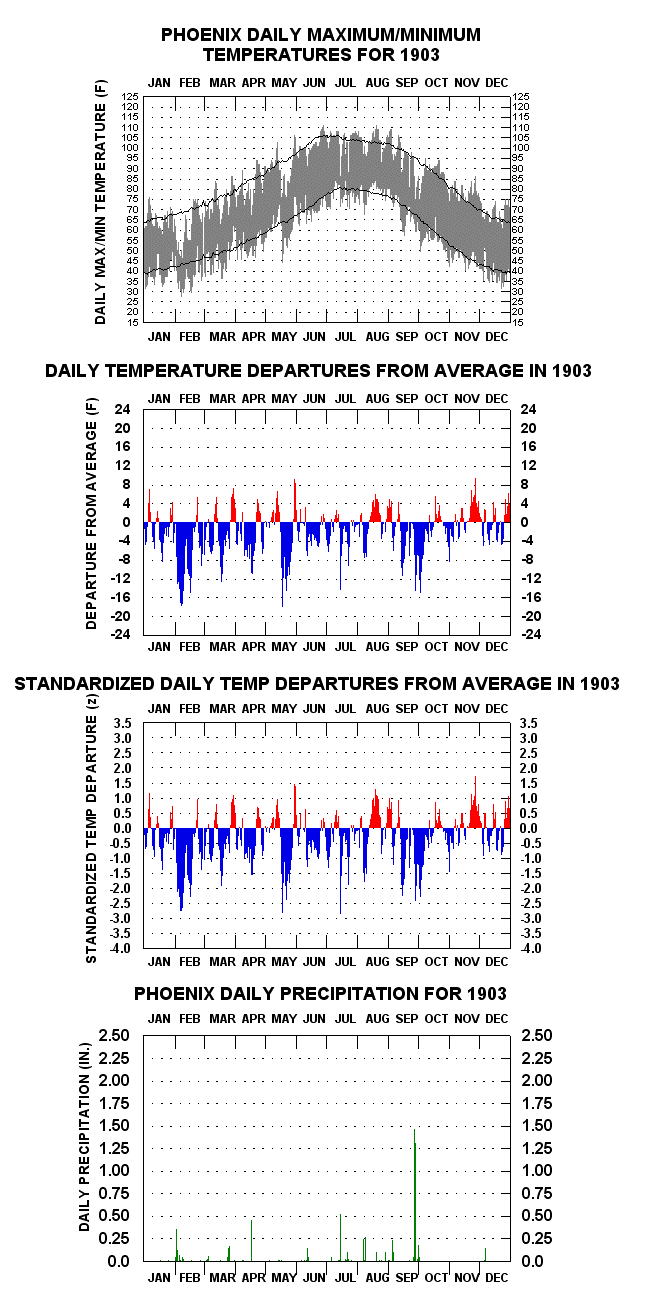
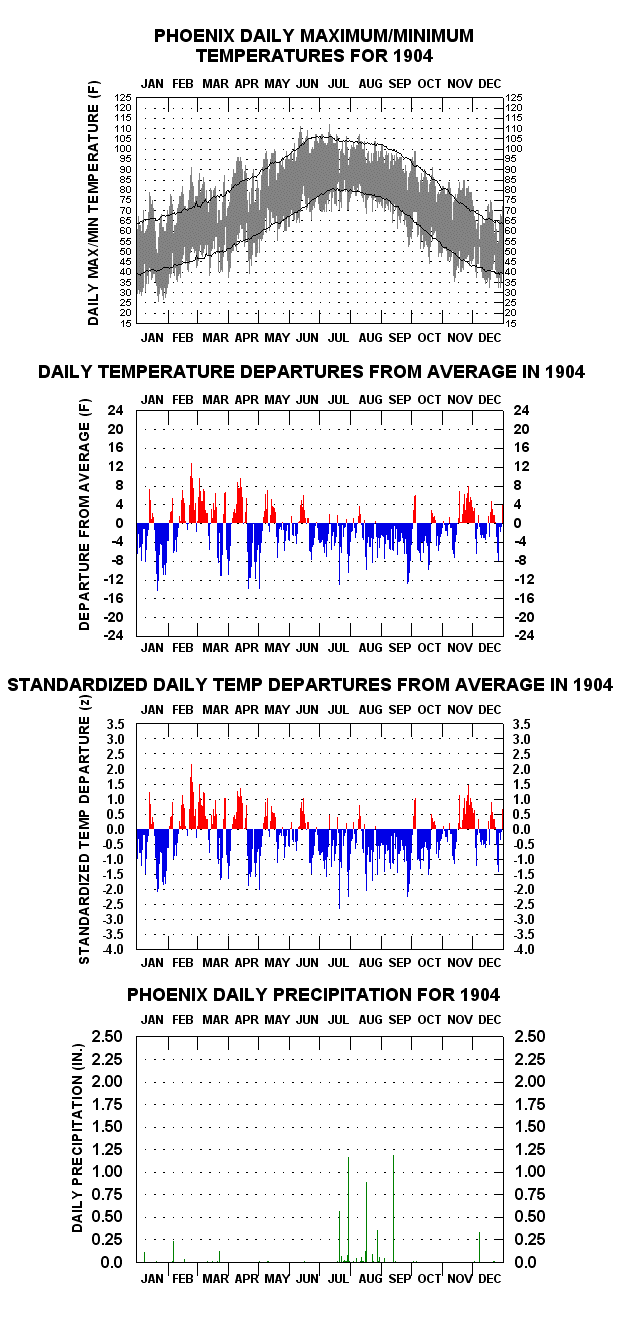
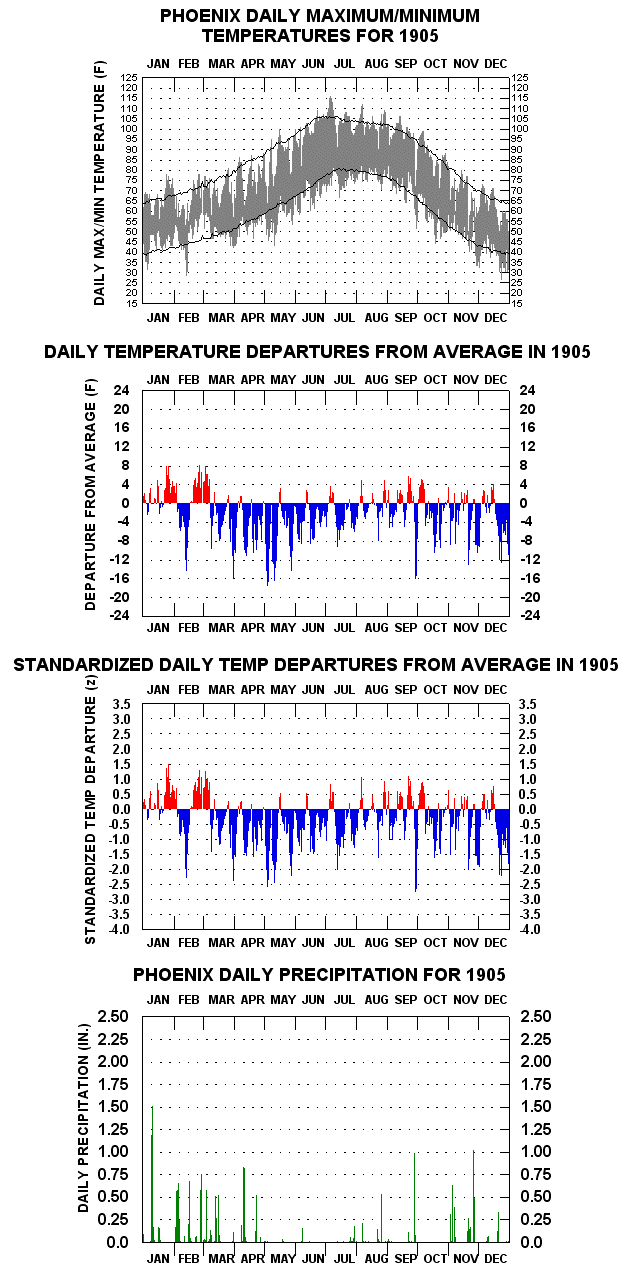
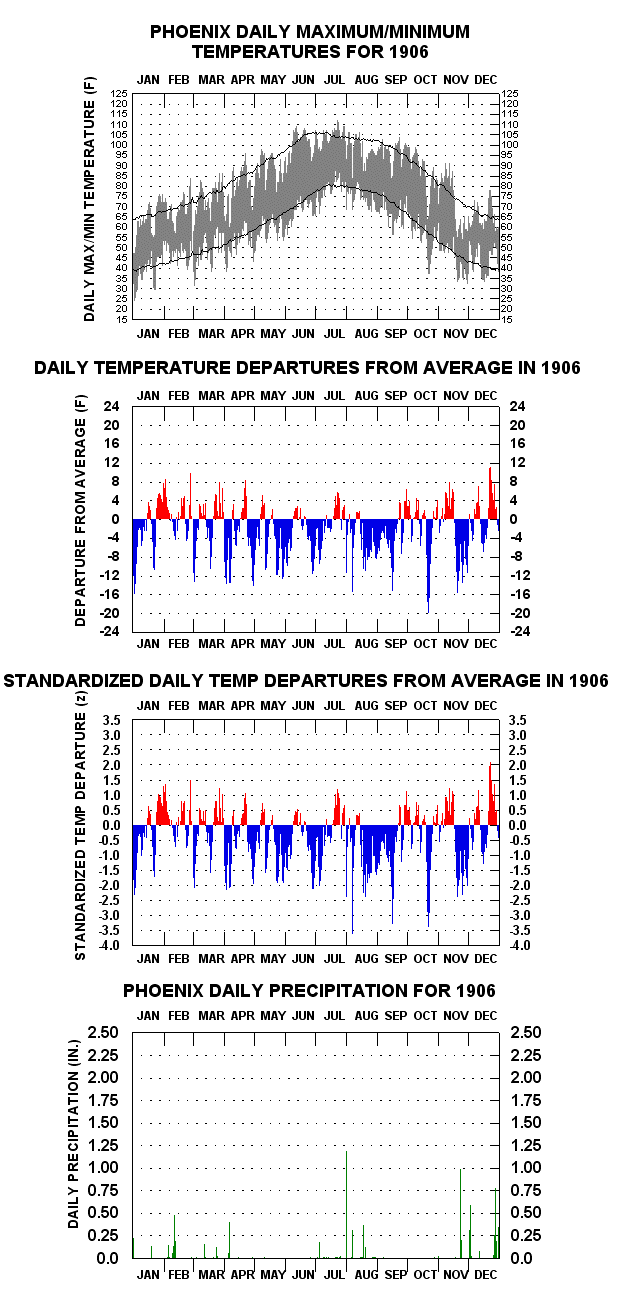
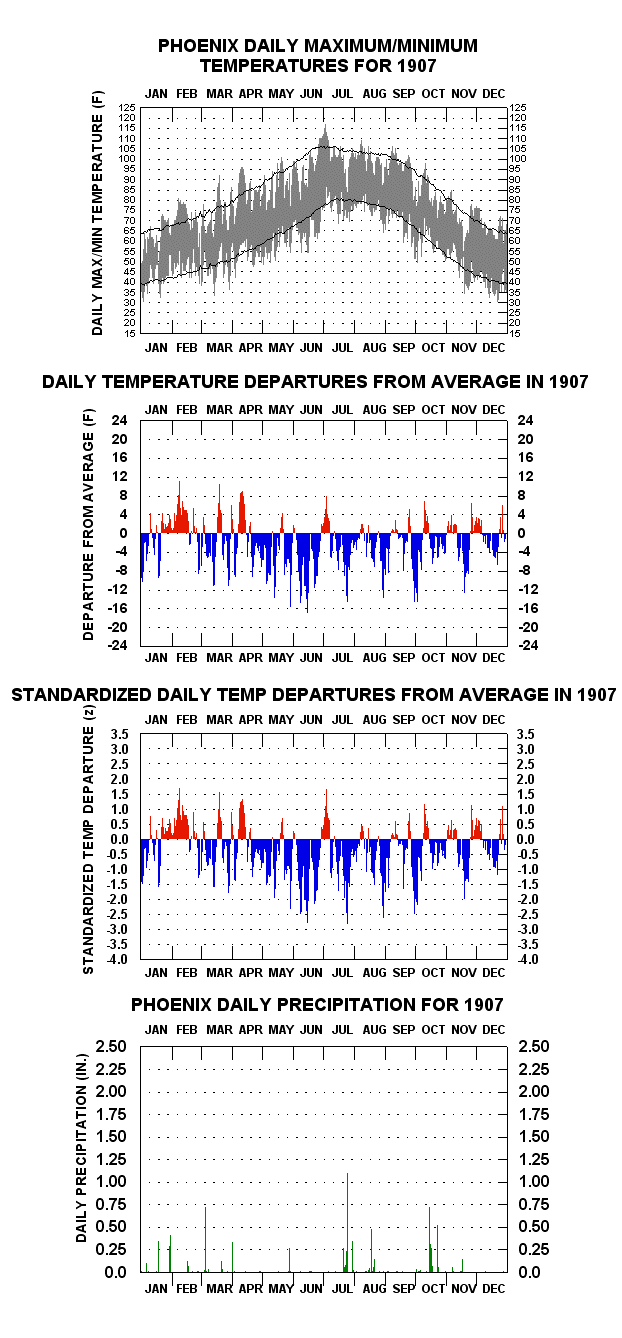
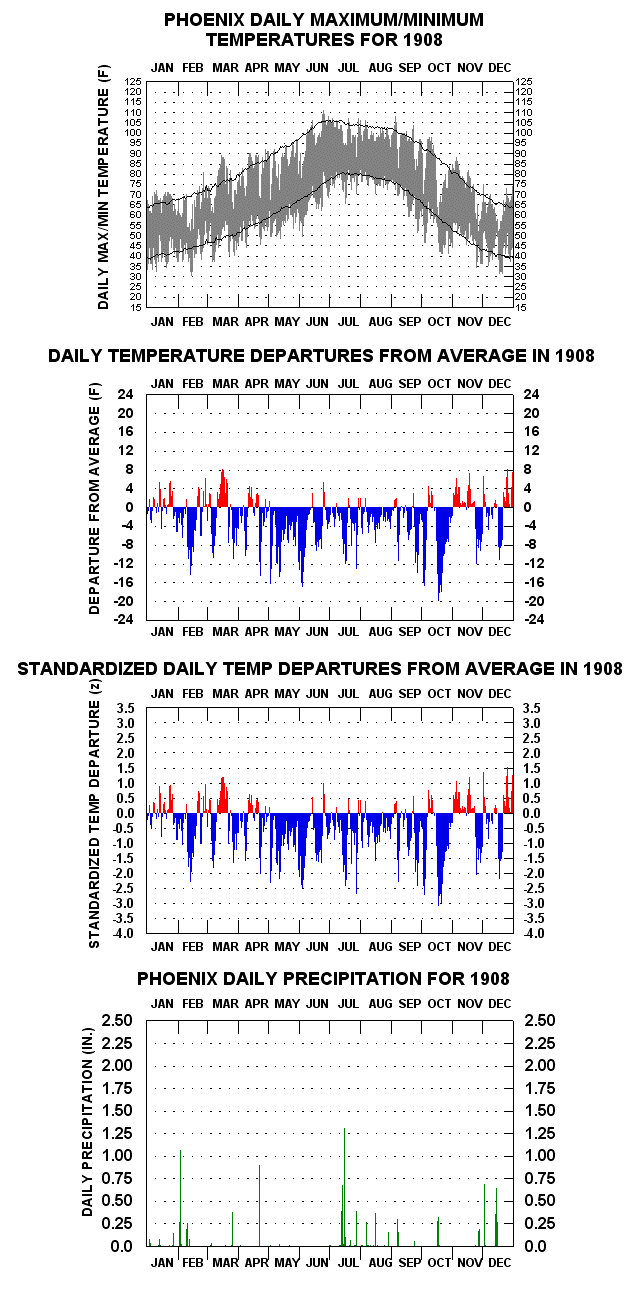
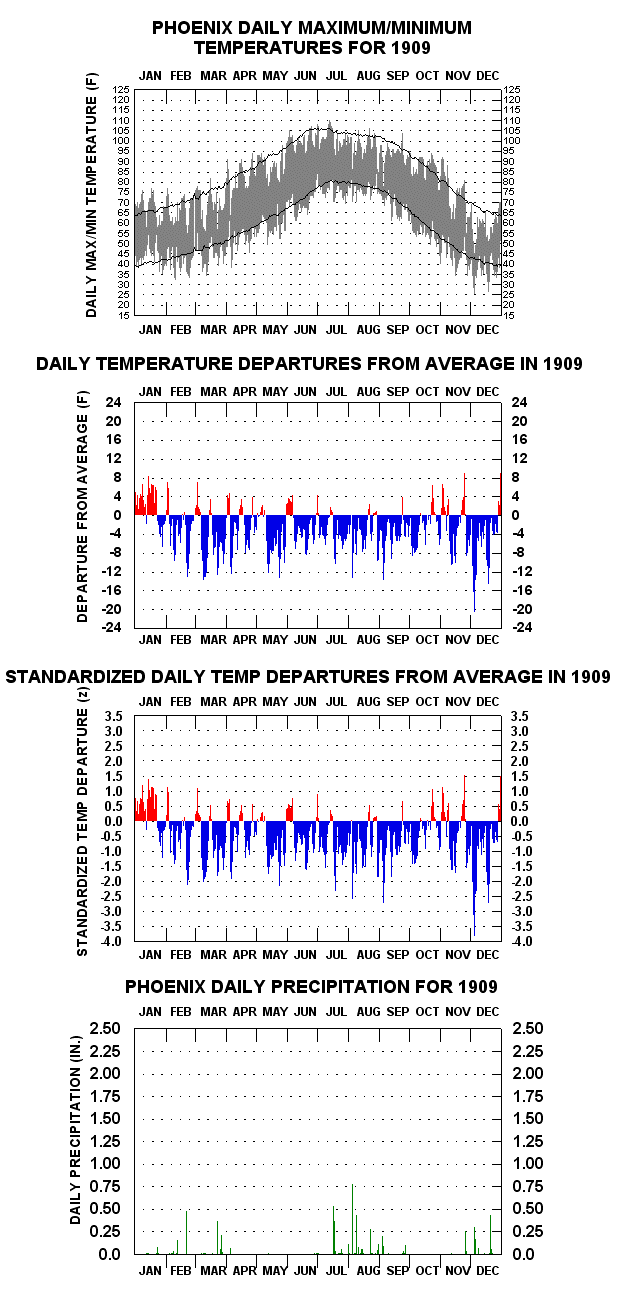
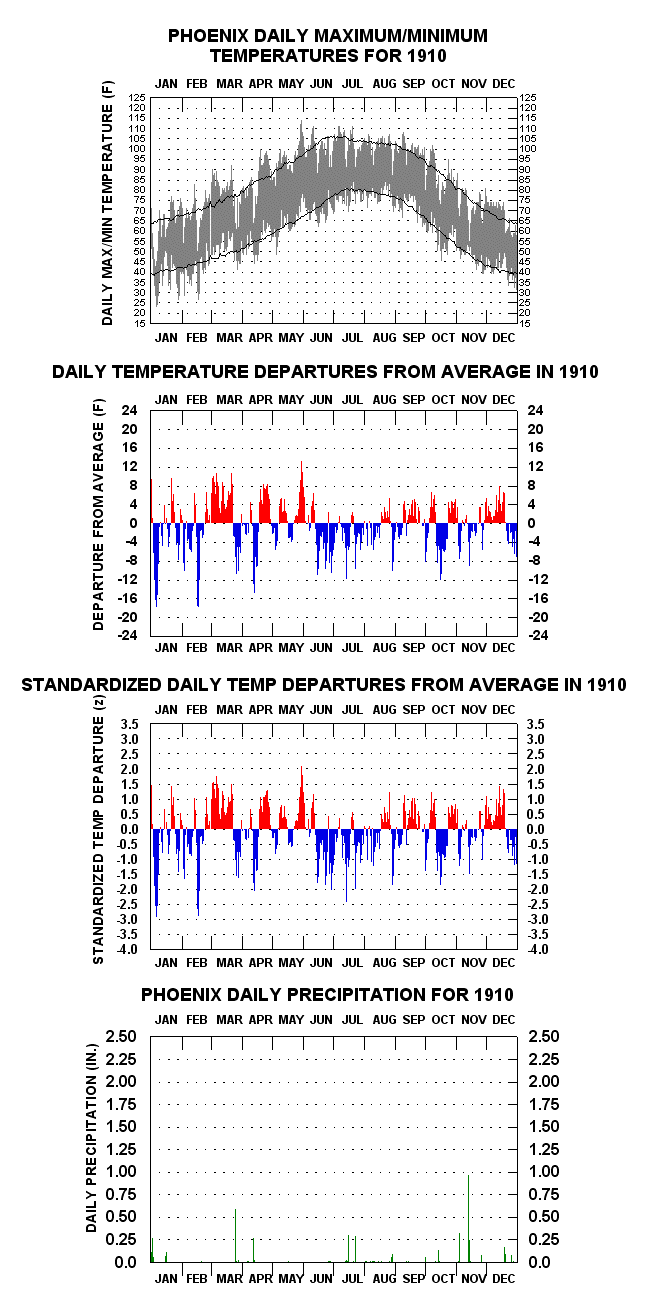
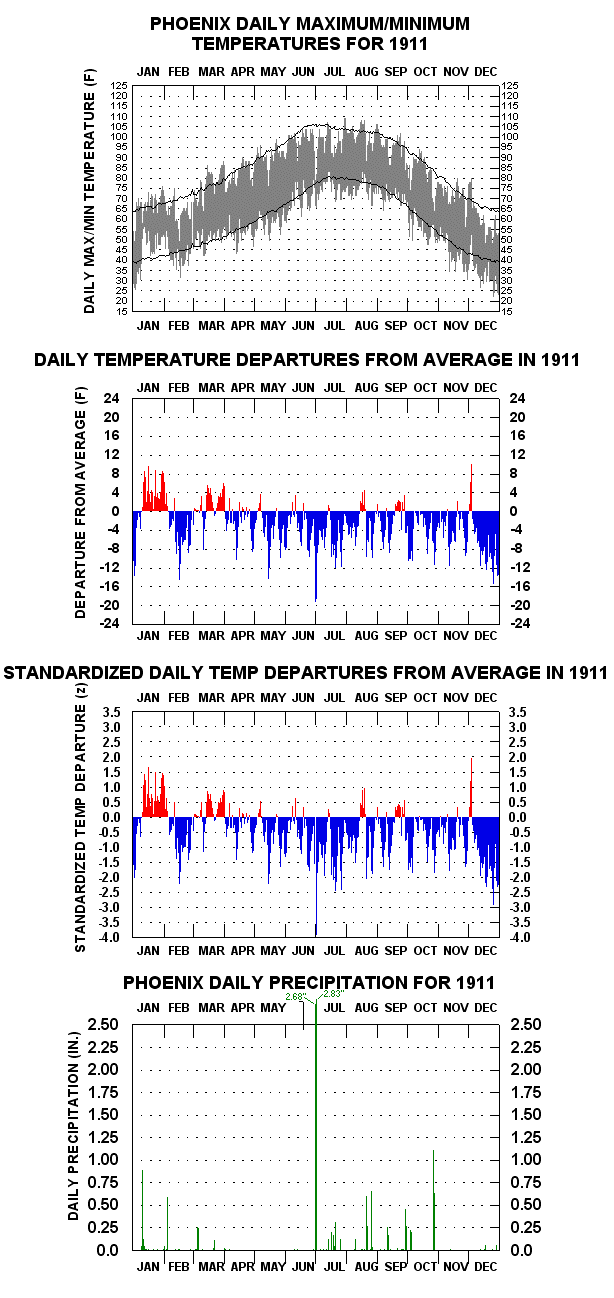
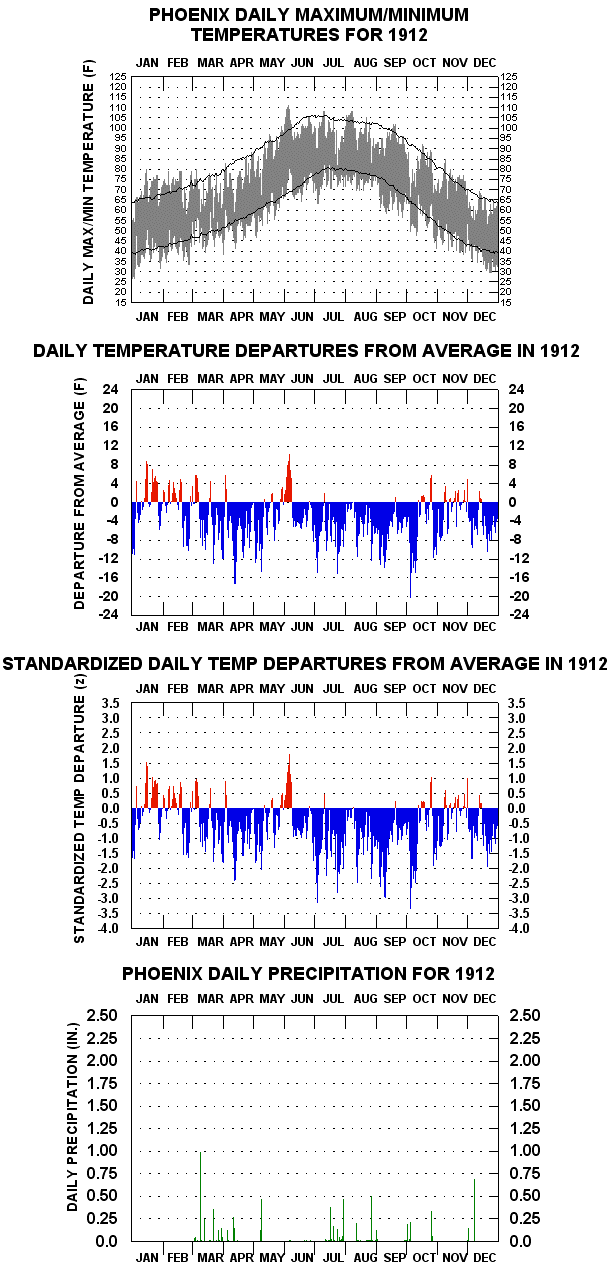
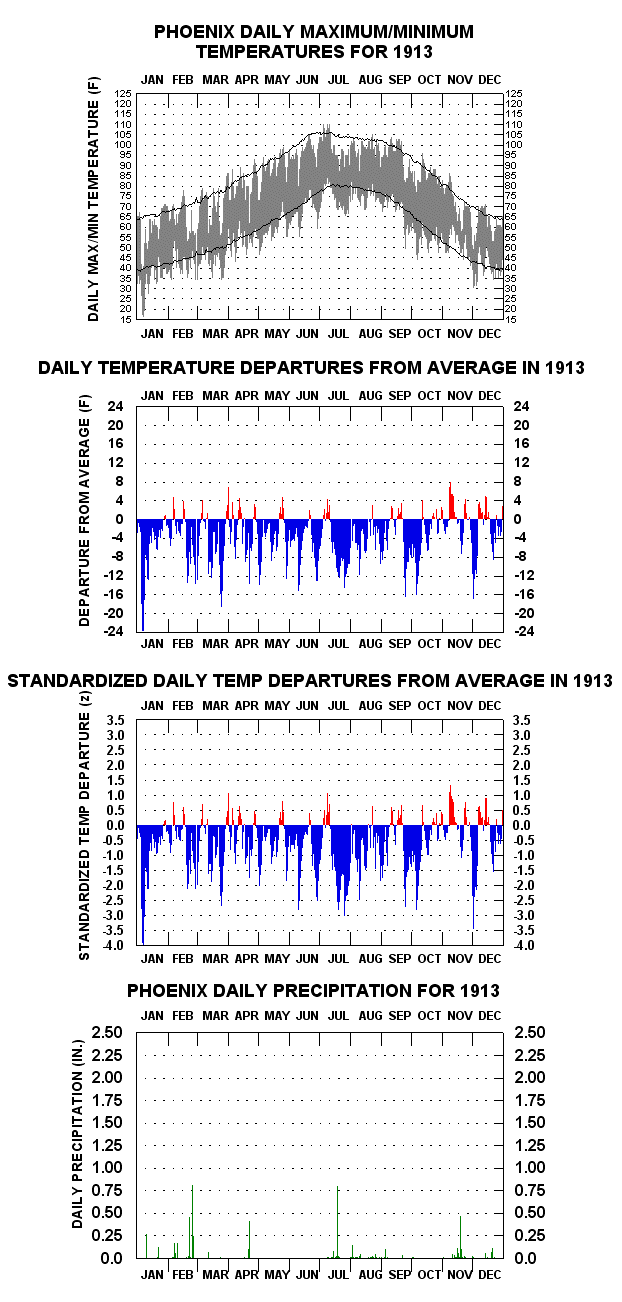
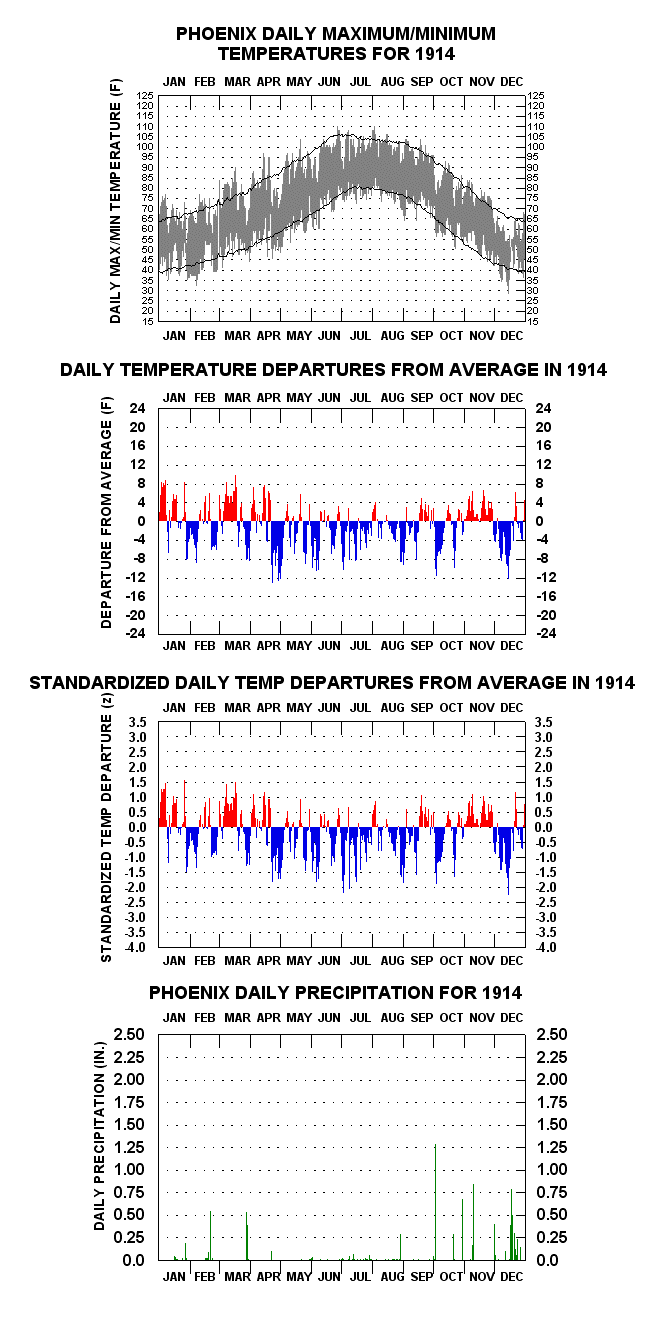
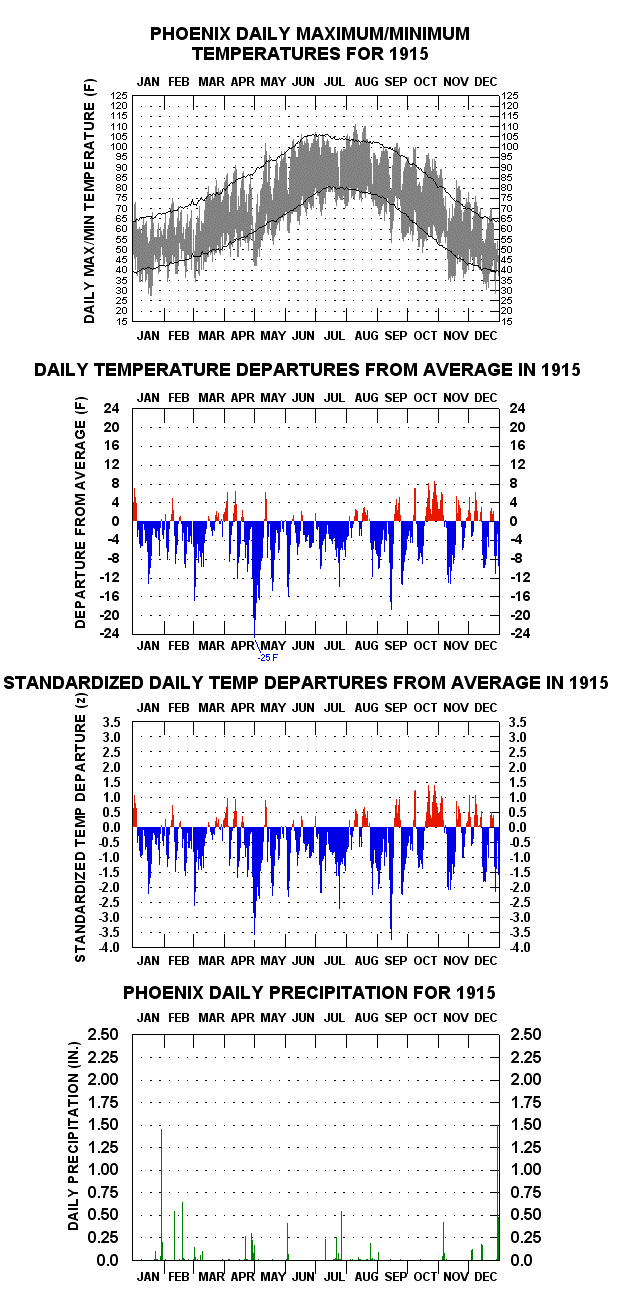
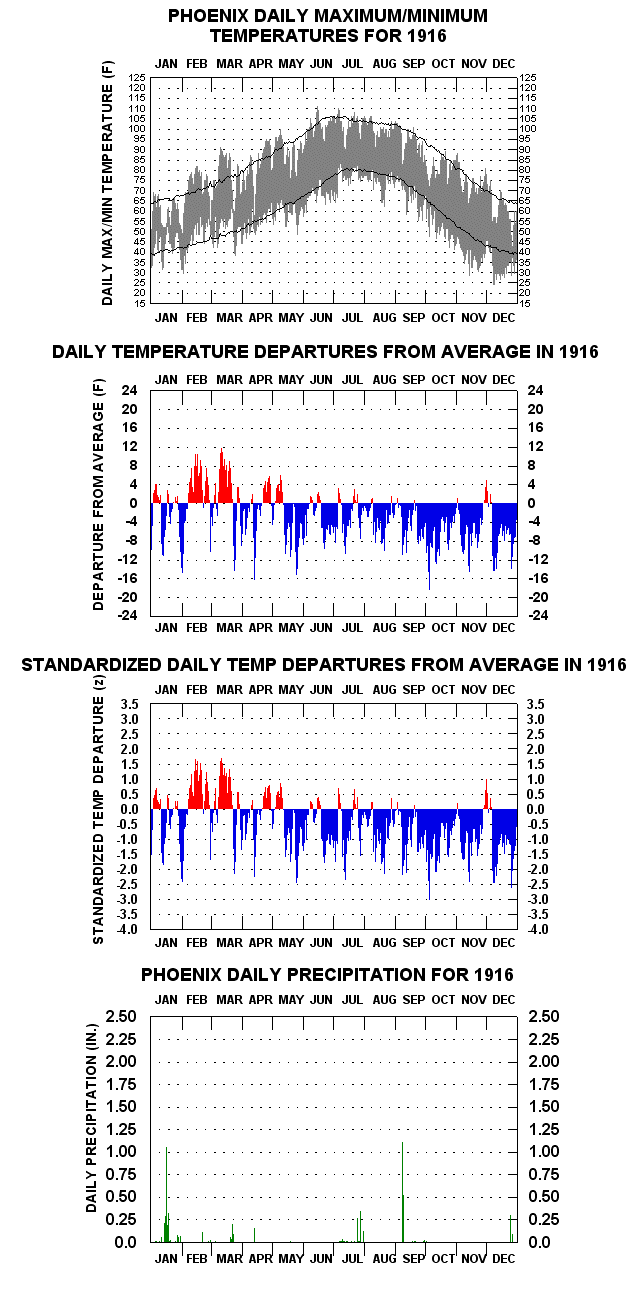
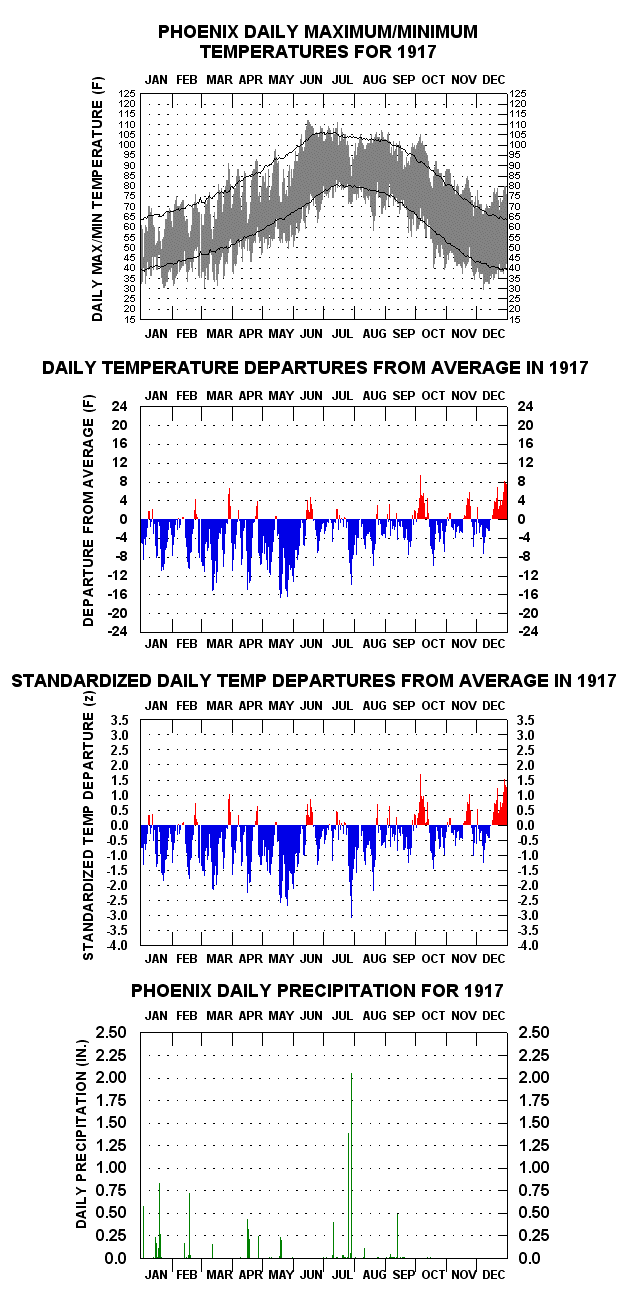
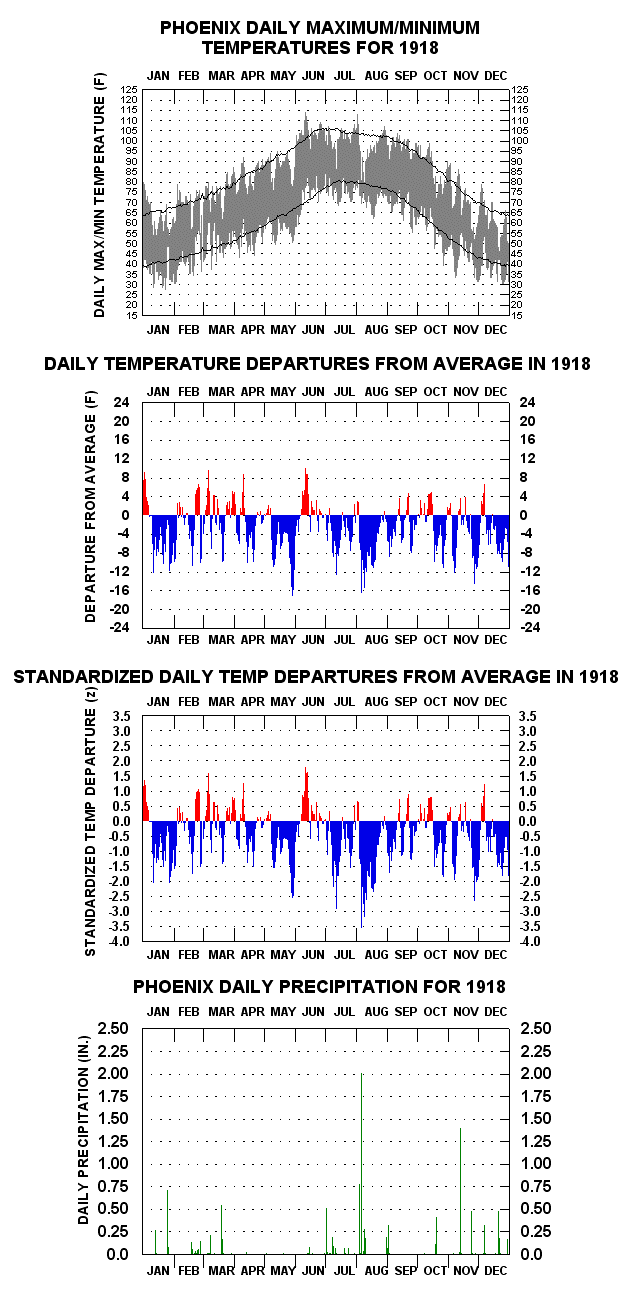
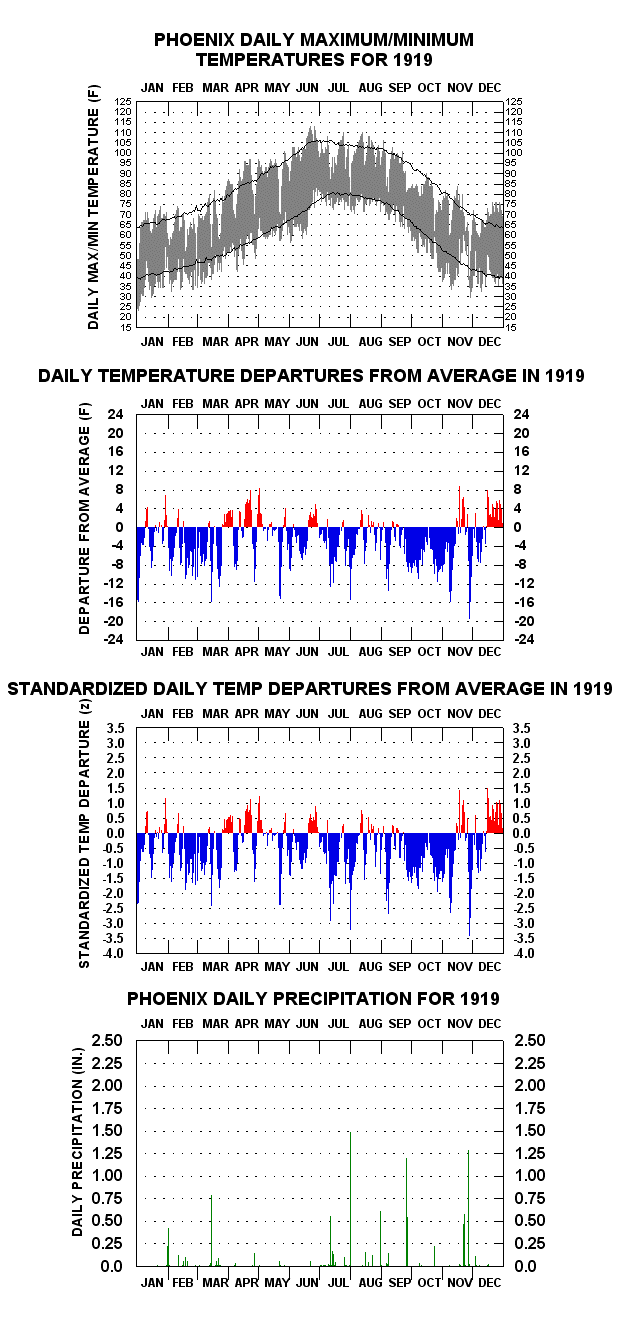
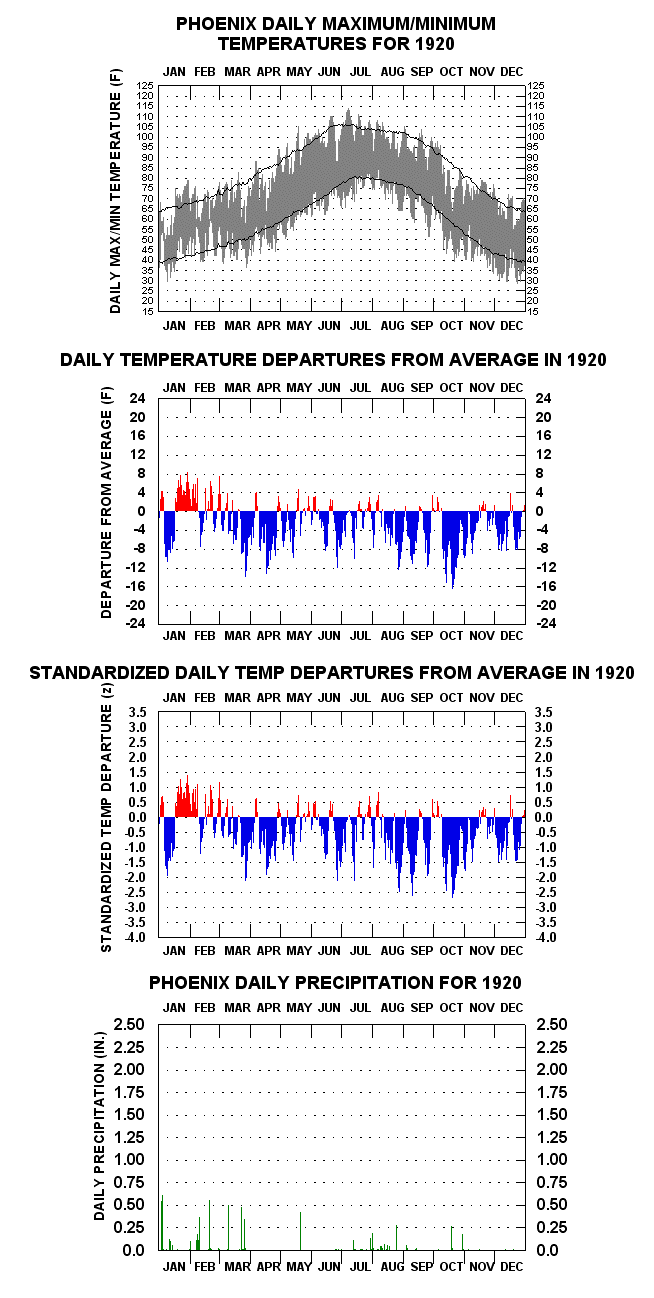
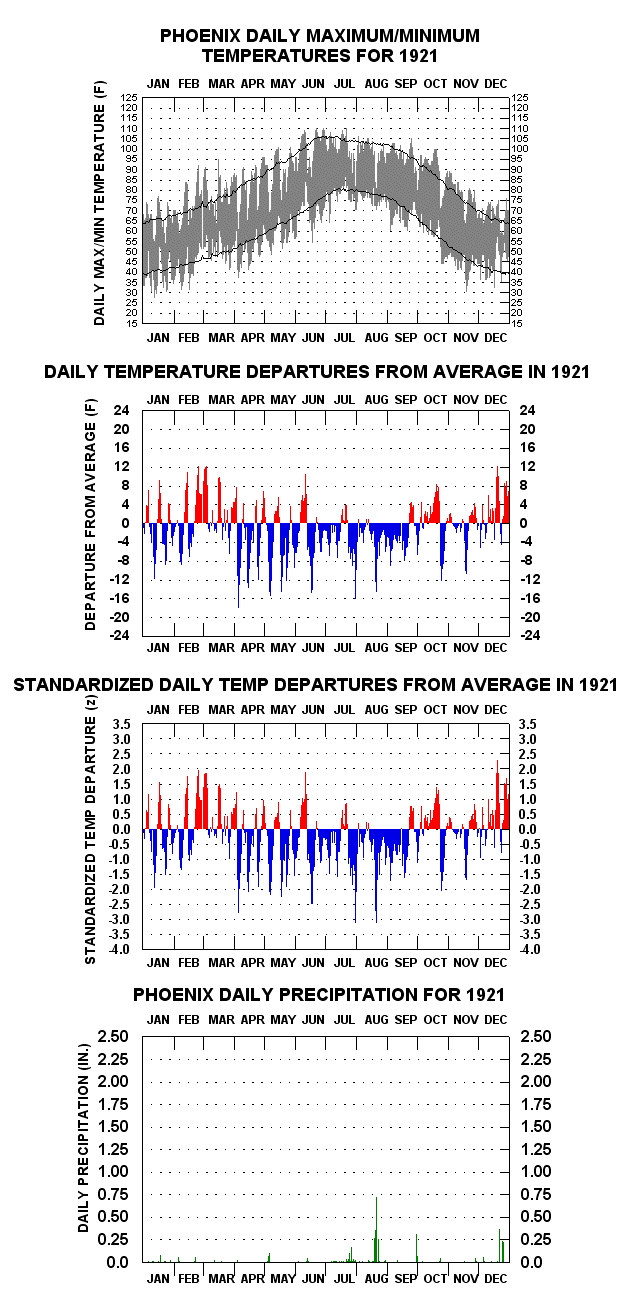
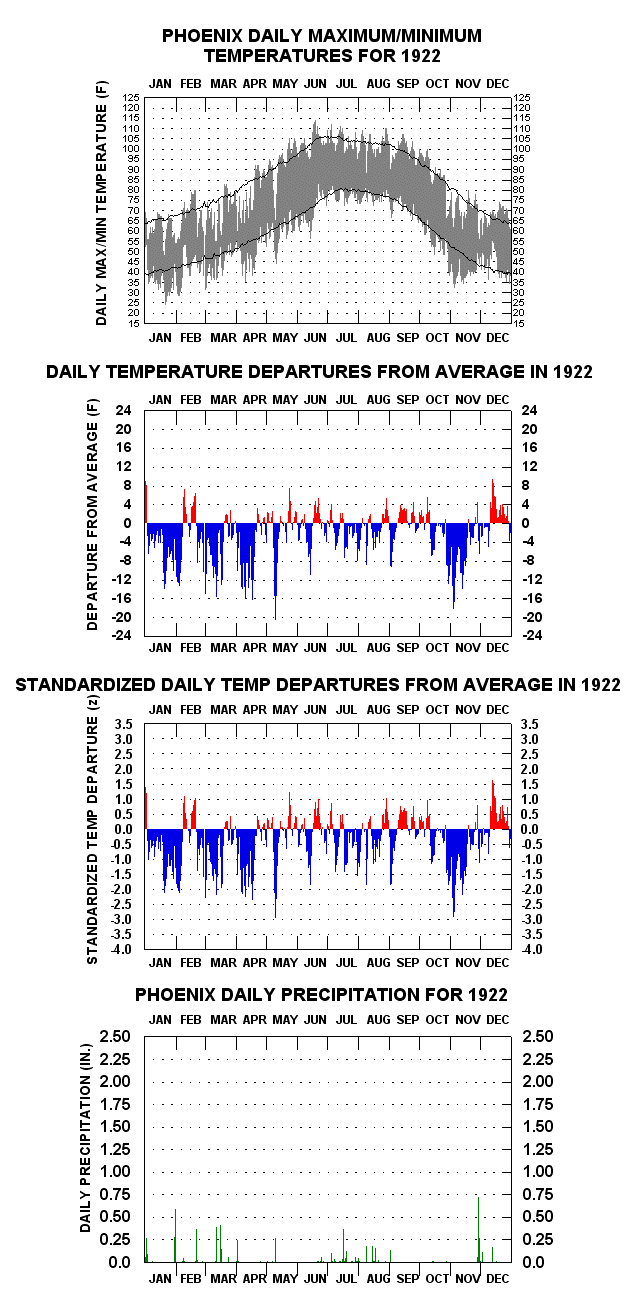
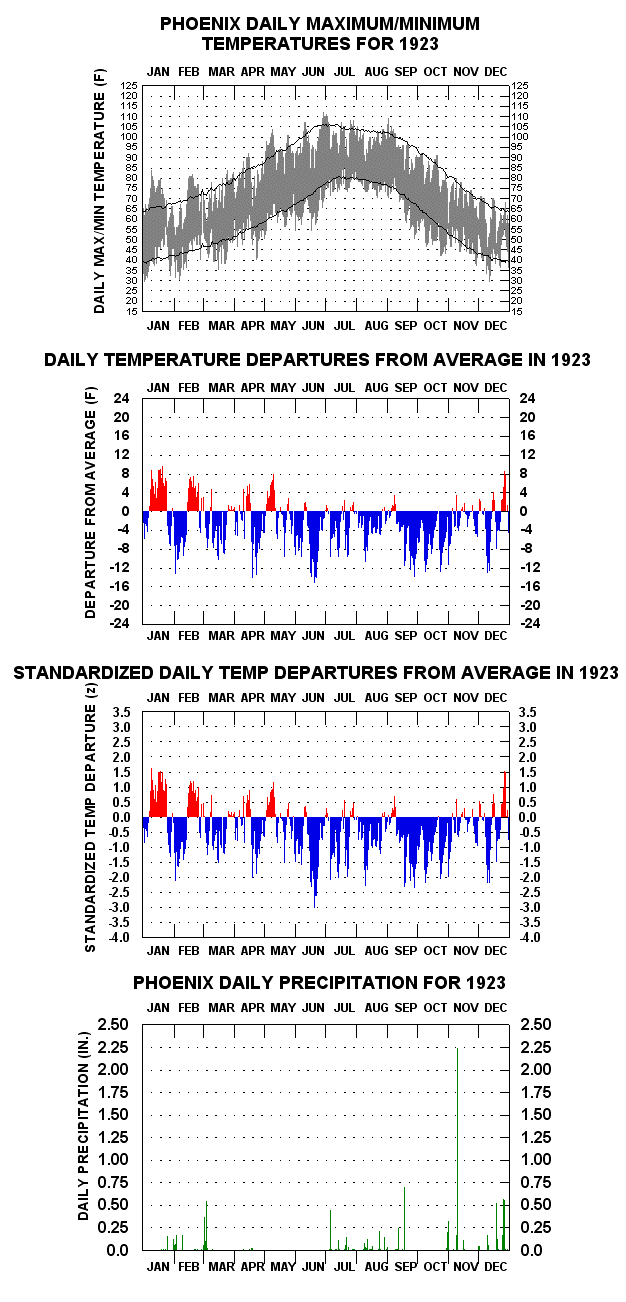
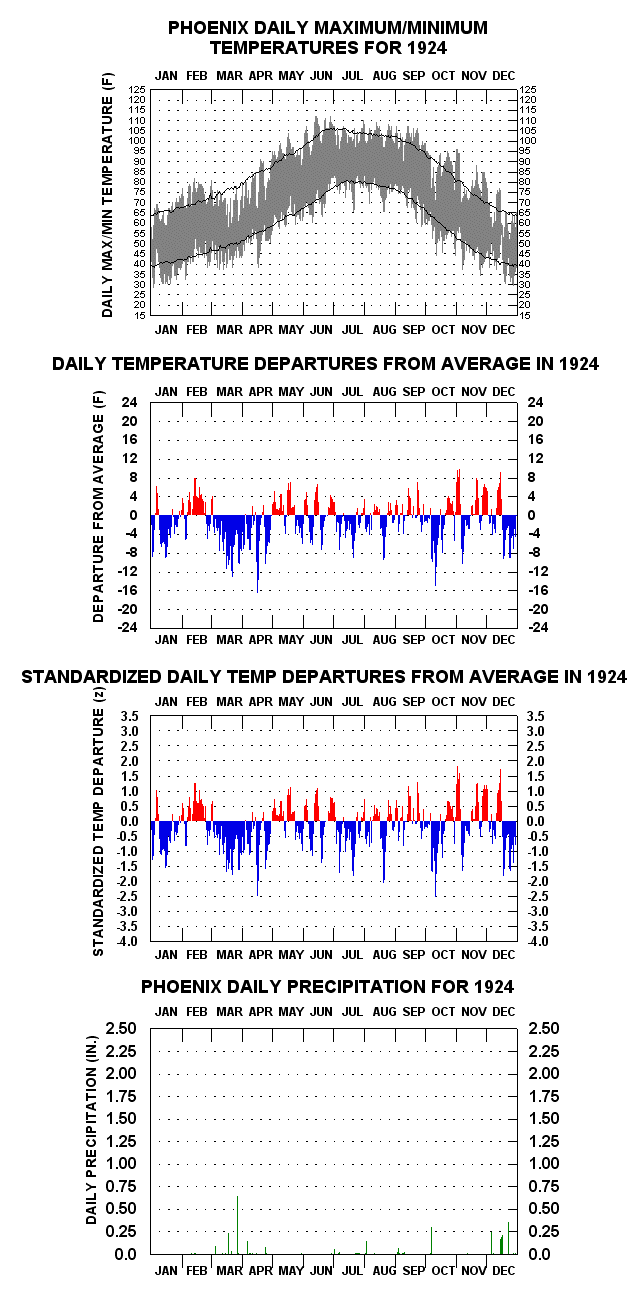
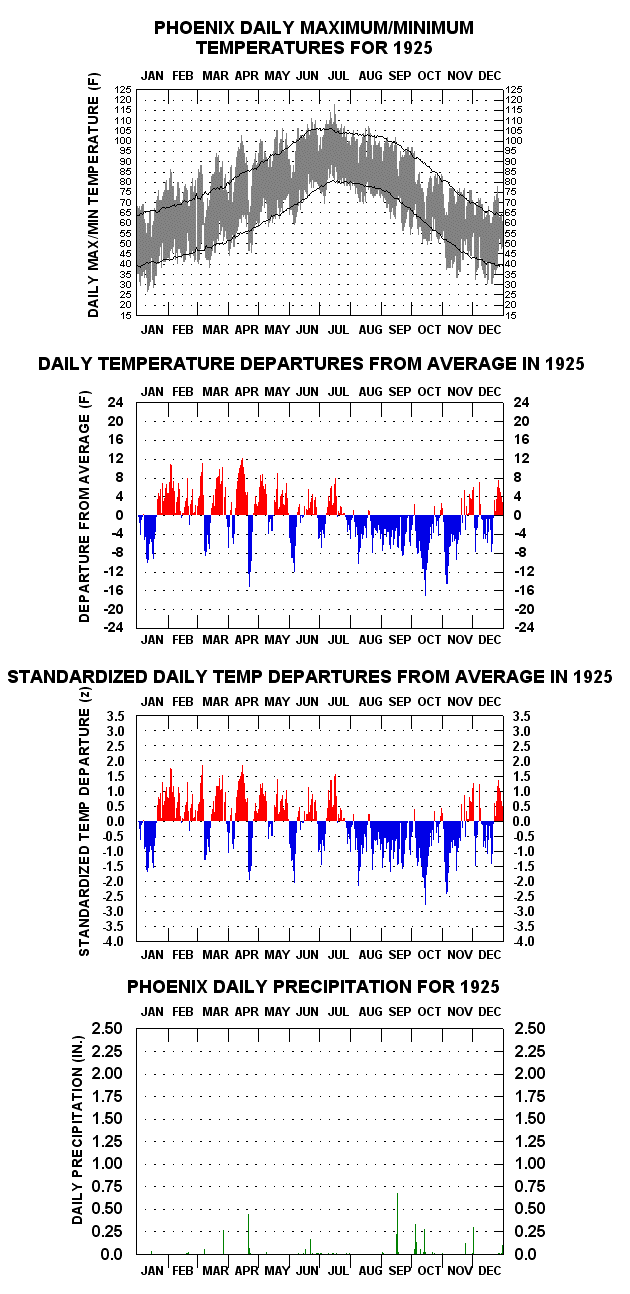
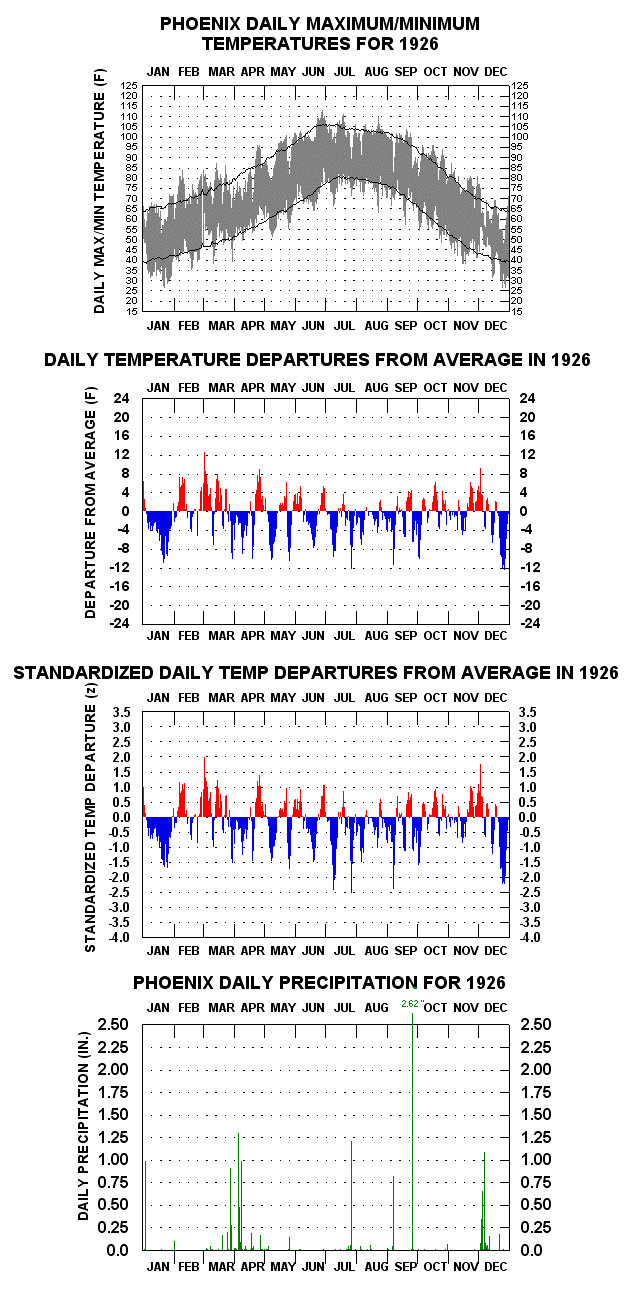
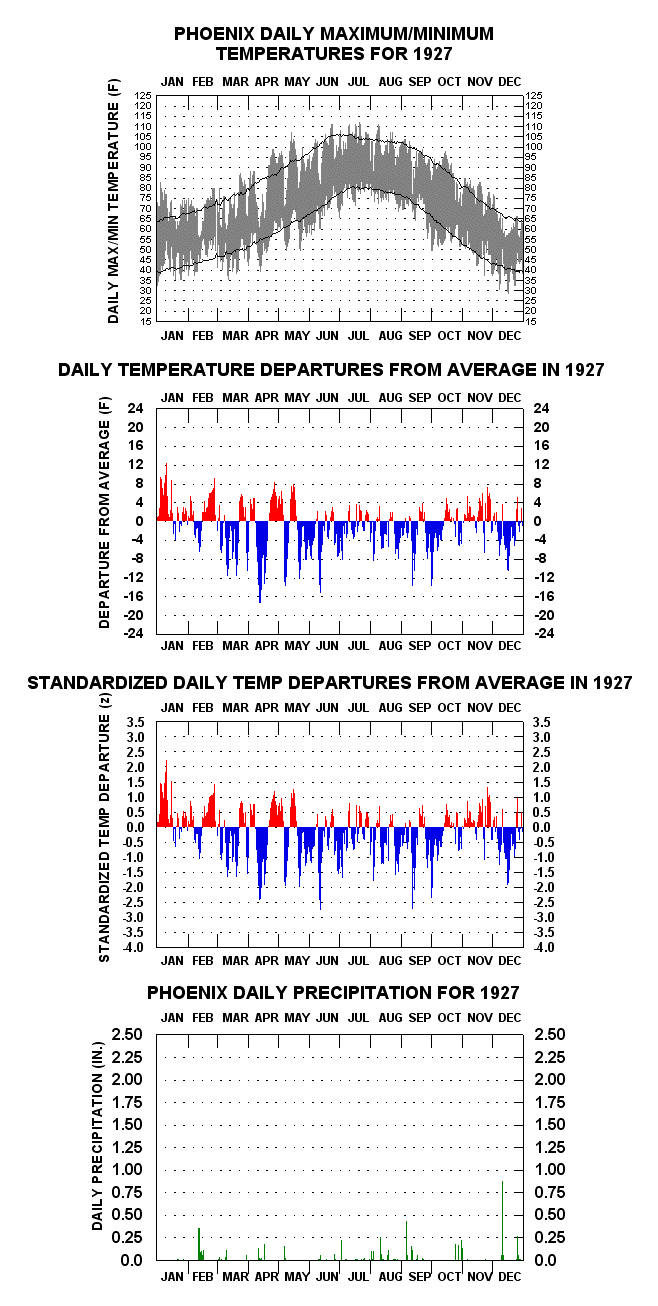
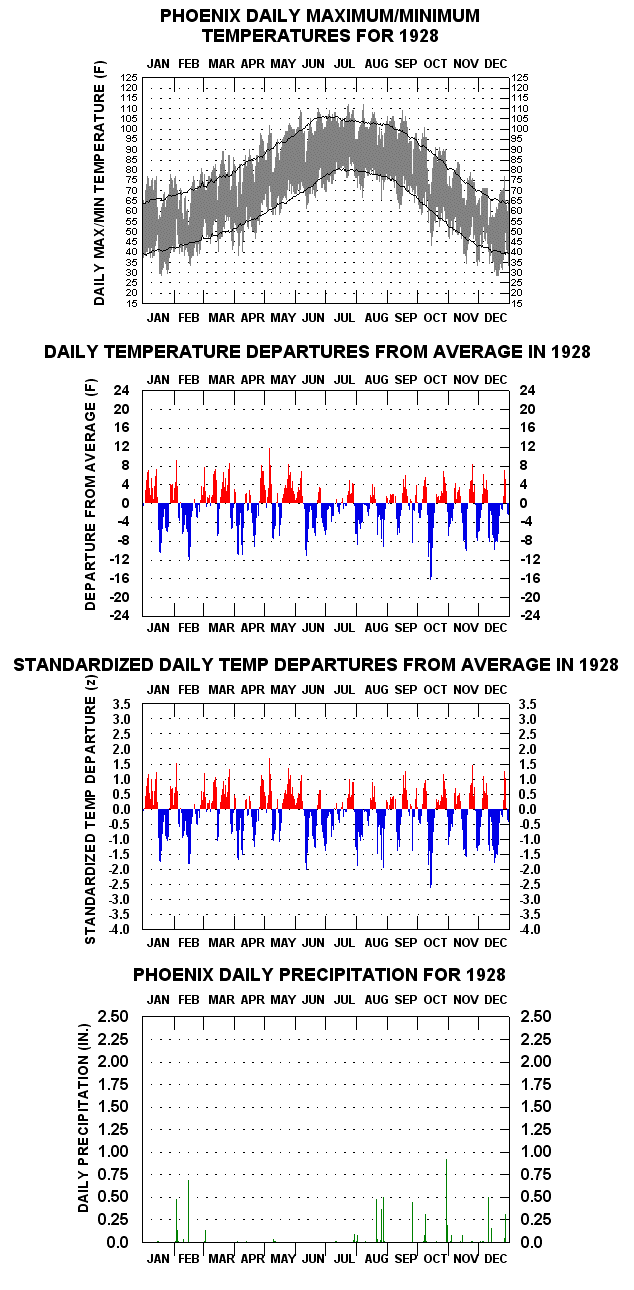
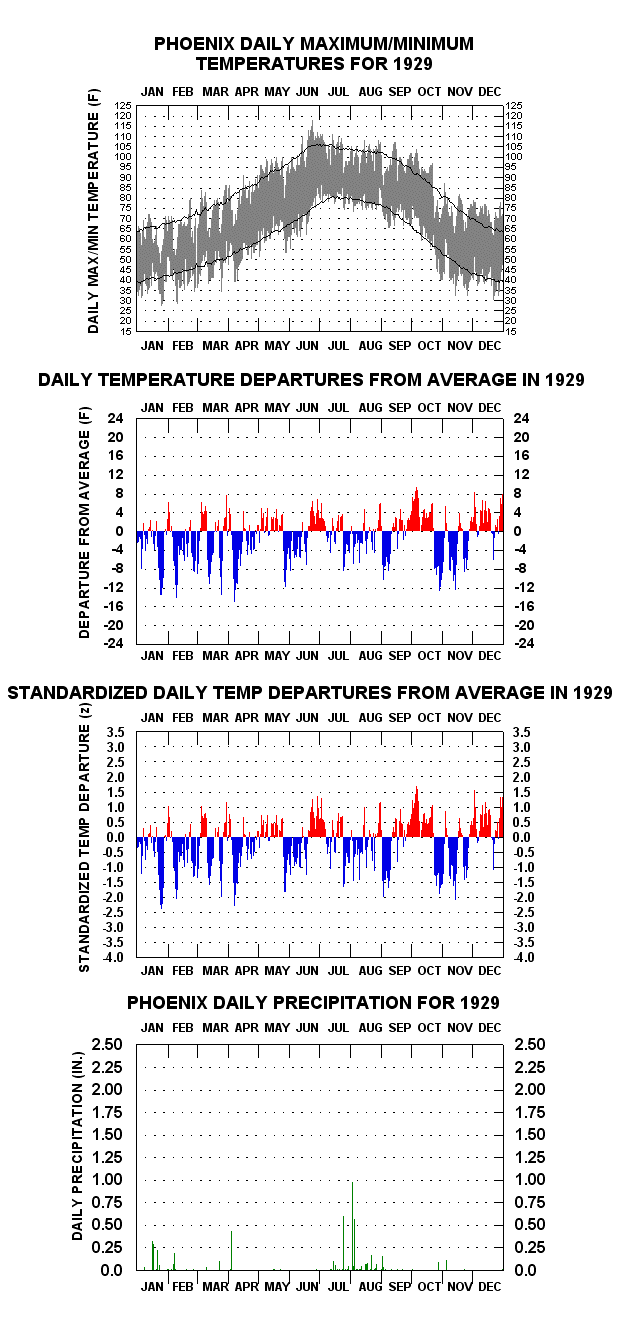
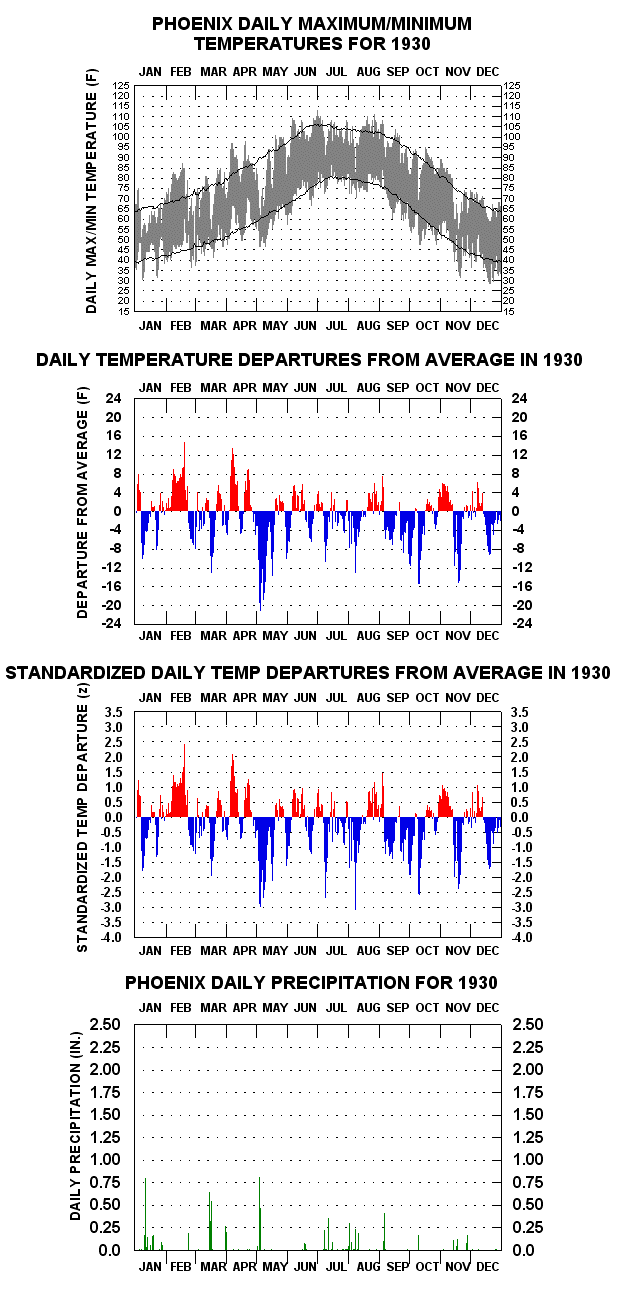
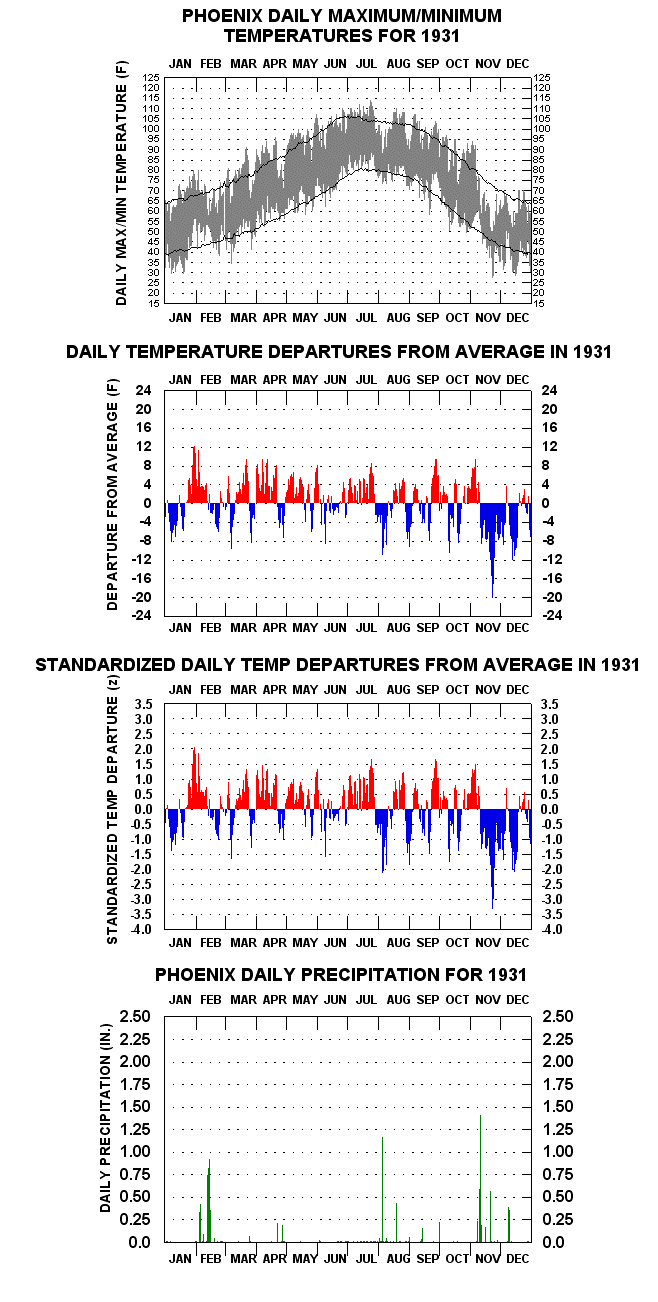
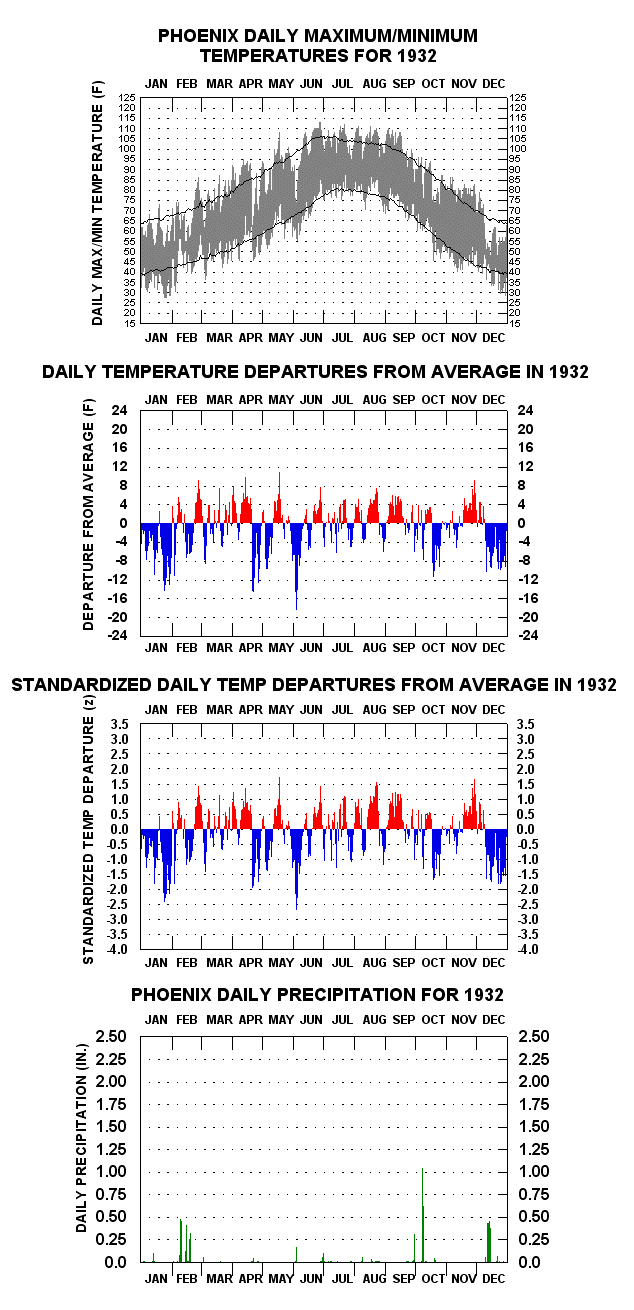
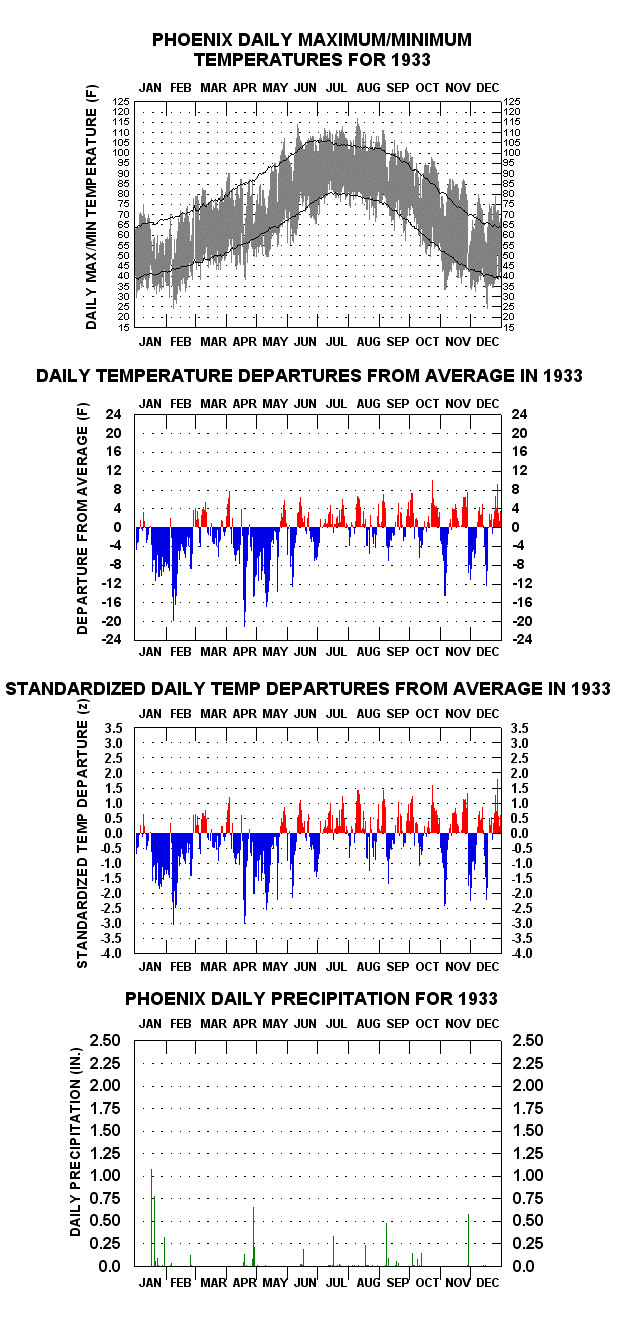
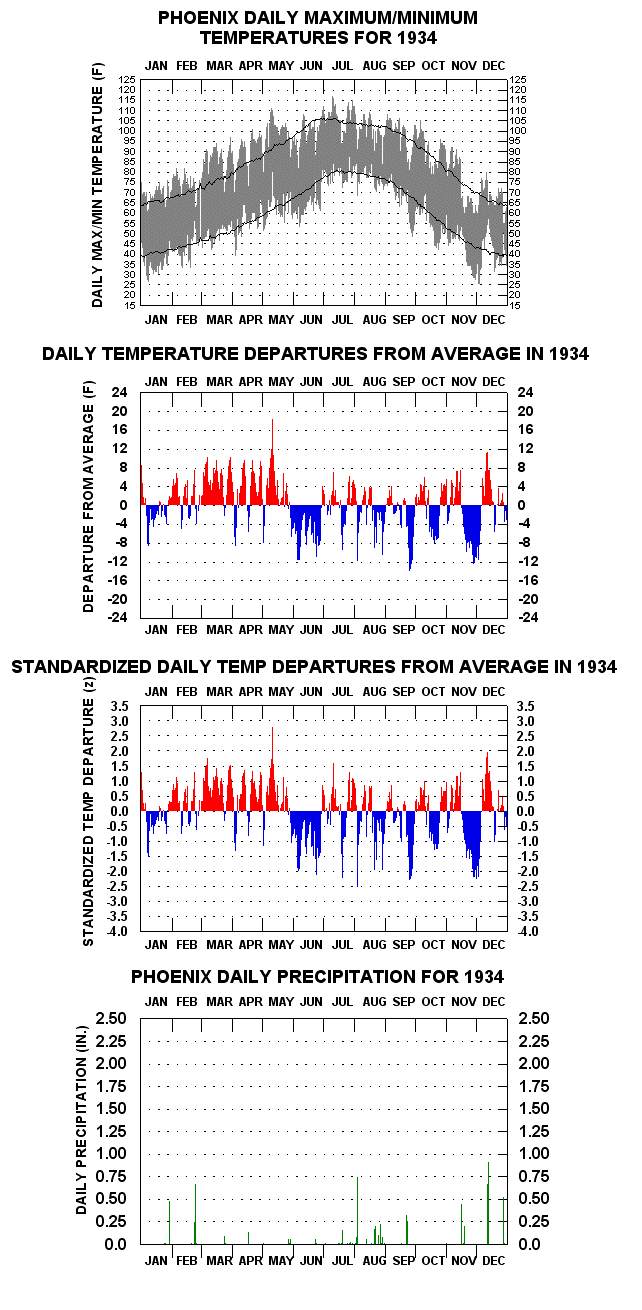
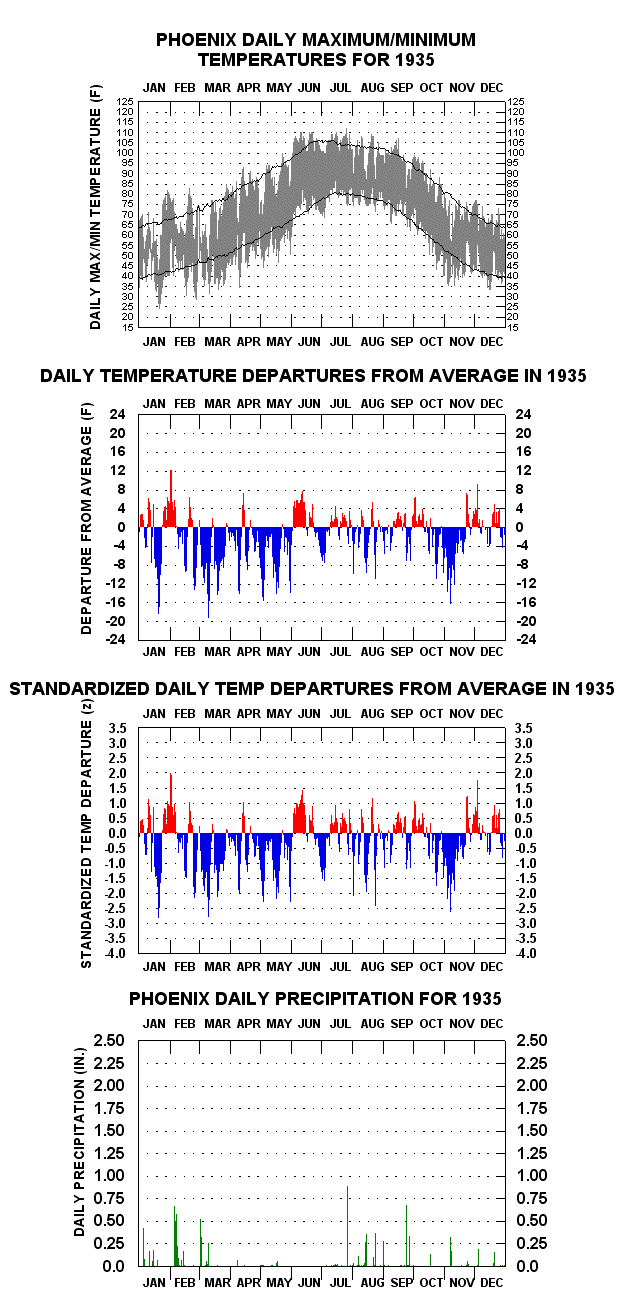
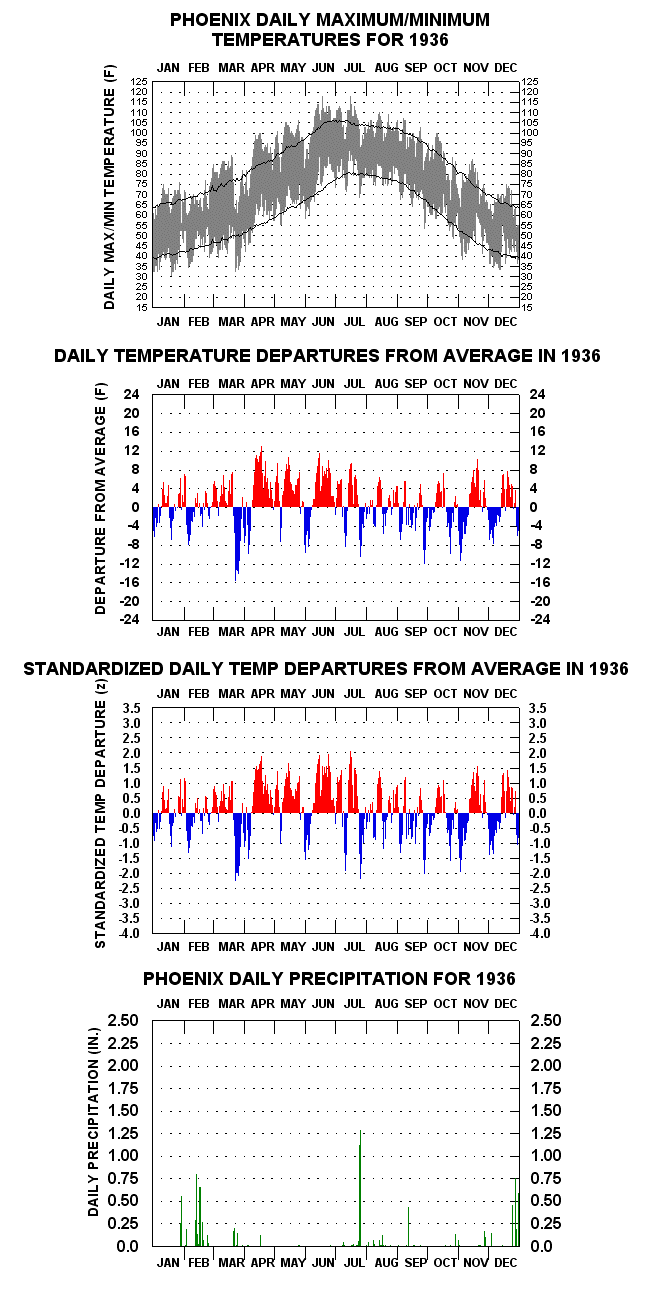
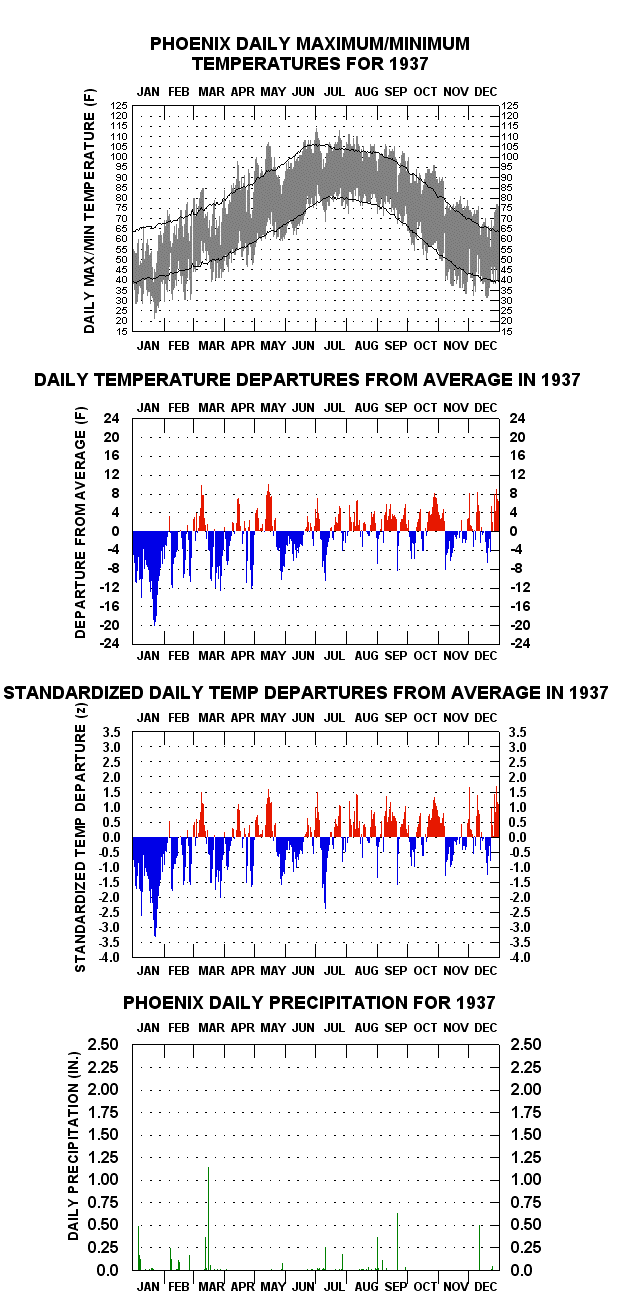
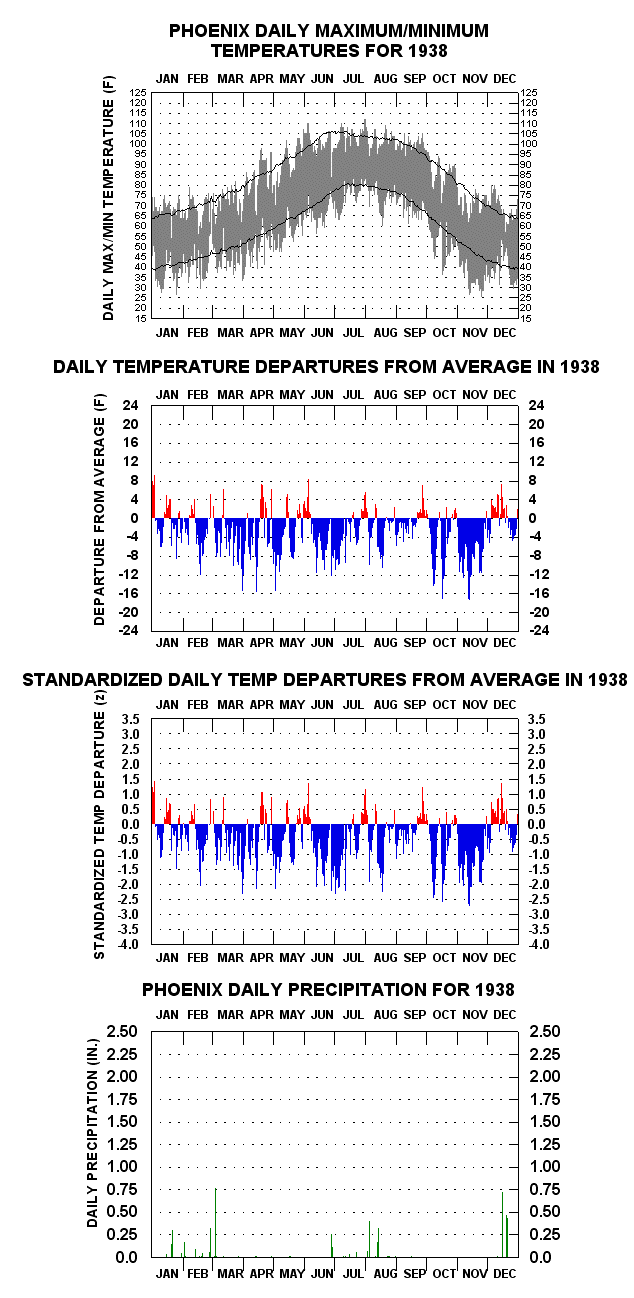
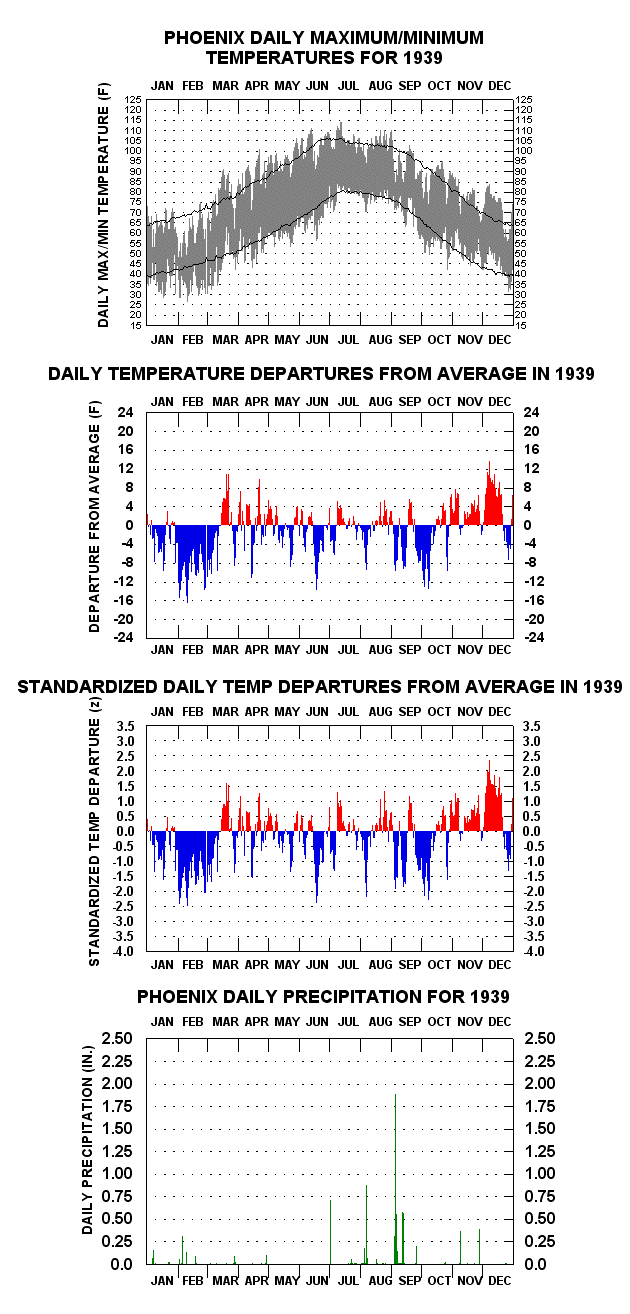
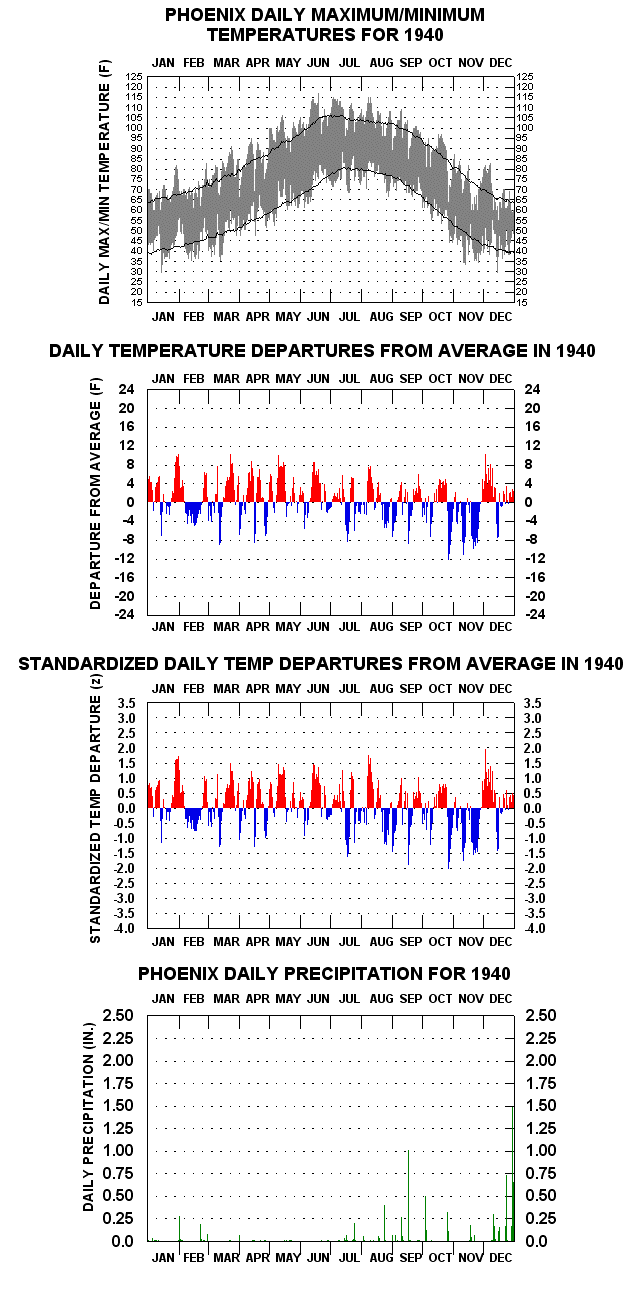
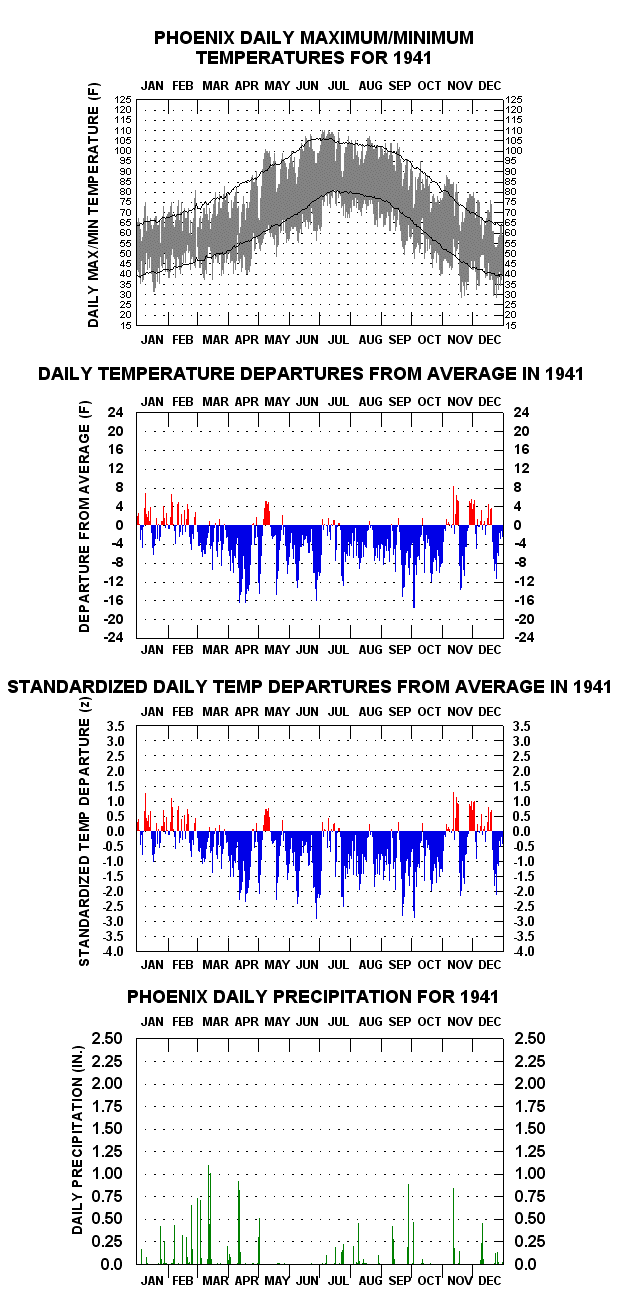
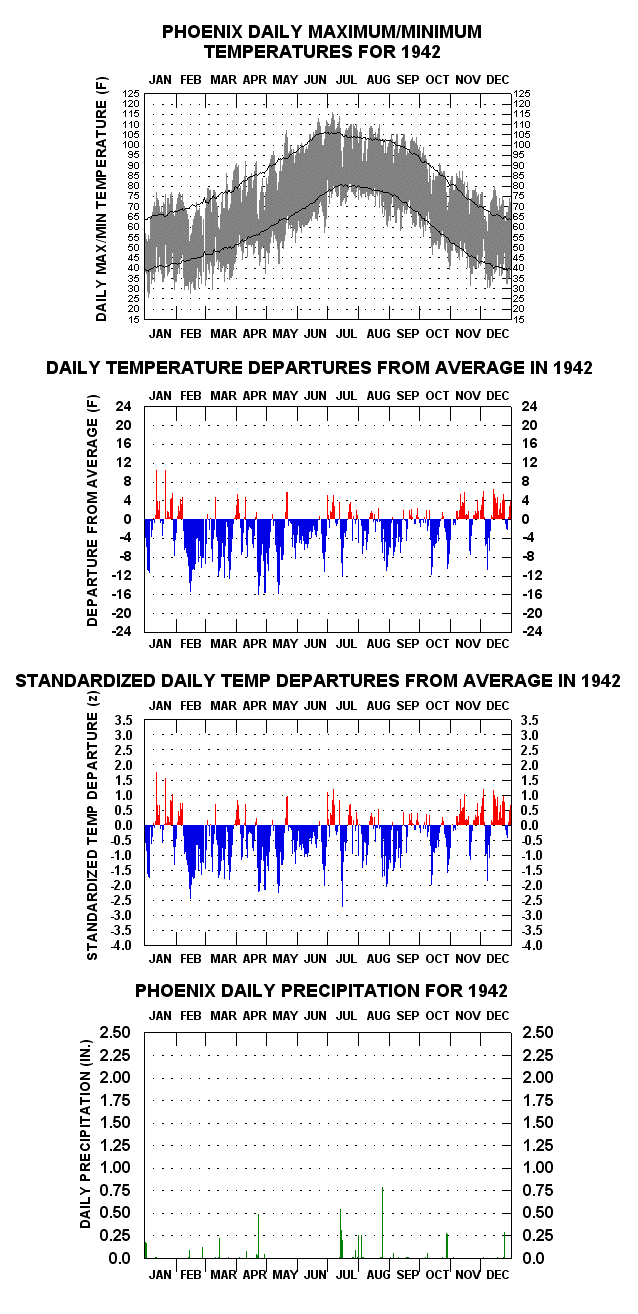
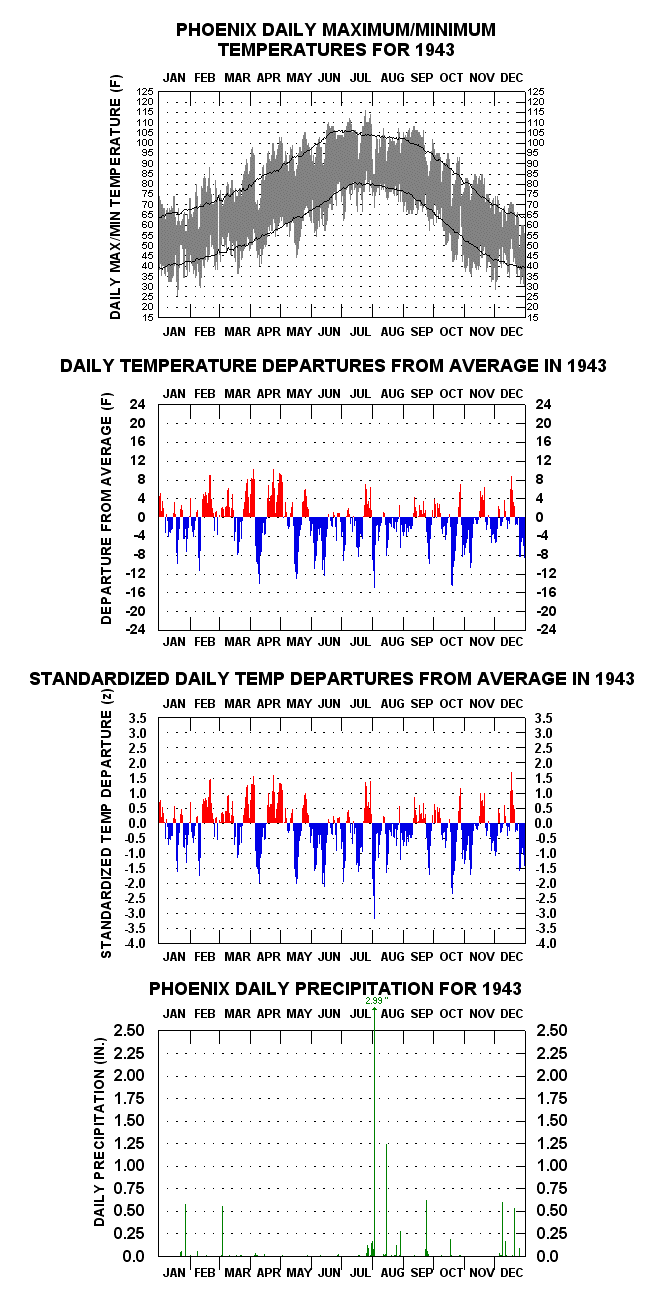
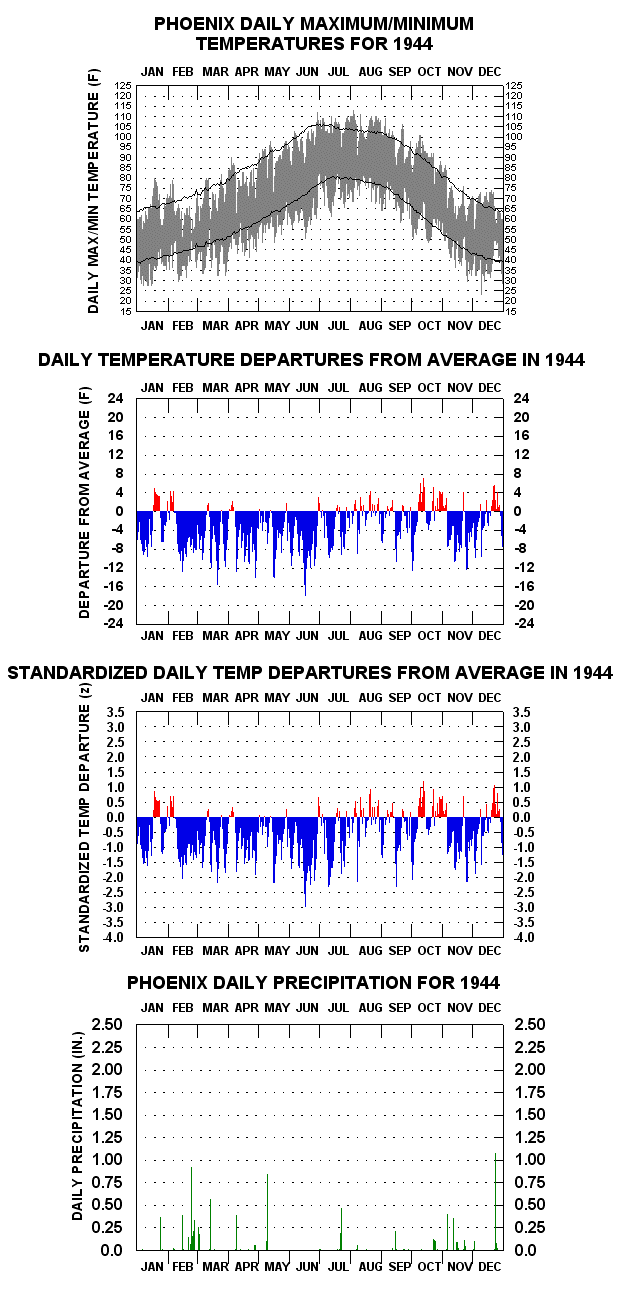
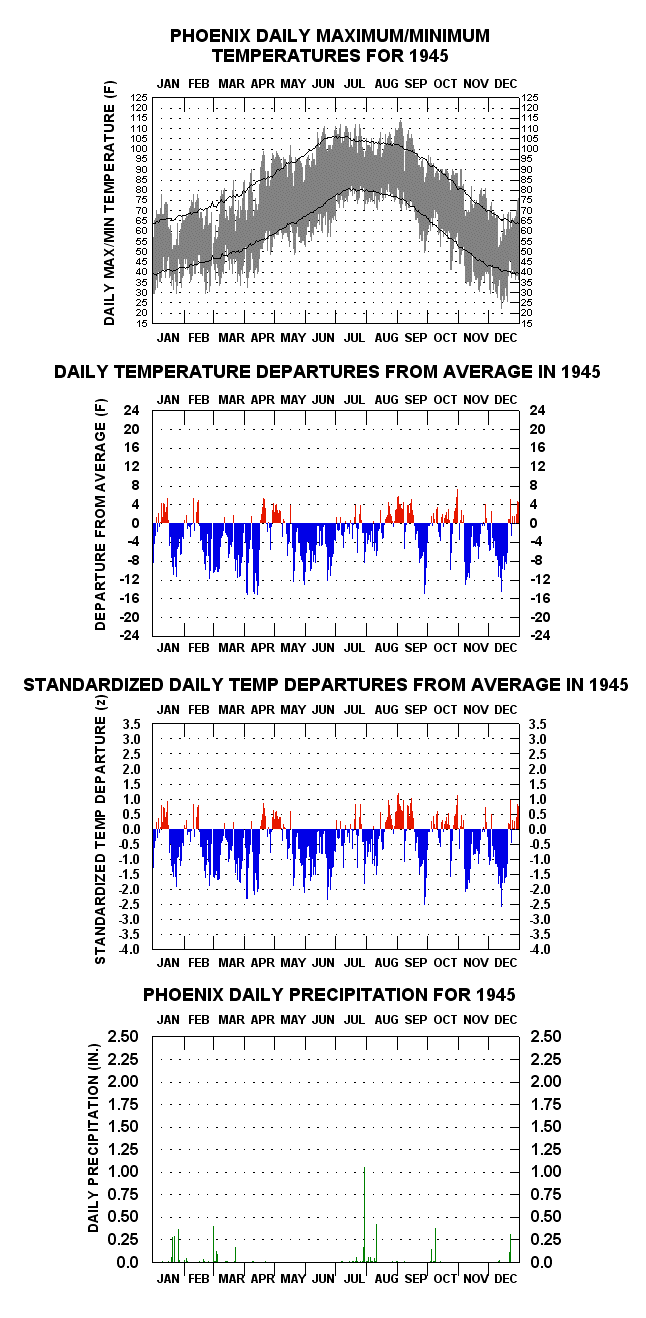
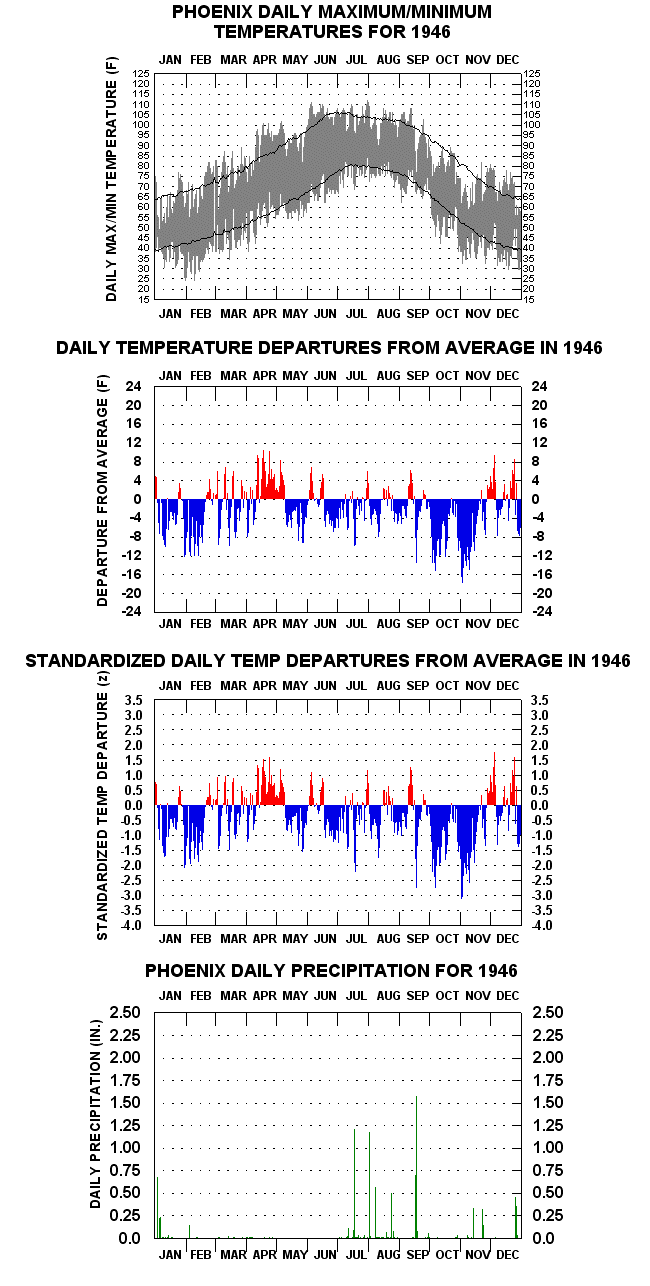
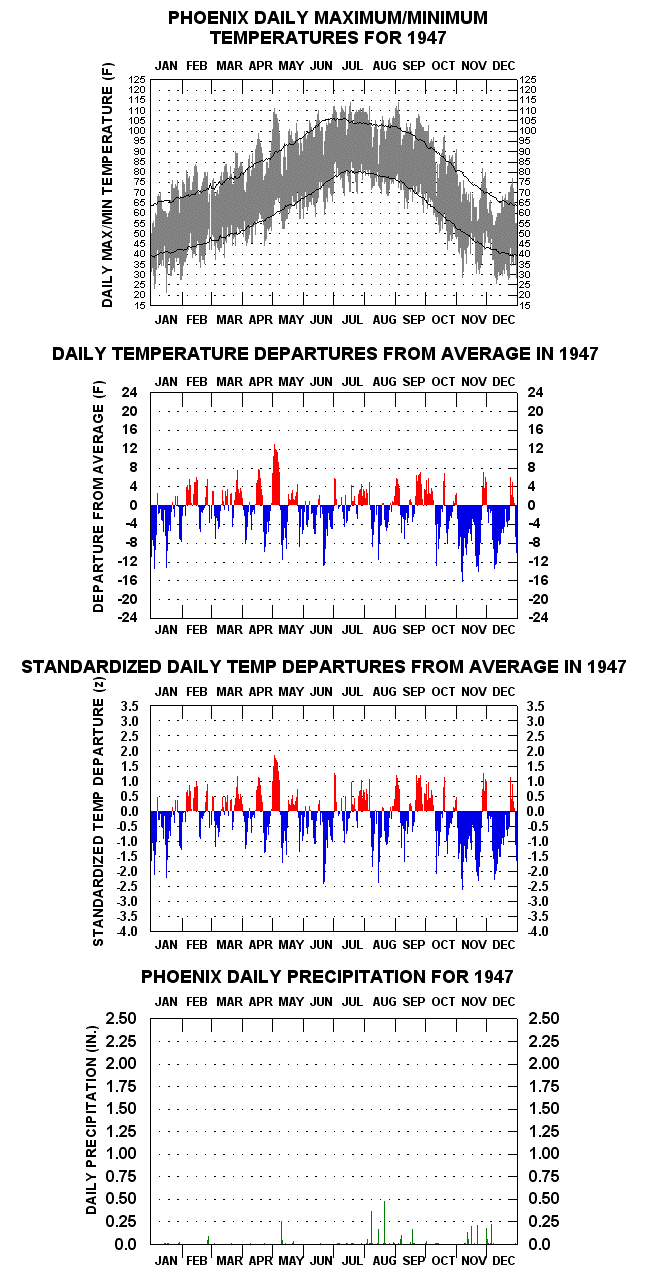
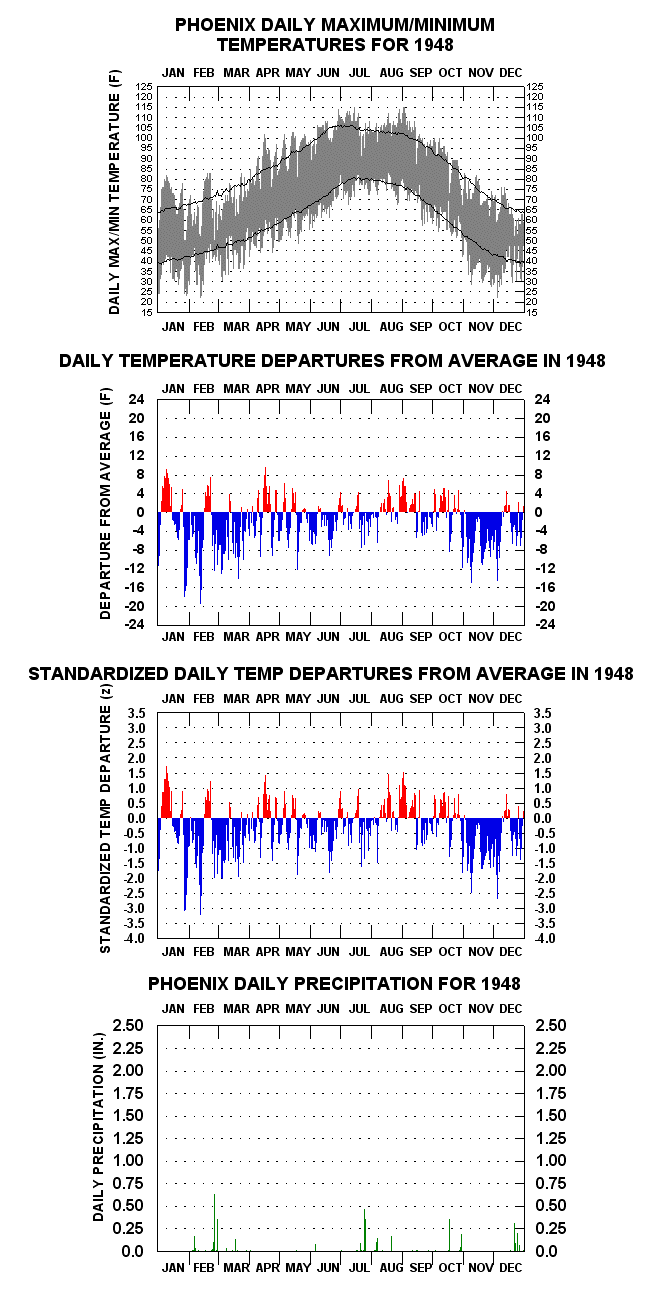
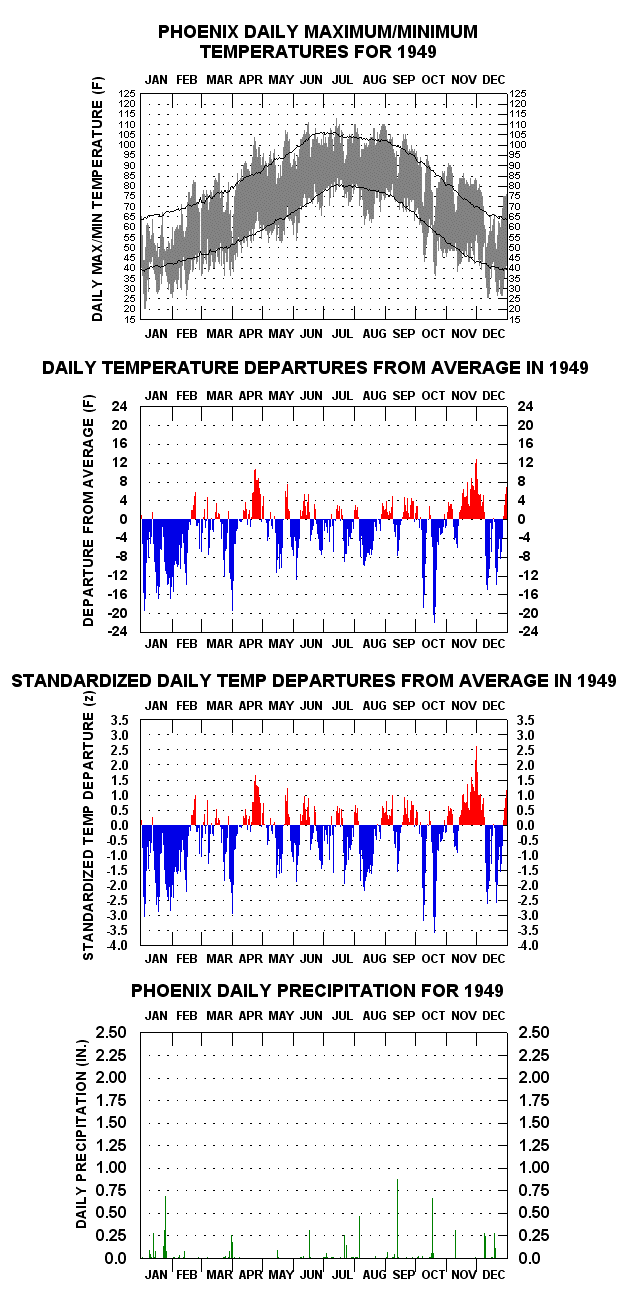
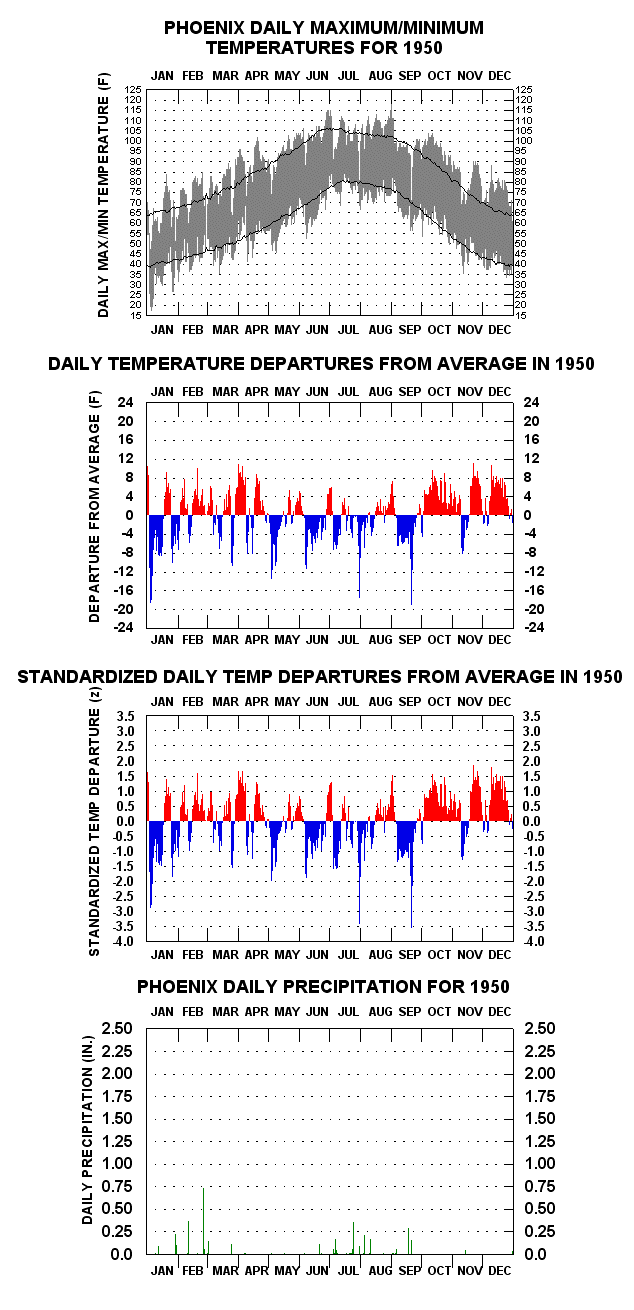
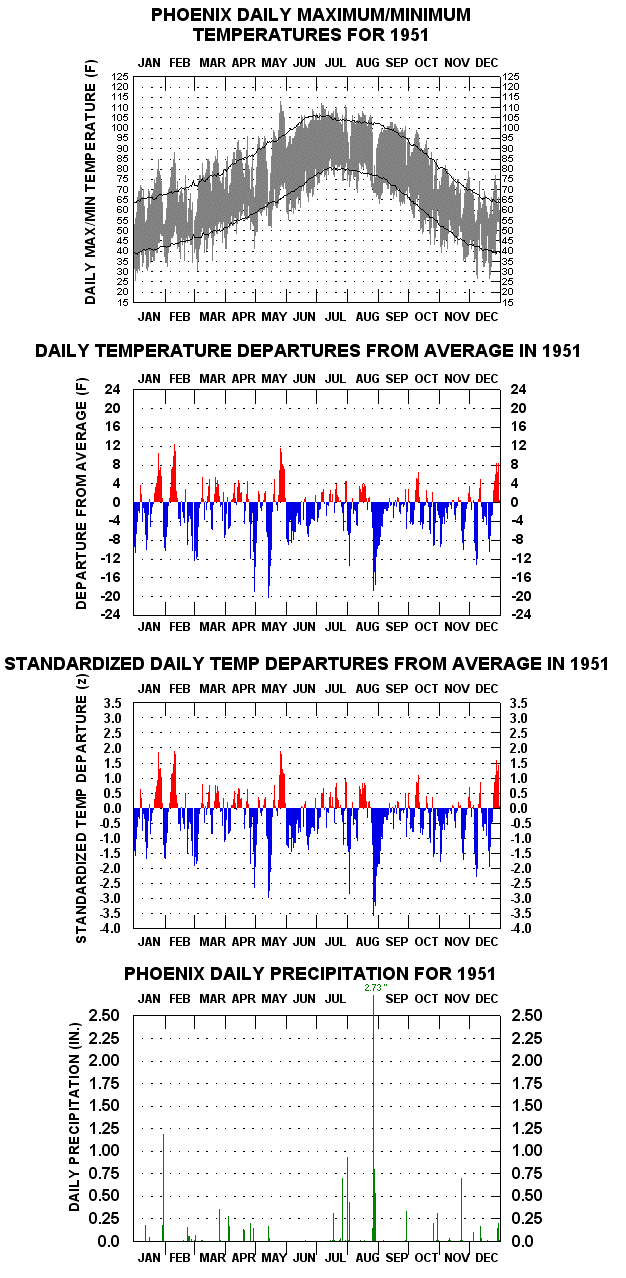
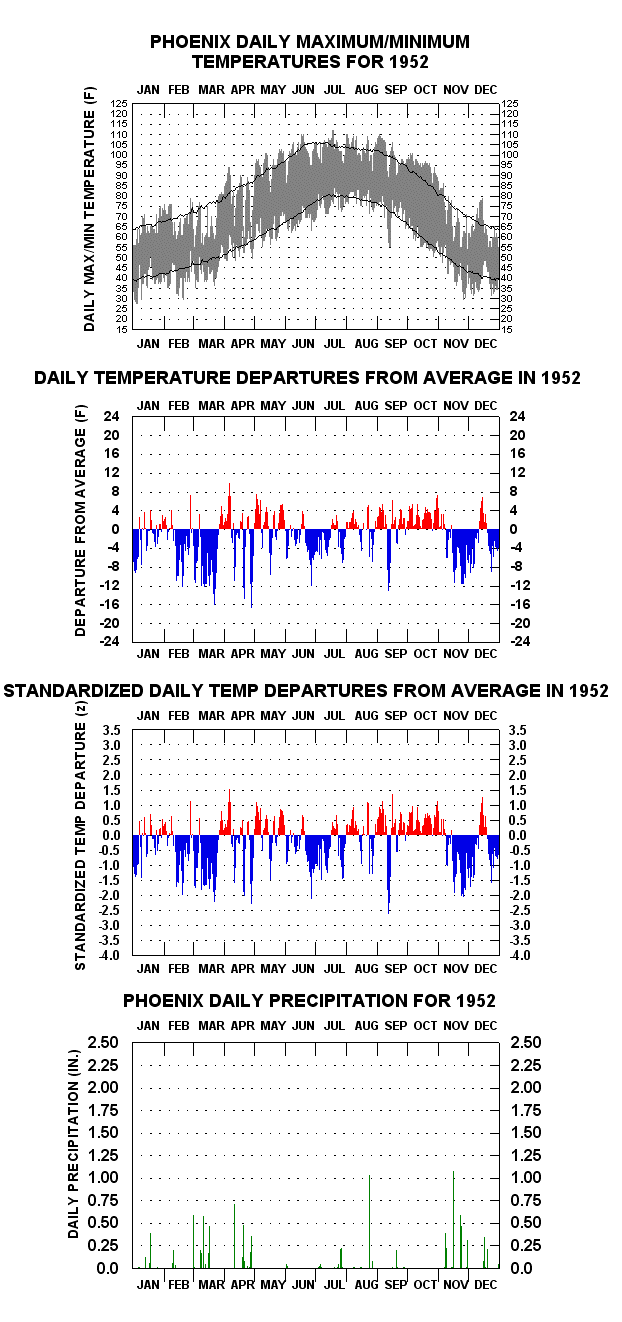
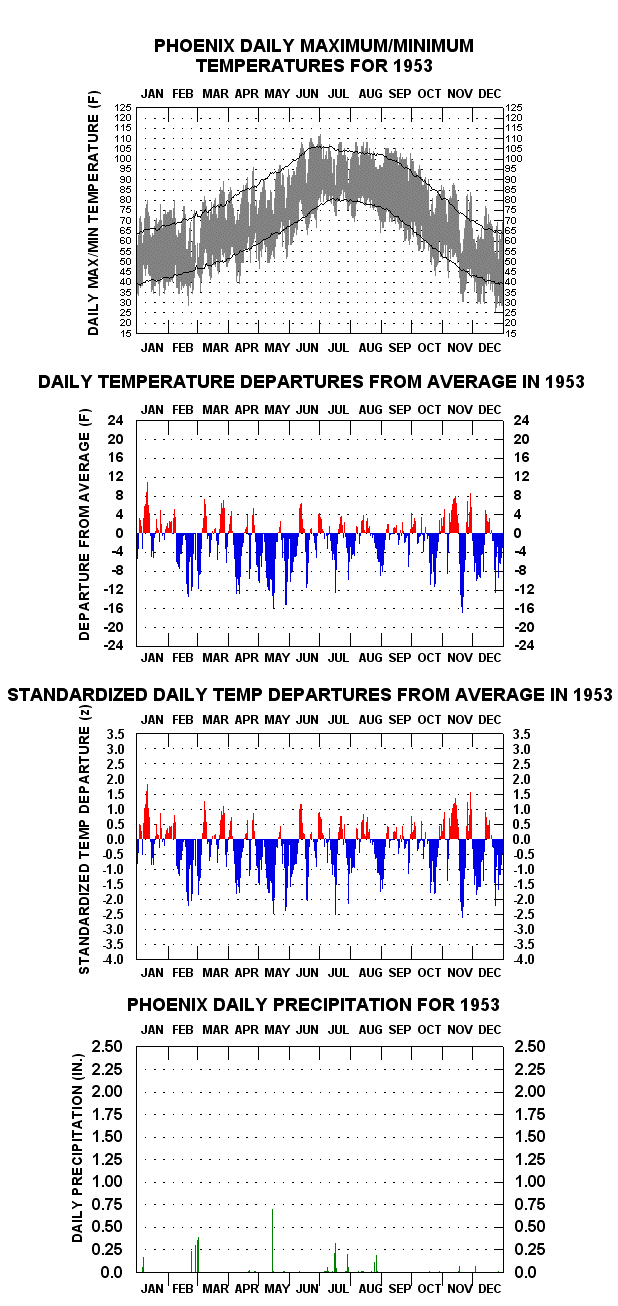
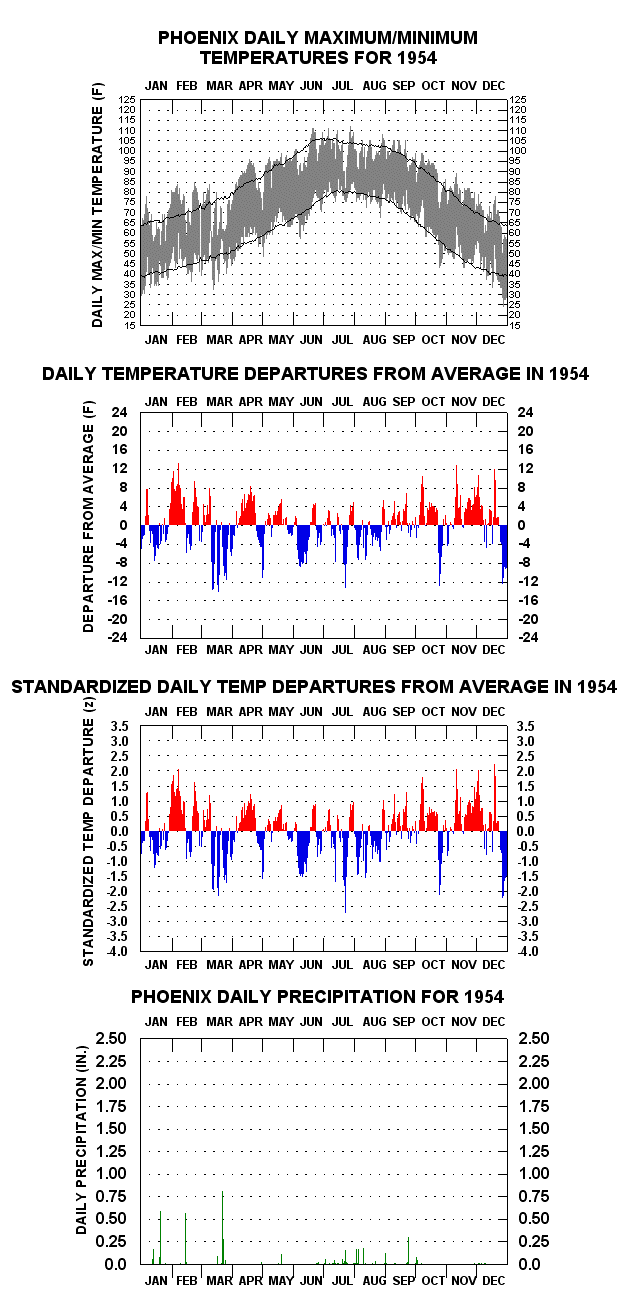
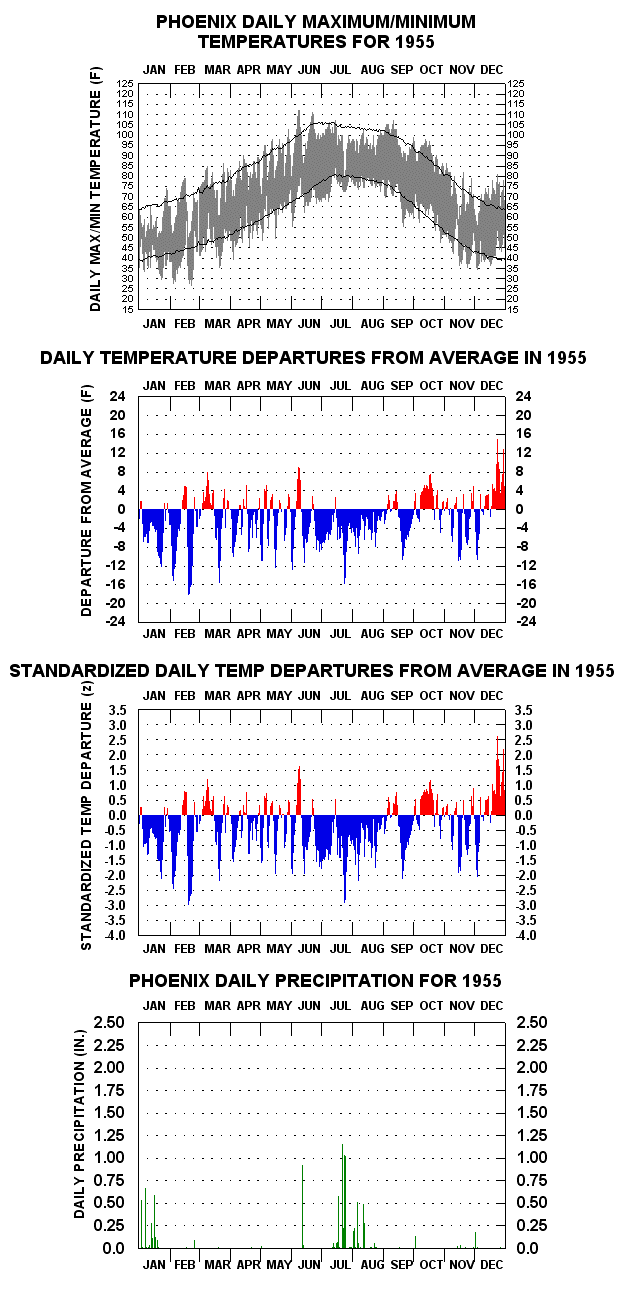
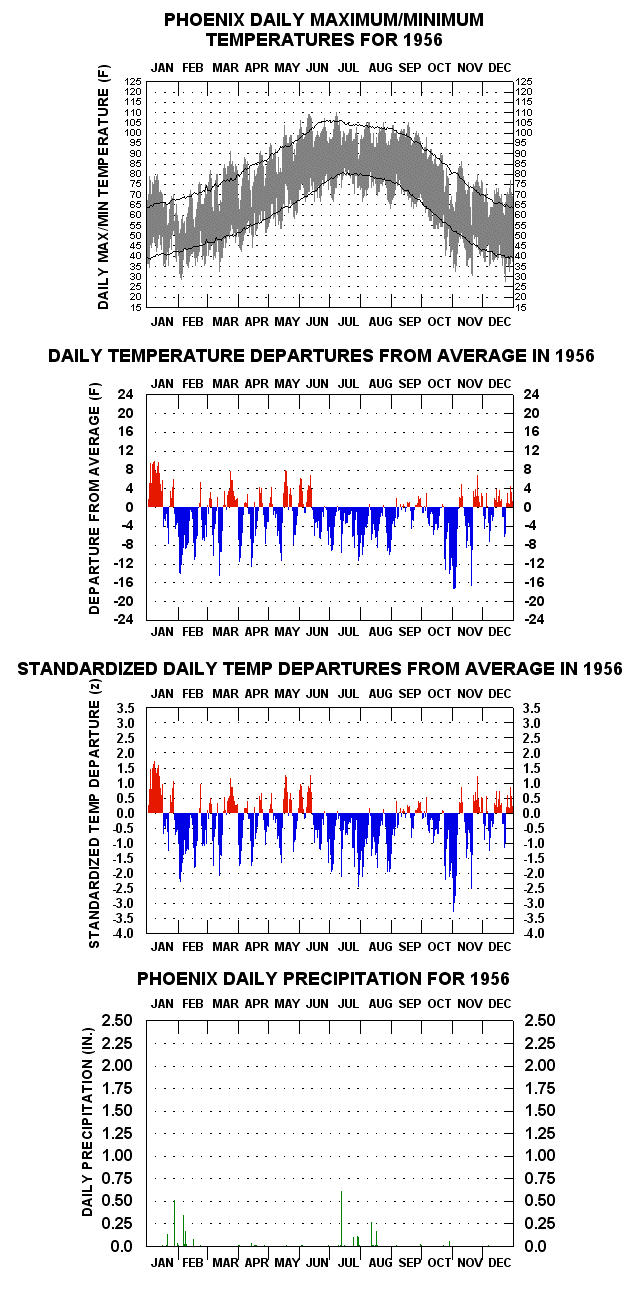
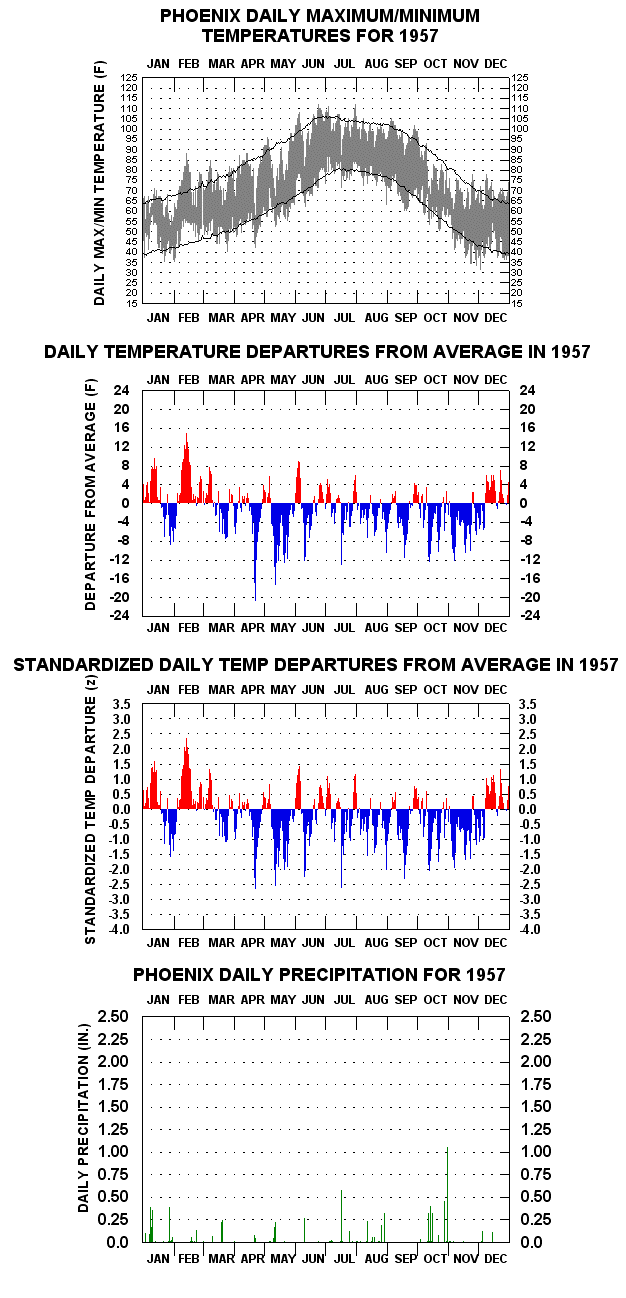
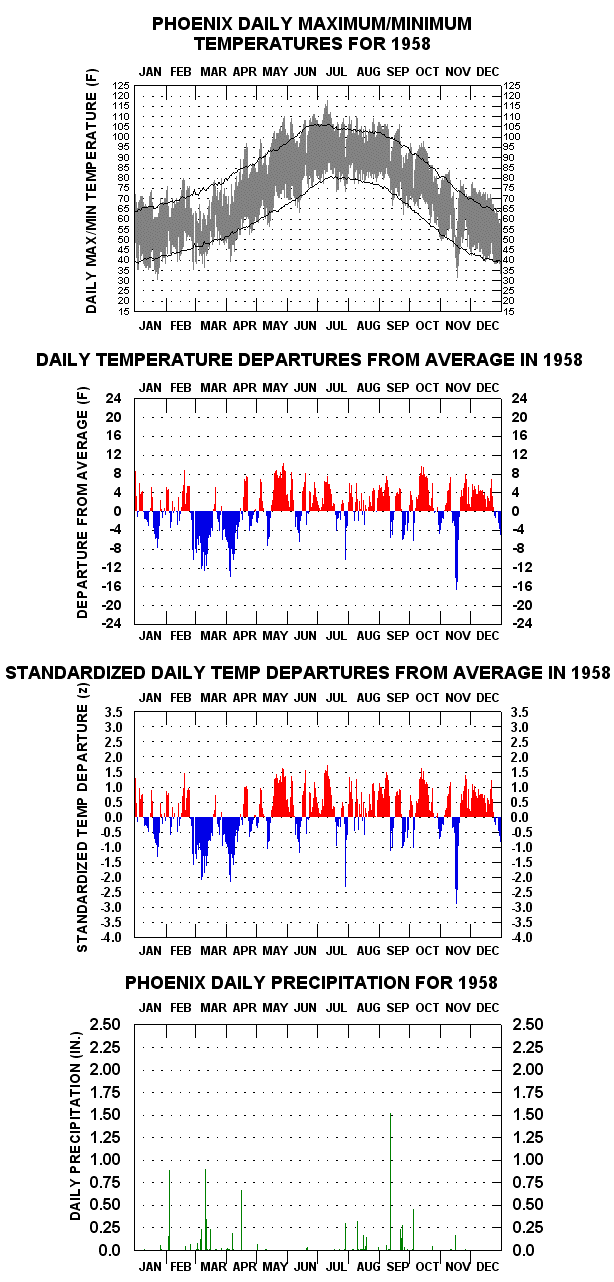
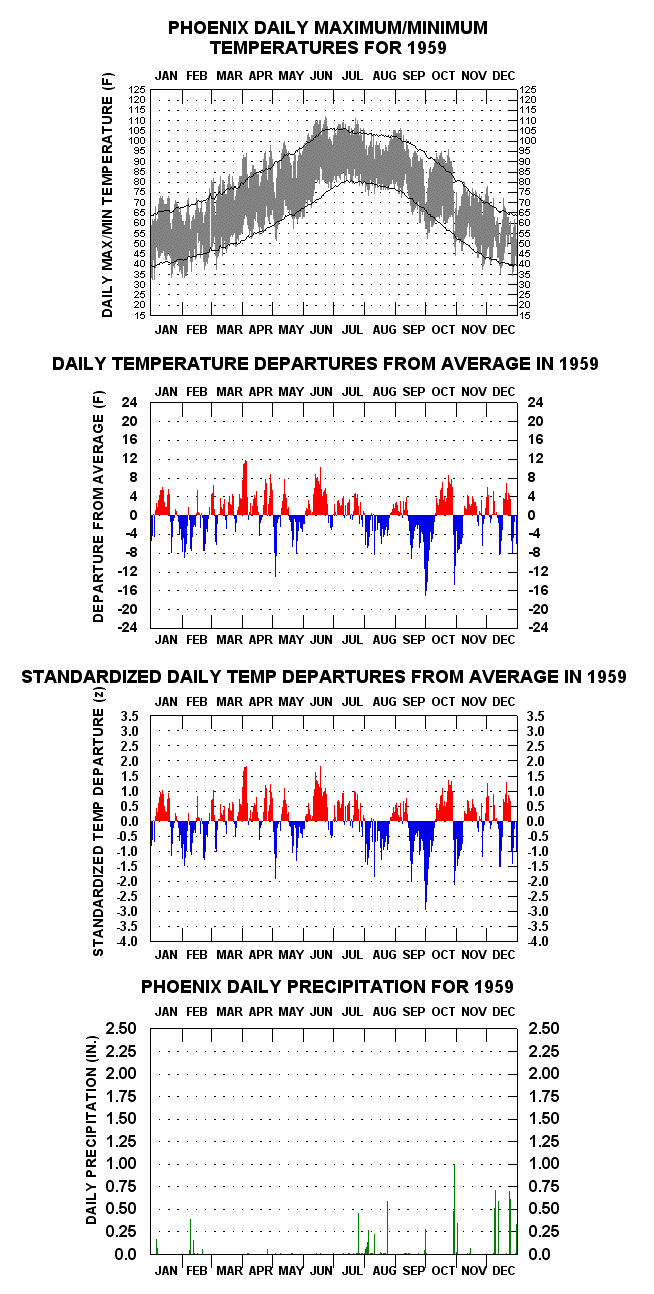
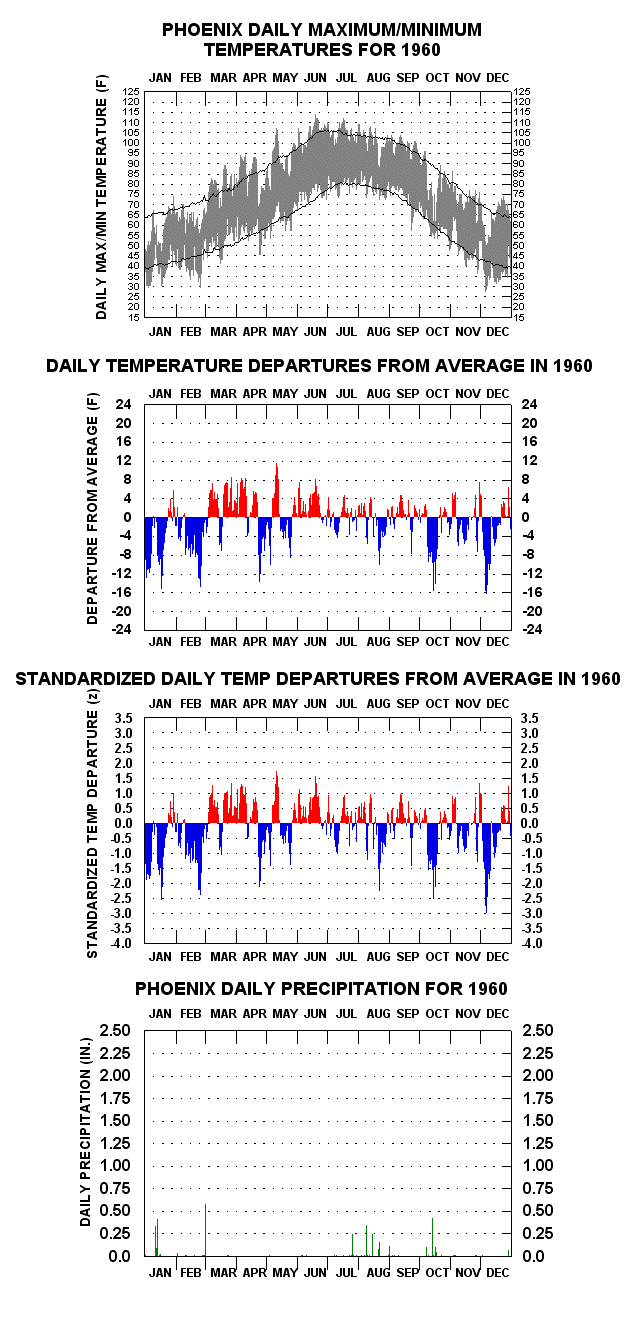
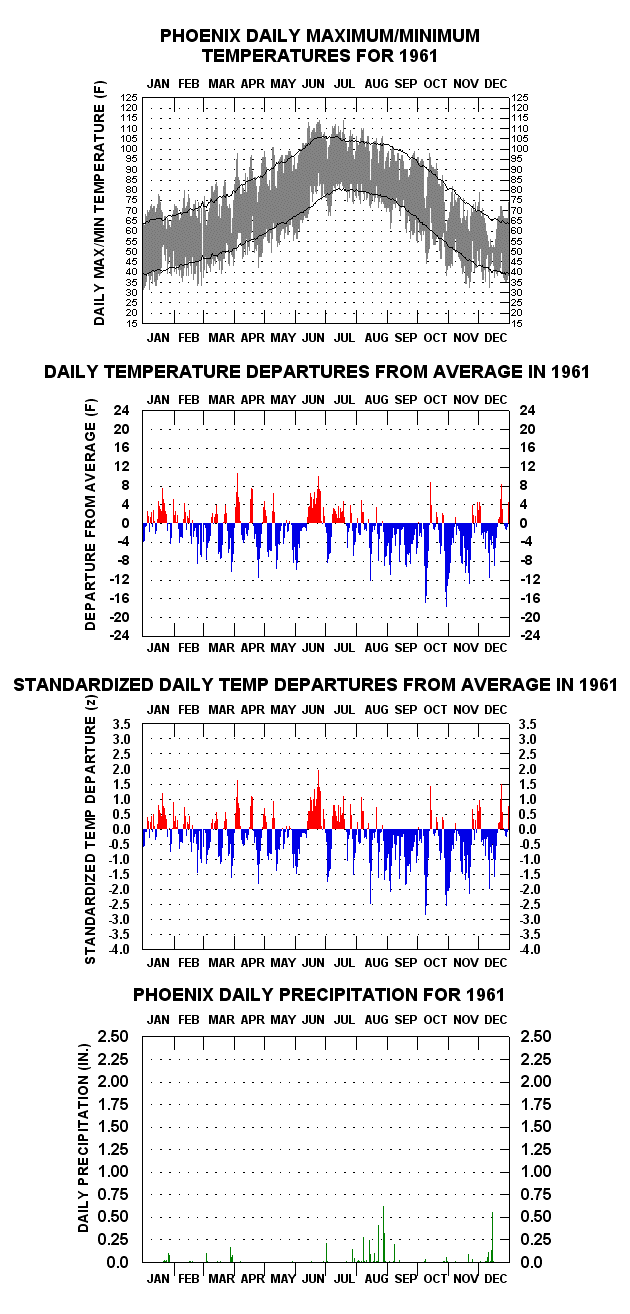
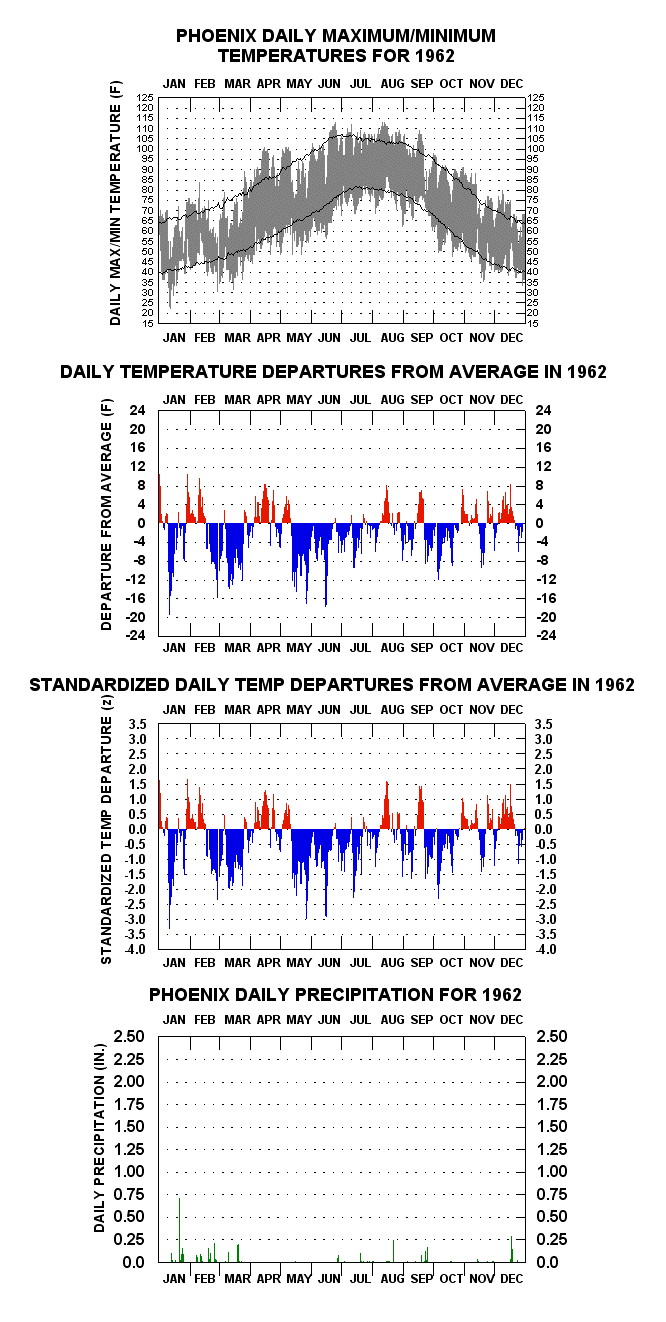
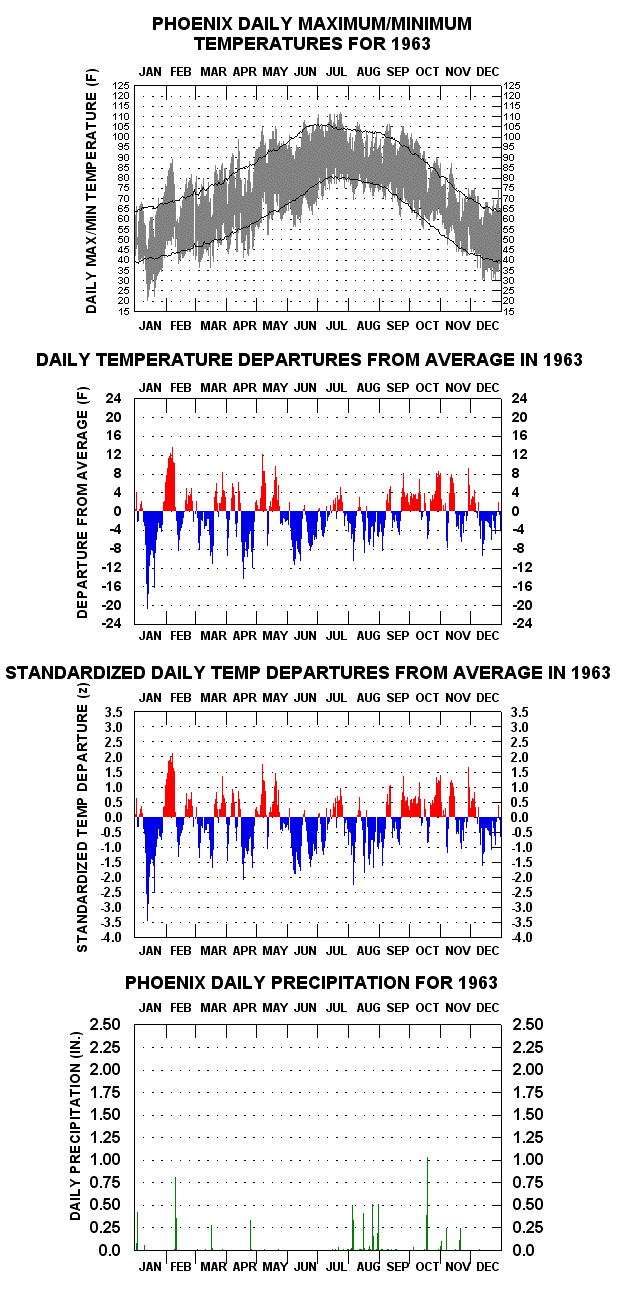
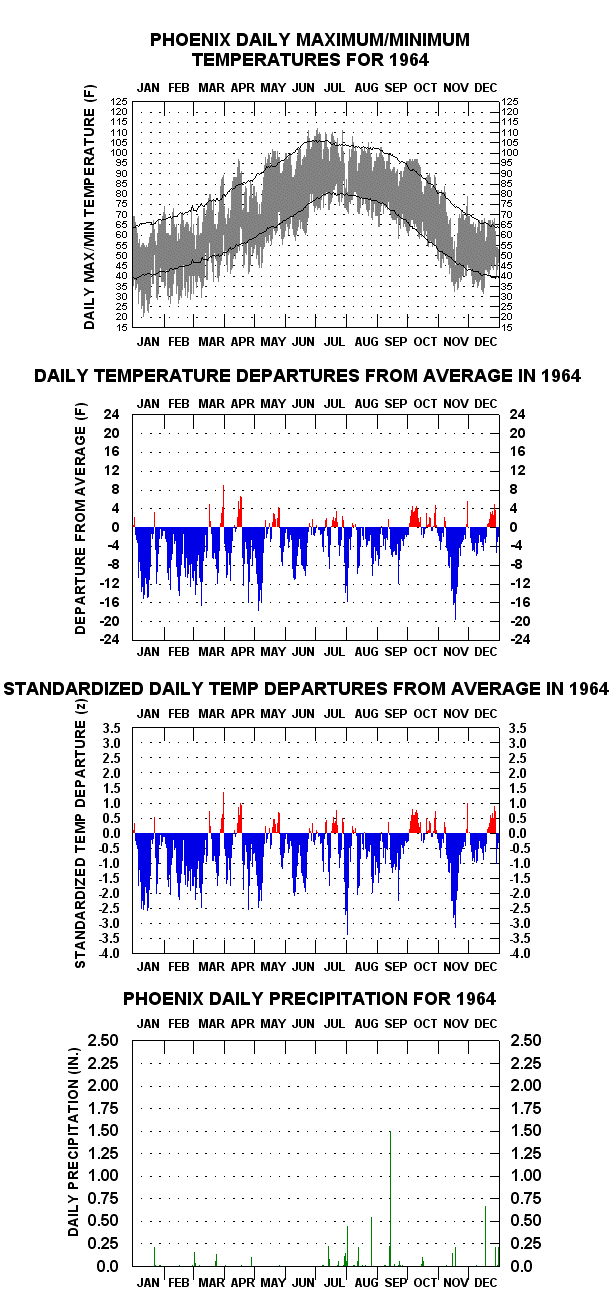
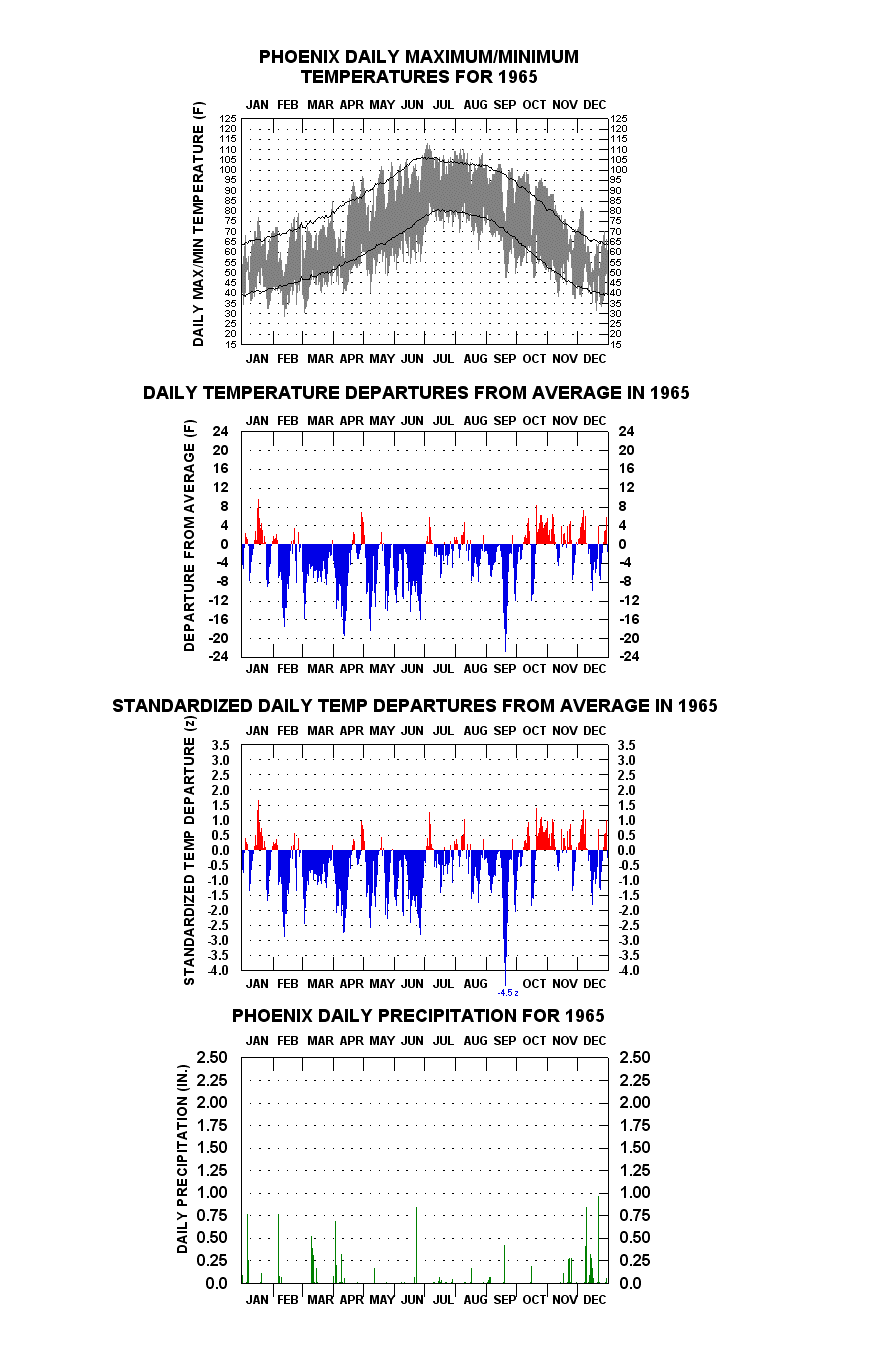
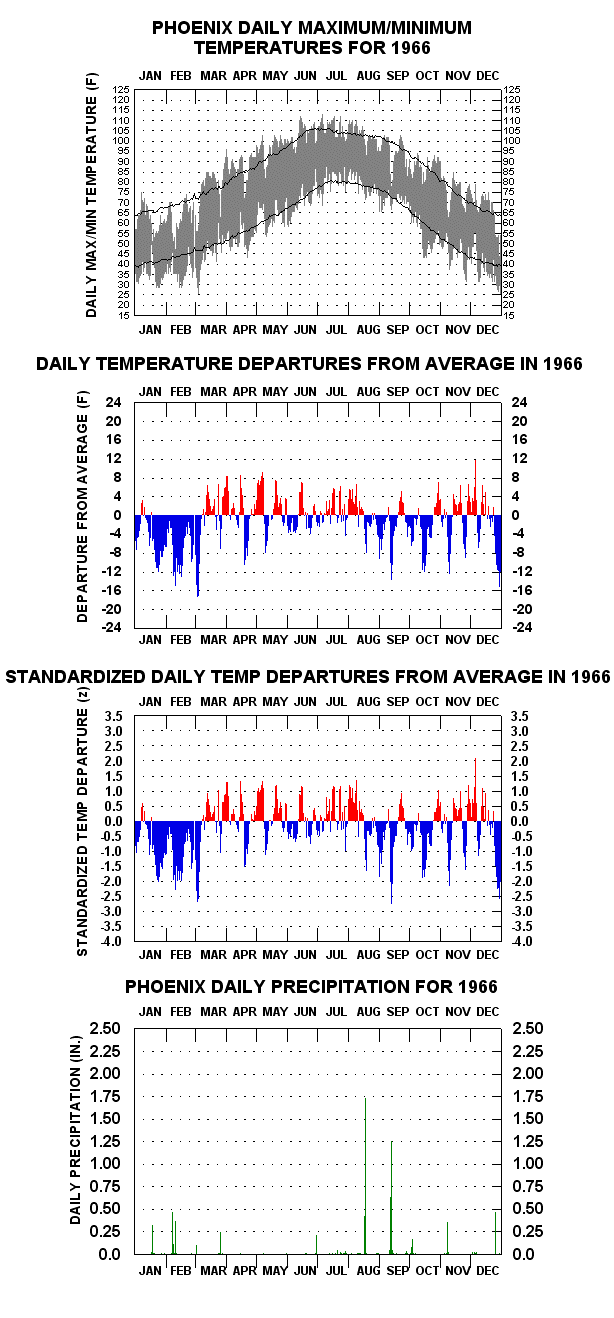
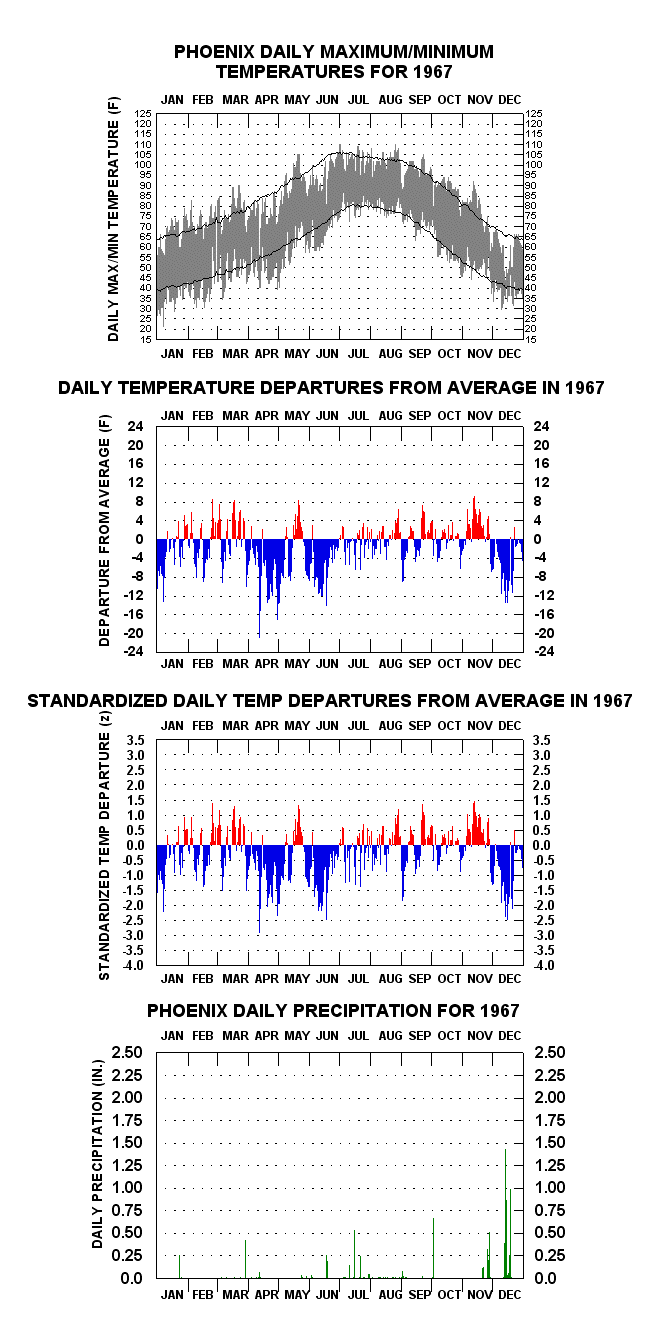
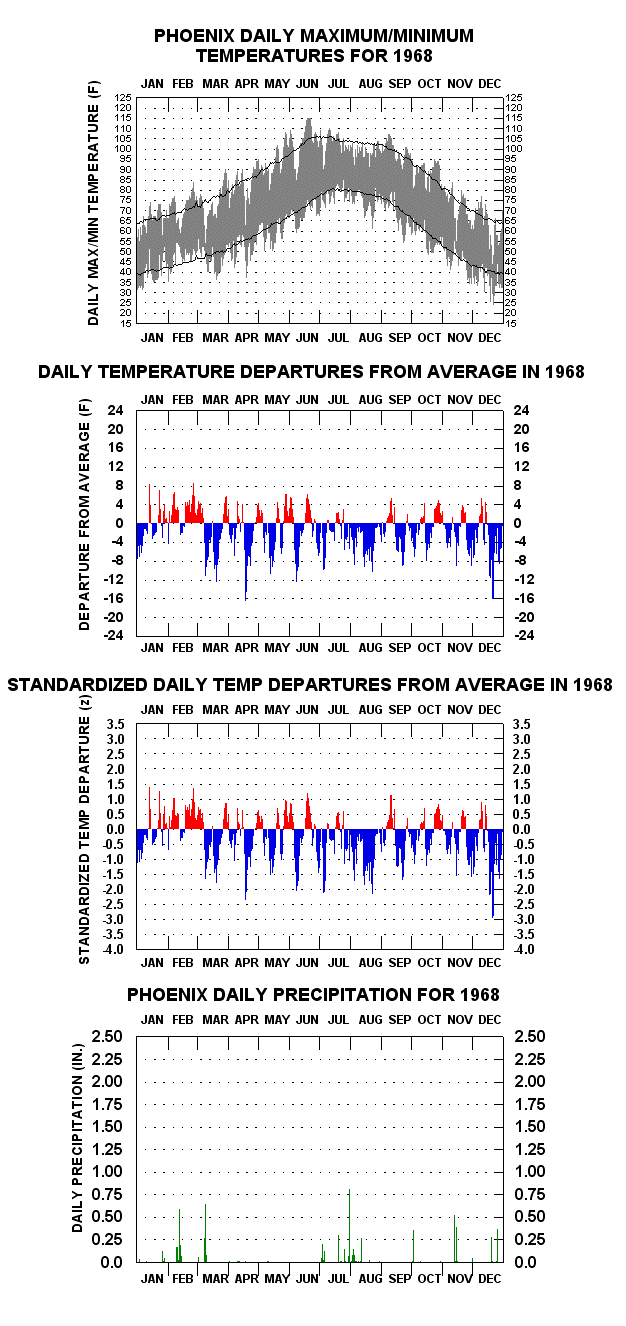
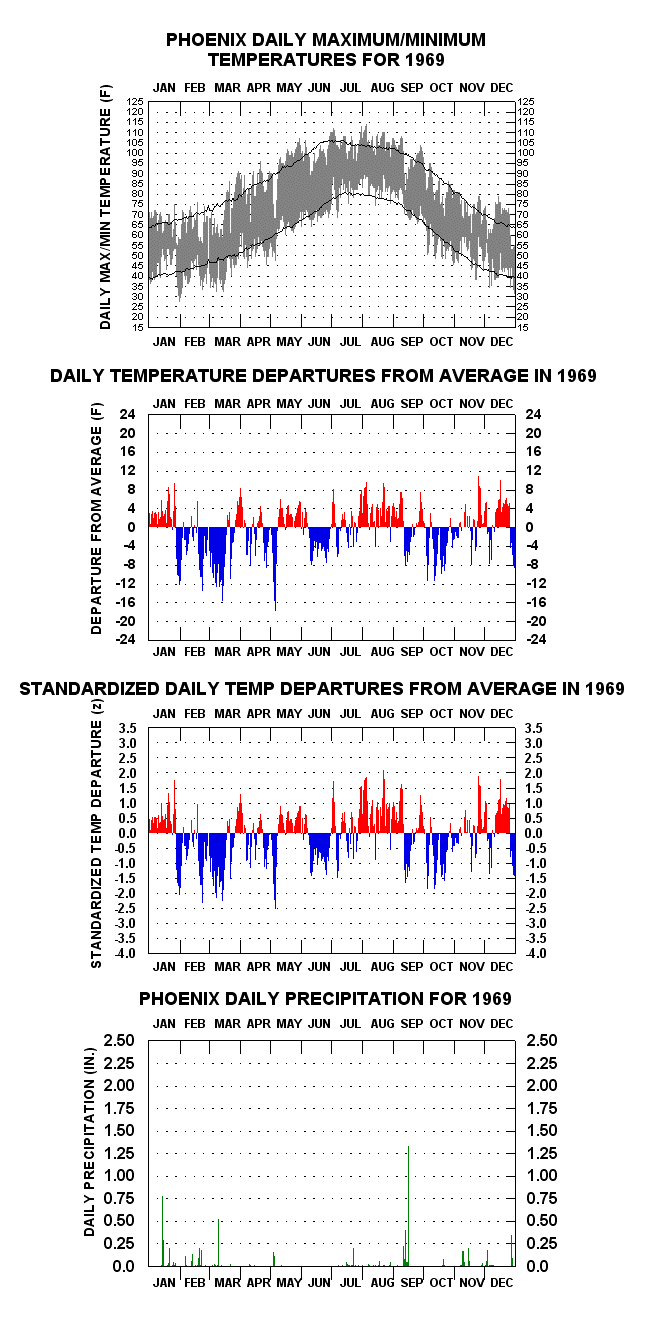
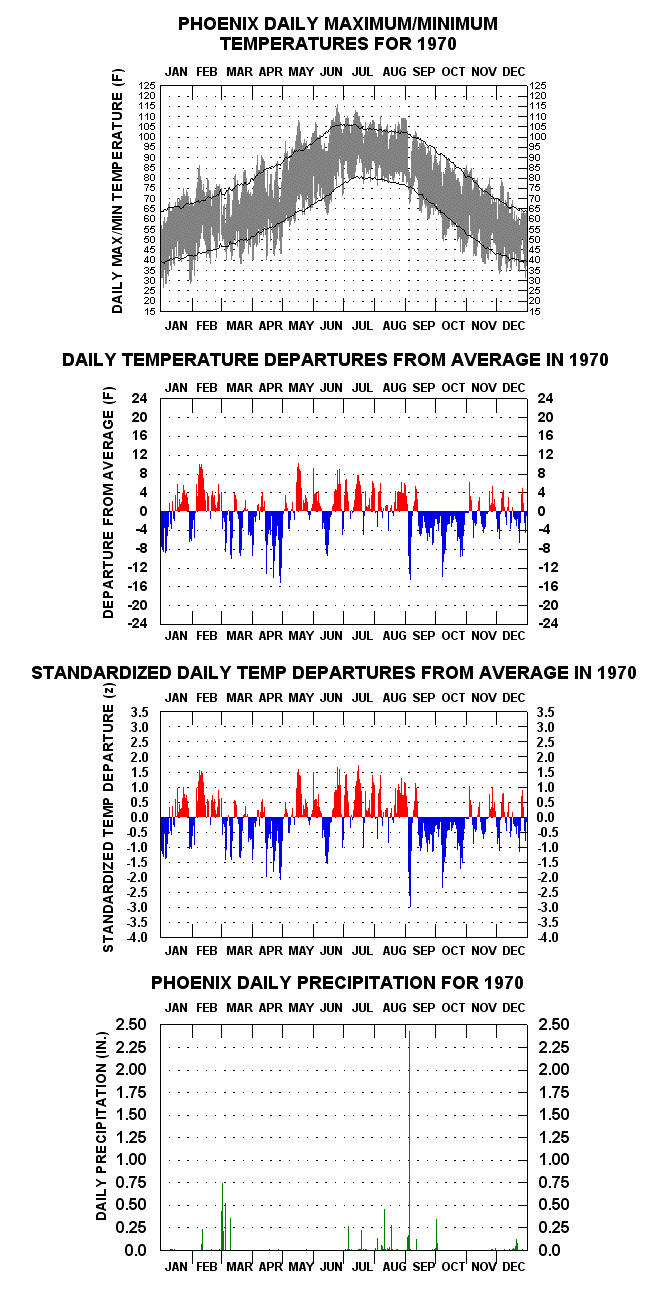
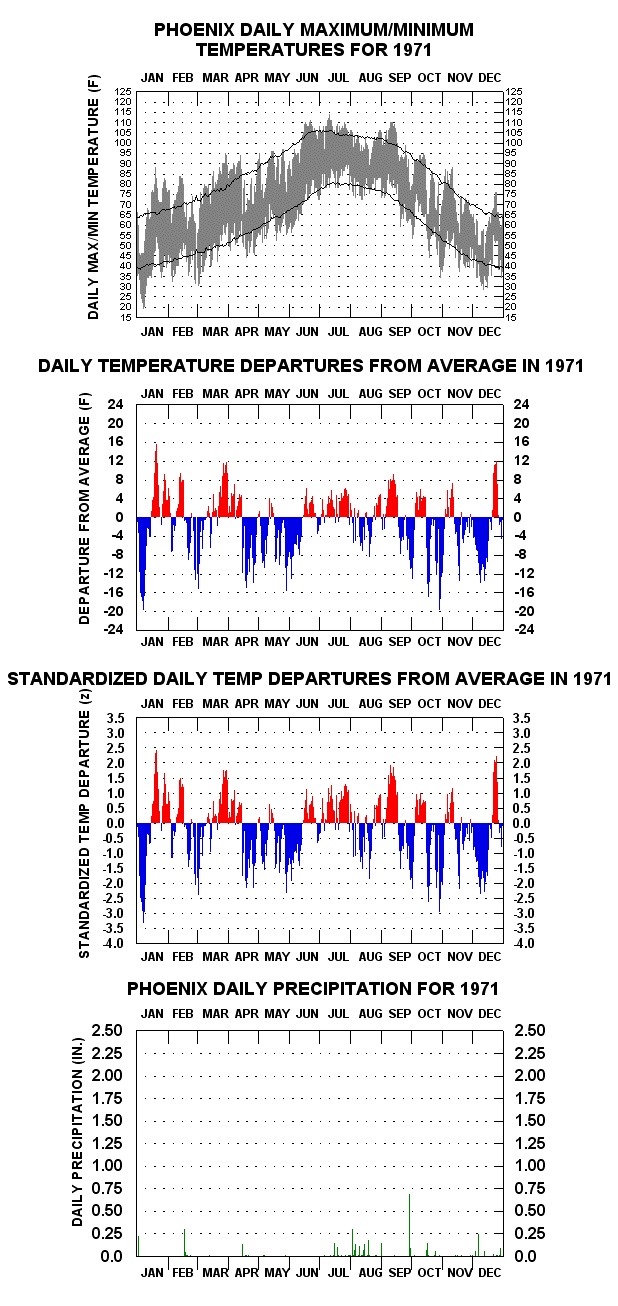
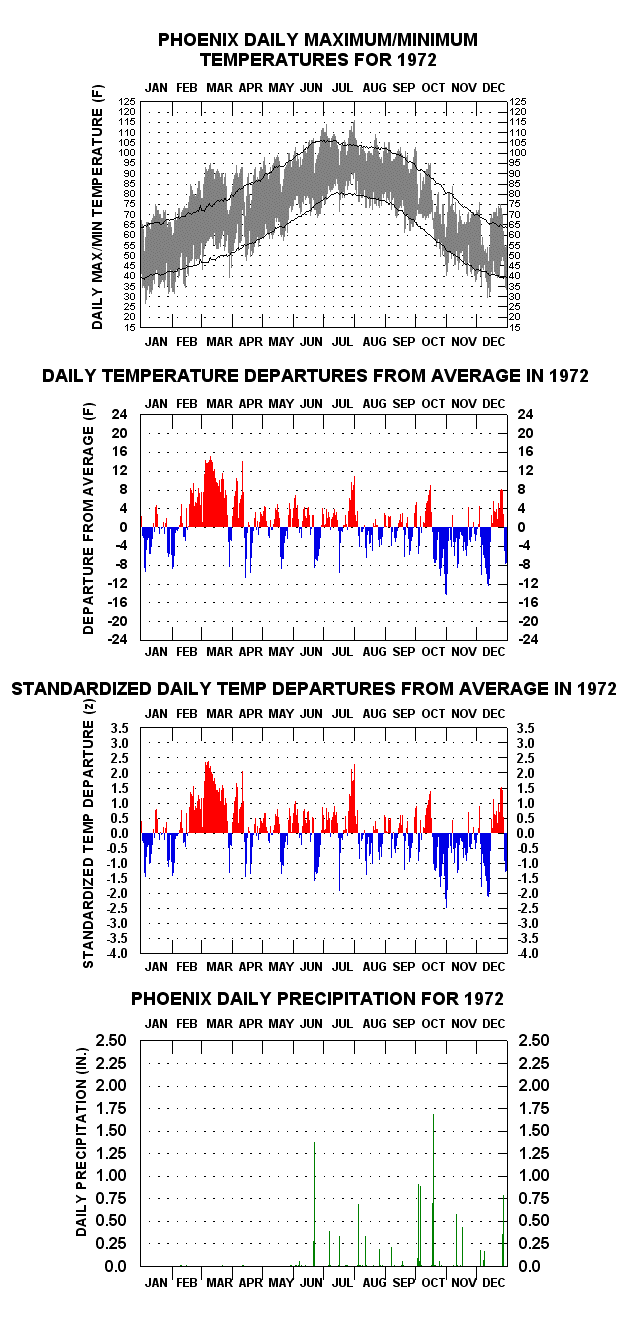
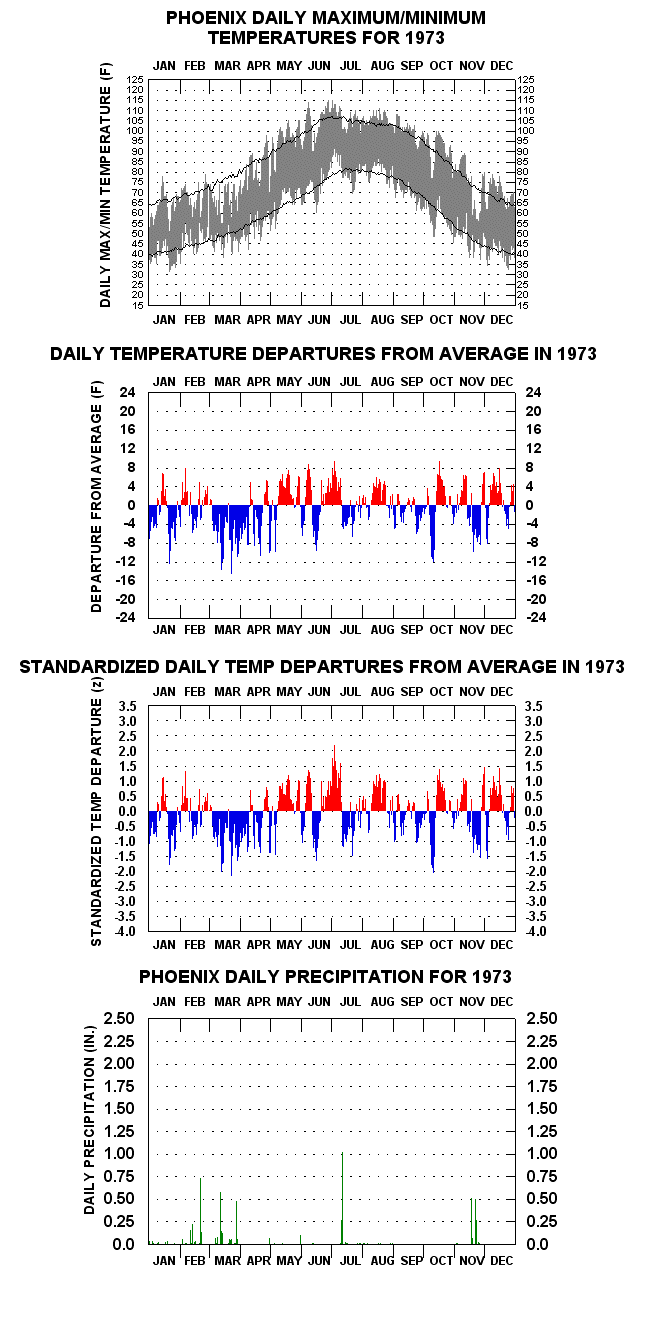
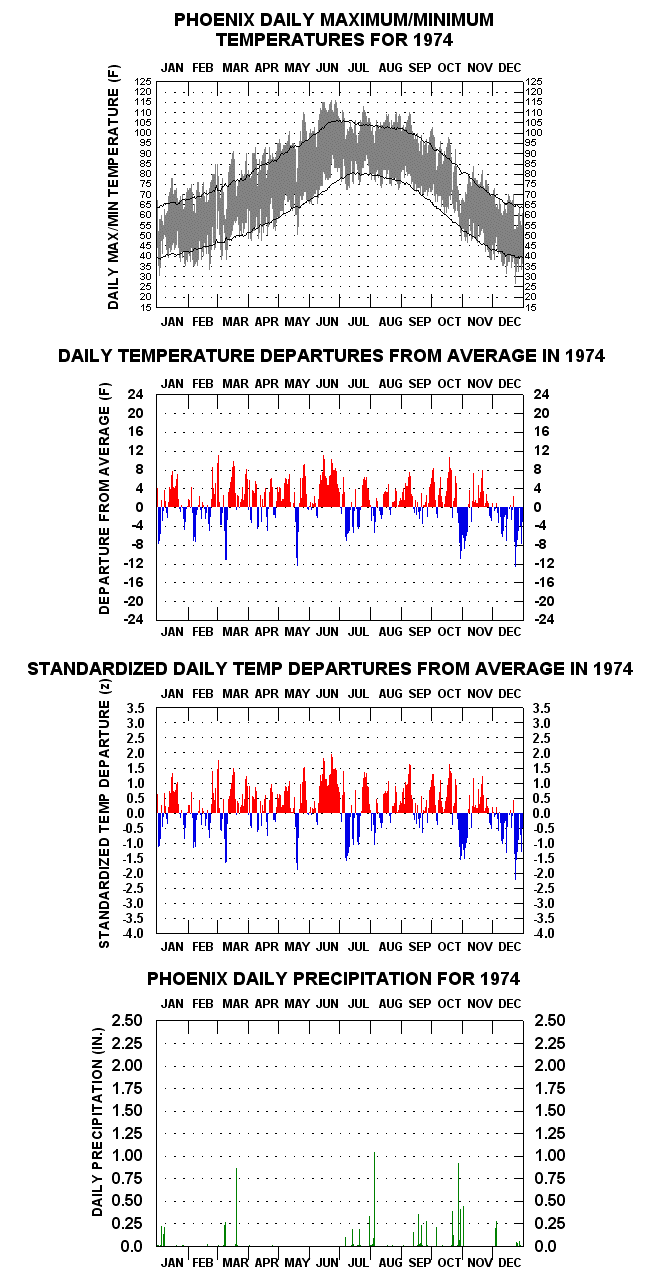
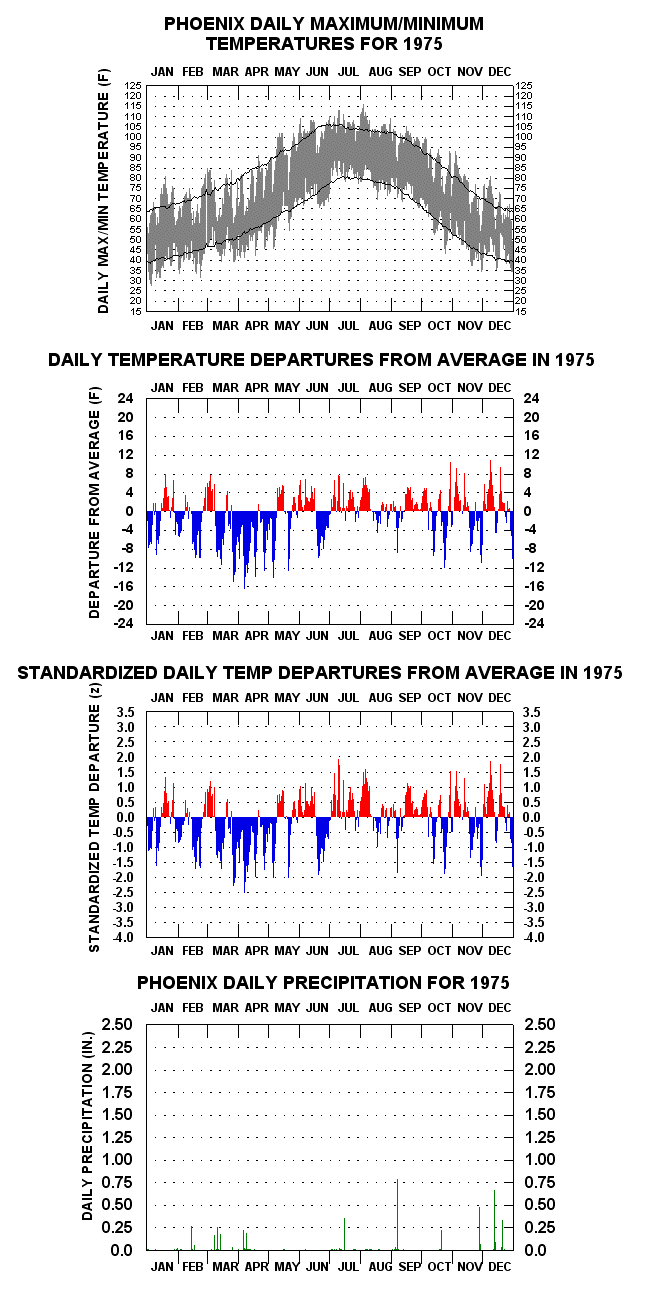
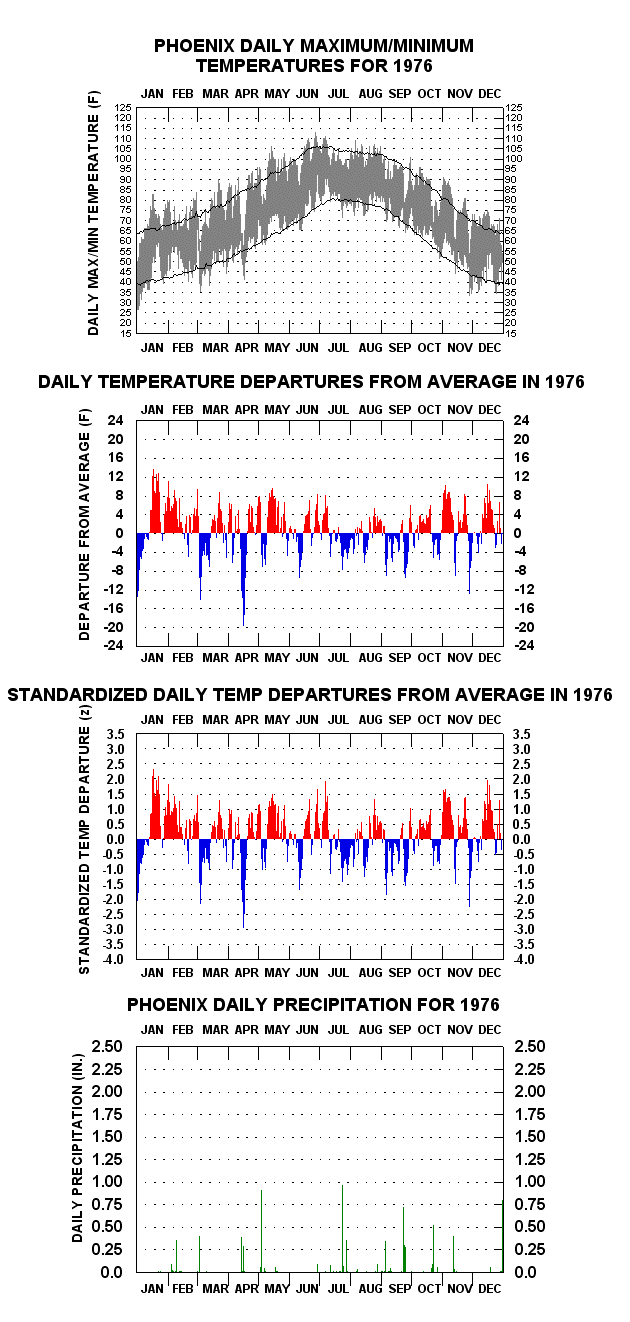
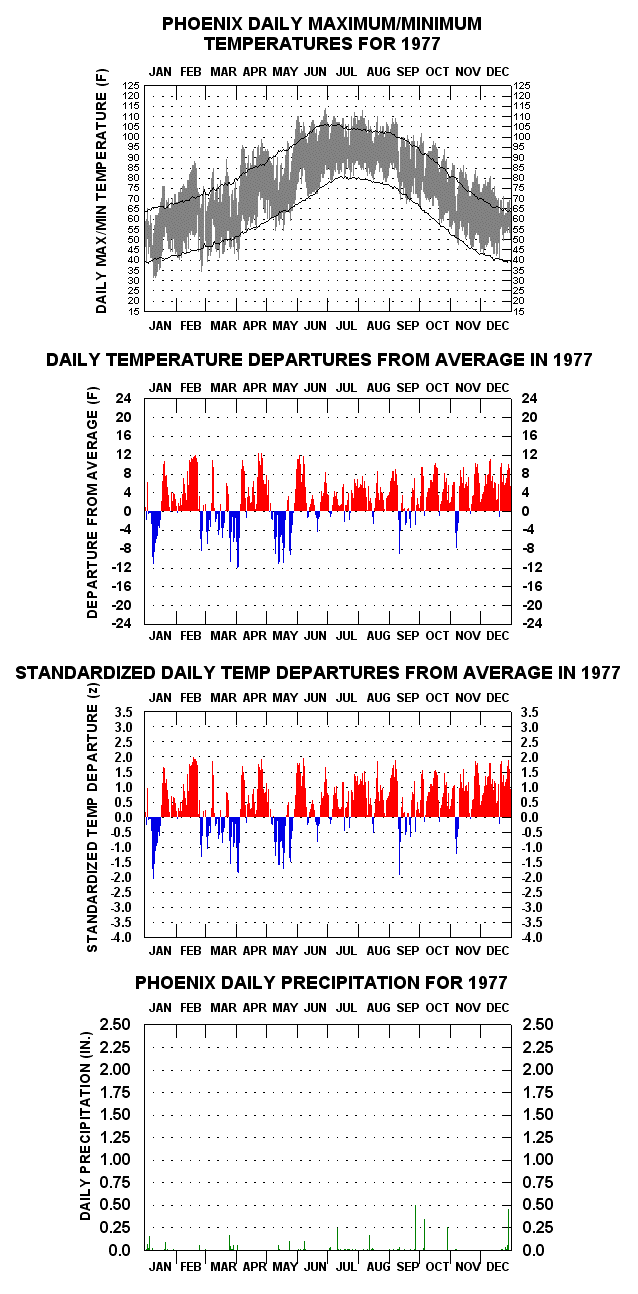
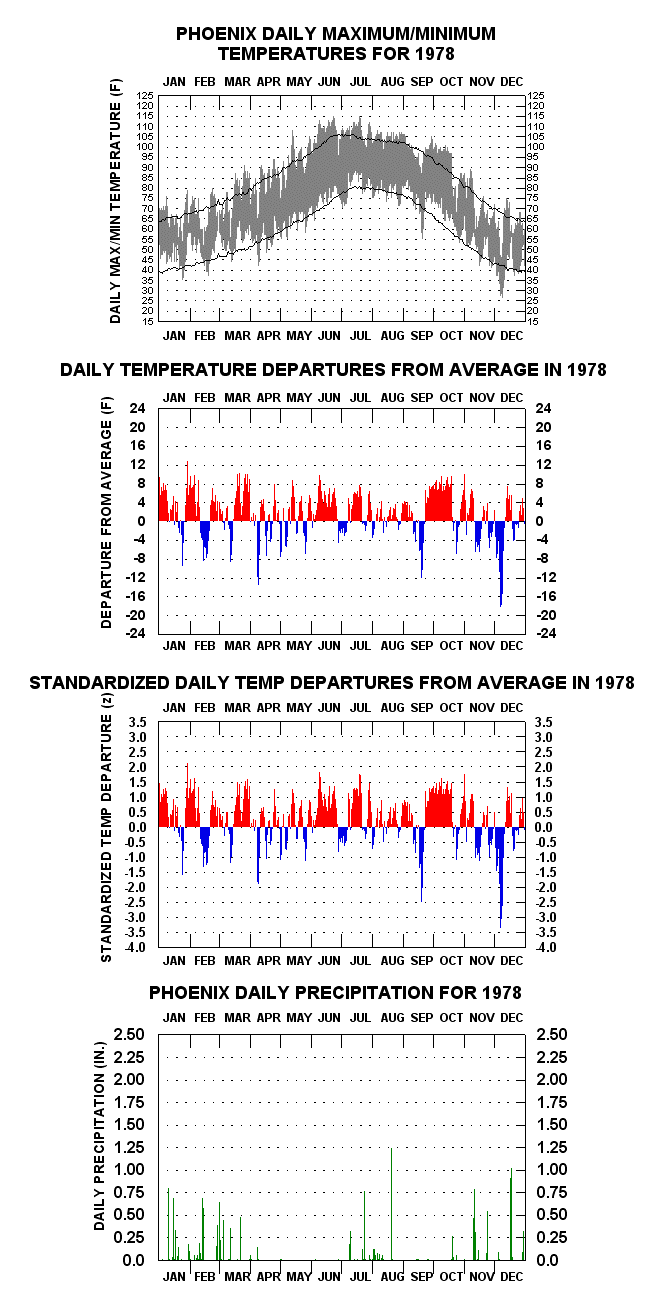
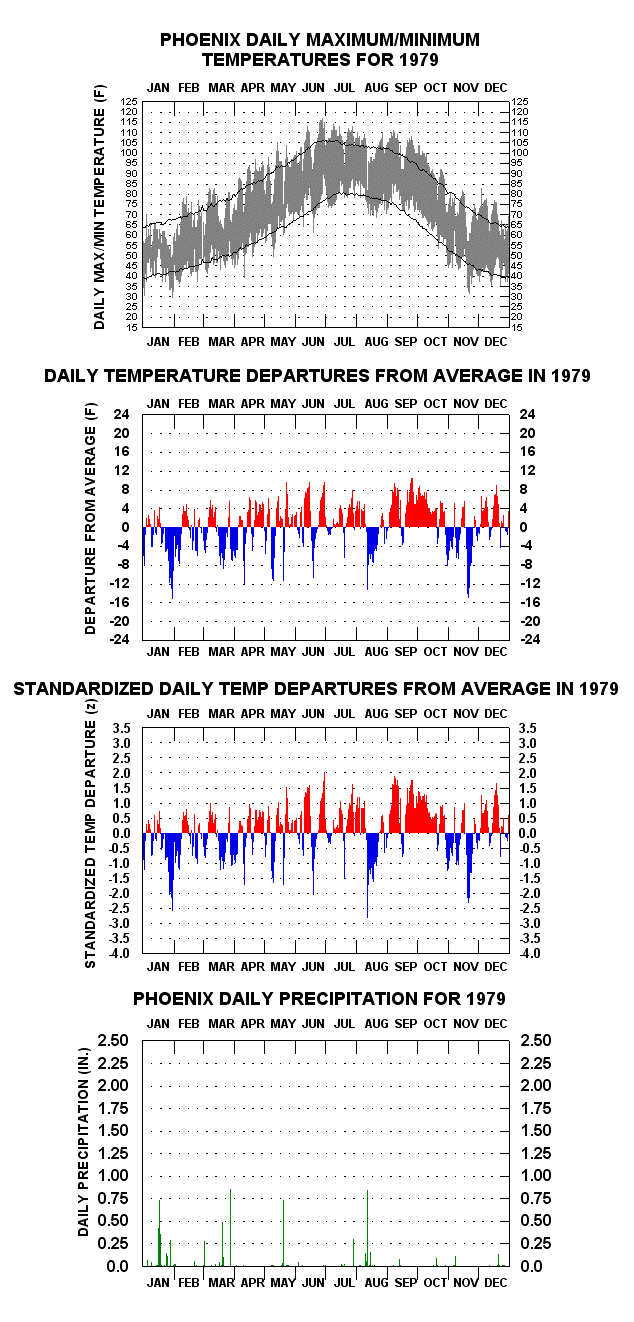
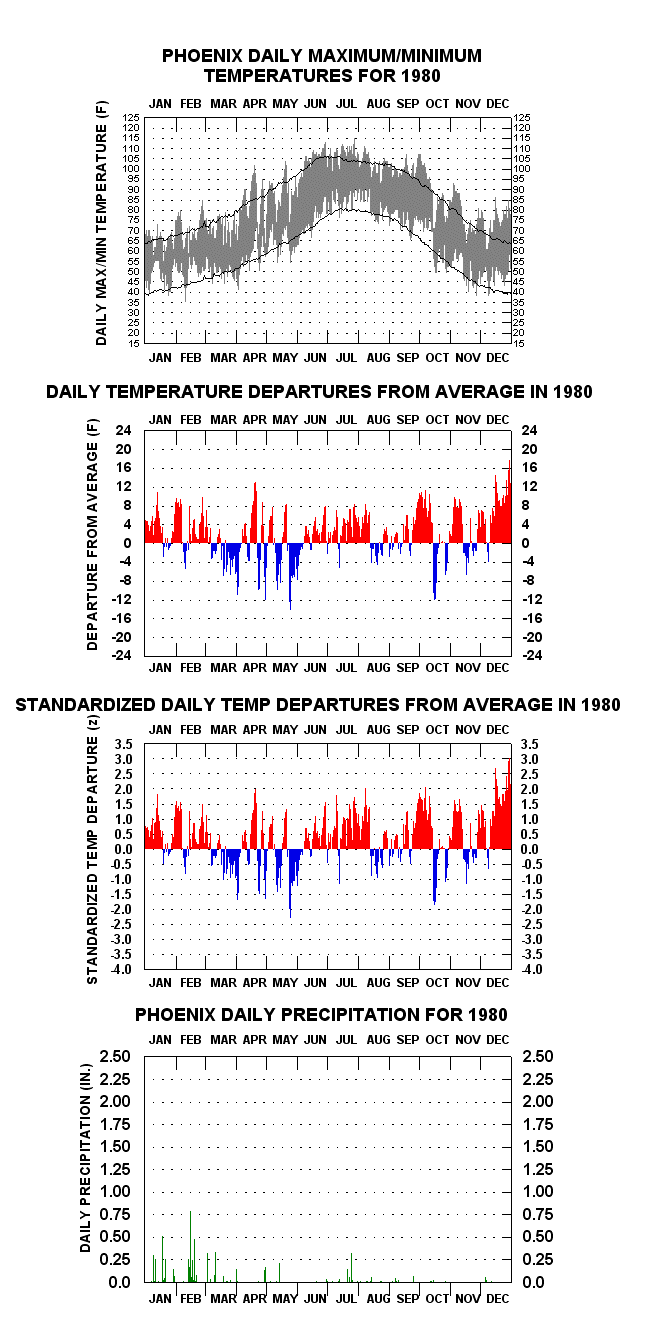
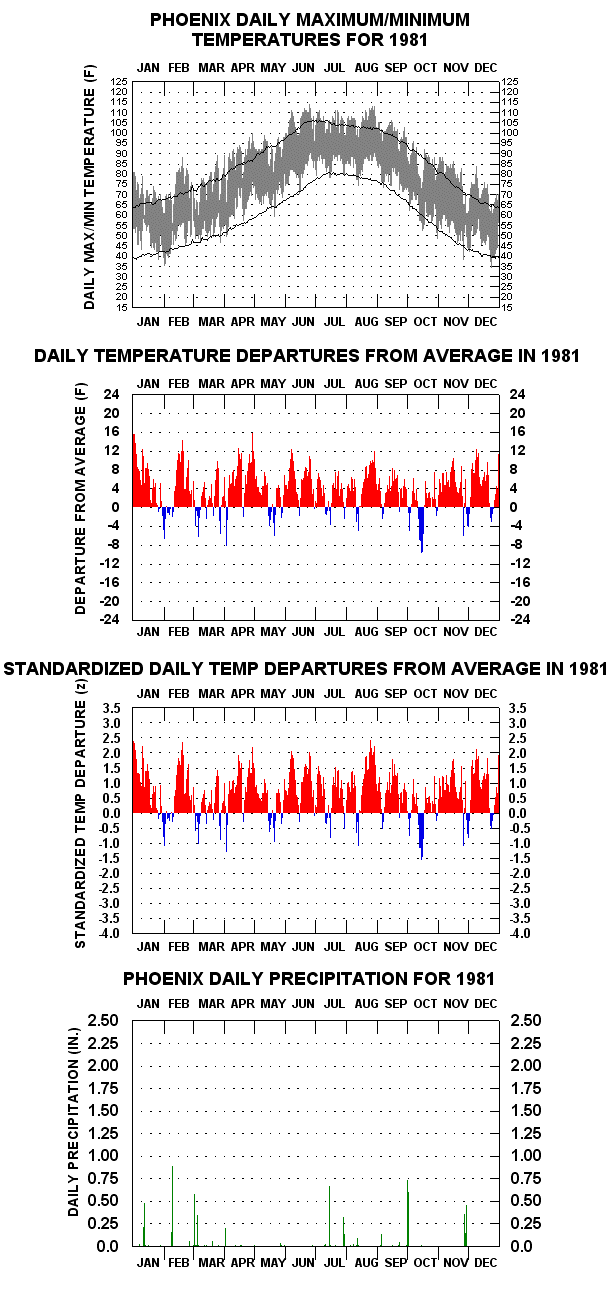
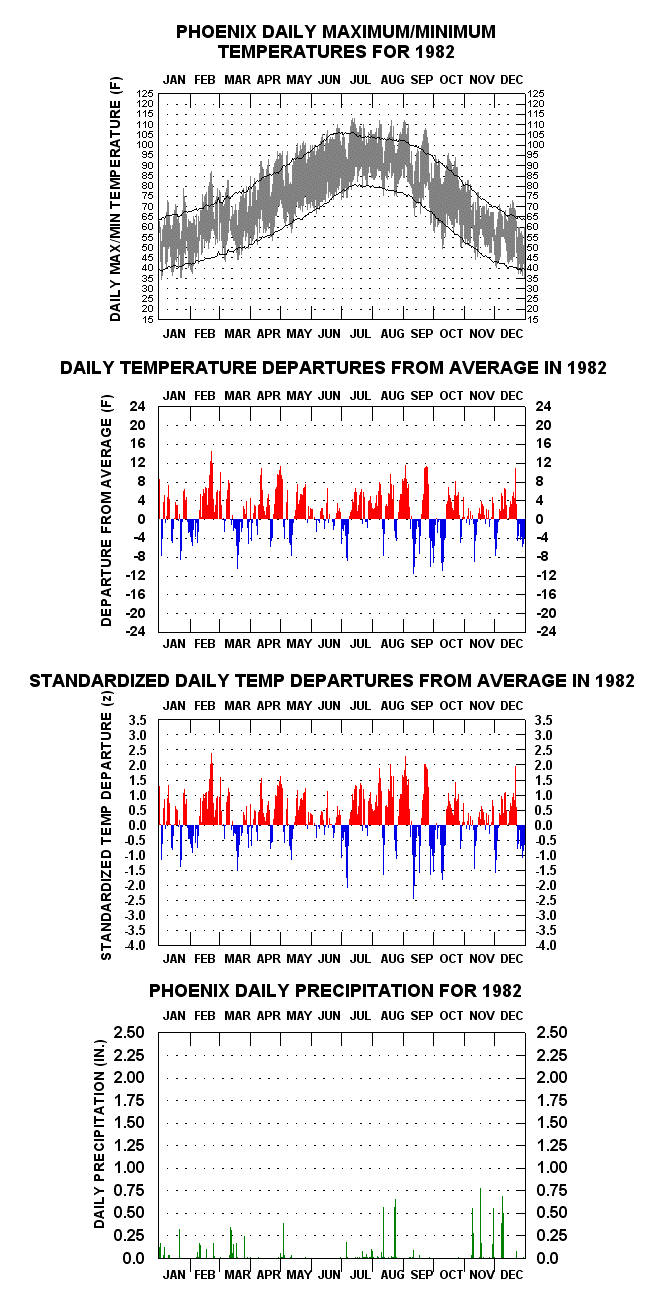
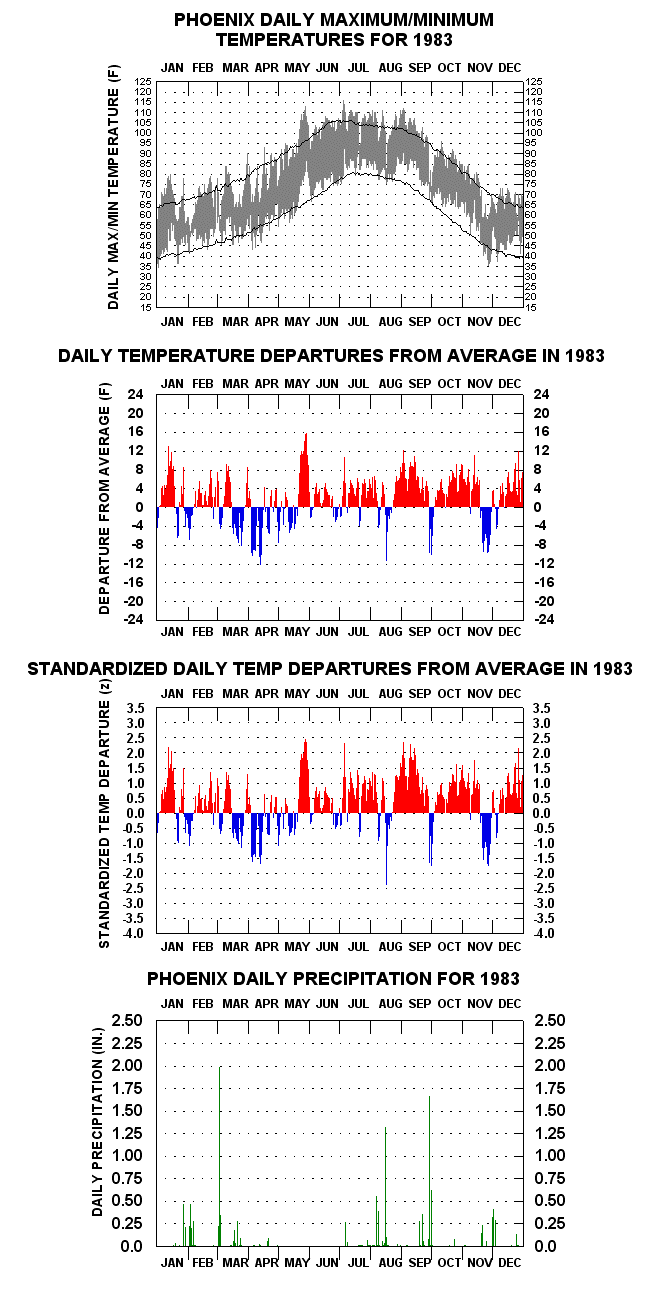
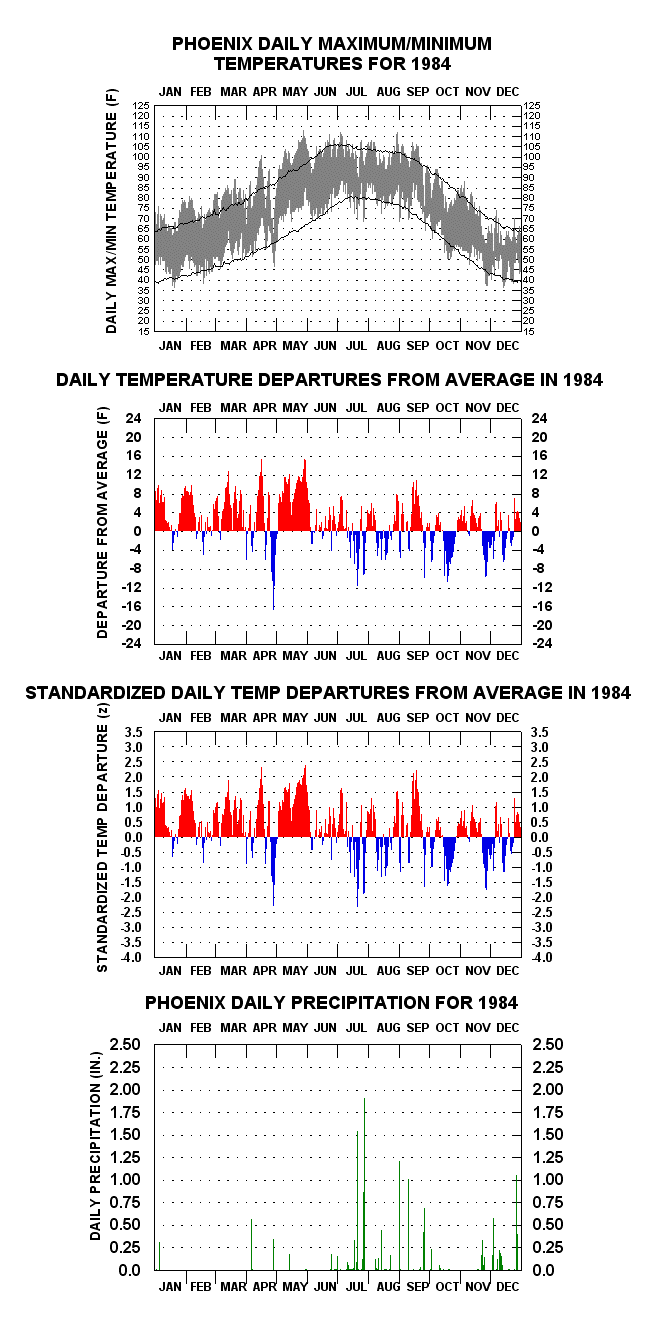
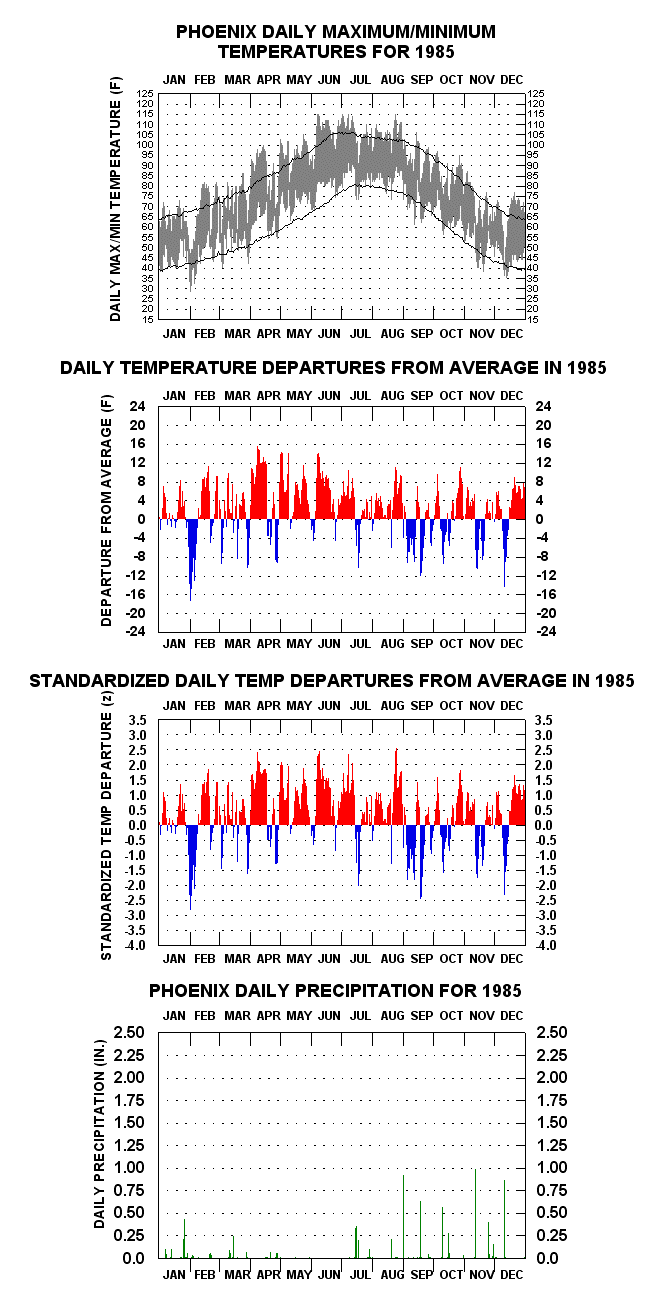
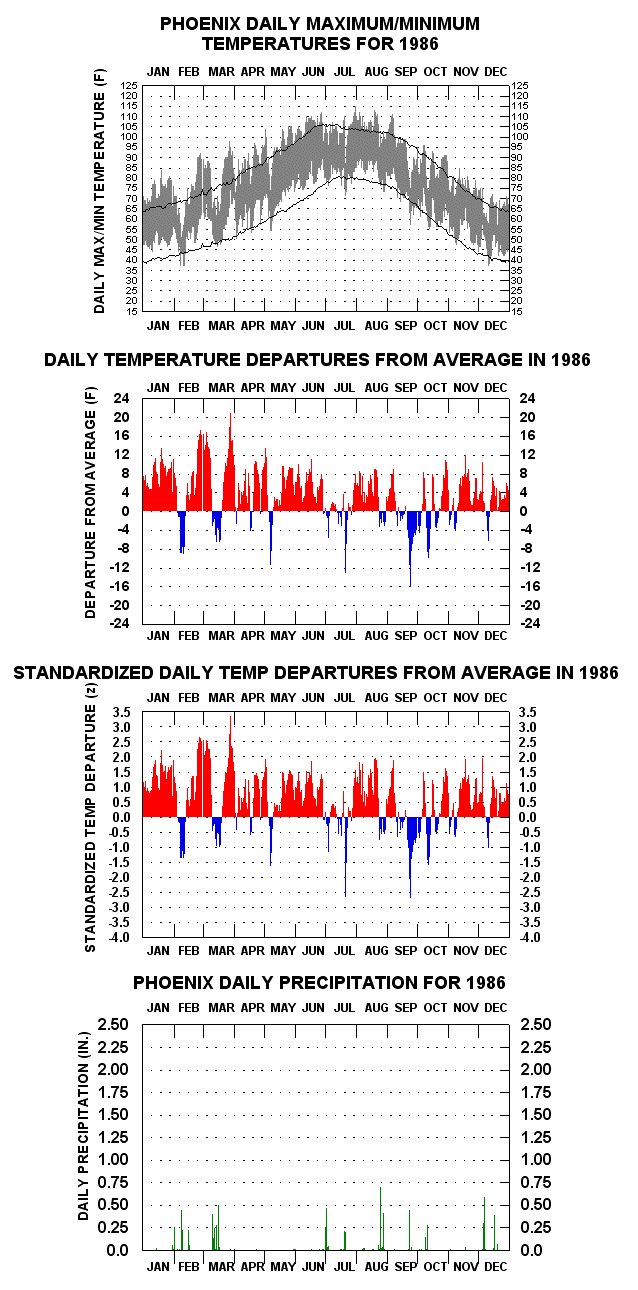
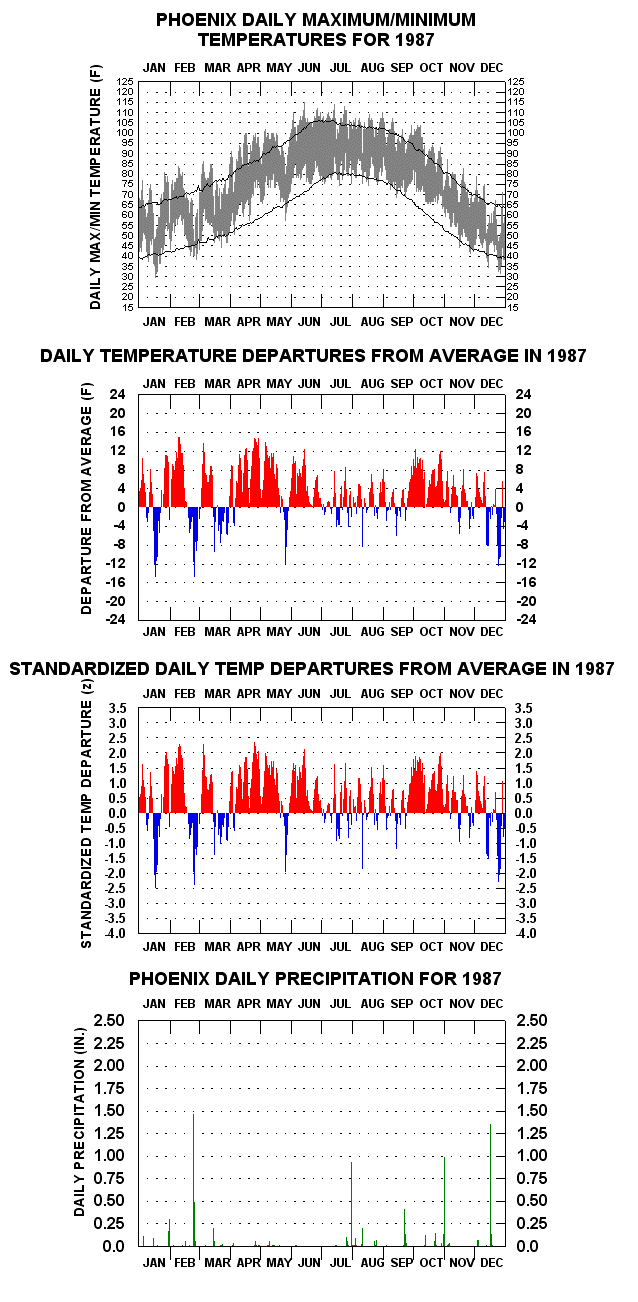
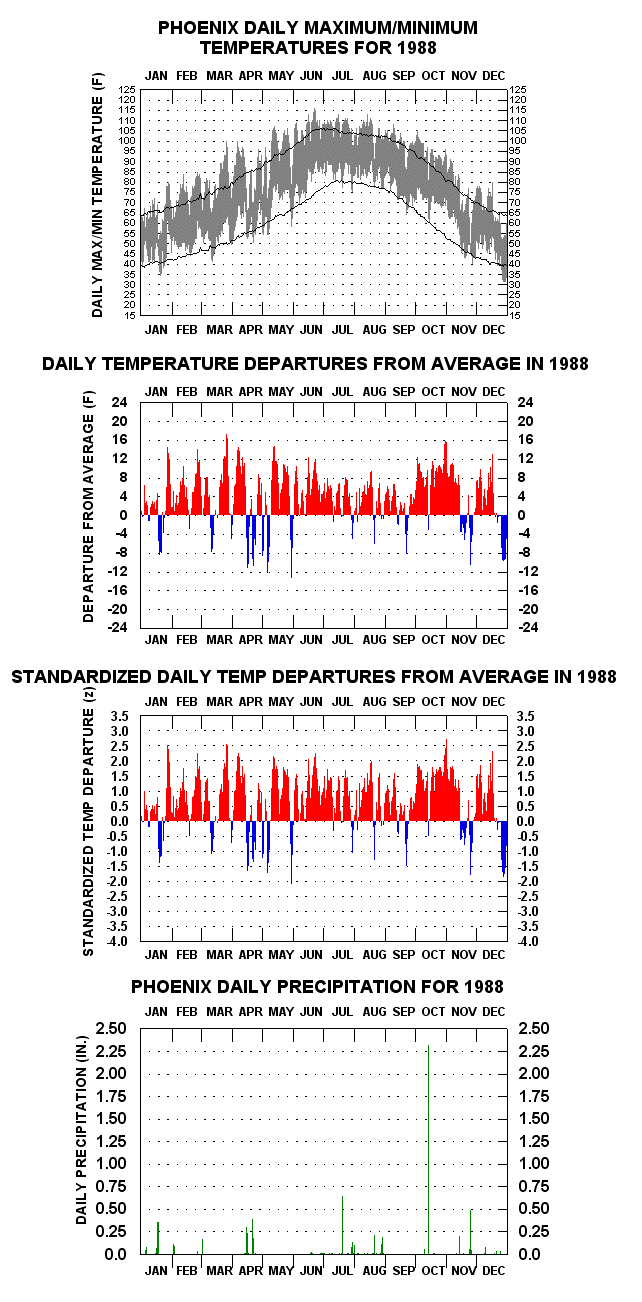
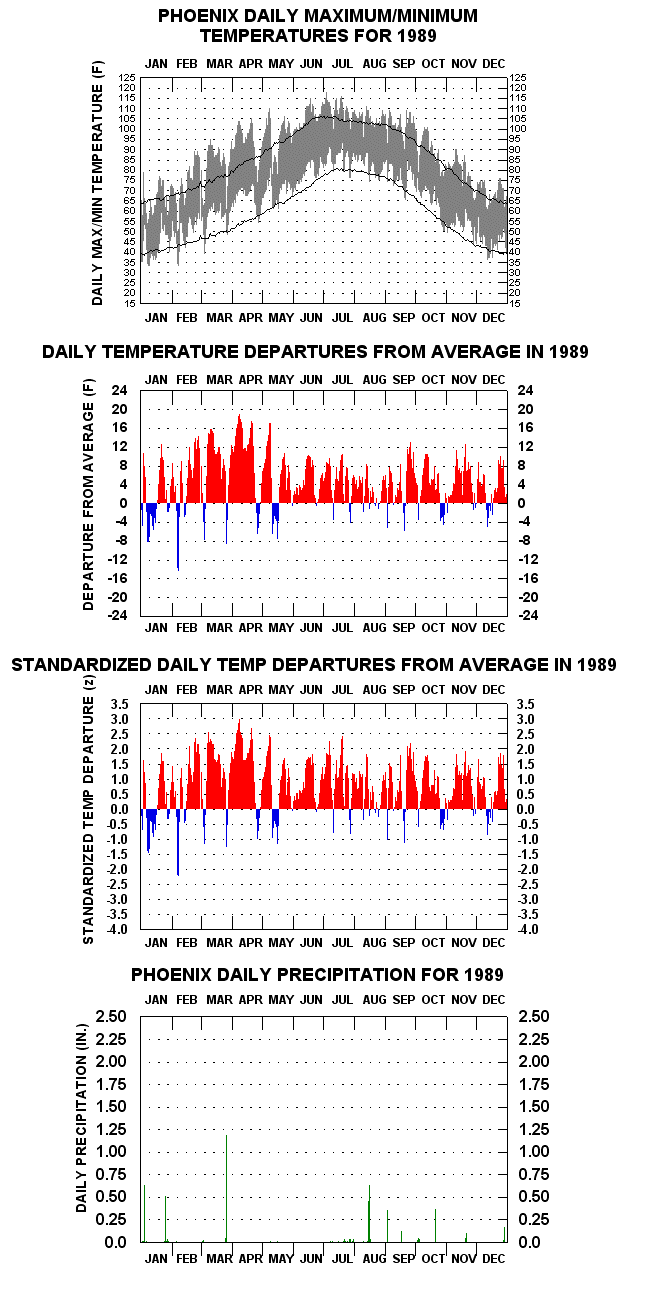
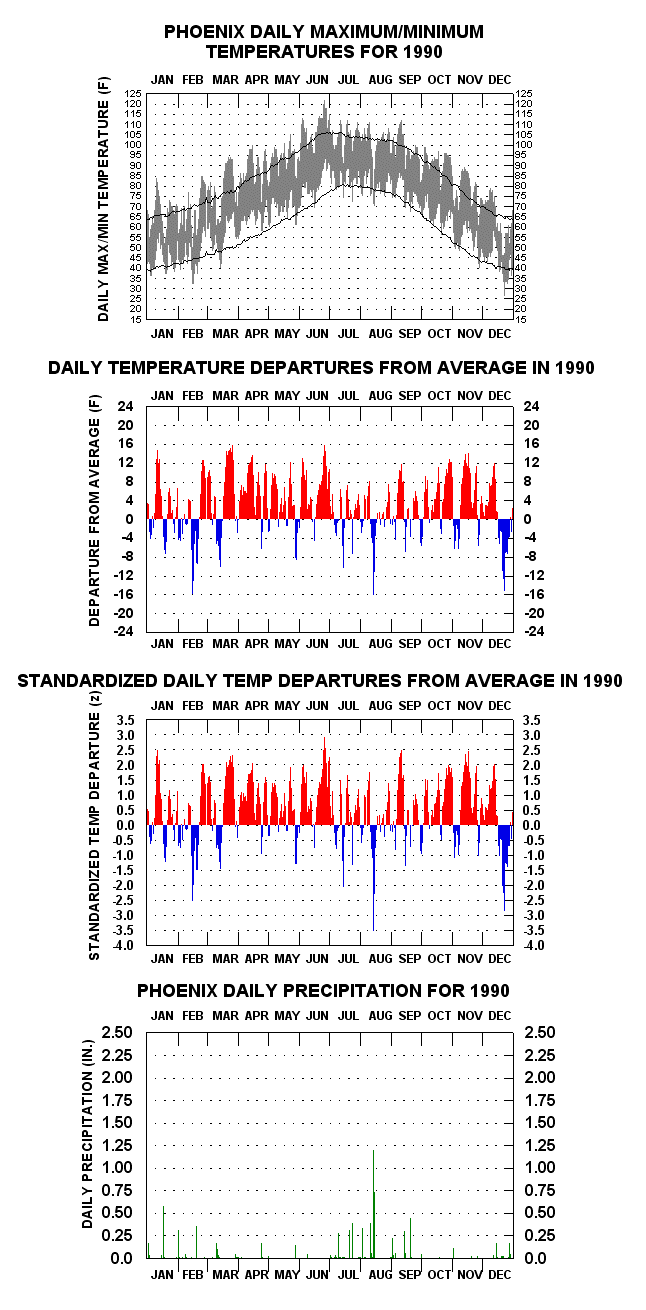
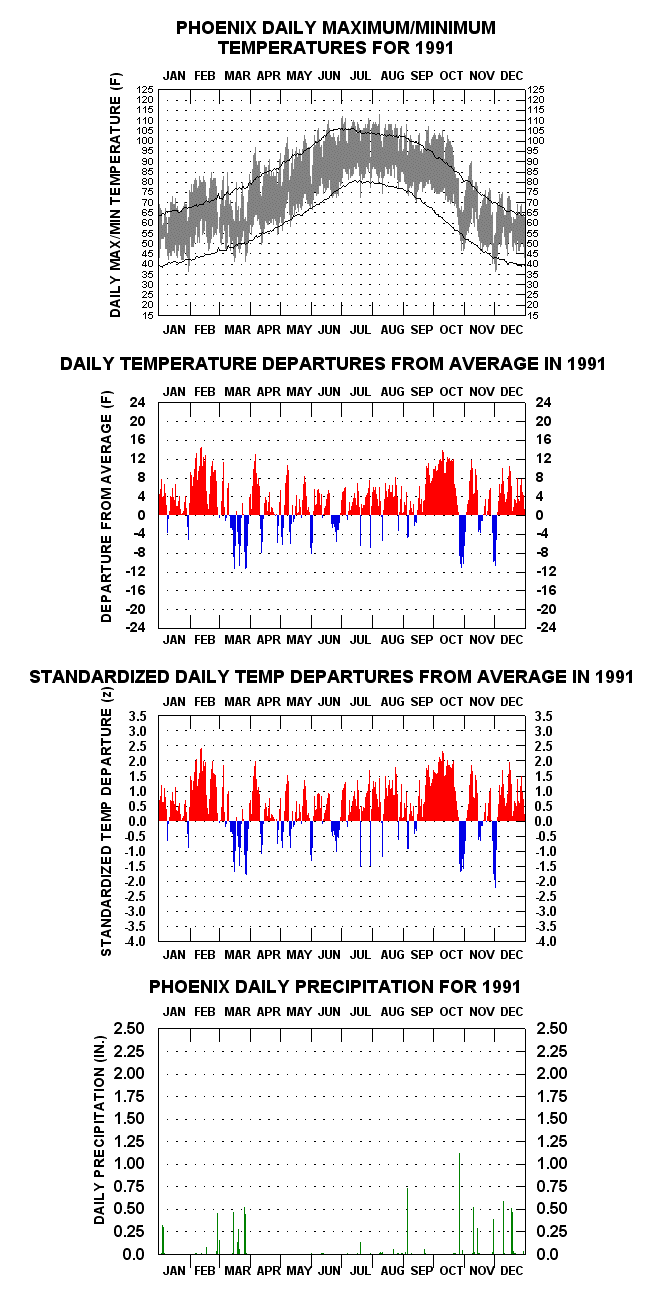
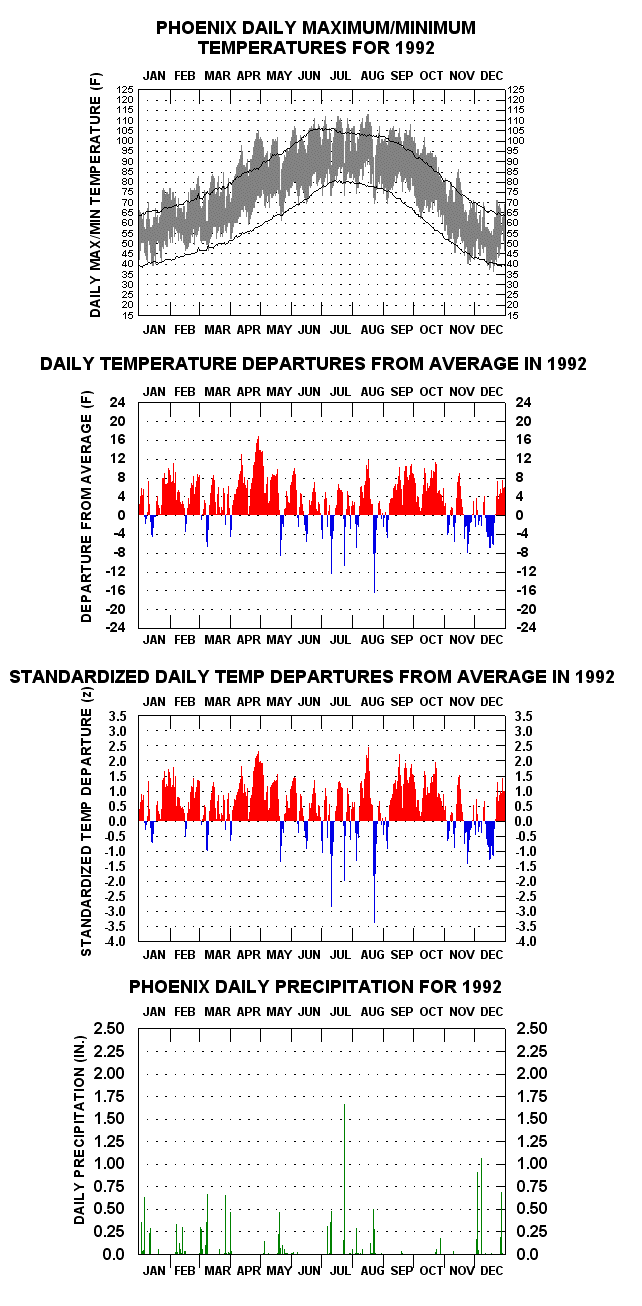
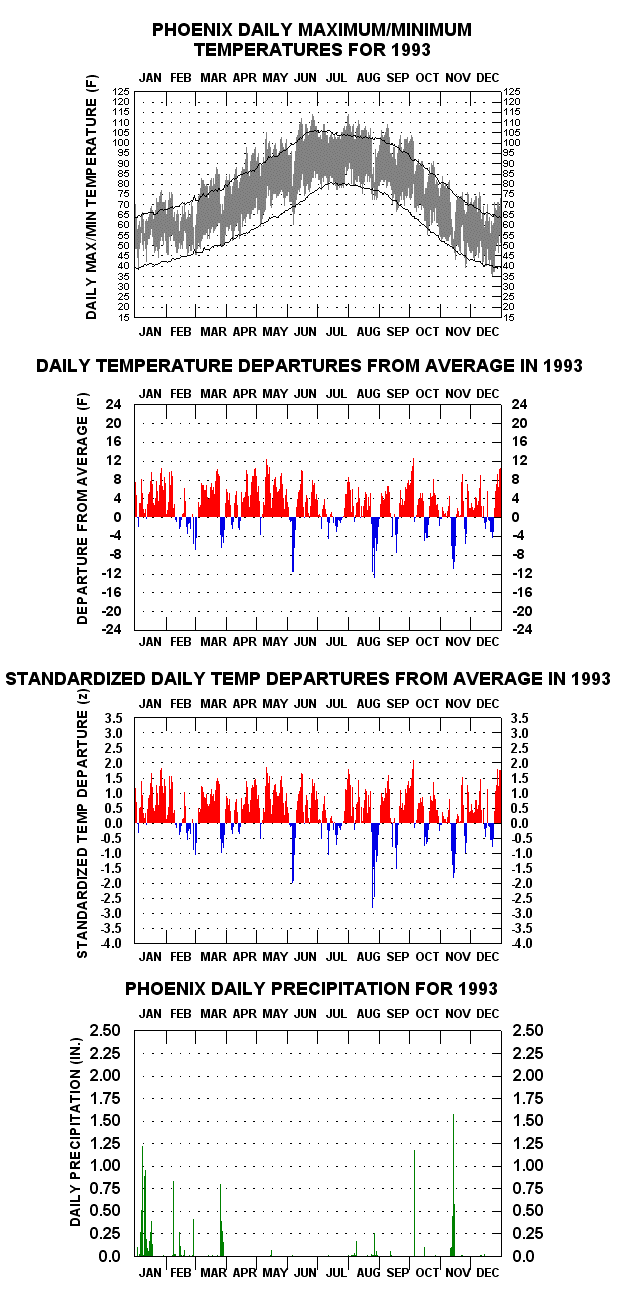
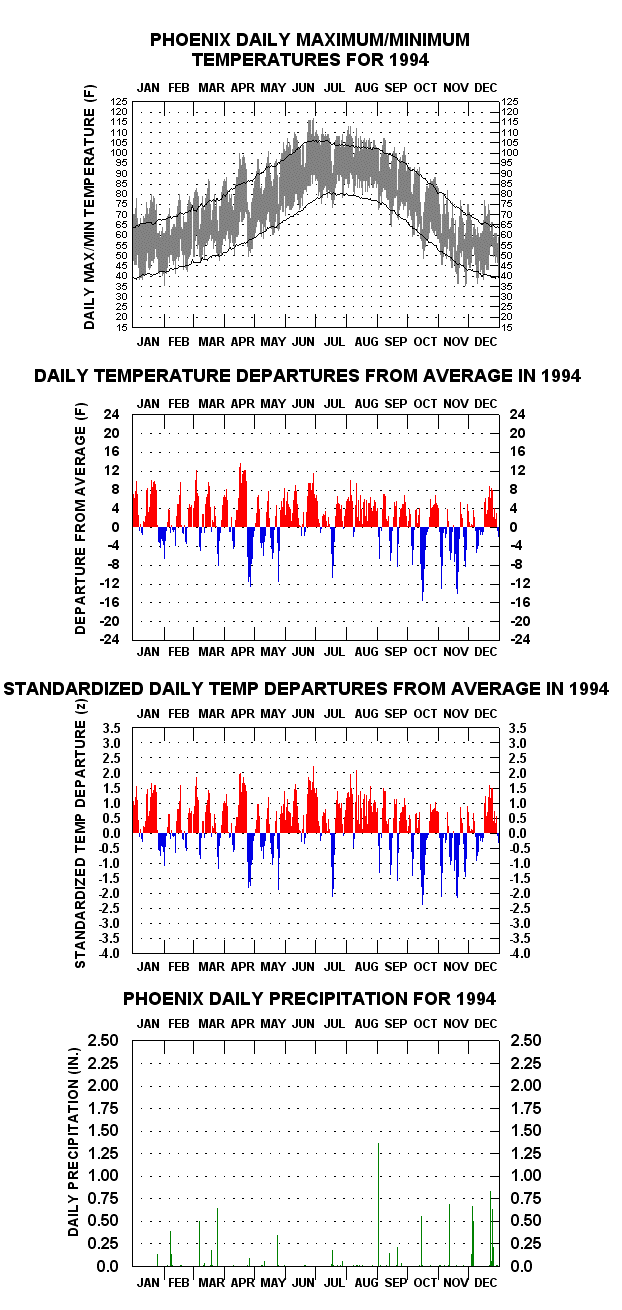
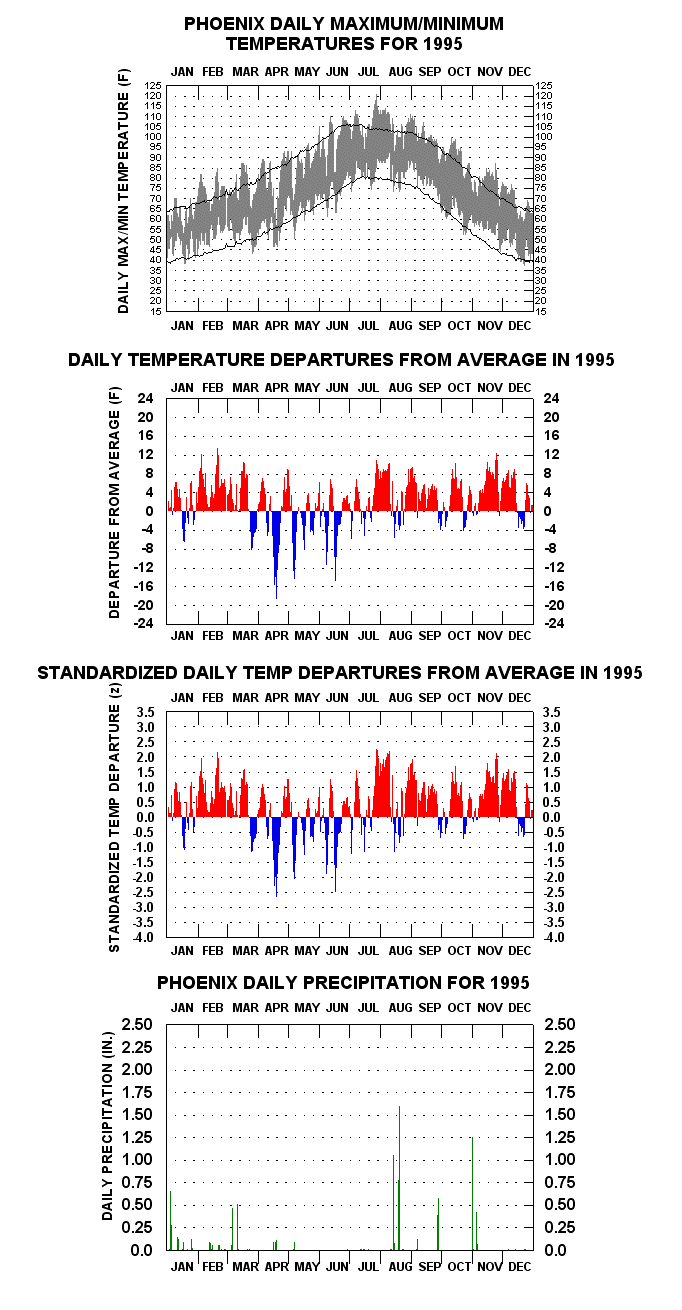
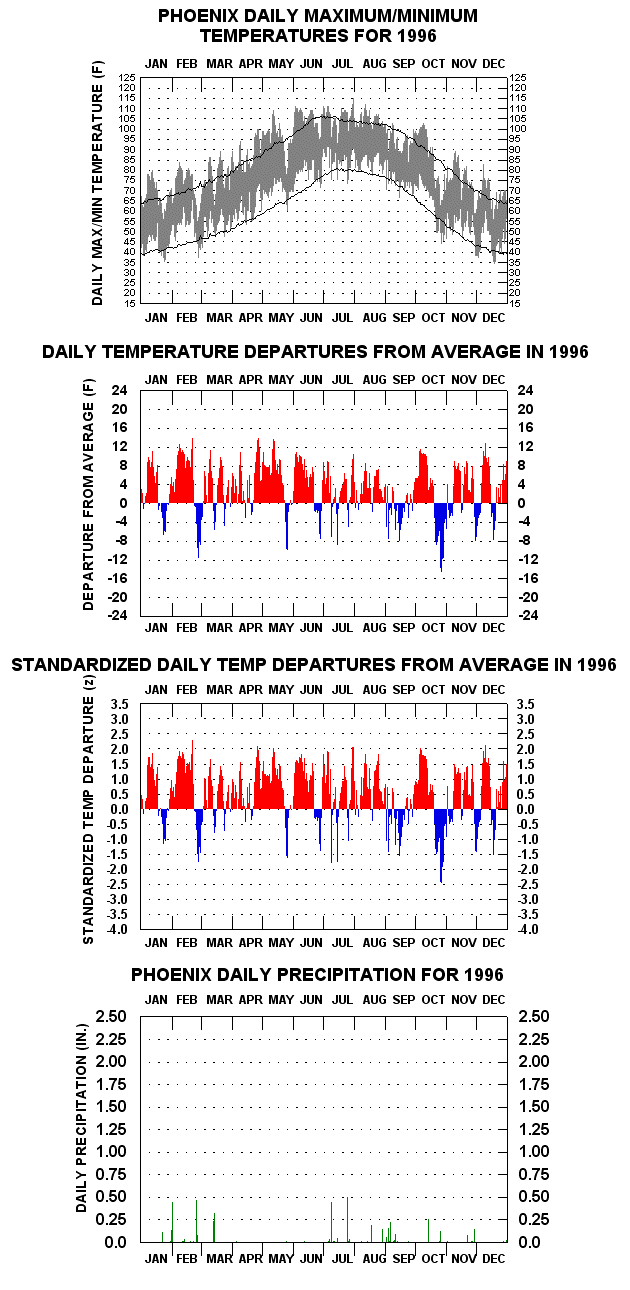
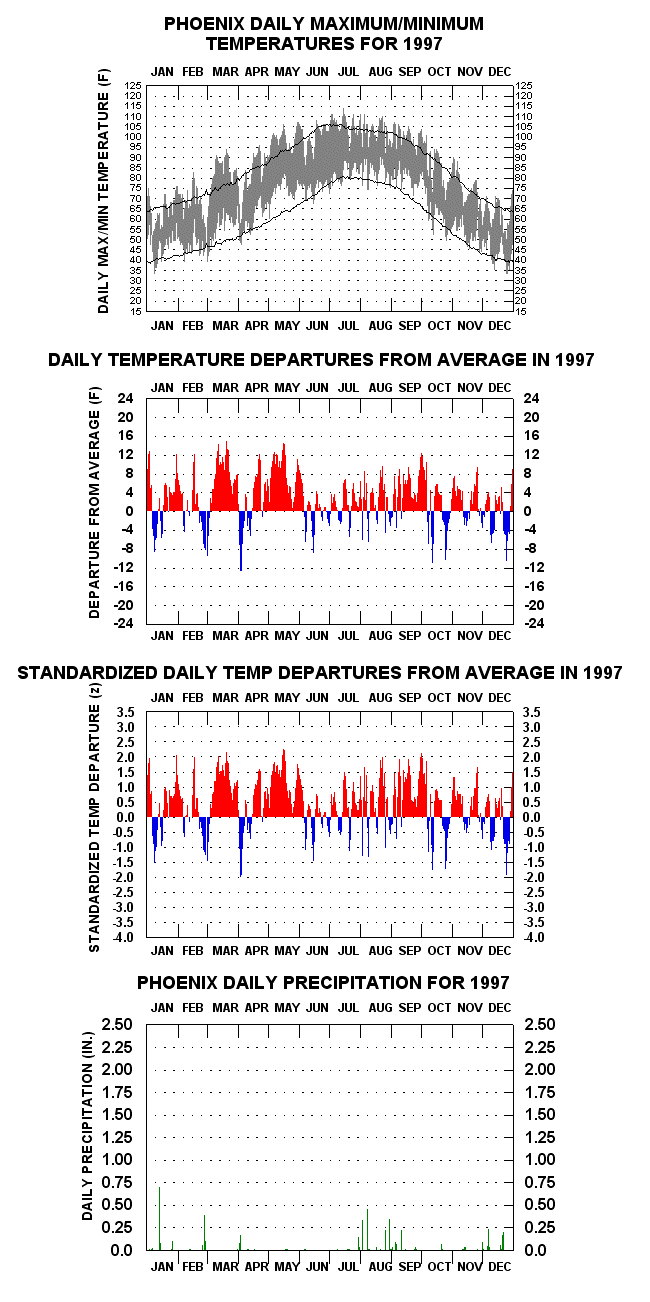
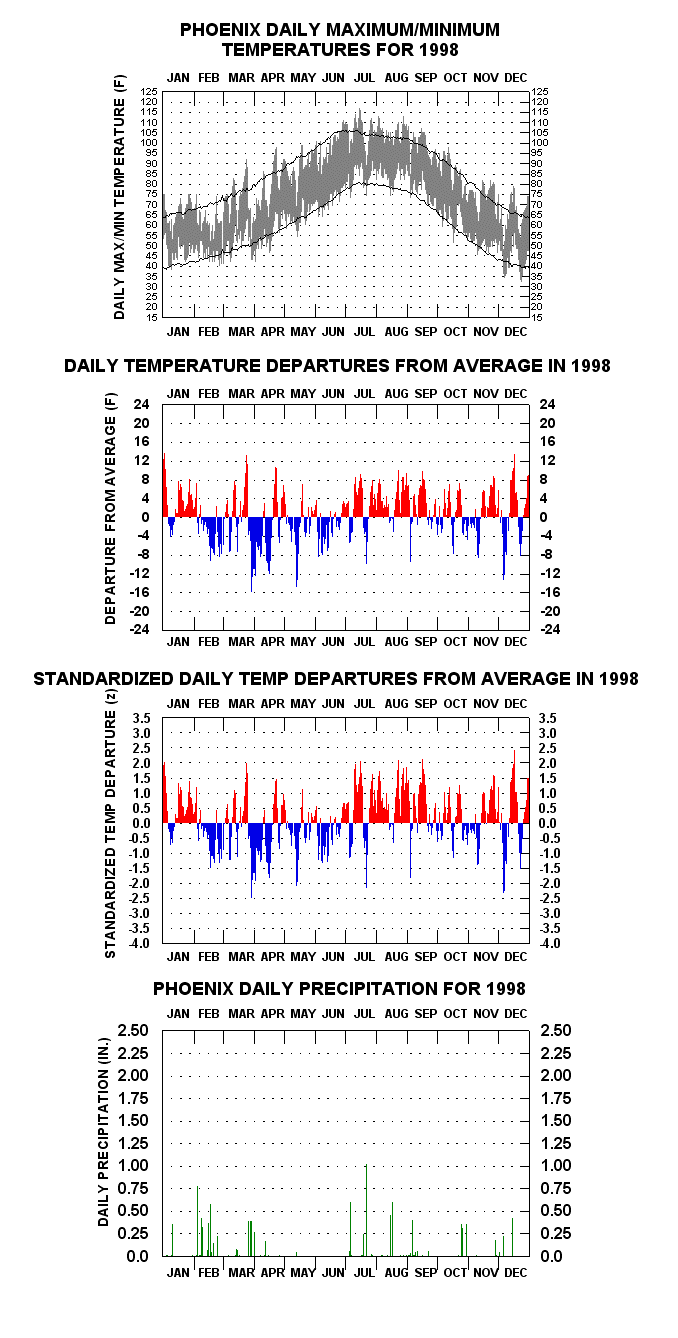
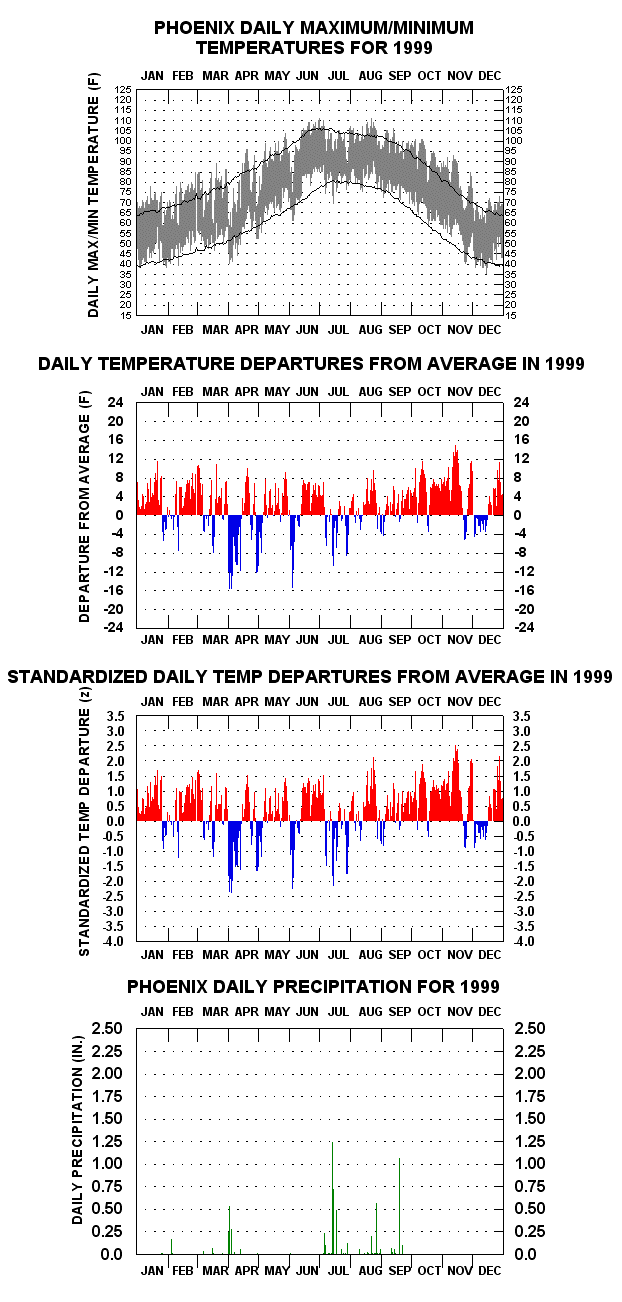
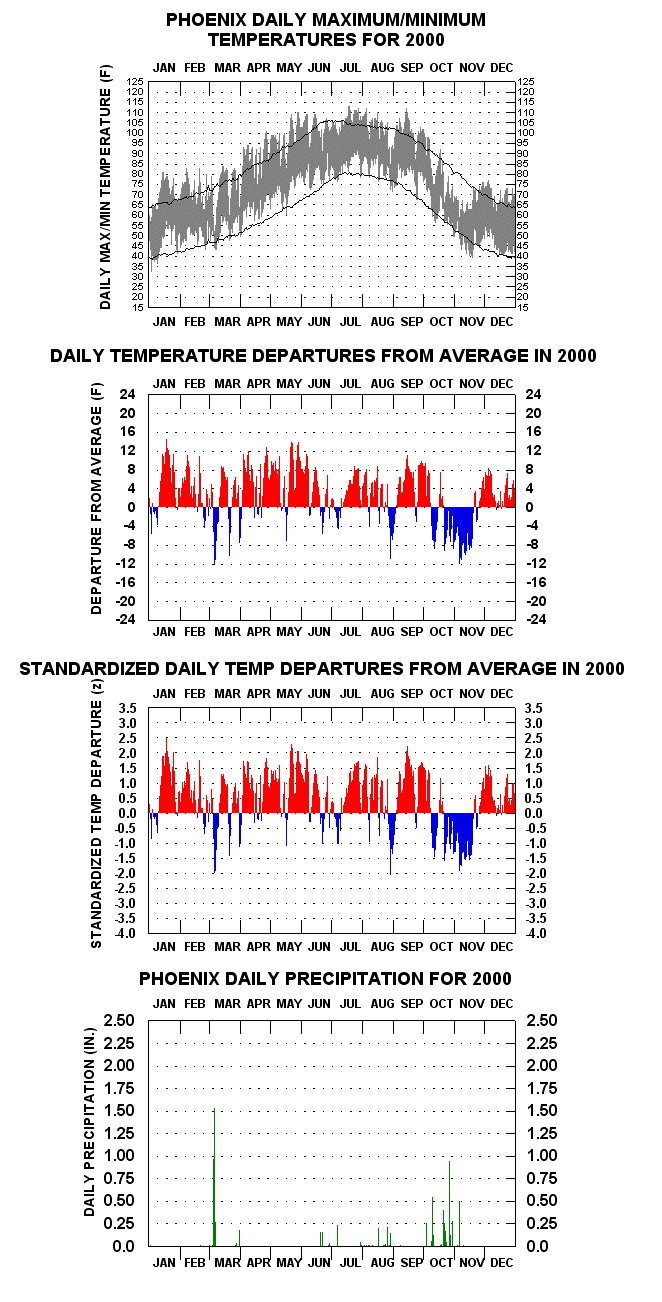
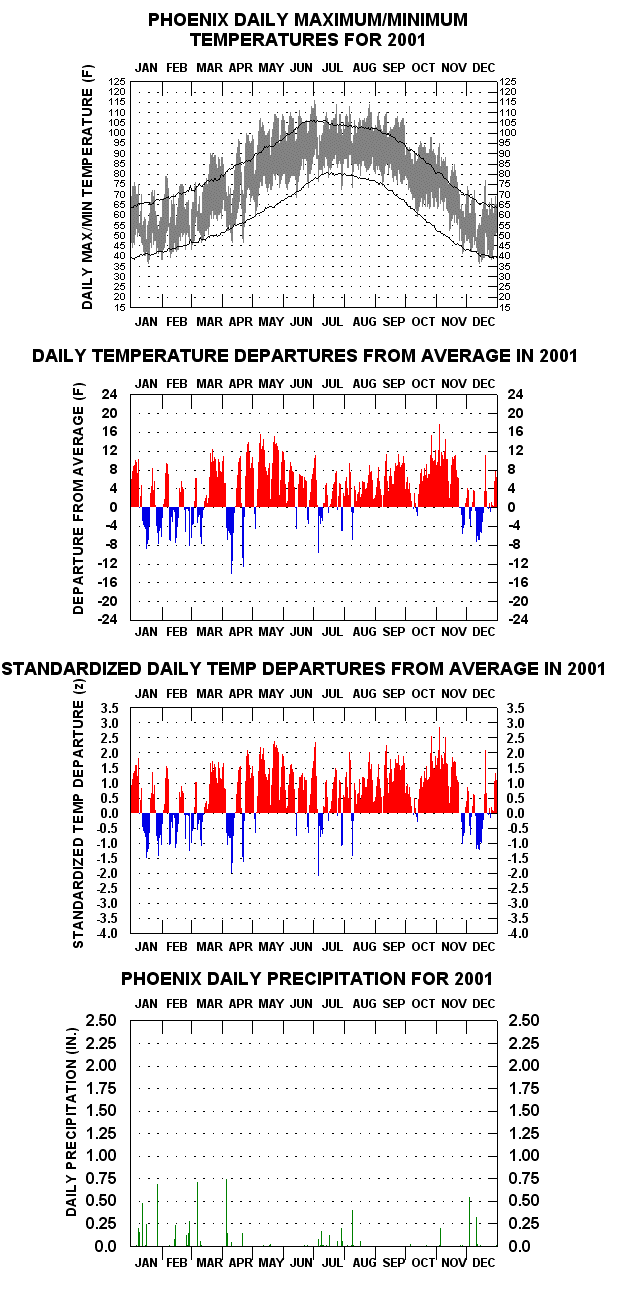
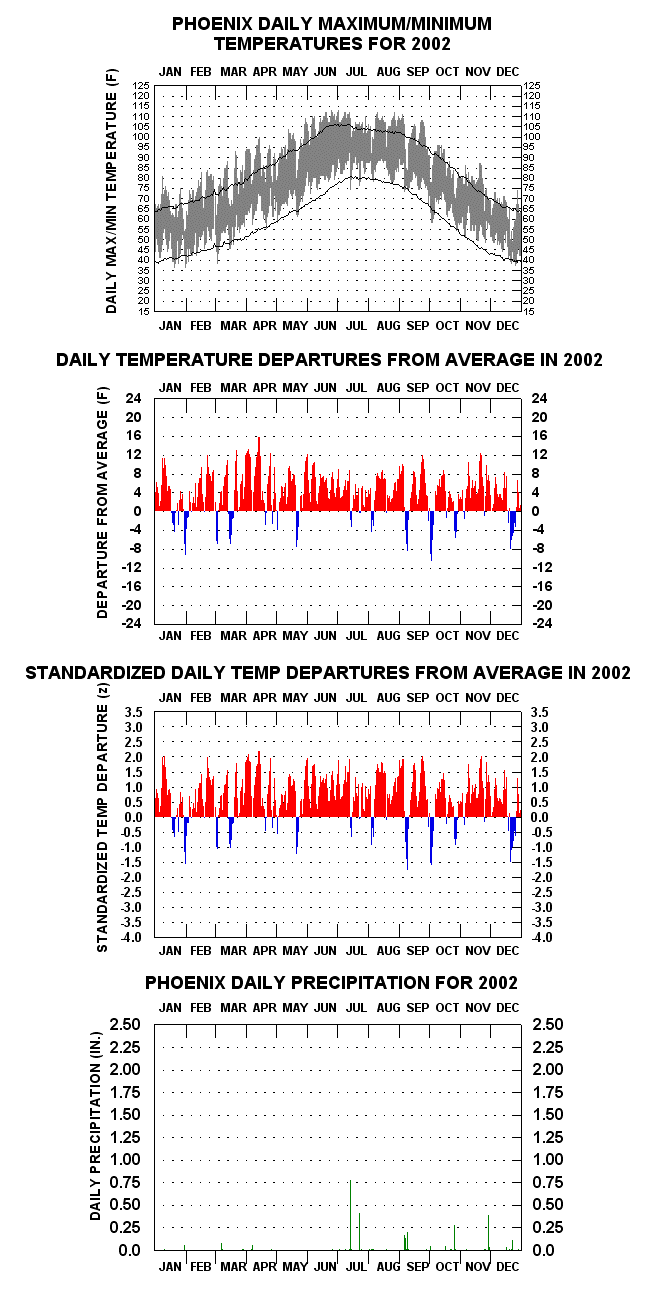
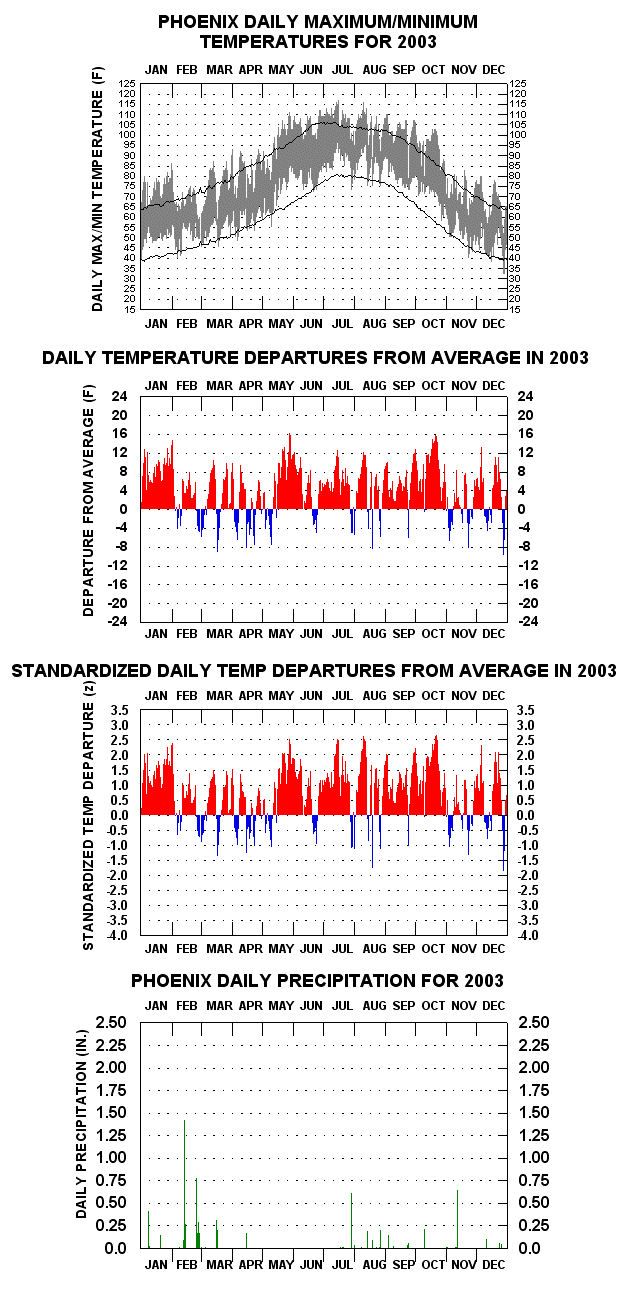
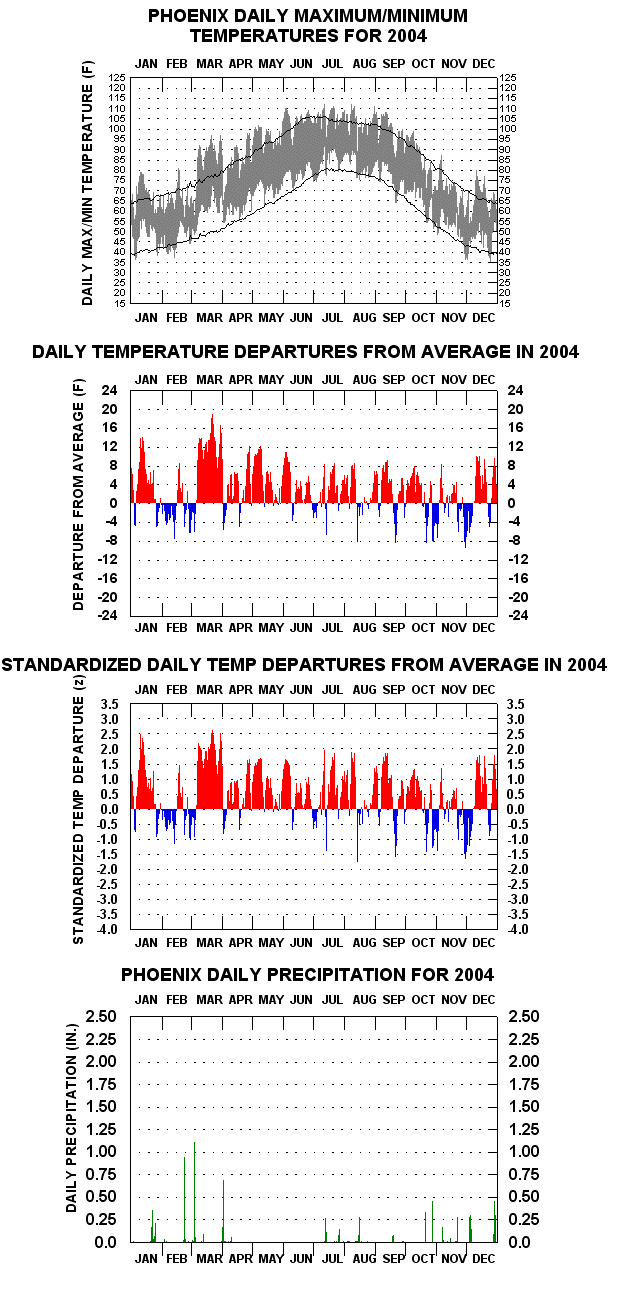
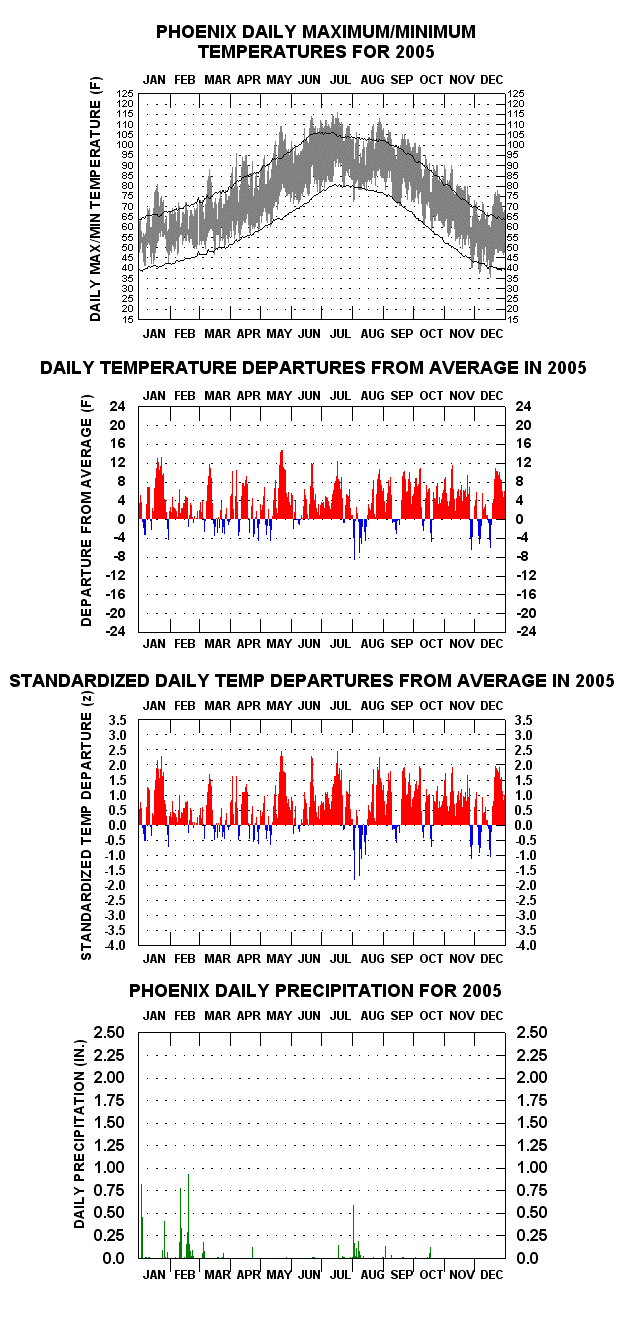
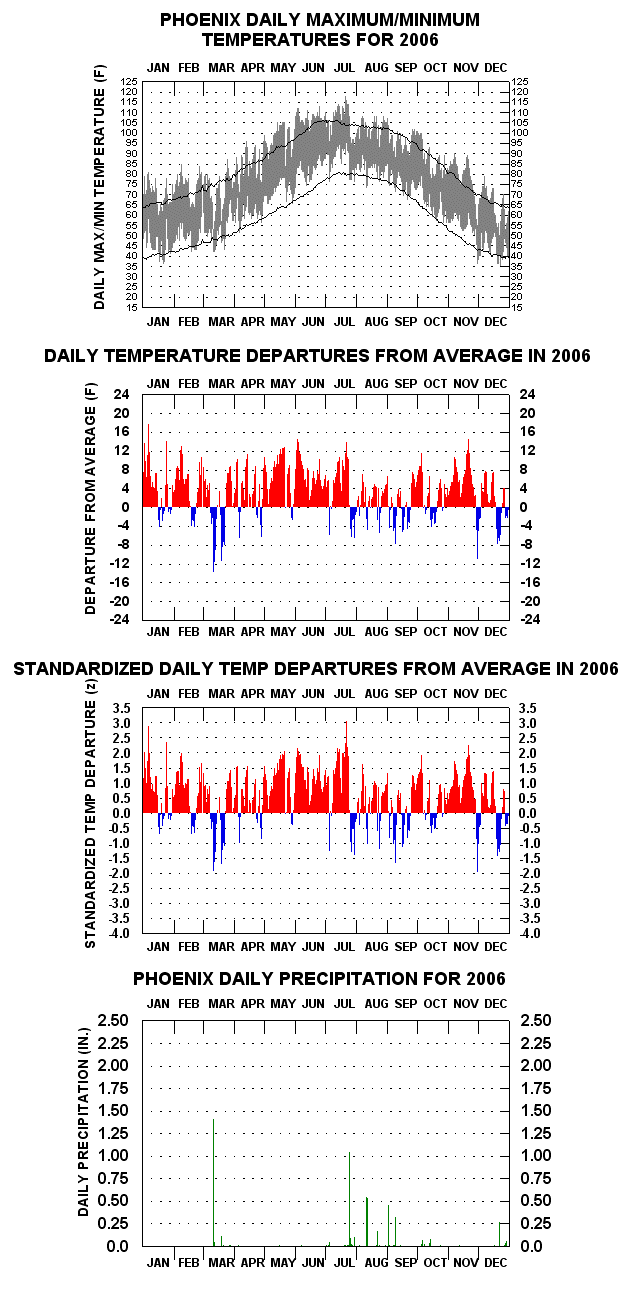
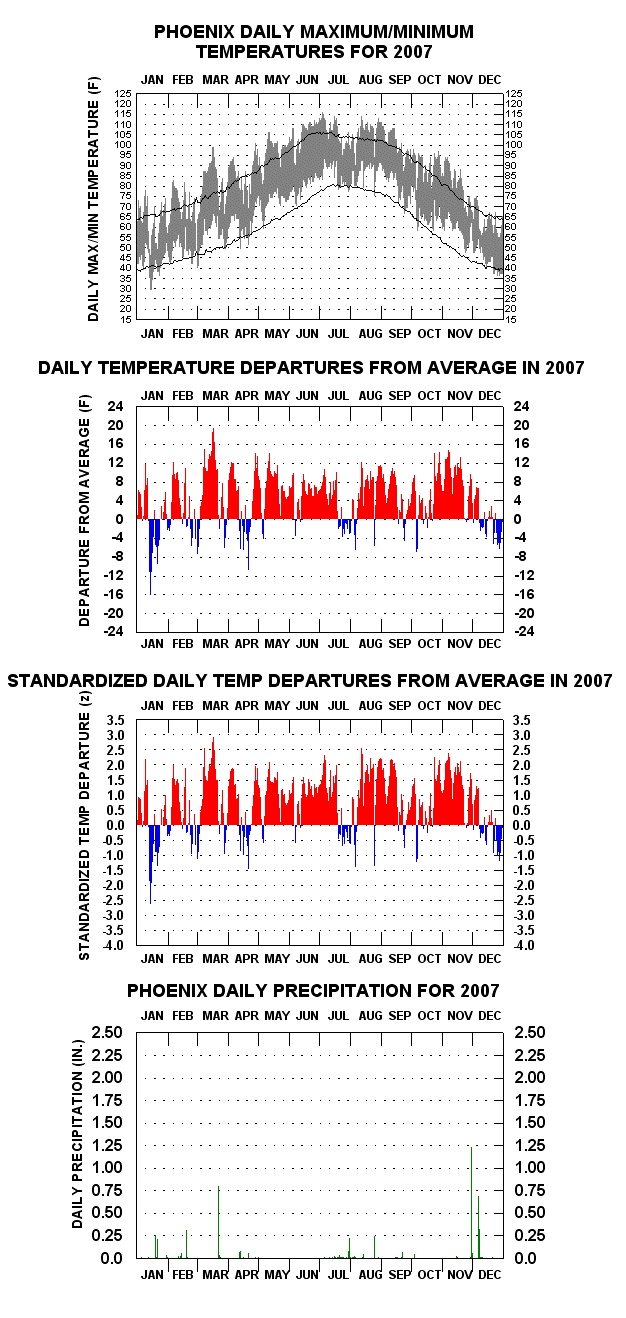
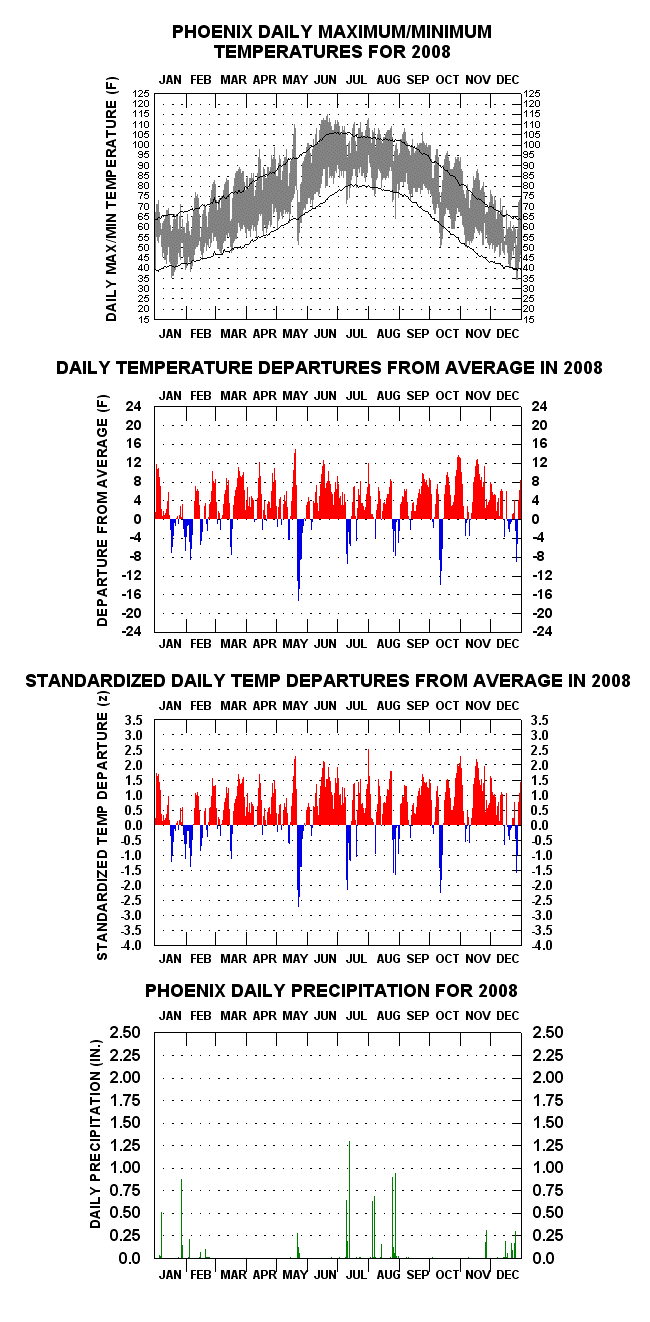
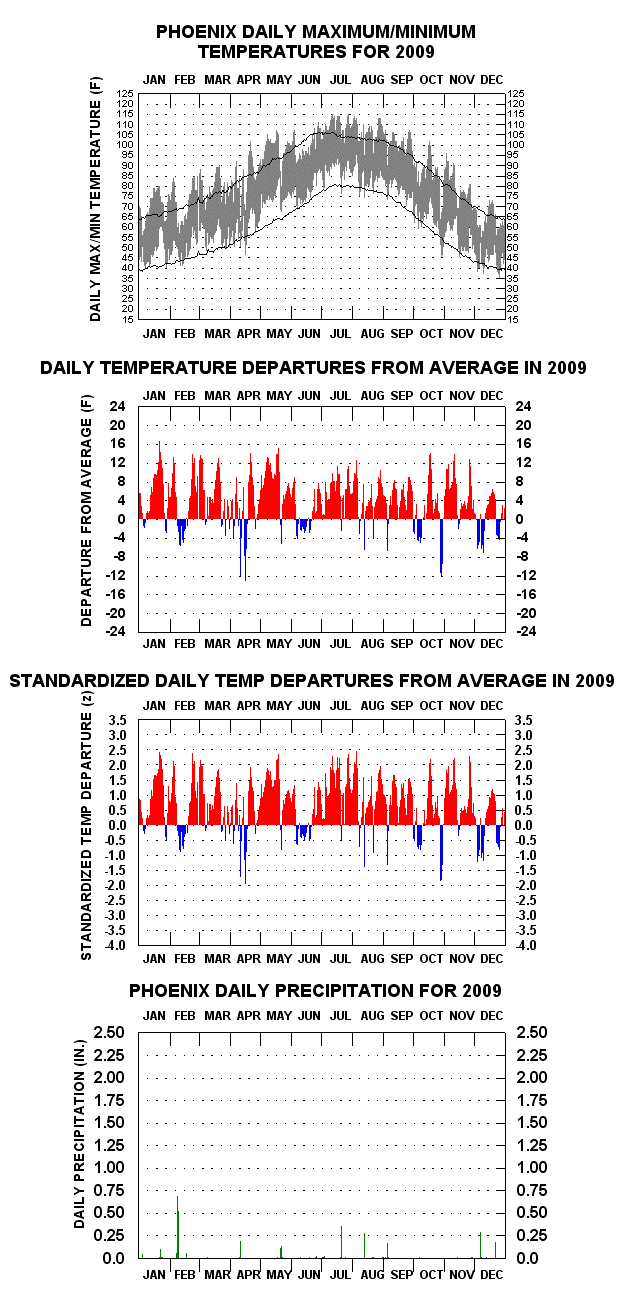
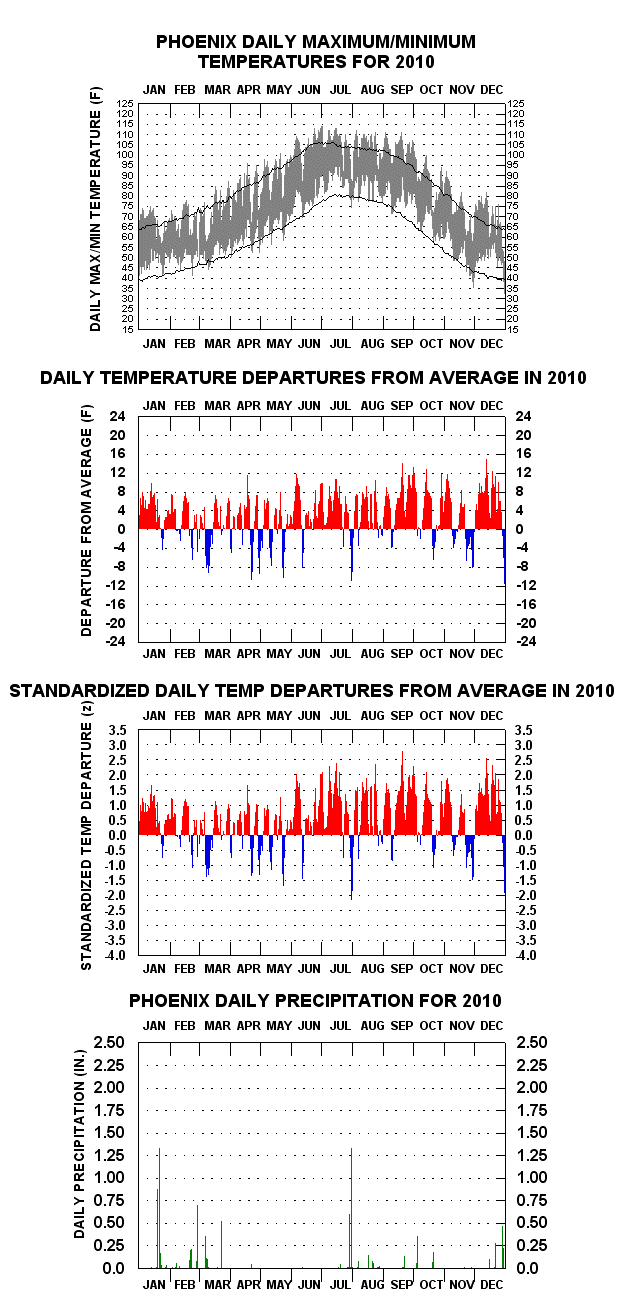
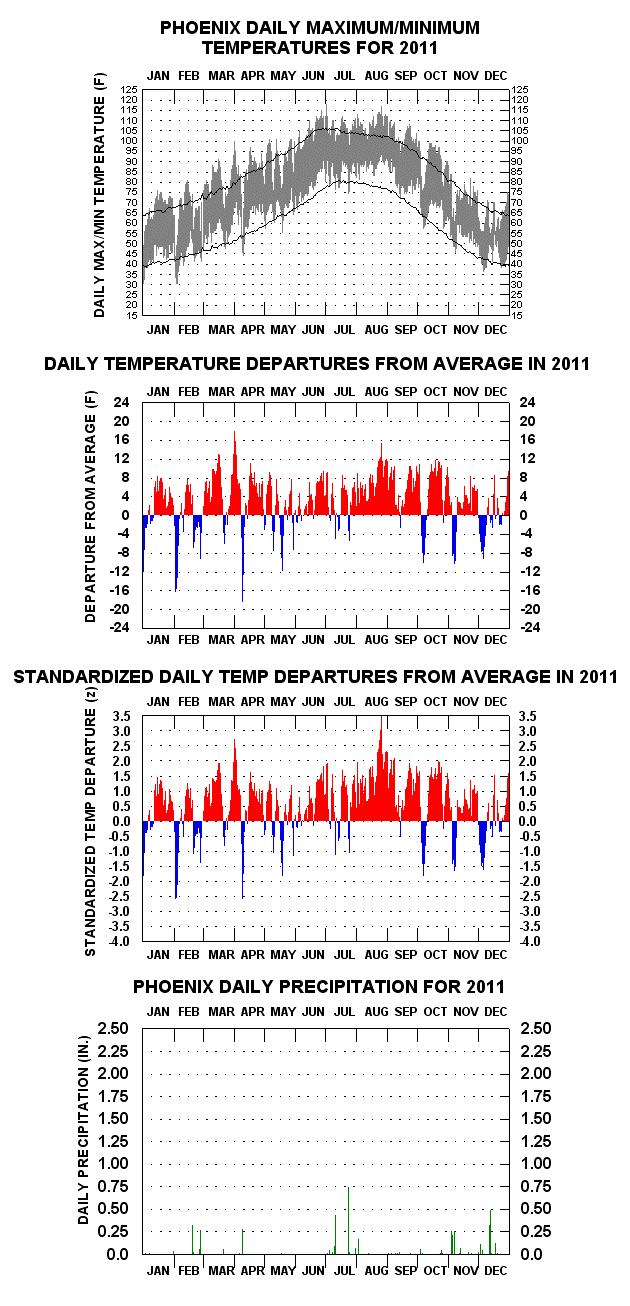
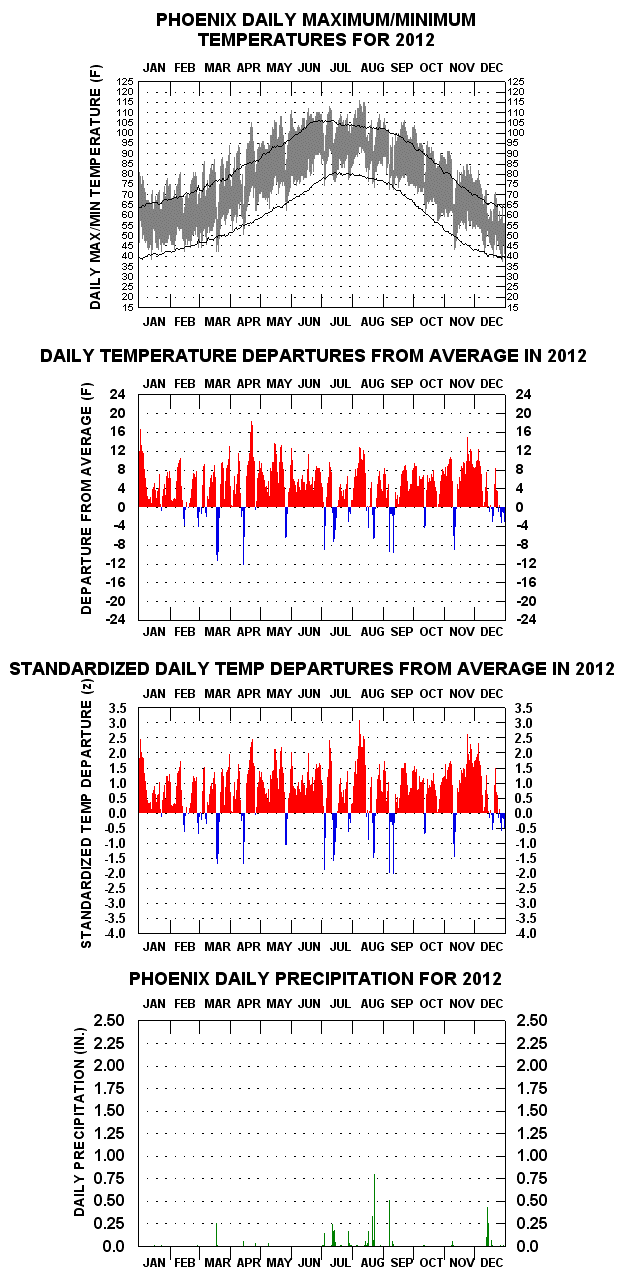
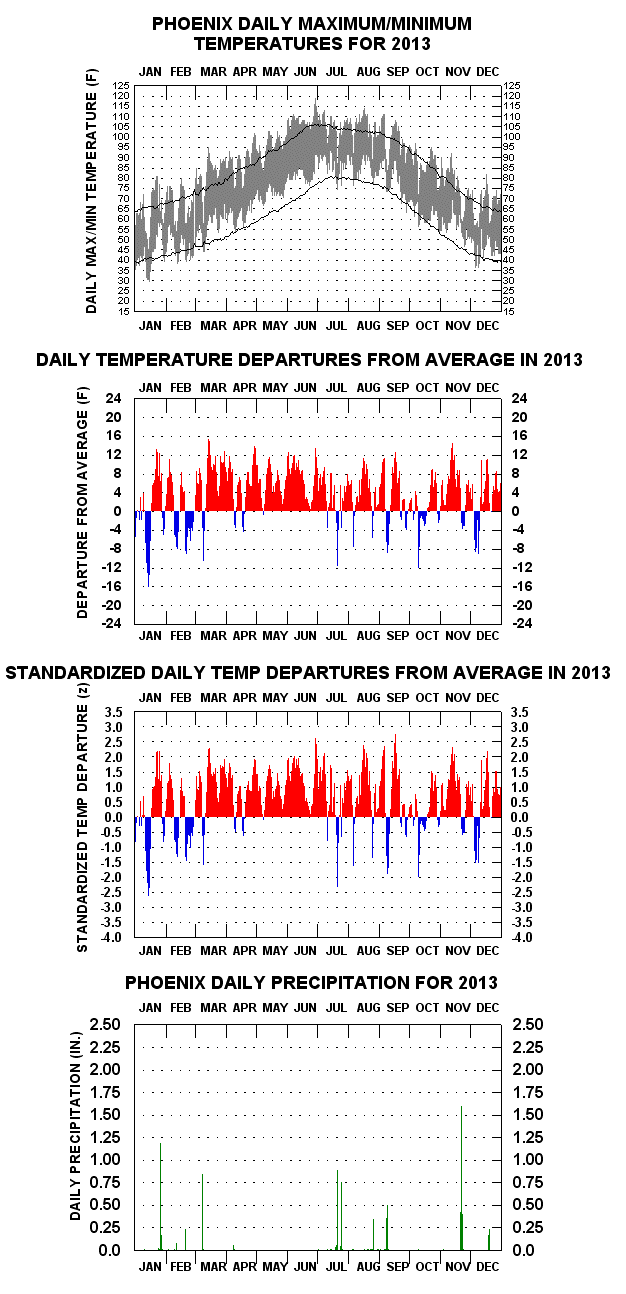
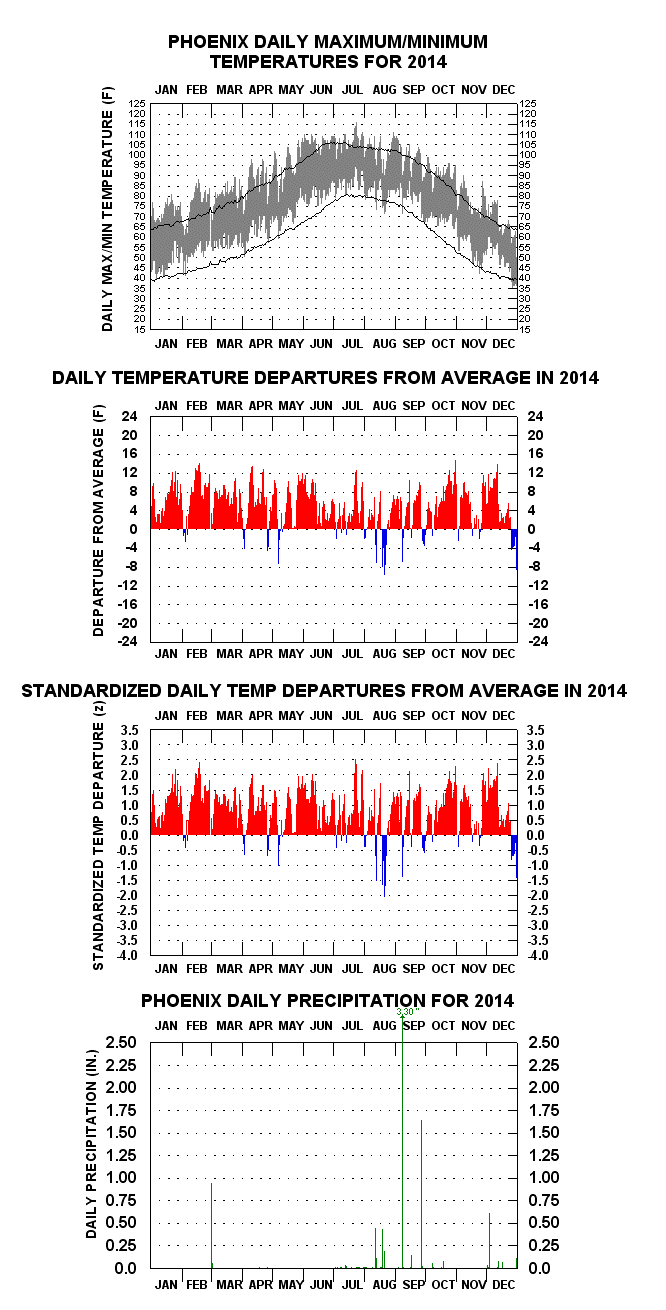
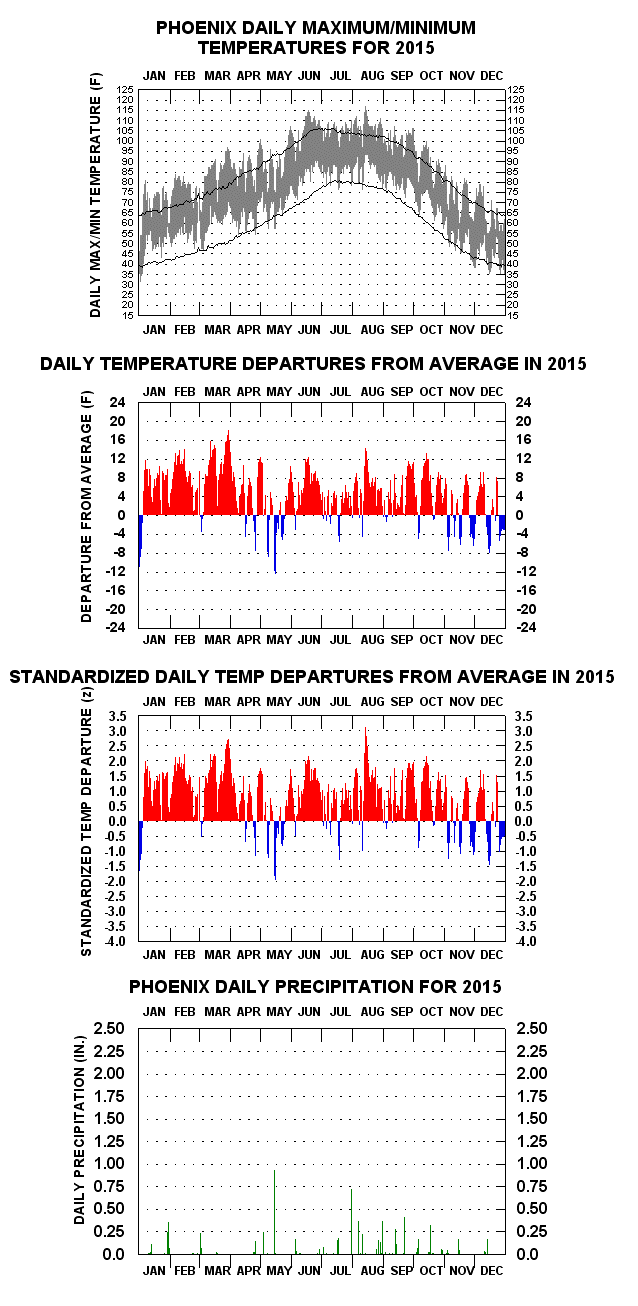
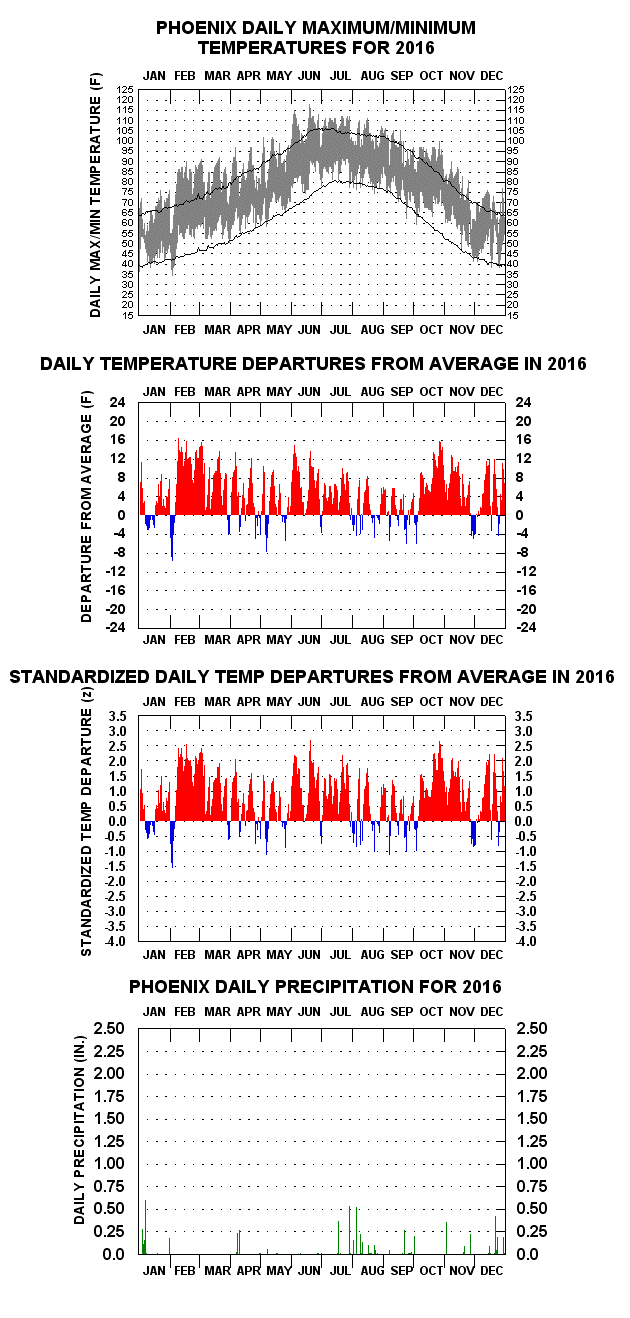
The third chart down shows the second chart’s daily mean temperature anomalies in deseasonalized (“standardized” or "z-scores") form . Those of plus or minus 3.0 z are the "extremes of the relative extremes", these comprising just 0.02% (or 86 individual days' cases) over the entire history. All but six of these are negatively signed. Greatest positive departure is +3.49 z zfor 26 Aug 2011 (117 F/93 F temperature range), the greatest negative –4.49 z for 20 Sept 1965 (75 F/47 F) temperature range.
The bottom chart depicts daily precipitation totals, as high as 3.30 inches (2 Sept 2014).
Links To Some Of The More Interesting Year-To-Year Graphs, With Accompanying Notes
Ties 2017 for warmest year on record (77.3 F). Warmest July (98.9 F) and August (99.0 F) in history, the latter the warmest calendar month on record.
Two separate one-day deluges on October help produce the wettest October on record (5.35") and 2nd wettest calendar month in history (to July 1911's 6.47").
Annual Mean (77.3 F) surpasses 2014 by 0.1 F for warmest year to date.
Surpasses 1989 for warmest year to date (77.2 F). Record daily rainfall total (3.30") set on 8 September, total for the month: 5.11", a record
July sets new mark for warmest calendar month (98.3 F).
Warmest March in History.
Daily temperature range on 15 July: 115 F/96 F, 96 F the record highest min ever recorded. July (97.6 F) also warmest calendar month to up to this time.
Coolest year (72.5 F) since 1975; all subsequent annual means from 1976 on, however, at least 1.8 F warmer.
120 F & 122 F, on 25 and 26 June, respectively, setting all-time warmest daily maxima records.
Warmest year to date (77.0 F), and warmest meteorological Spring (77.7 F) up to the present. July (97.4 F), also warmest calendar month up to this point.
Warmest May on record and 5.15" rainfall in August.
Another new annual mean temperature high mark (76.1 F).
A new warmest to date mark set (74.9 F).
Warmest year to date (73.4 F). Commences long-term warming trend which continues to present day.
Unseasonably early cold front produces brief spell of far below normal temperatures. Temperature range on 20 Sept: (75/47), 23 F below average and 4.5 standard deviations below.
Coolest year (67.9 F) in Phoenix history
Driest year (2.82") in Phoenix history.
Cold January. Great short-term gyrating spell in October.
Wettest year in Arizona since 1905. Phoenix records 16.26". "Coolest" Summer (85.1 F) since 1913.
January 1937 coldest calendar month (43.2 F) in Phoenix history. Temperature range: 39 F/29 F on 21st.
Another warmest to date mark set (72.8 F). First 90F+ daily minimum recorded on 15 July, the next one not to come until 1970.
Warmest year to date (72.1 F).
Temperature hits 118 F on 16 July, highest to date, not surpassed until 1990.
Coolest meteorological Spring (March-May), mean: 63.1 F.
Very cool early May. Daily temperature range on 1 May only 54 F/42 F, 25 F below average.
Persistent short-term variability pattern in temperature over January through May.
Cold wave drops mercury to 16 F on 7 Jan., coldest reading in Phoenix history. Mean temperature for the day (28.5 F) was four standard deviations below the 1896-2020 average for 7 January.
Wettest calendar month in history (July: 6.47"), and coldest December (46.6 F).
Wettest calendar year in Phoenix recorded history (19.73"), nearly 13 inches over January-April.
Daily temperature range a wintry 36 F/33 F on 10 December, accompanied by over 1 inch of precipitation, with snow and rain mixed. Nearby Peoria reported 3 inches of snow on the level.
First full calendar year of daily observations. Eight consecutive 110 F+ days in mid-June.
* Member, American Meteorological Society
Data Collection 08Analytics
Sample Regimes, PCA Modes, PDFs & Extremes+
Temperature+
Regimes+
Sample analysis: group years by recurring hot-season temperature patterns for Phoenix, then compare transitions between common, unusual and persistent regimes. This is sample Analytics content for layout and workflow testing. Replace it with the station’s verified analysis when the final material is ready.
Extremes+
Sample analysis: review the upper and lower tails of the heat record for Phoenix and identify years that merit detailed chart interpretation. This is sample Analytics content for layout and workflow testing. Replace it with the station’s verified analysis when the final material is ready.
Rainfall+
PDFs+
Sample analysis: compare the central distribution and tail behavior of rainfall observations at Phoenix. This is sample Analytics content for layout and workflow testing. Replace it with the station’s verified analysis when the final material is ready.
Extremes+
Sample analysis: review the upper and lower tails of the rainfall record for Phoenix and identify years that merit detailed chart interpretation. This is sample Analytics content for layout and workflow testing. Replace it with the station’s verified analysis when the final material is ready.
Continue Exploring
Compare Climate History Across Every Station
Browse domestic and international climate archives, long-term trends and original statistical visualizations.