

Station Overview
Graphical Climatology of Dallas / Ft Worth: Daily Temperatures and Rainfall, by Year (1948 – Present)
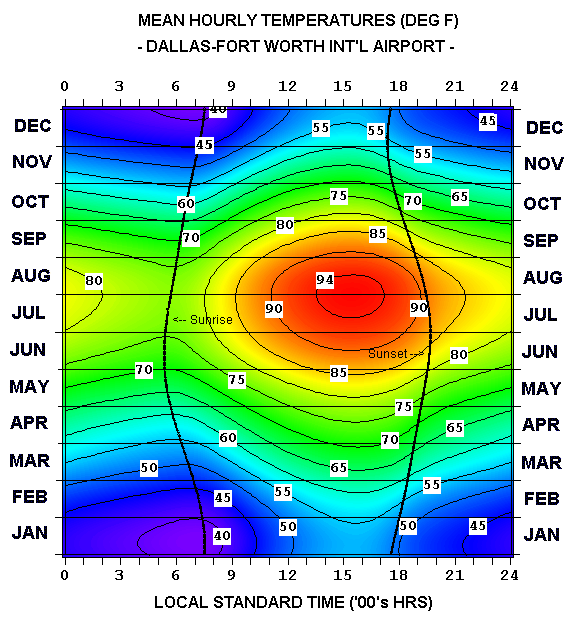
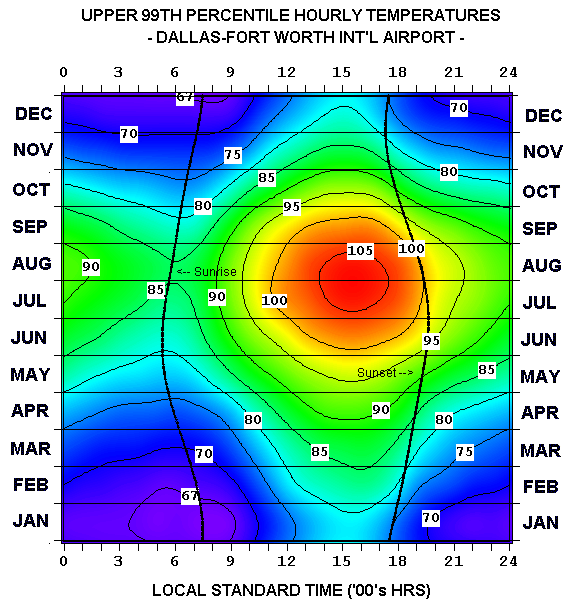
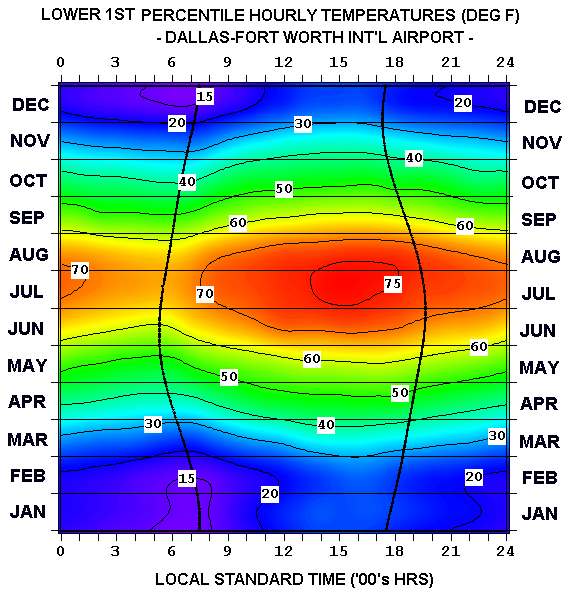
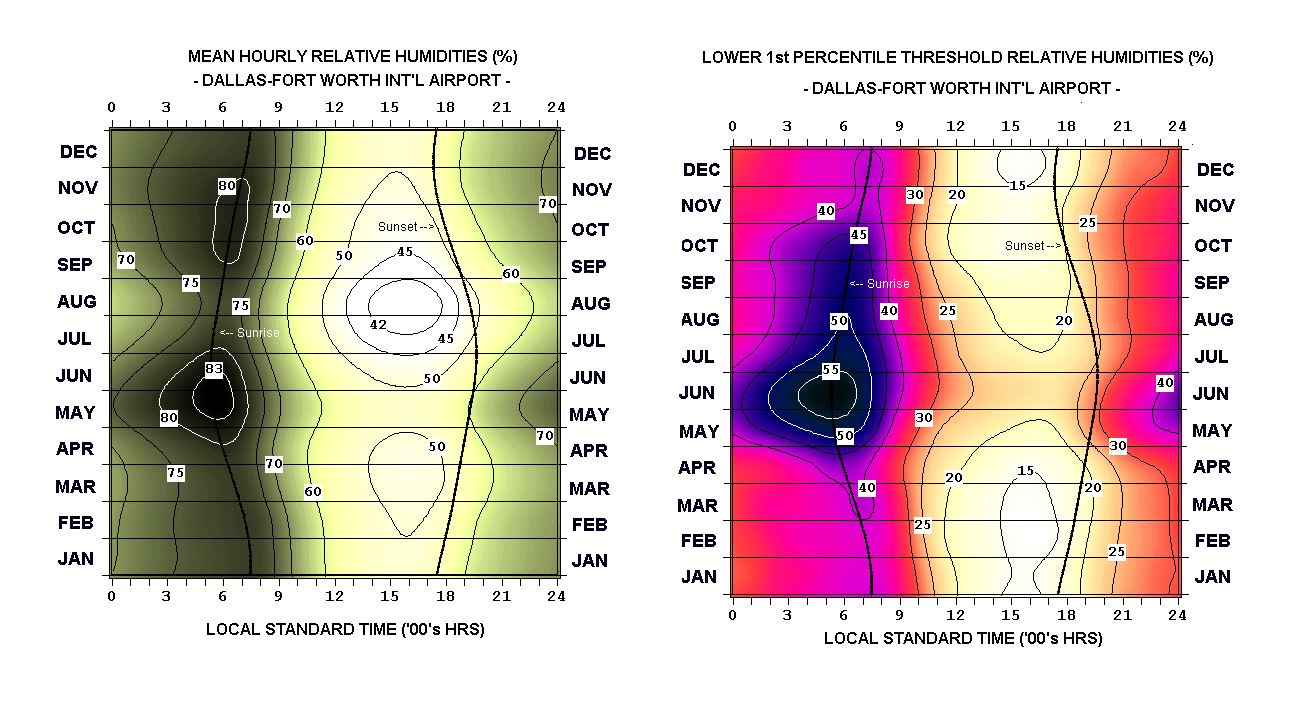
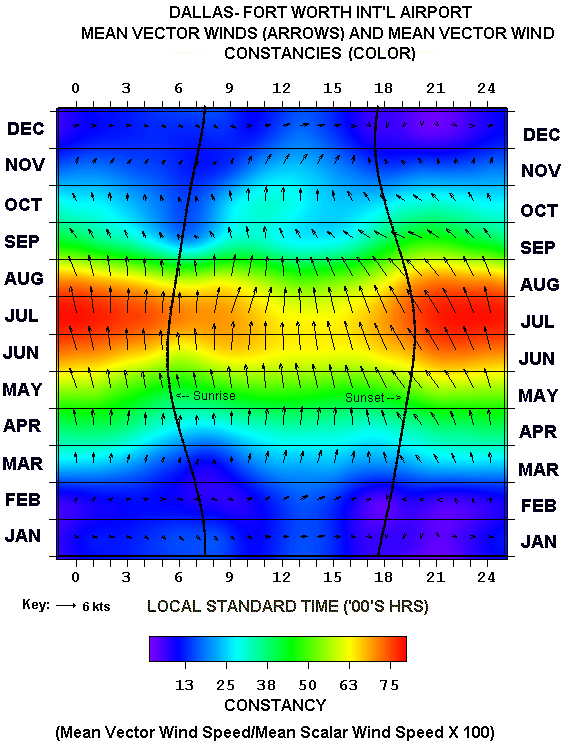
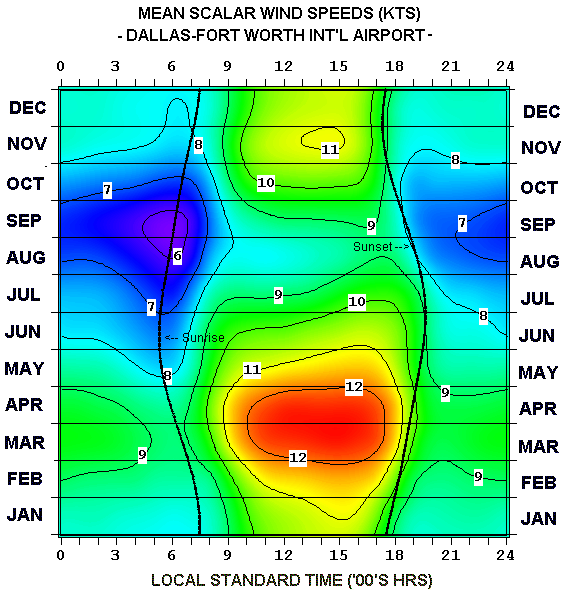
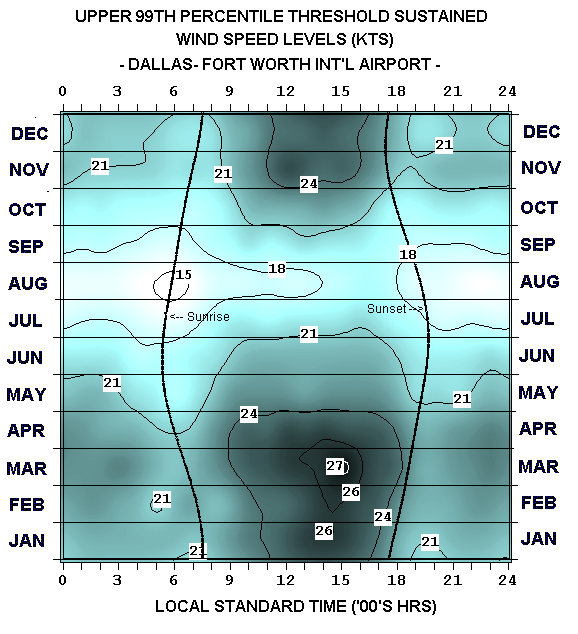
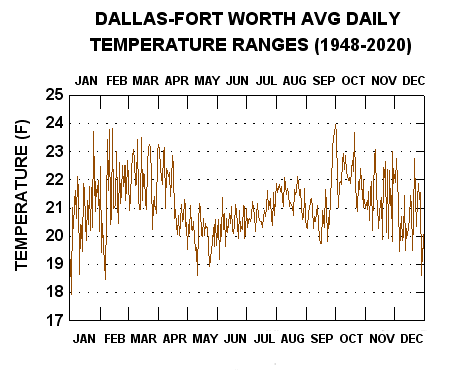
The following is a graphical climatology of Dallas-Fort Worth Int'l Airport Temperatures, precipitation, and various other variables, from 1948 into the present year 2026. Presented are daily climatological overview charts (temperature), annual time-series (temperature and precipitation), “climograms” (hour-by-month depictions of temperature, humidity, winds, fog, blowing sand/dust, and thunderstorms), followed by year-to-year graphs that depict daily max/min temperature, daily mean temperature anomalies, and daily rainfall, . Data were obtained courtesy of the Utah Climate Center and the NWS-Dallas/Fort Worth online site.
Explore the Climate Data
Use these shortcuts to move directly to the principal charts, analyses and historical records.
Climate Overview Graphs — RECENT YEARS
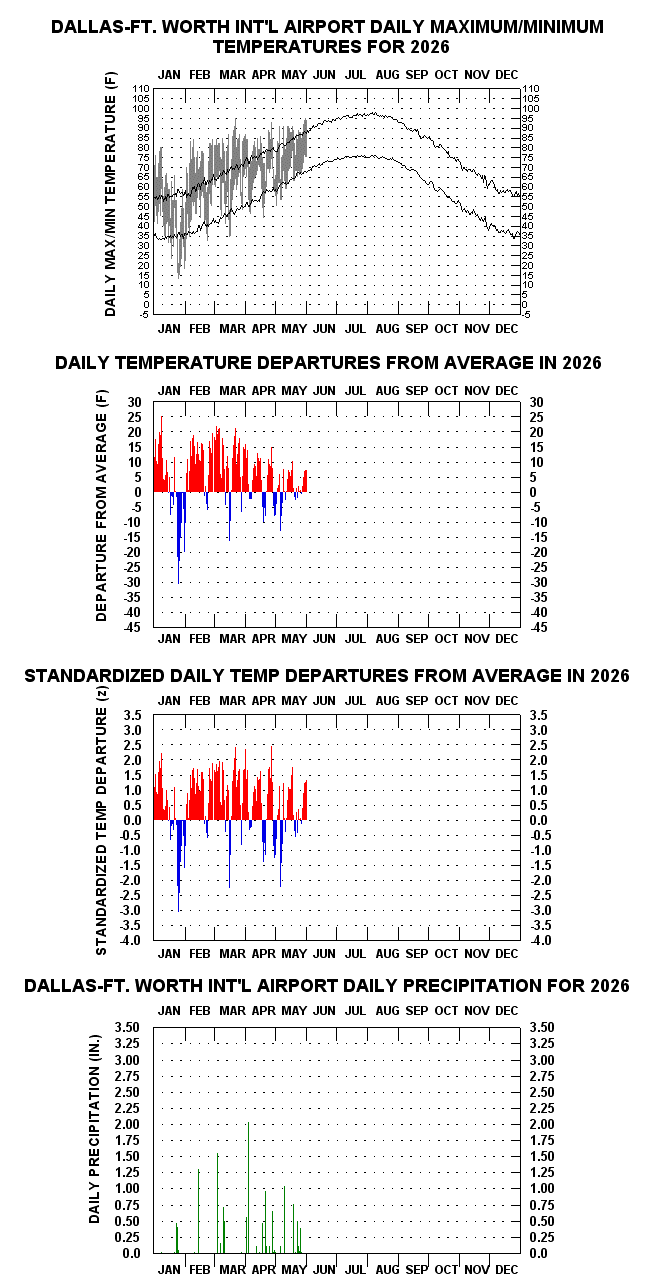
- 2026 Daily Temperature/Precipitation Graphs for DFW NewNew (5/31/26)
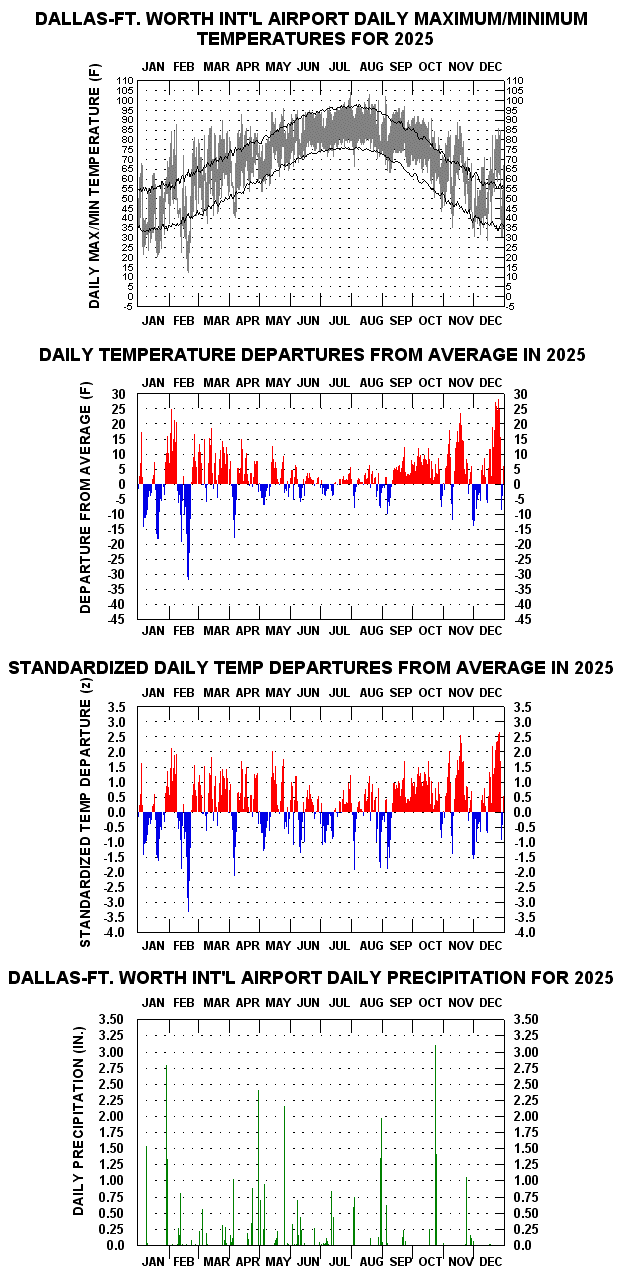
- 2025 Daily Temperature/Precipitation Graph for DFW NewNew (12/31/25)
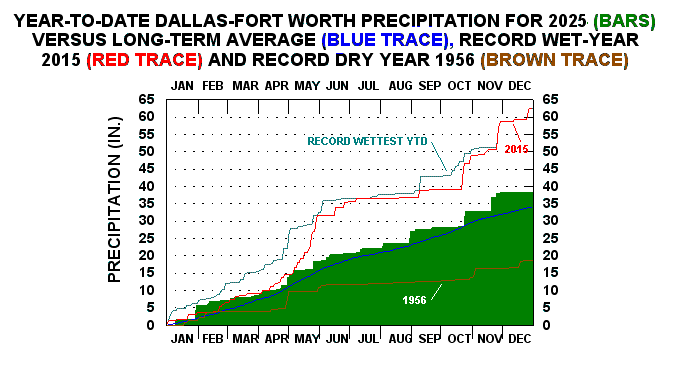
- 2025 Cumulative Daily Precipitation vs. Means and Extremes New(New (12/31/25)
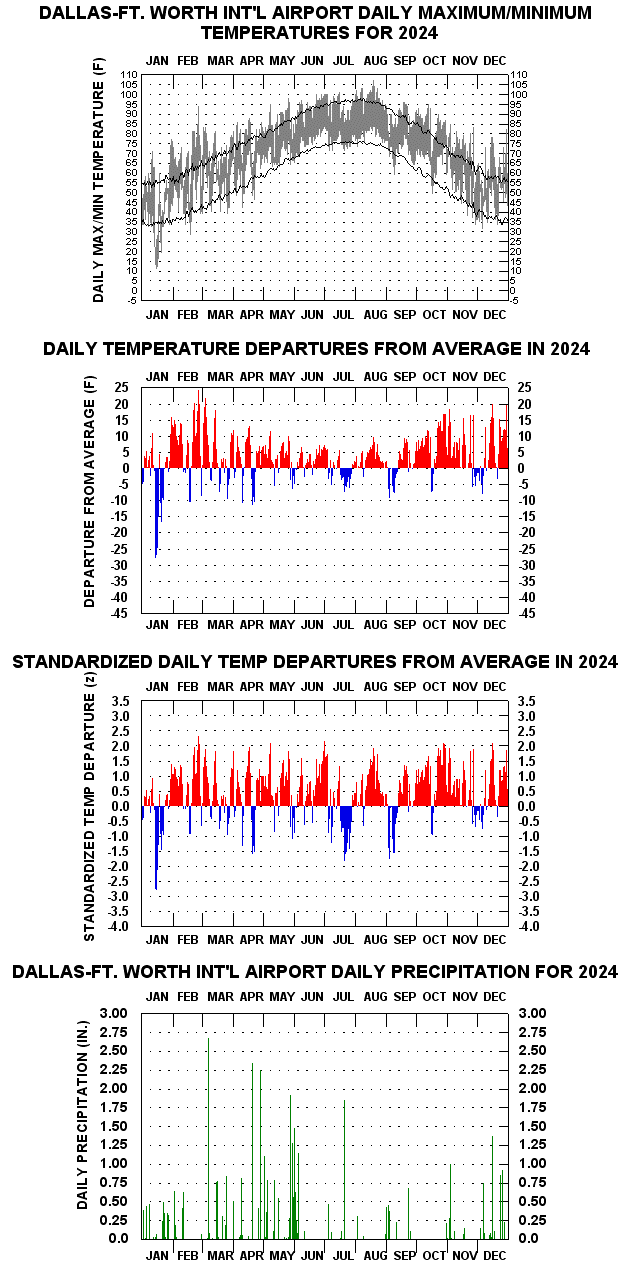
- 2024 Daily Temperature/Precipitation Graph for DFW
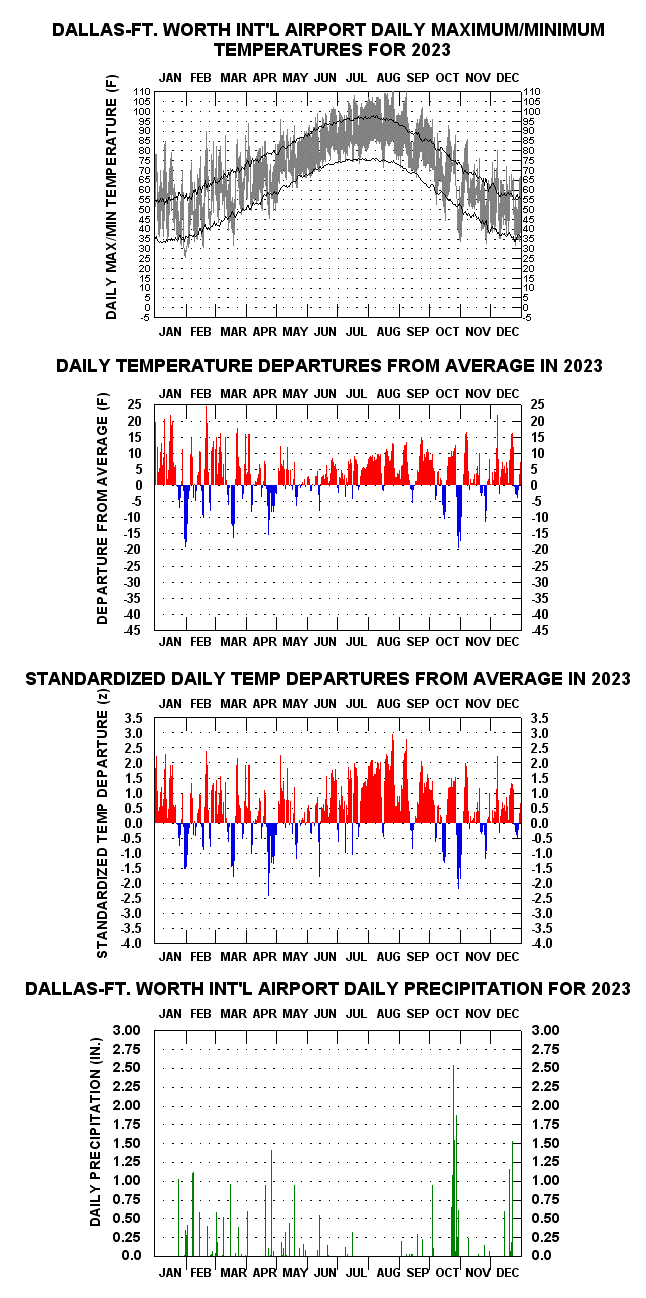
- 2023 Daily Temperature/Precipitation Graph for DFW
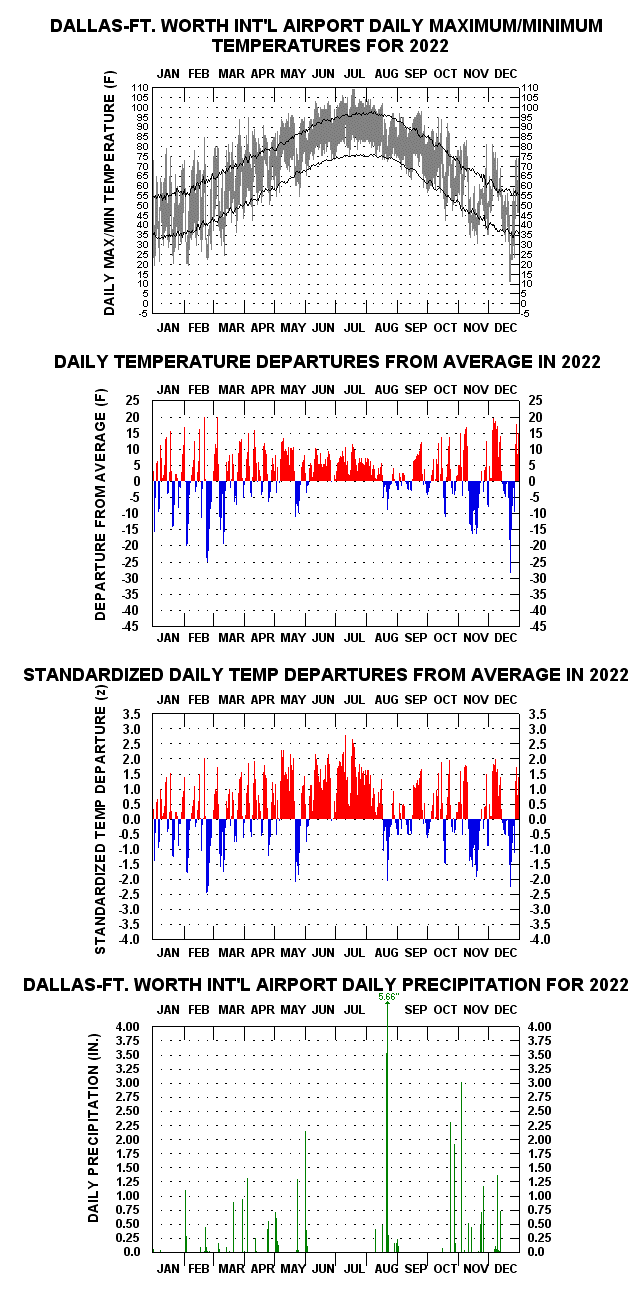
- 2022 Daily Temperature/Precipitation Graph for DFW
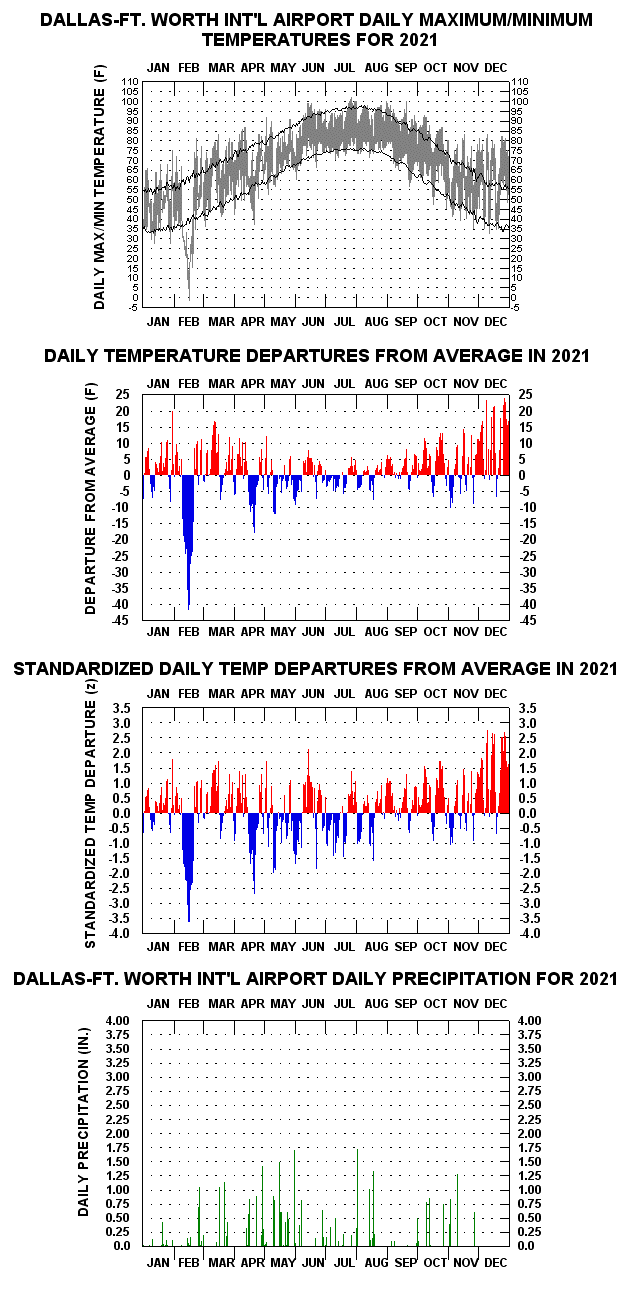
- 2021 Daily Temperature/Precipitation Graph for DFW
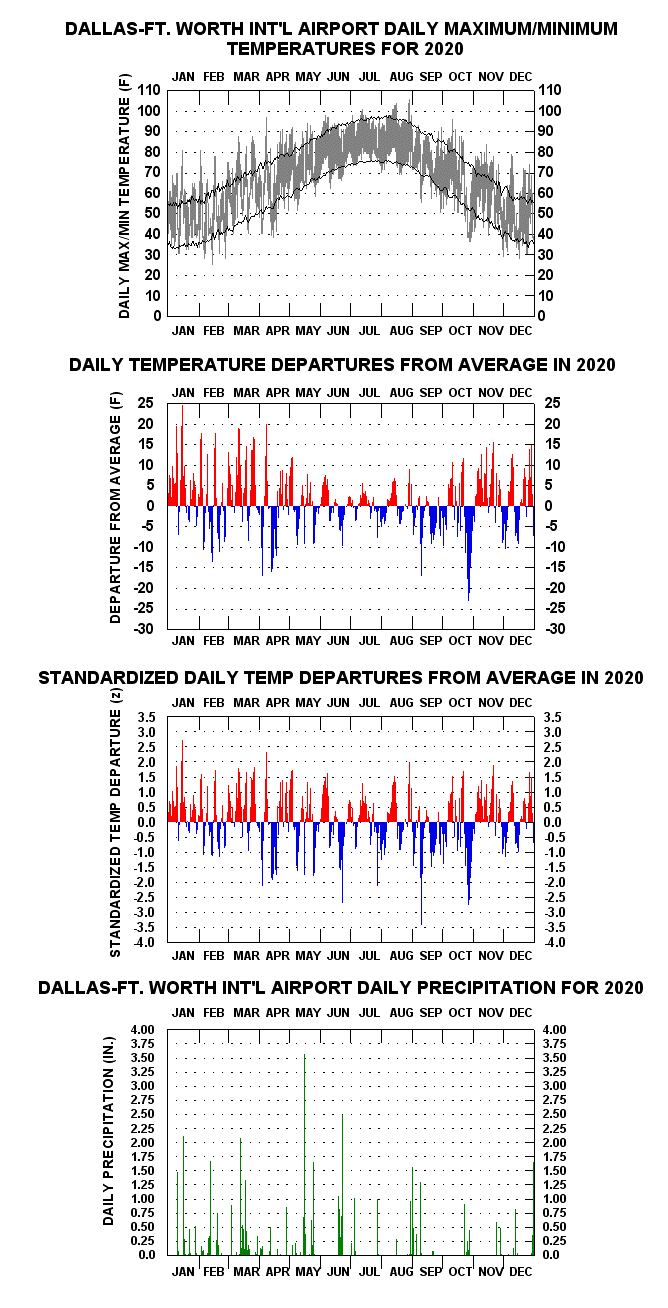
- 2020 Daily Temperature/Precipitation Graph for DFW
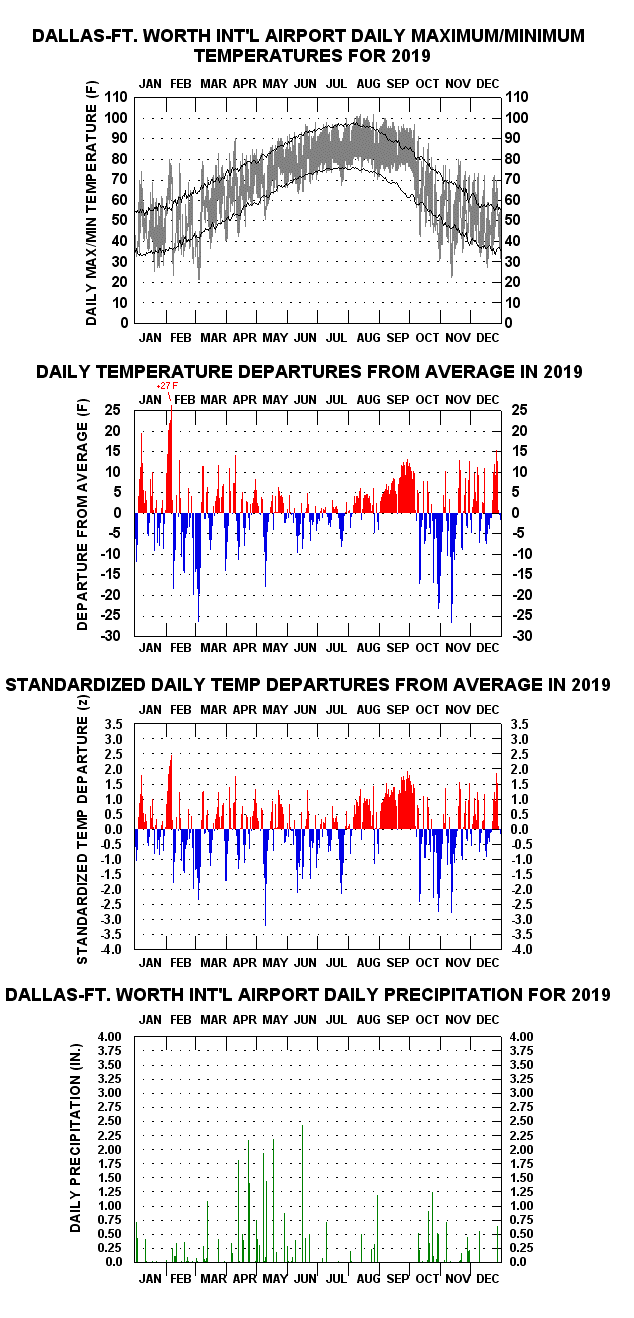
- 2019 Daily Temperature/Precipitation Graph for DFW
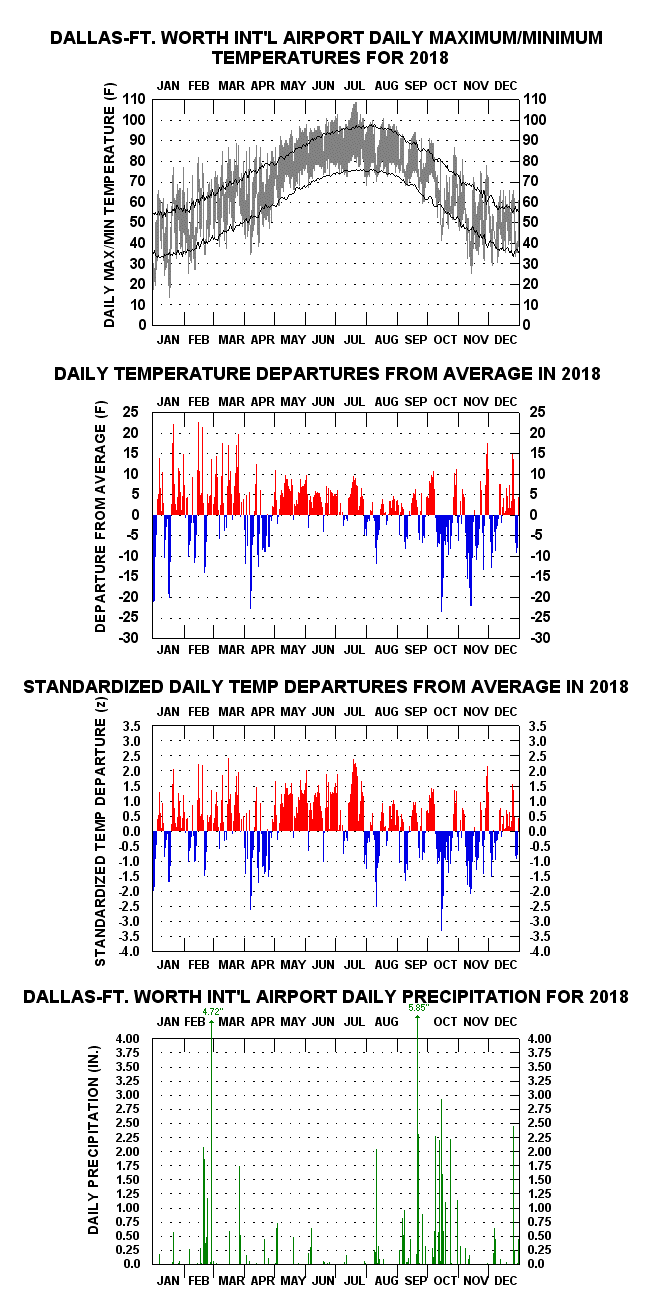
- 2018 Daily Temperature/Precipitation Graph for DFW
Historical Series
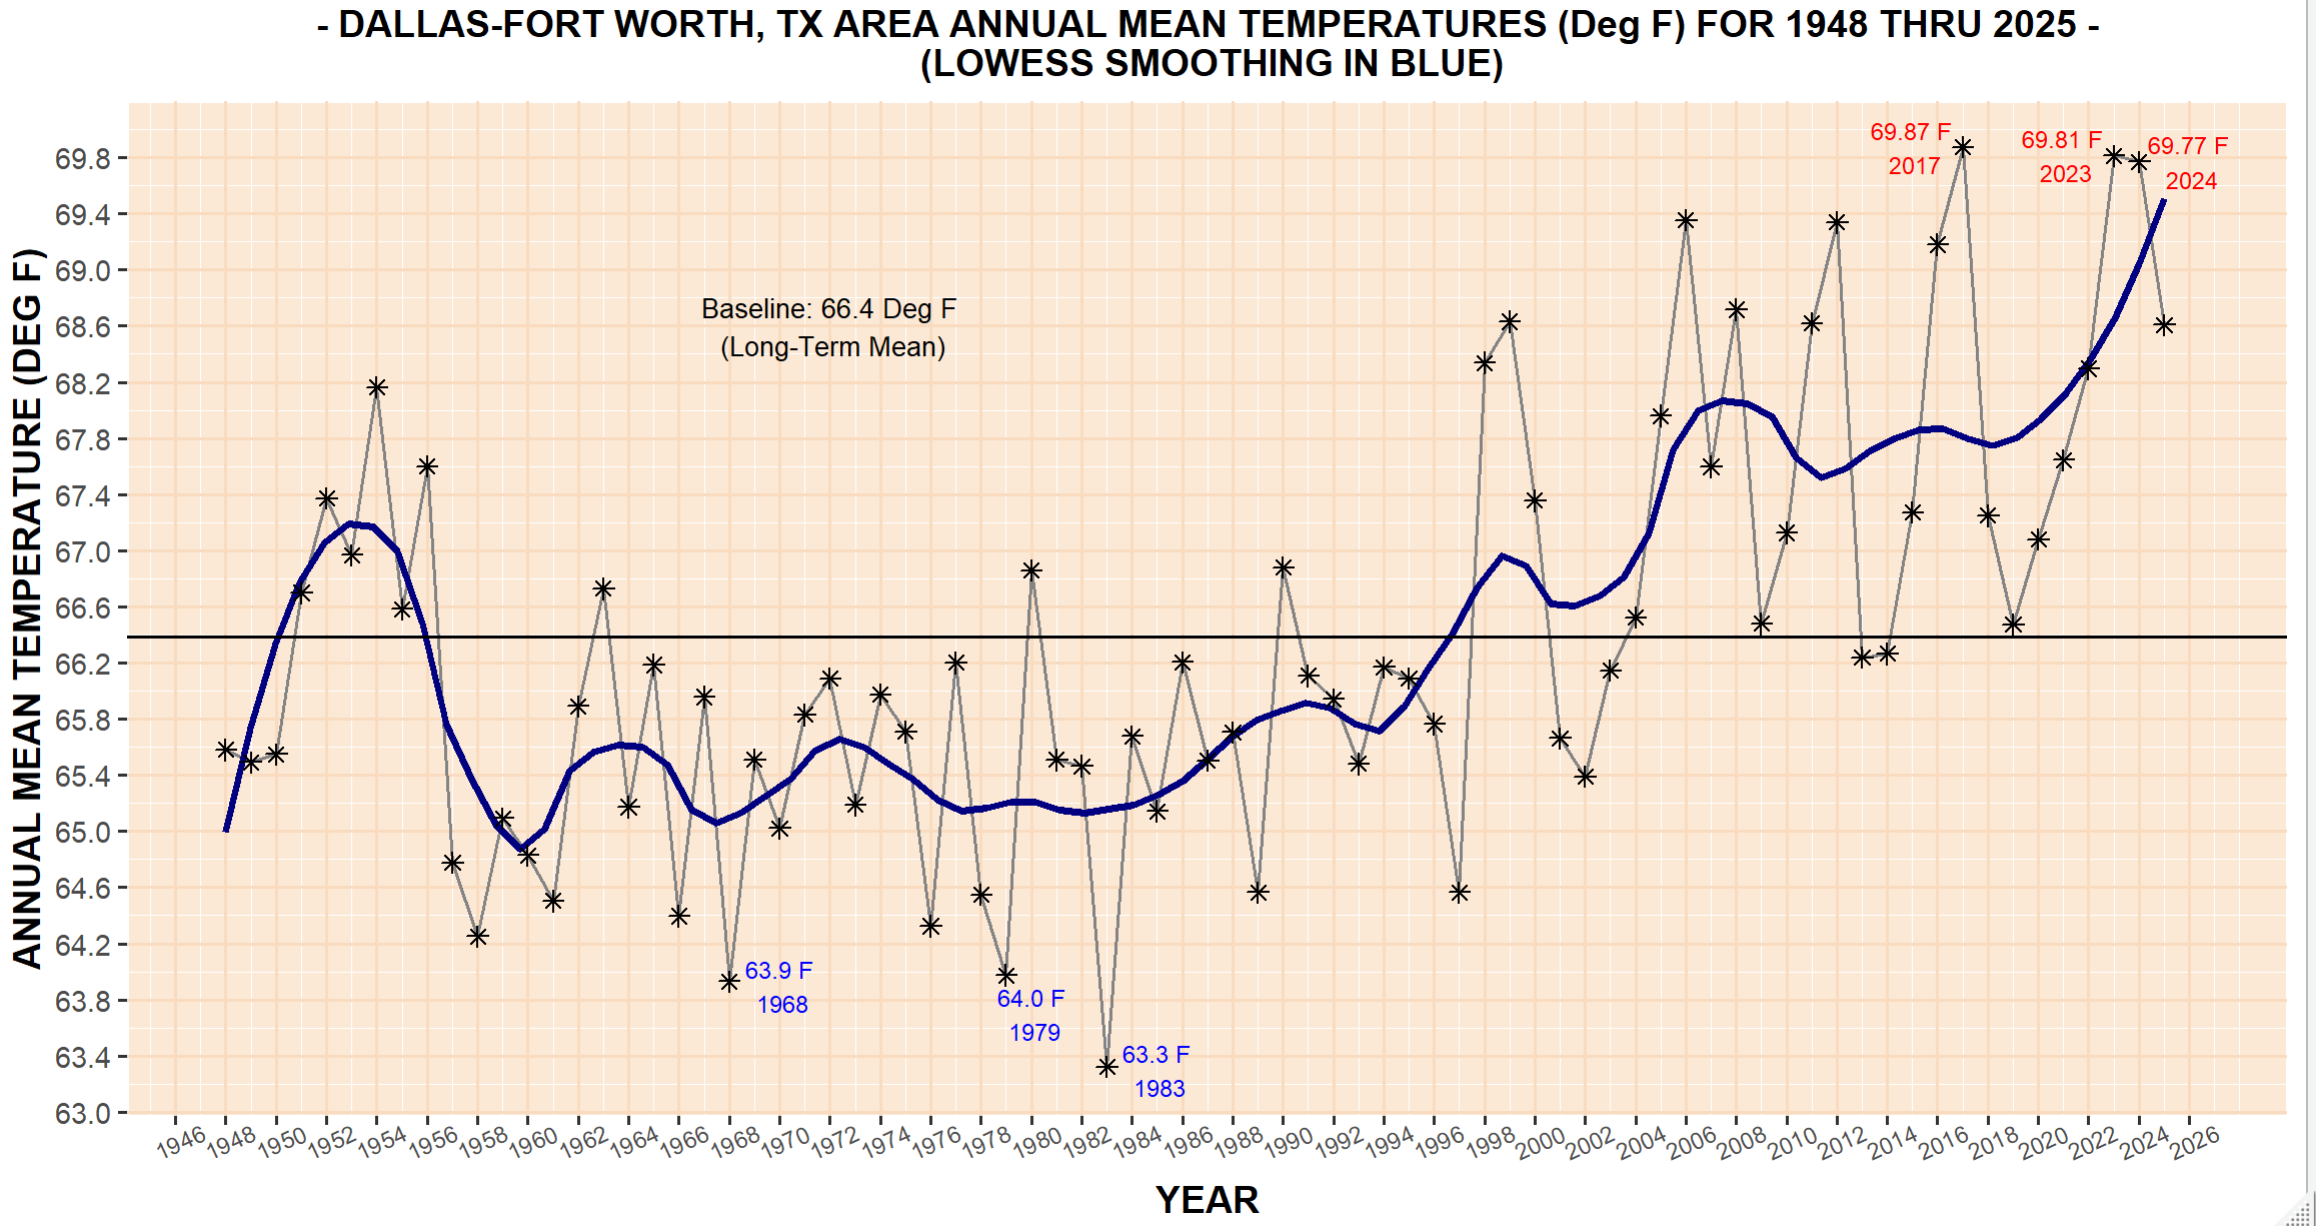
- DFW Annual Mean Temperature History (1948-2025) NewNew (1/6/26)
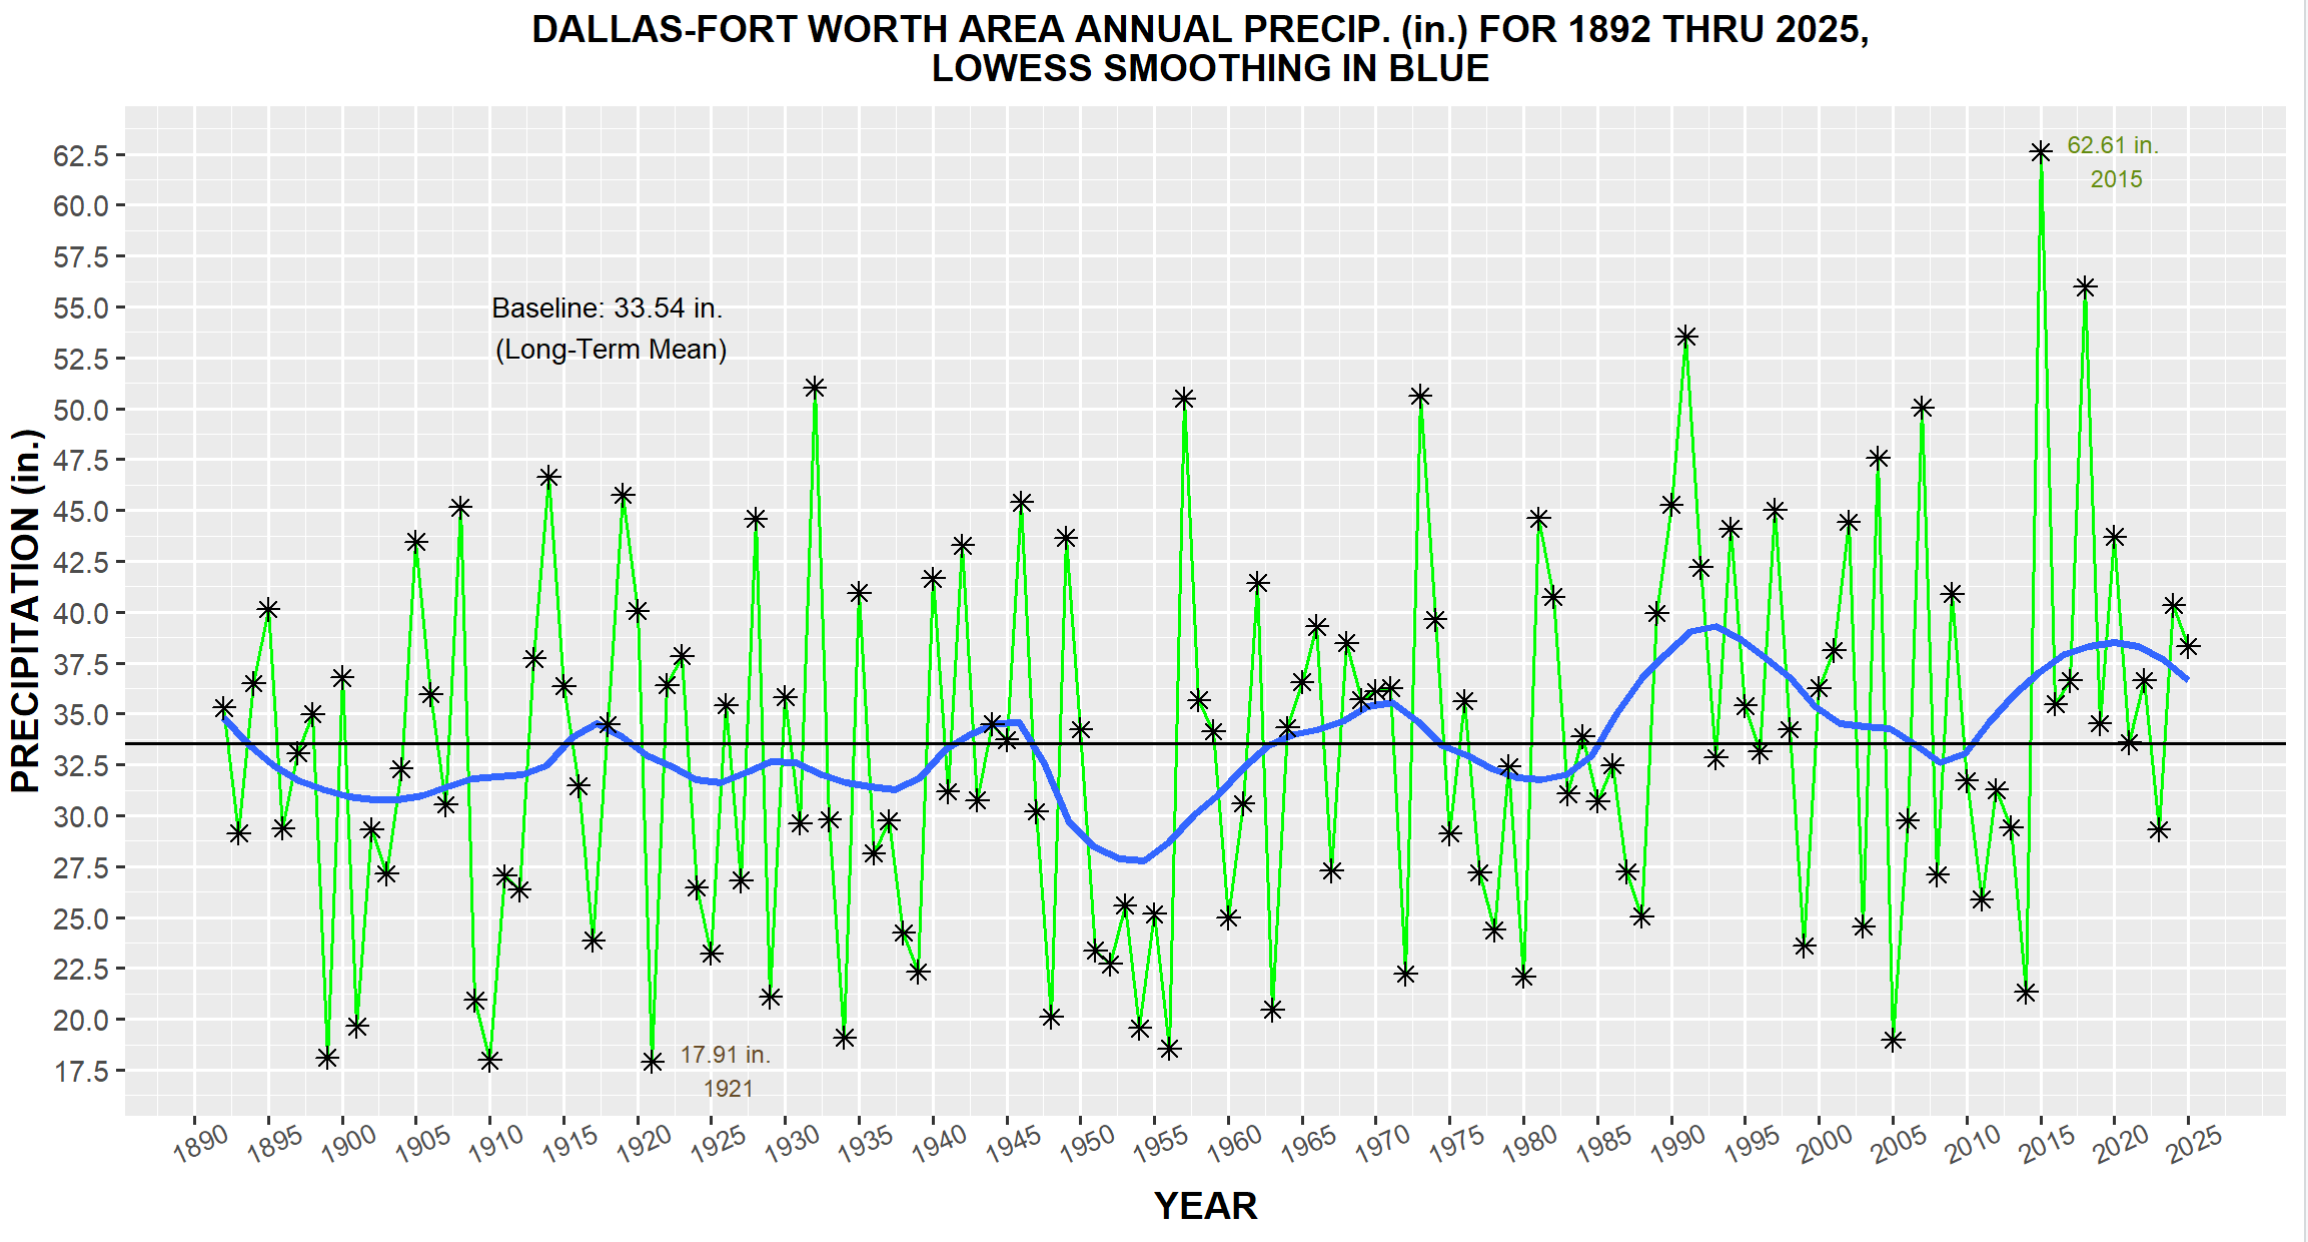
- DFW Calendar Year Precipitation History (1892-2025) NewNew (1/6/26)
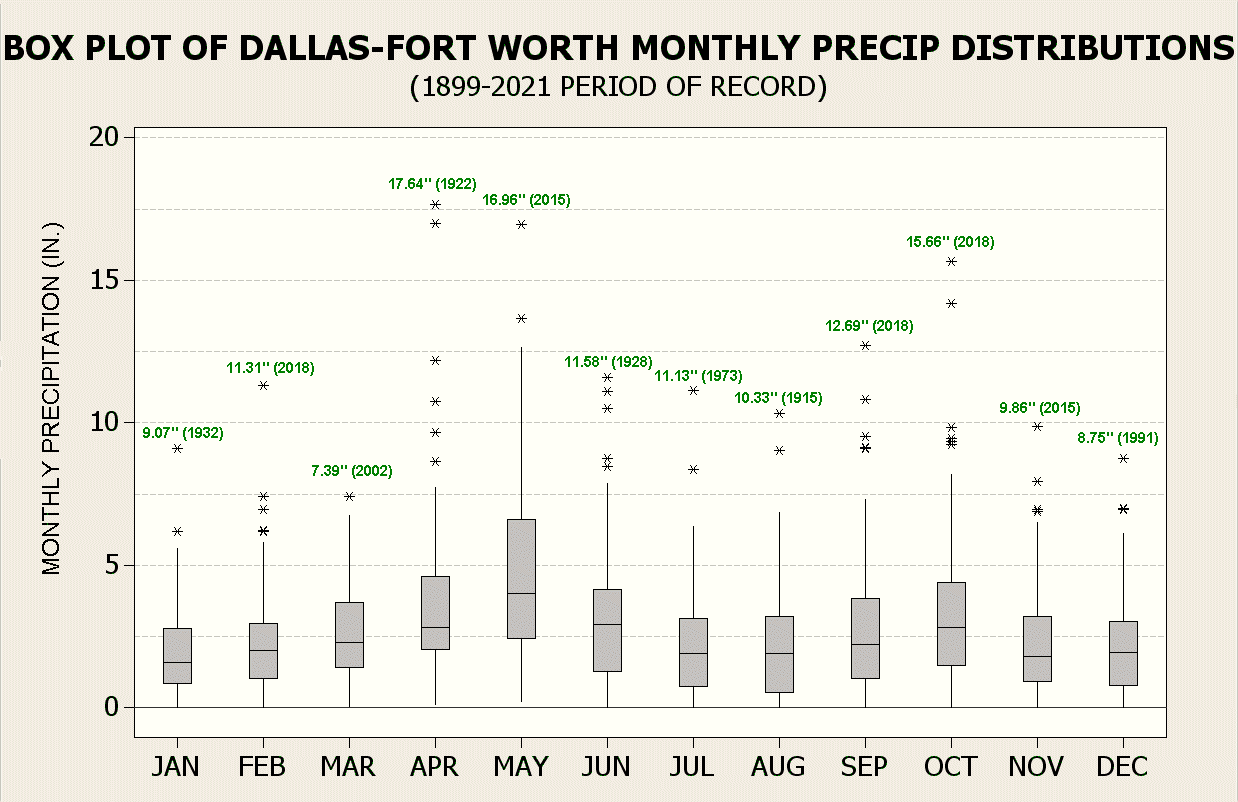
- Boxplot of DFW Monthly Precipitation Distributions (1899-2021)
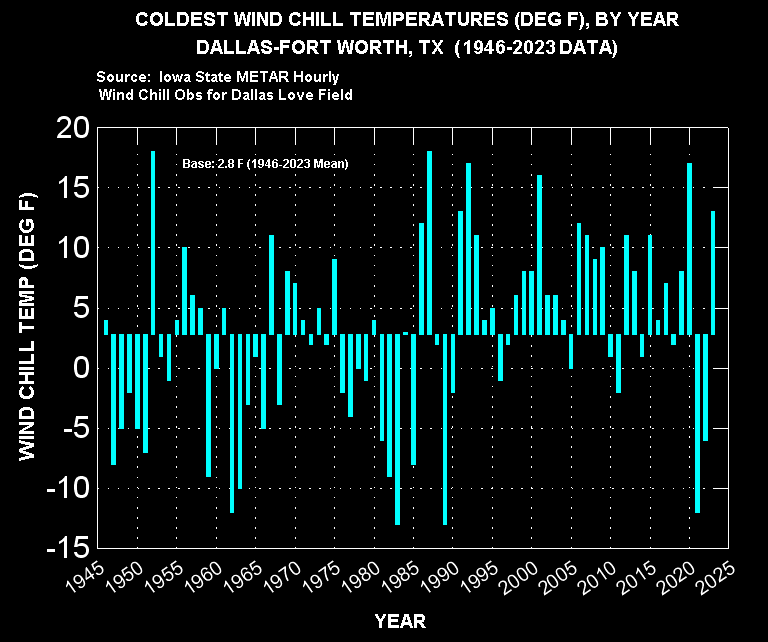
- DFW Coldest Wind Chill Temps, by Year (1946-2023)
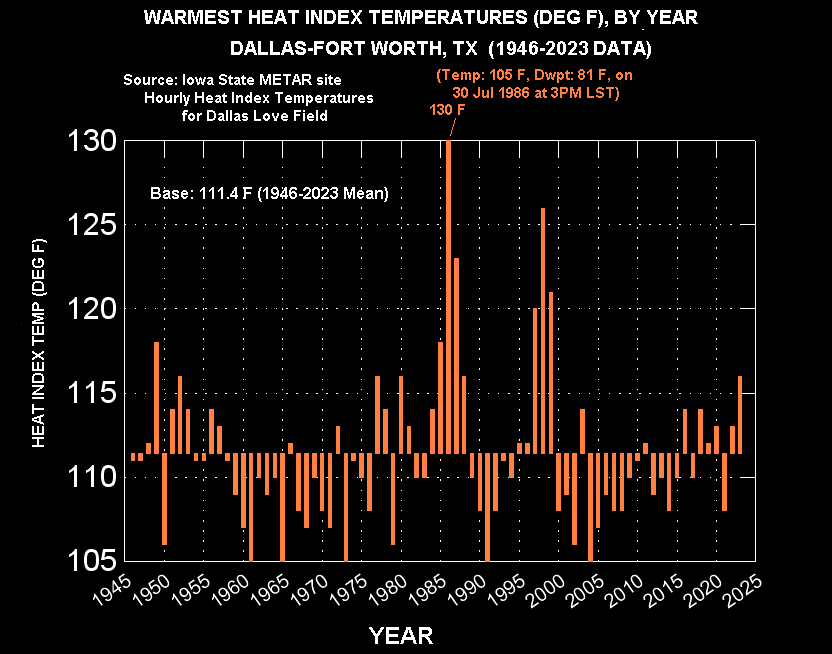
- DFW Warmest Heat Index Temps, by Year (1946-2023)
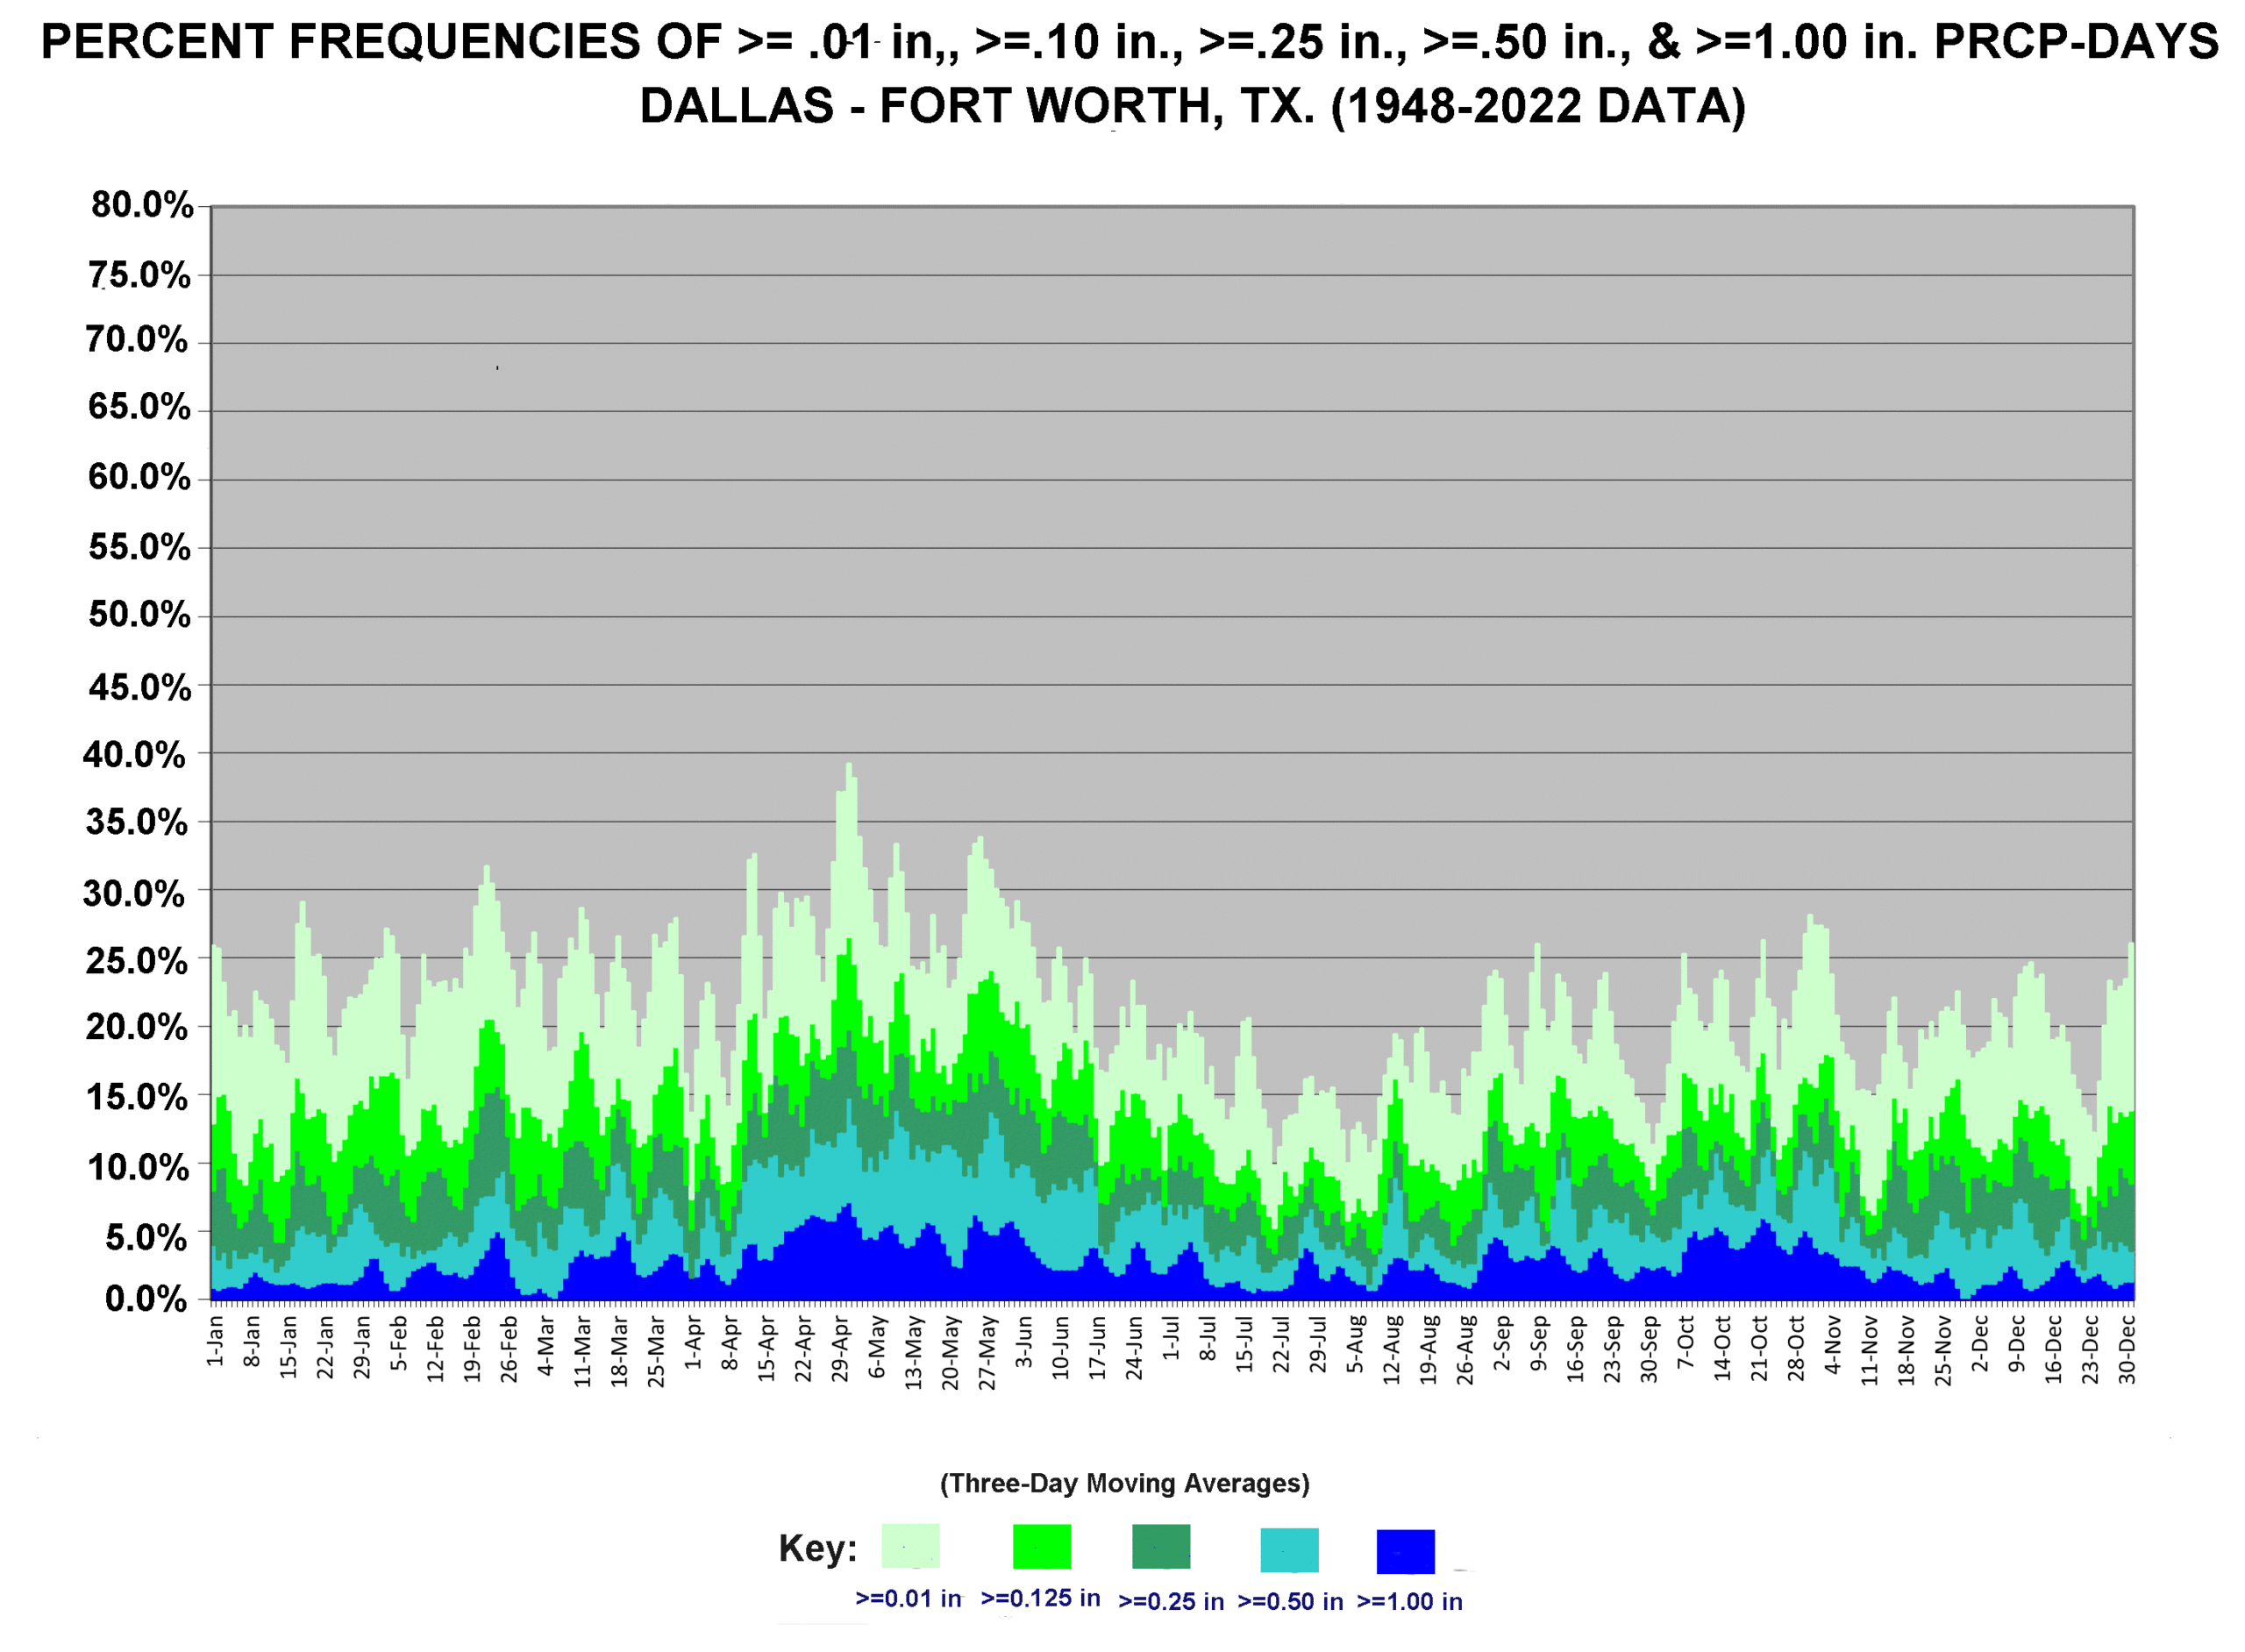
- DFW Pct. Frequencies of >=0.01 in., >=0.10 in., >= 0.25 in, >=0.50 and >=1.00 in. Rainfall Days, by Calendar Day (1948-2022)
Hour-By-Month Climograms For Dallas-Fort Worth
Other Summary Climate Charts:
Year-To-Year Graphs - Interpretation
The top chart for a given year’s page (accessed by the links below) are “floating-bars” of the year's daily maxima and minima temperatures. Superimposed on the bars are two line traces, the upper one connecting long-term (1948-2020) mean daily maxima, the lower one mean daily minima.
Second chart down depicts the day-to-day mean temperature anomalies (daily mean temperature less the corresponding long-term 1948-2020 climatological mean). Departures extending upward in red from the zero line indicate warmer than average means for the day, those extending downward in blue indicate below average ones. Greatest single-day departure of either sign is -42 F on 15 Feb 2021 (daily temperature range: 14 F/4 F), the second-most, -40 F, on the very next day 16 February (daily temperature range: 18 F/-2 F )
(Note: Clicking on the floating-bar charts a second time after they appear on the screen will enlarge them further).
Year-To-Year Graphs — OLDER YEARS
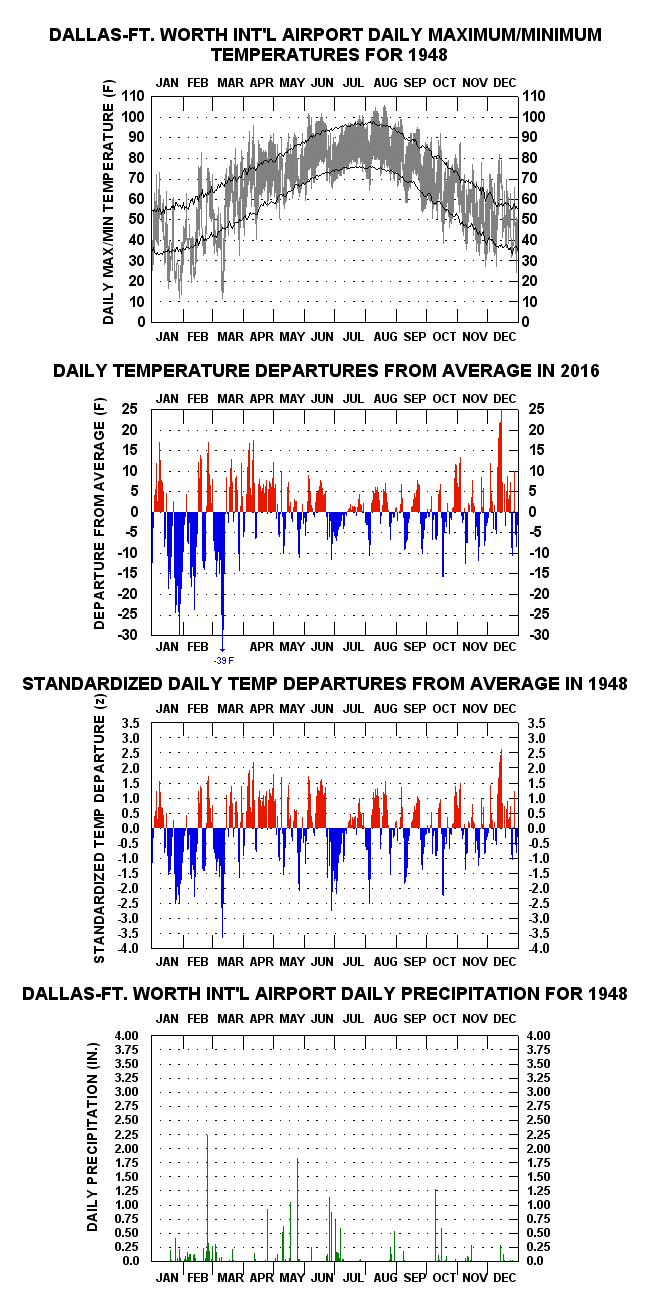
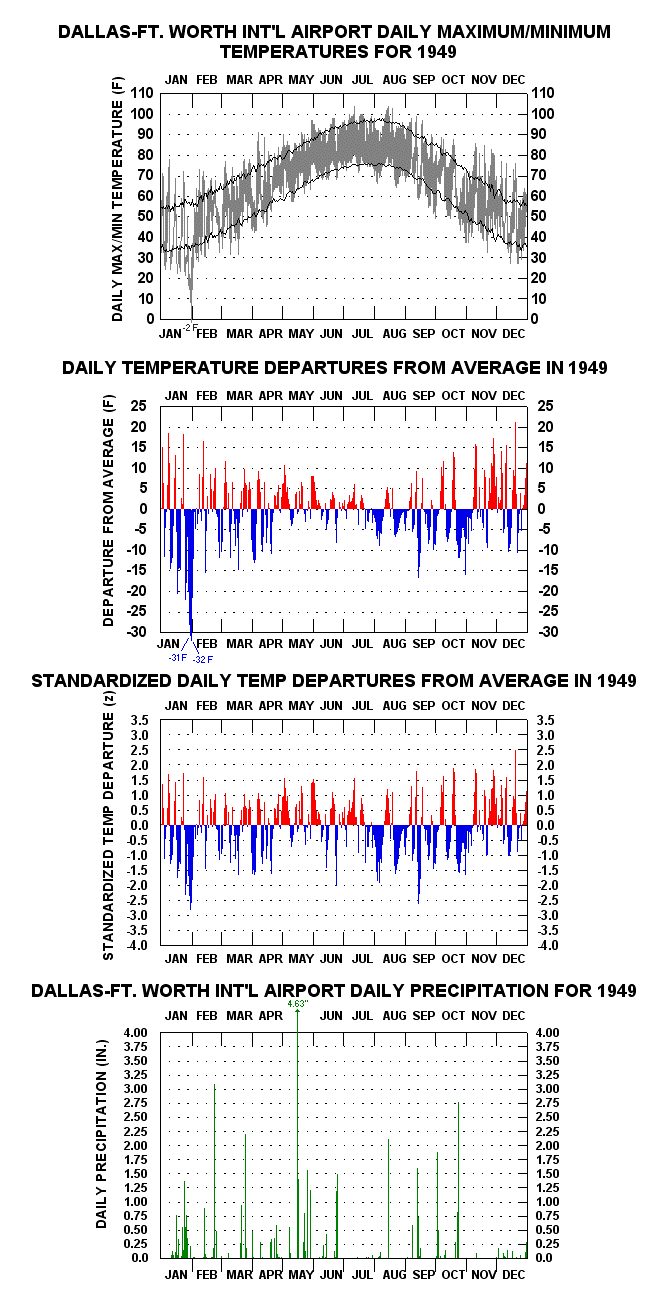
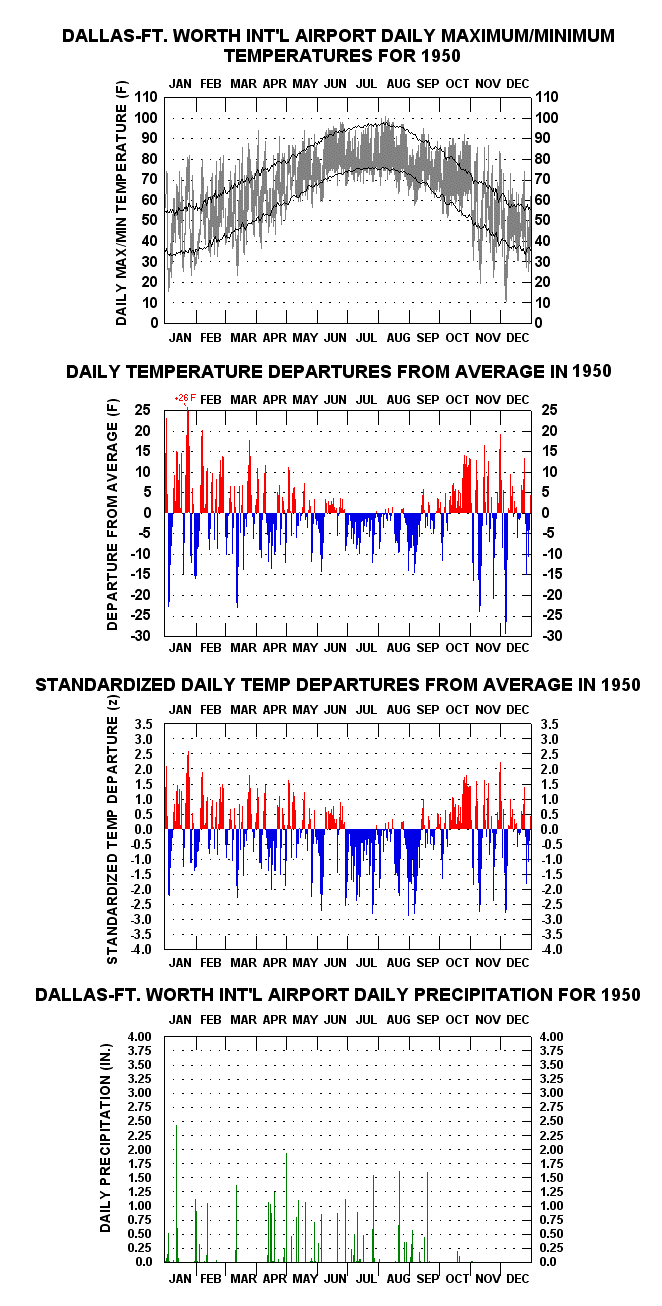
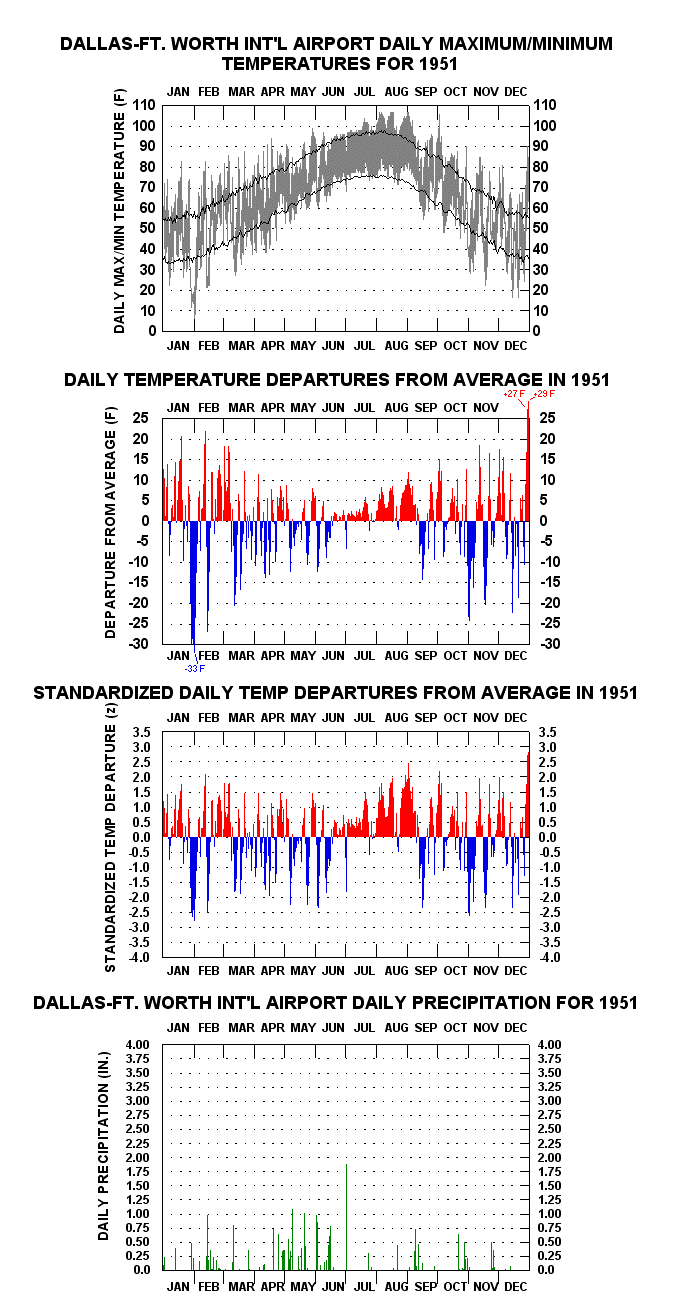
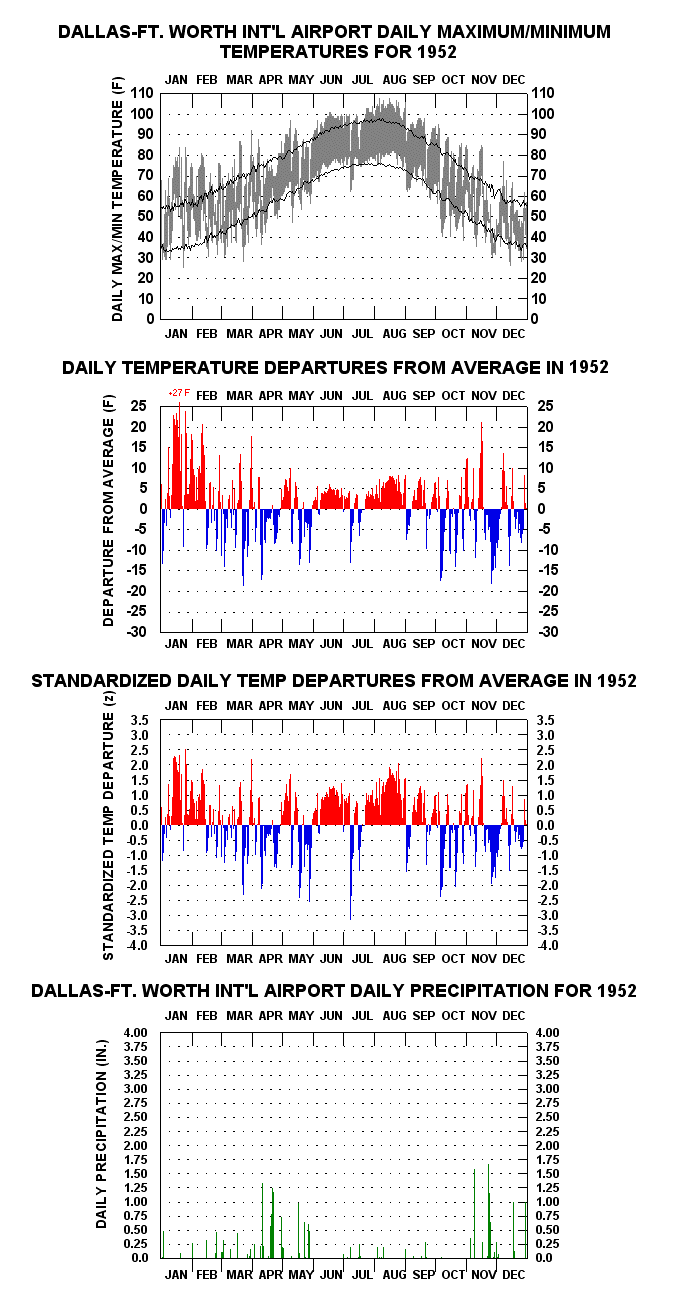
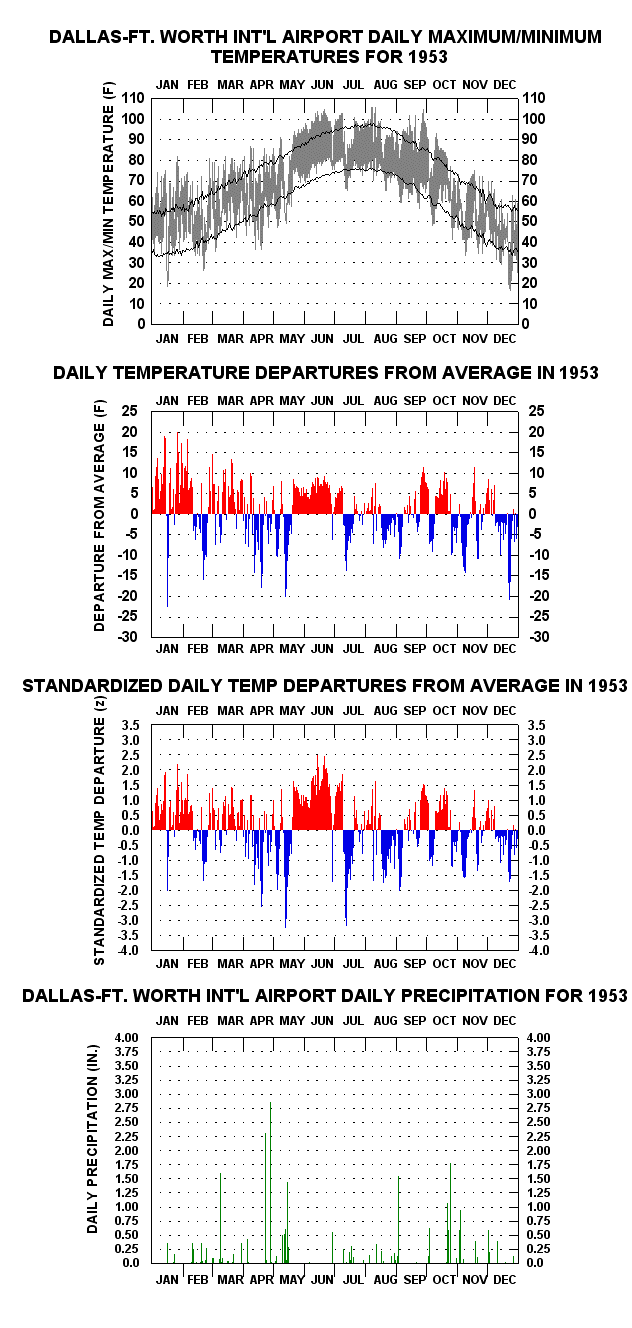
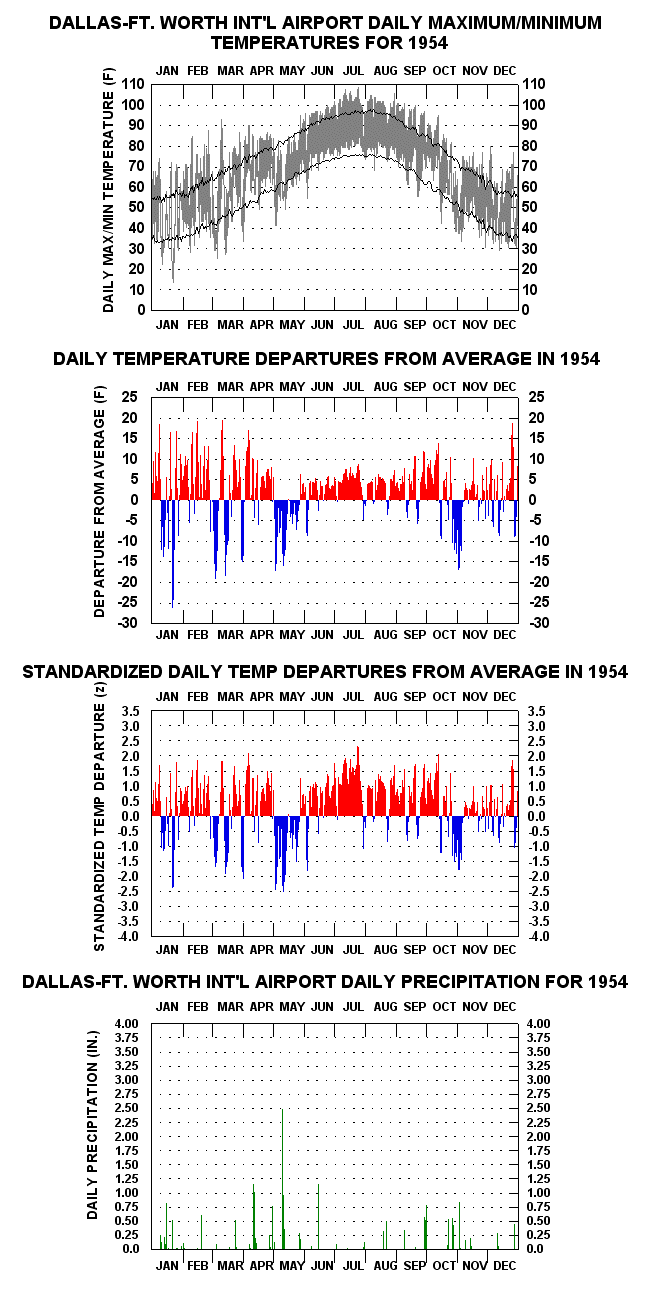
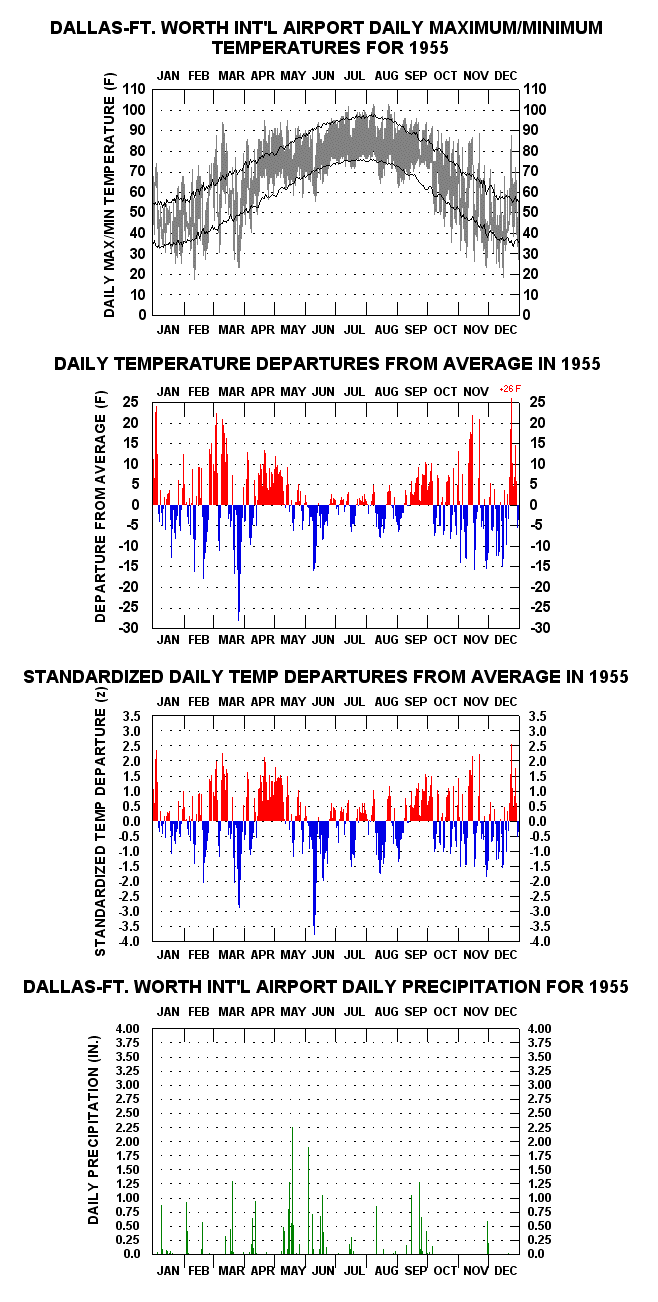
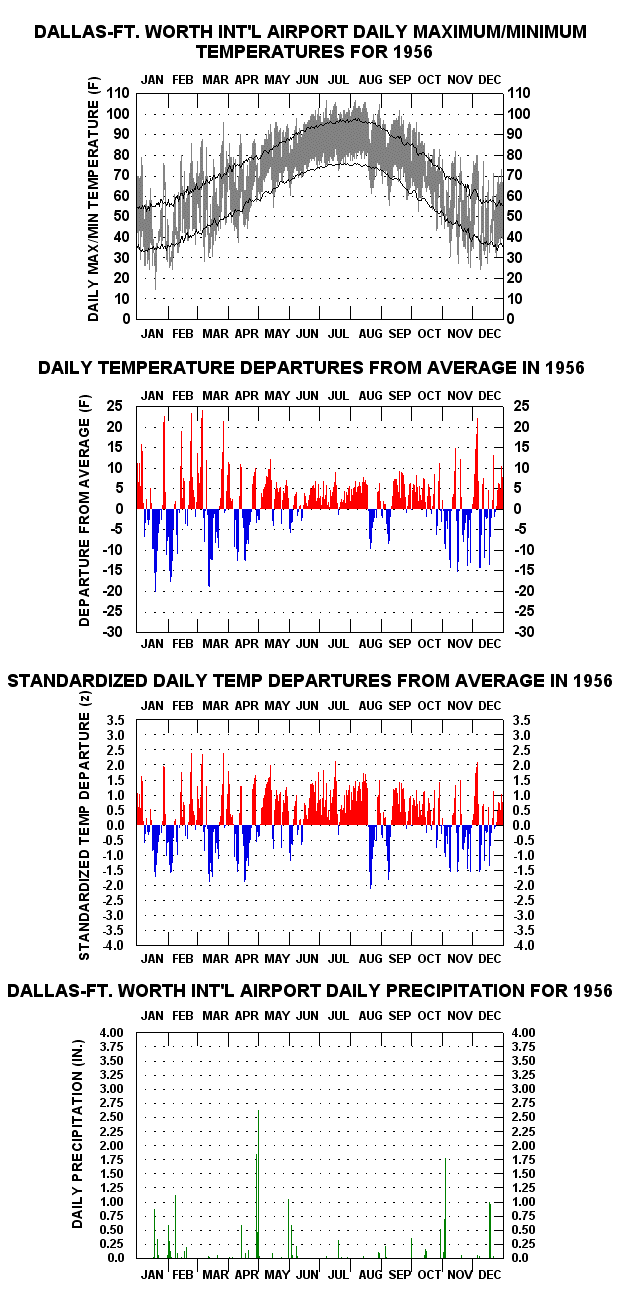
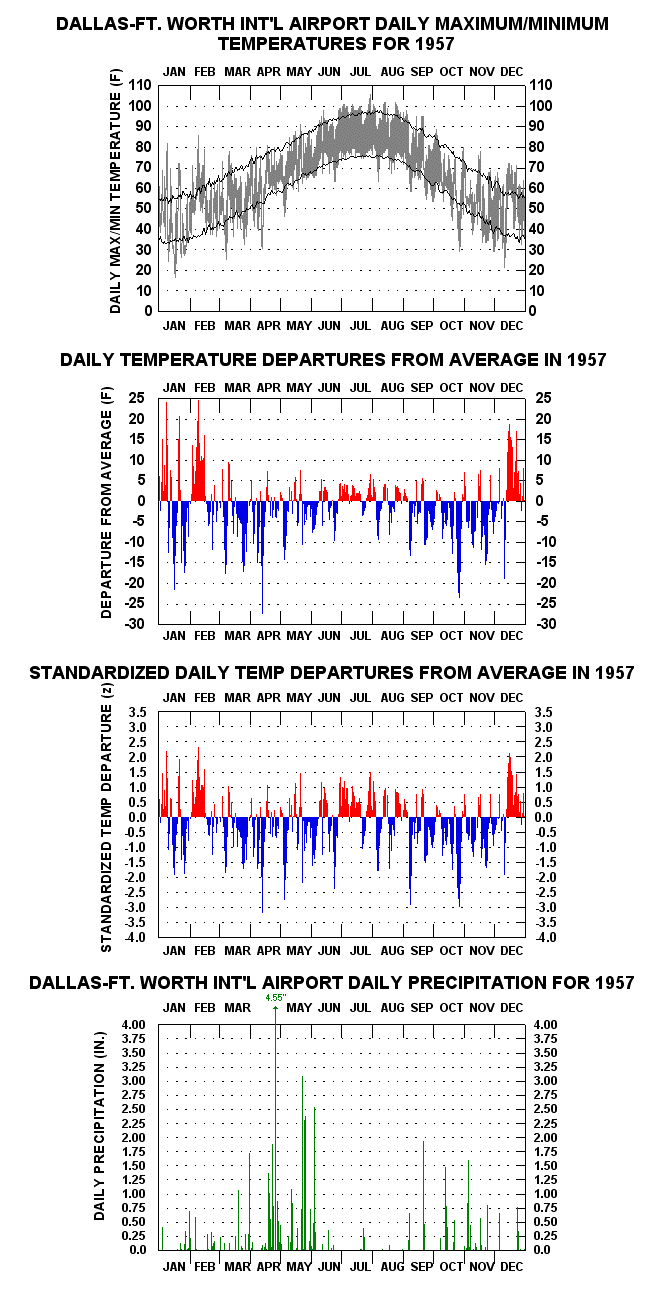
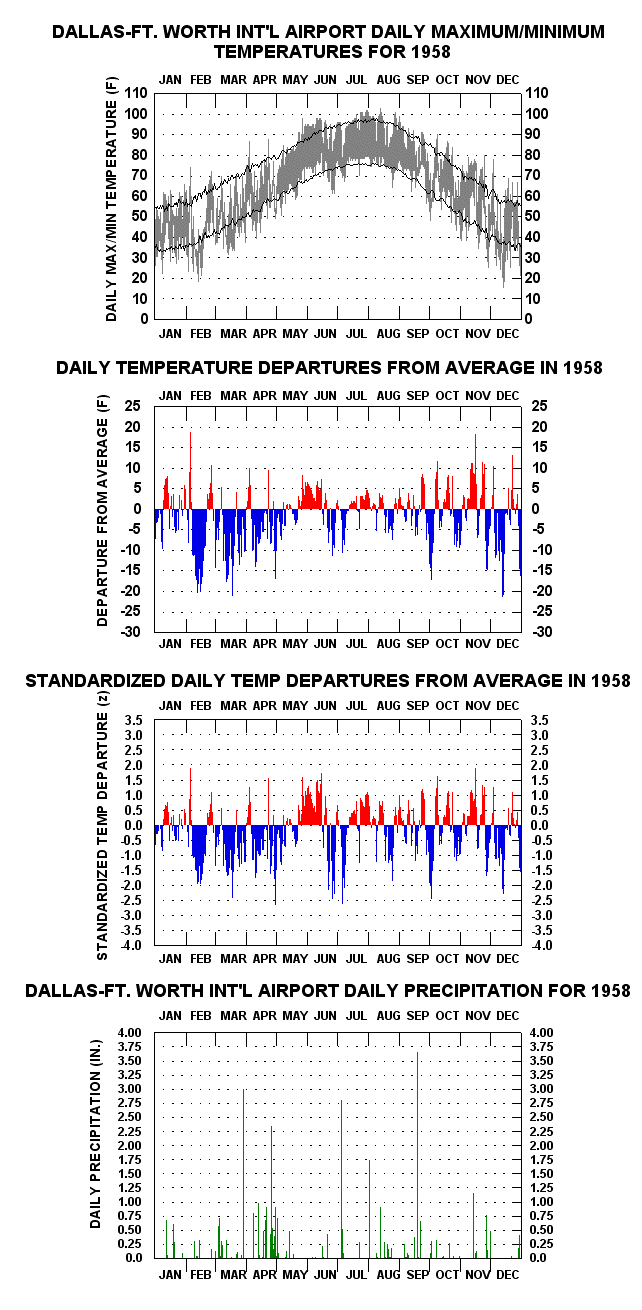
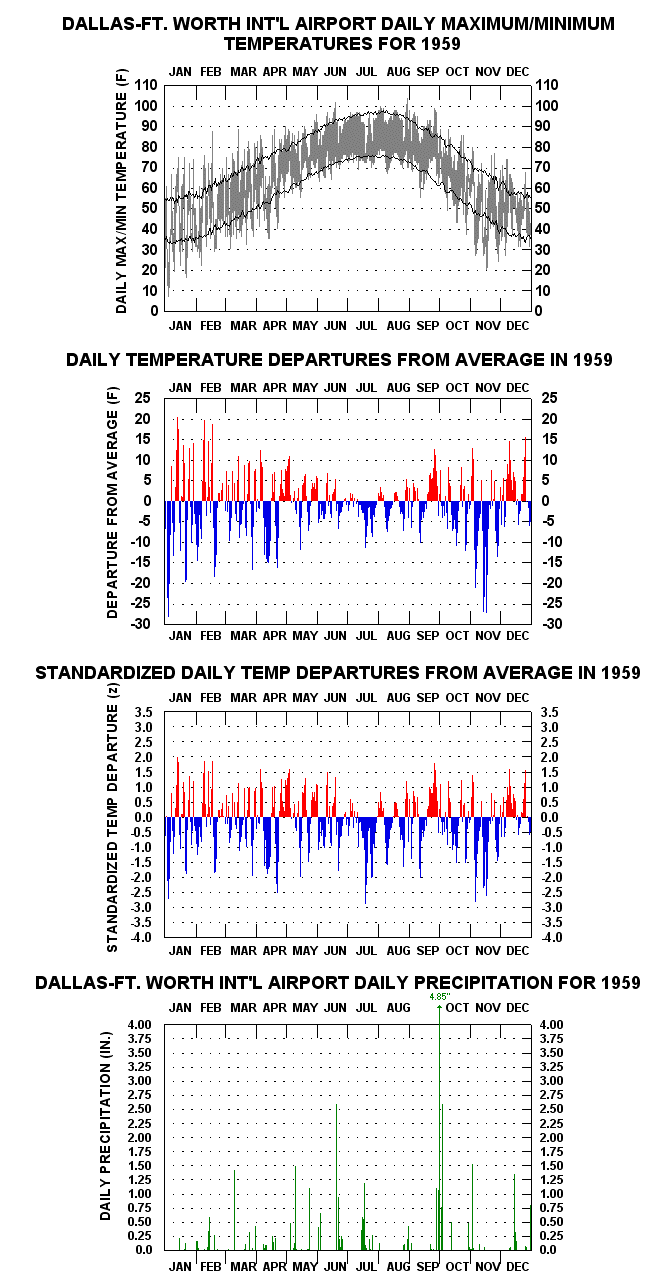
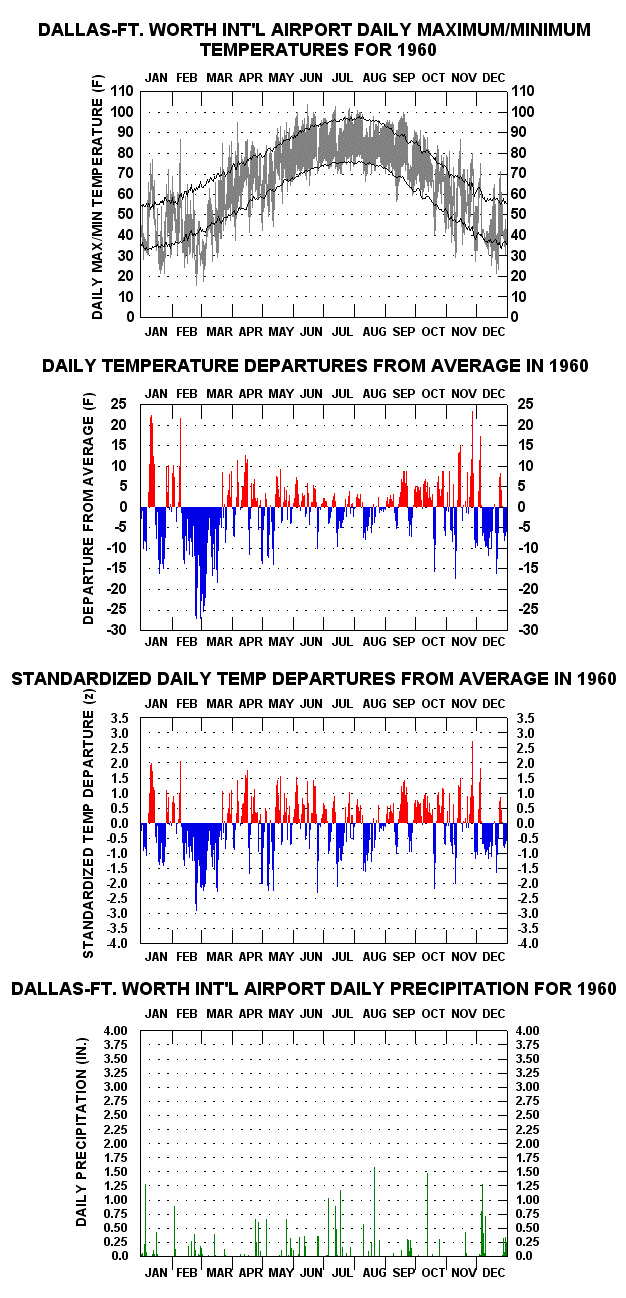
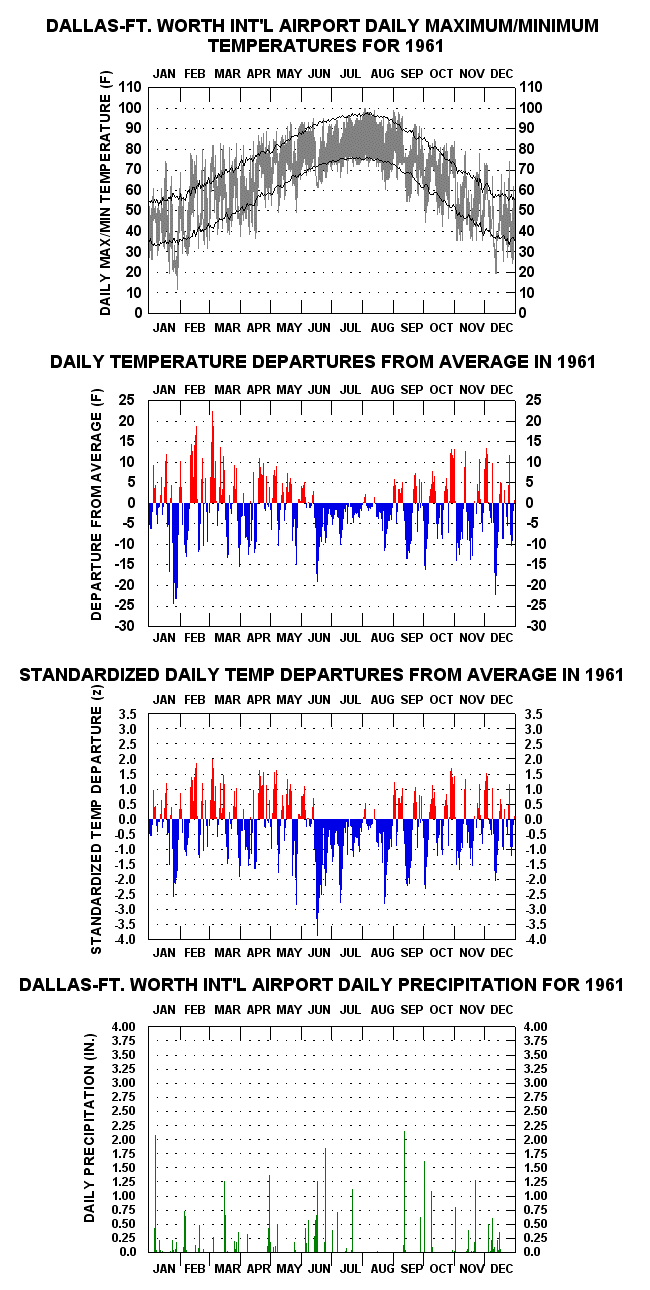
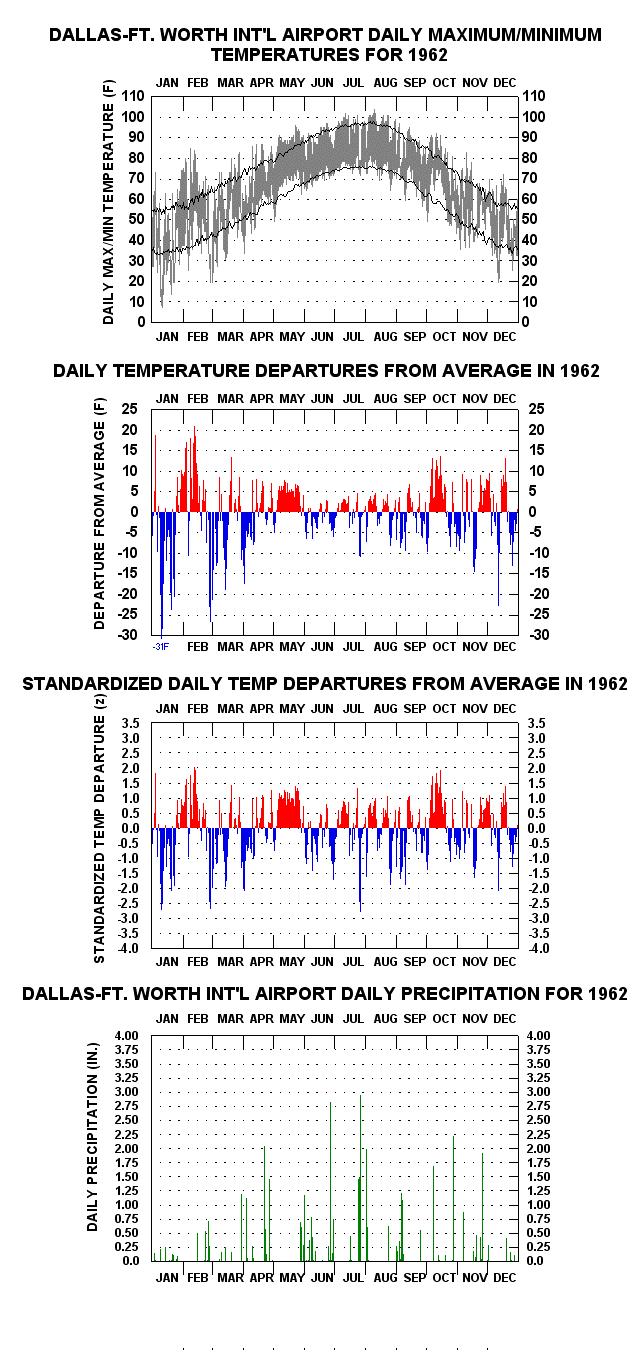
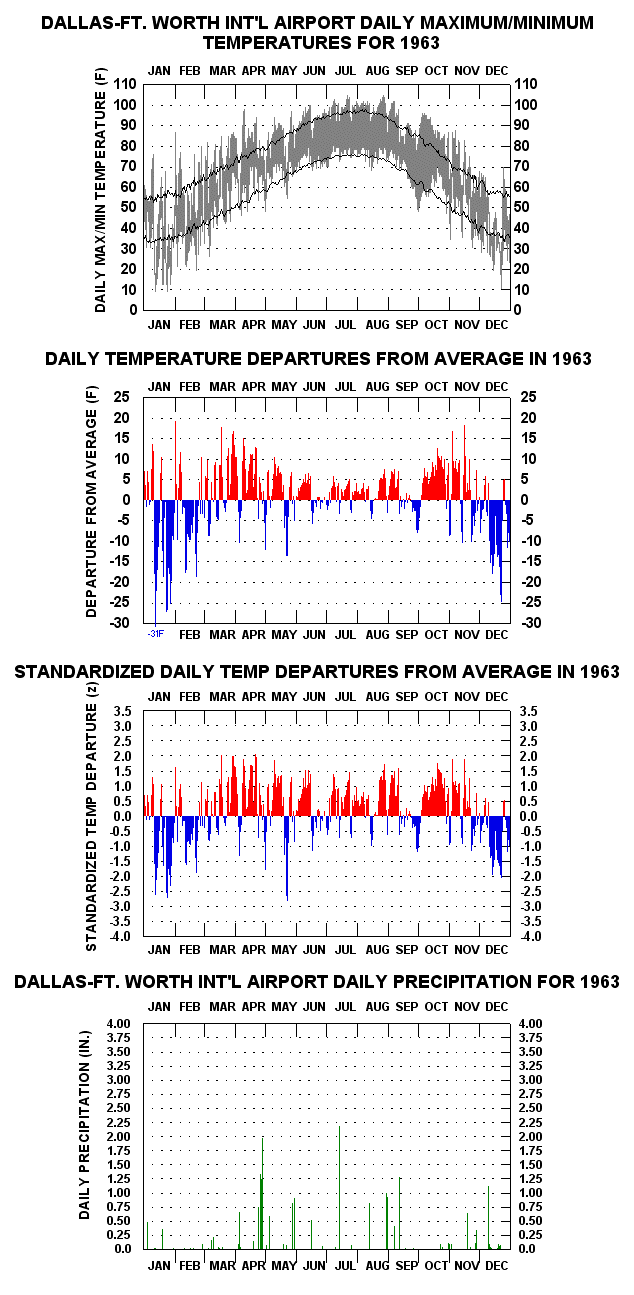
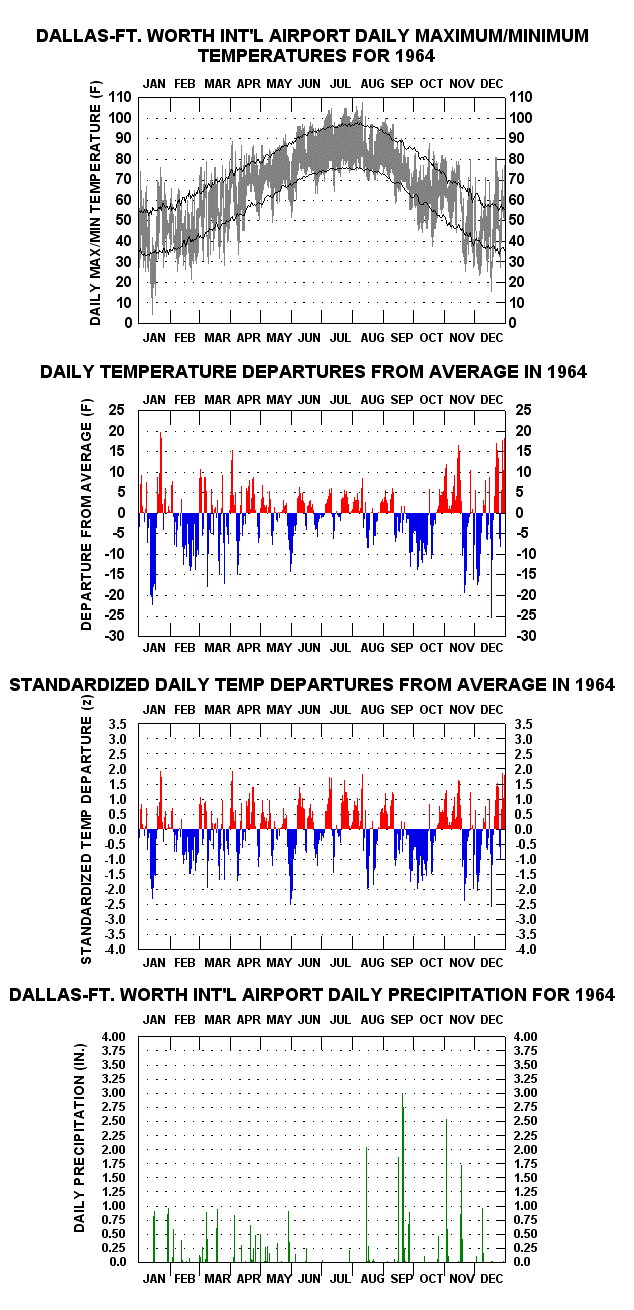
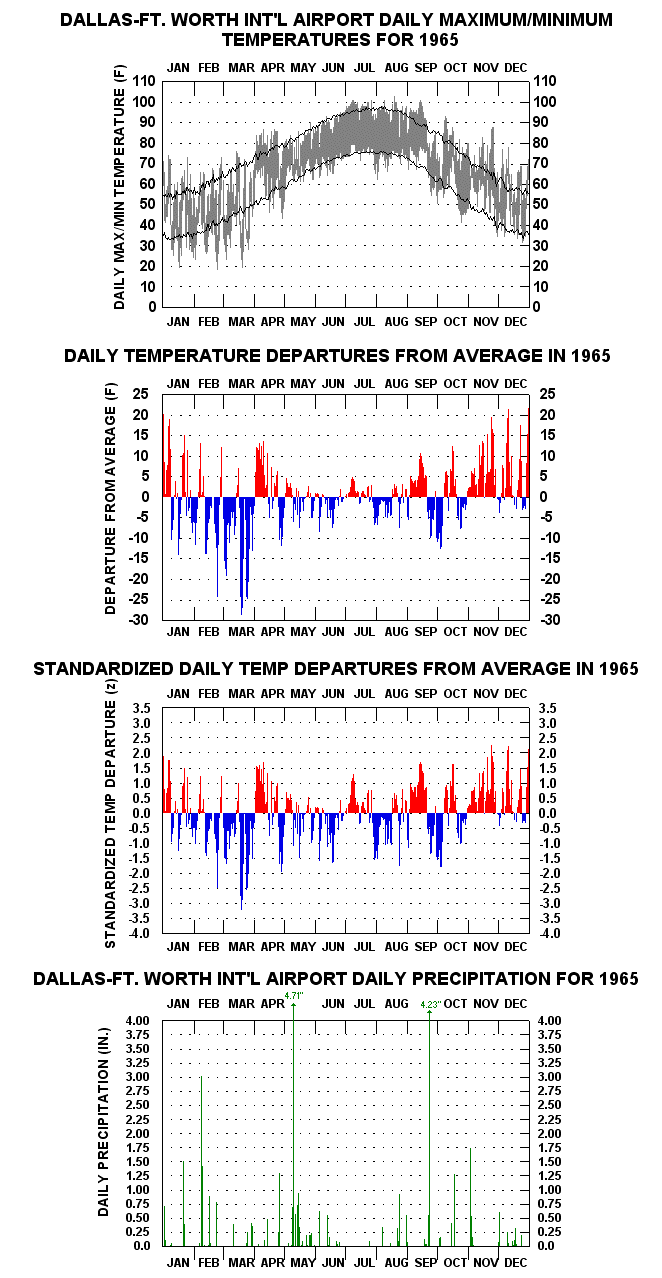
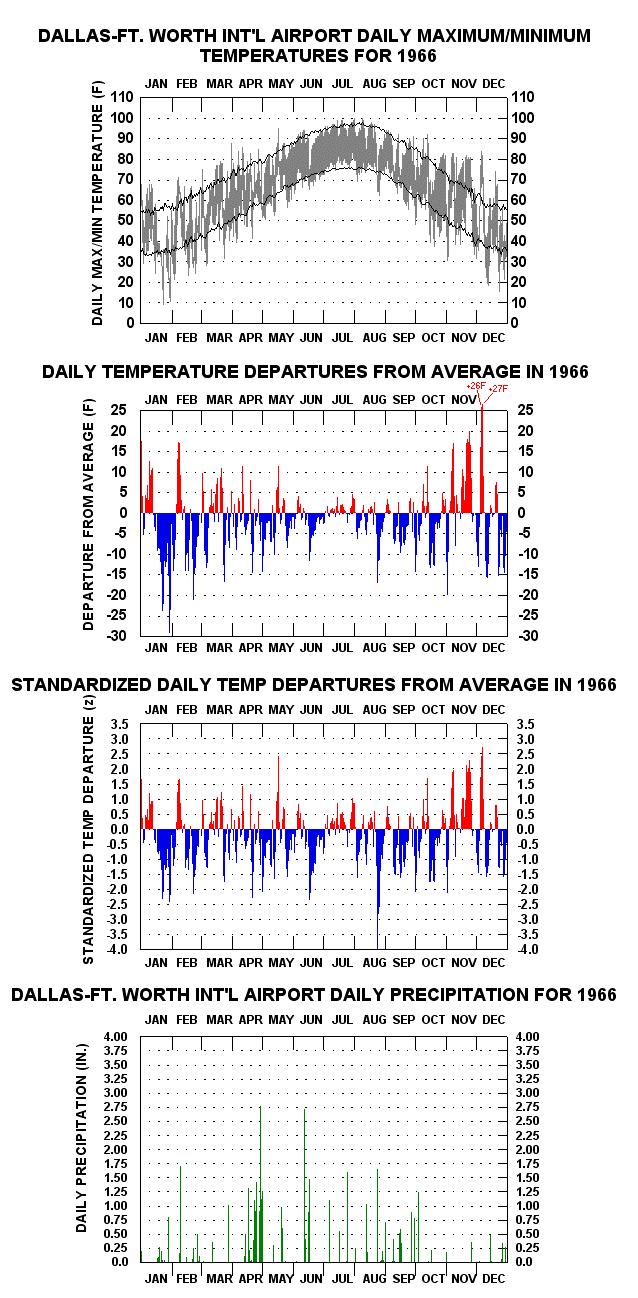
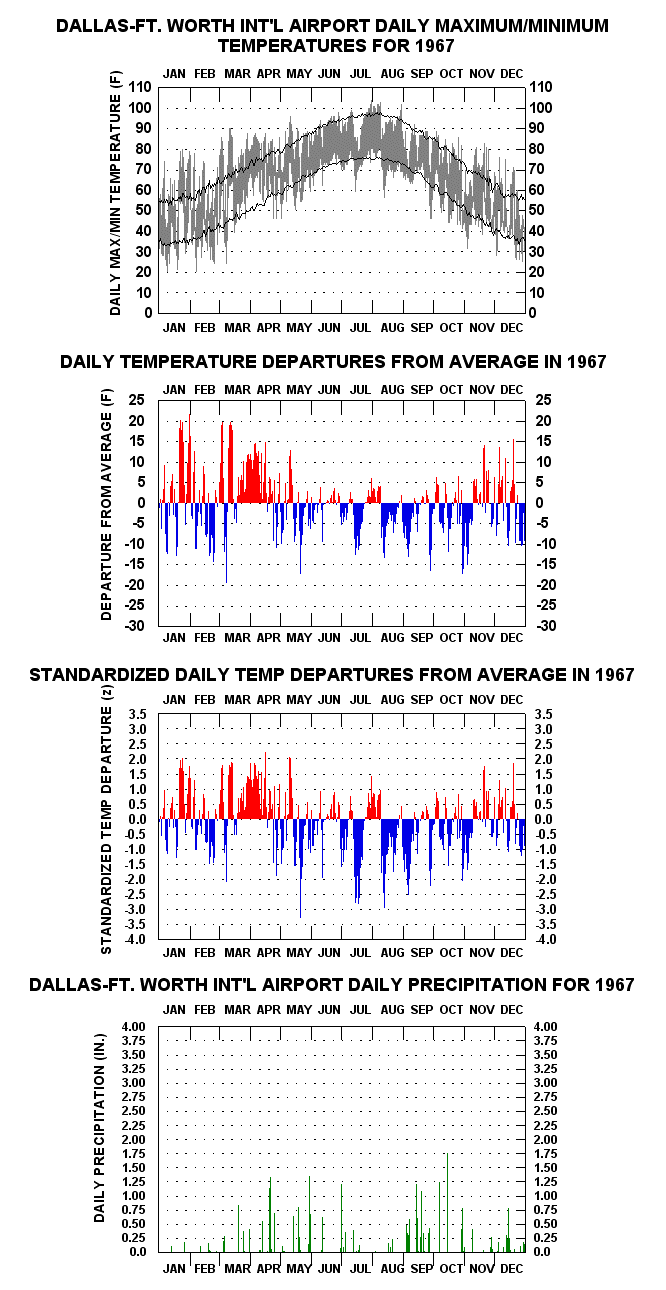
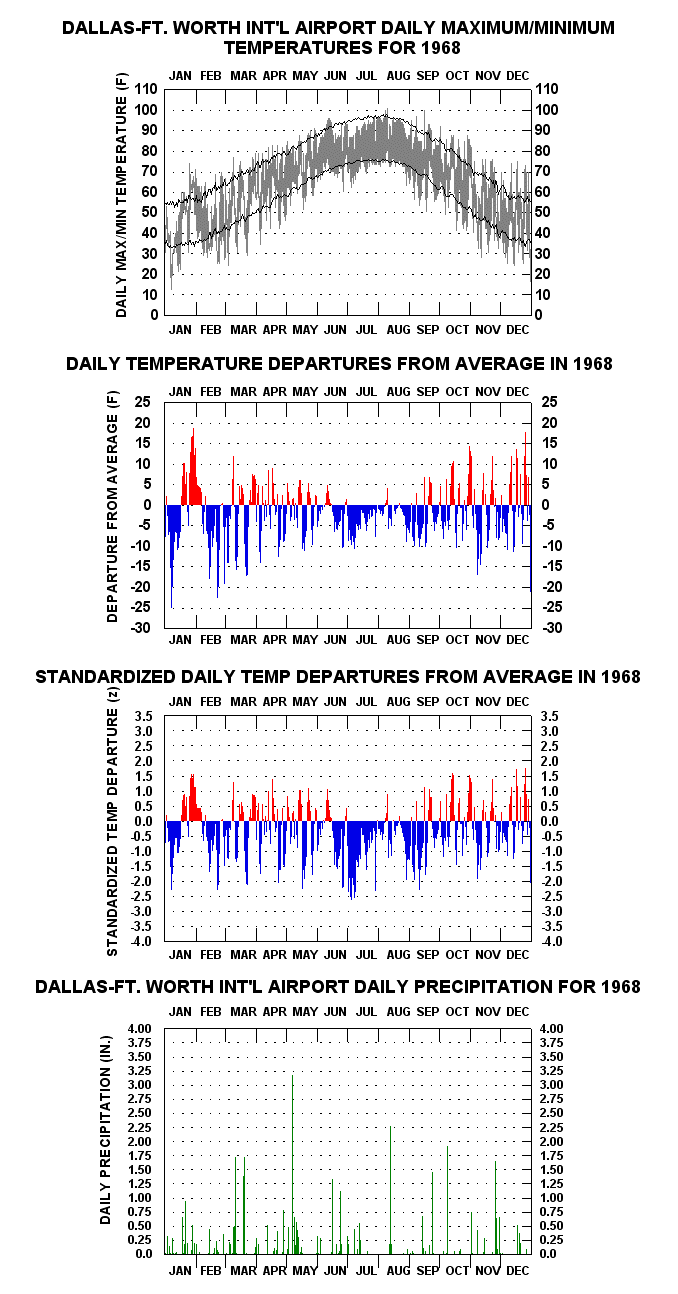
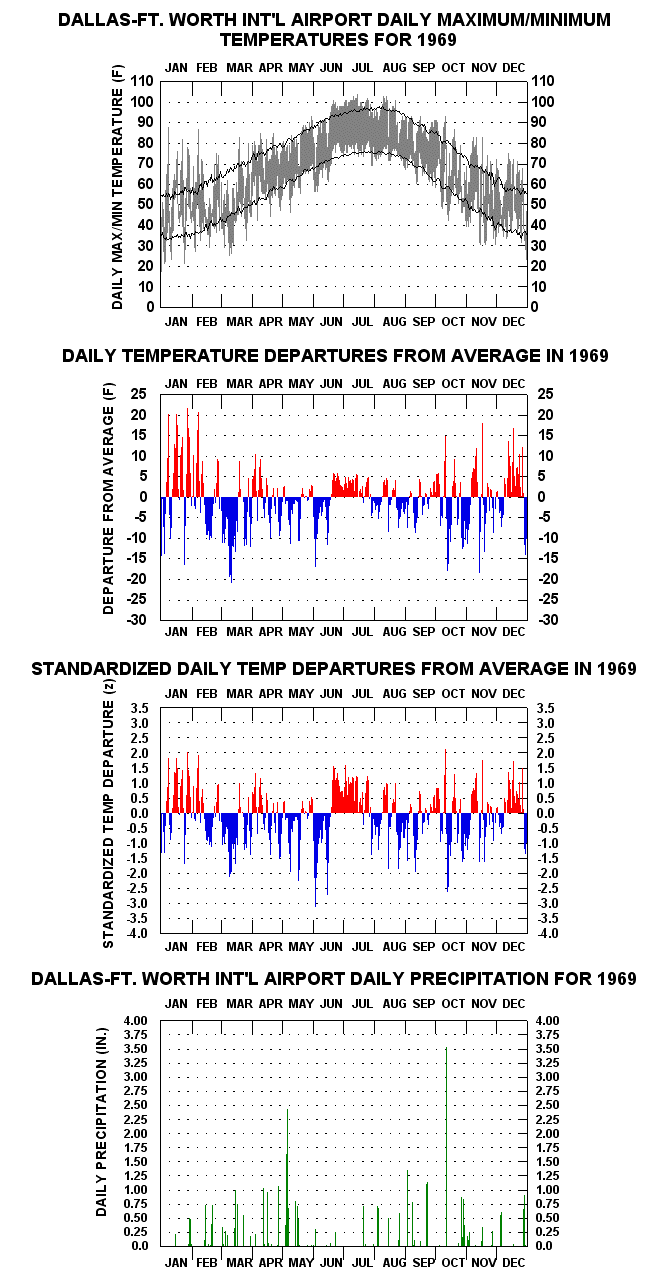
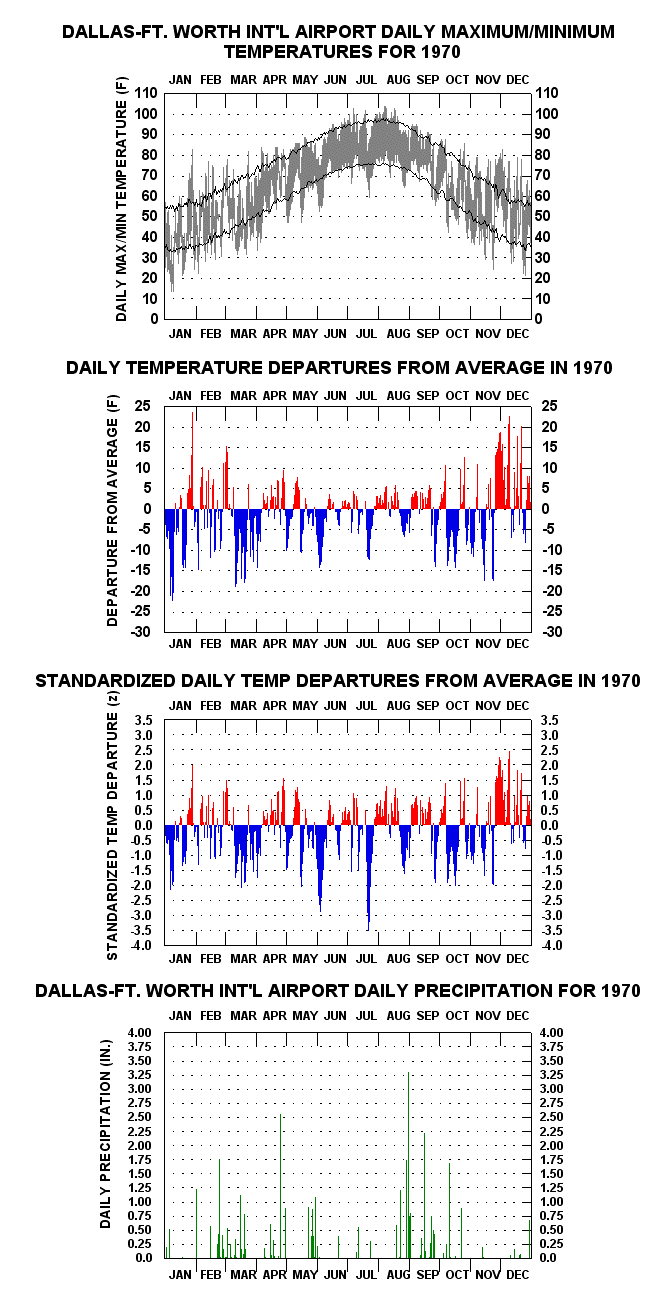
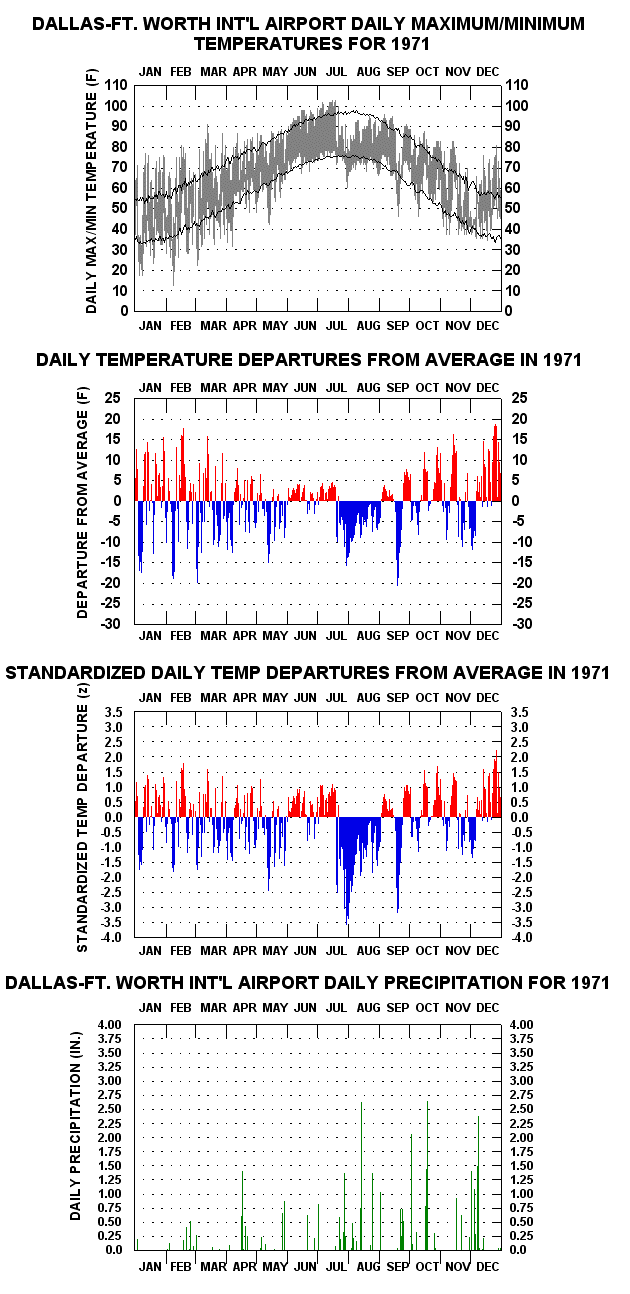
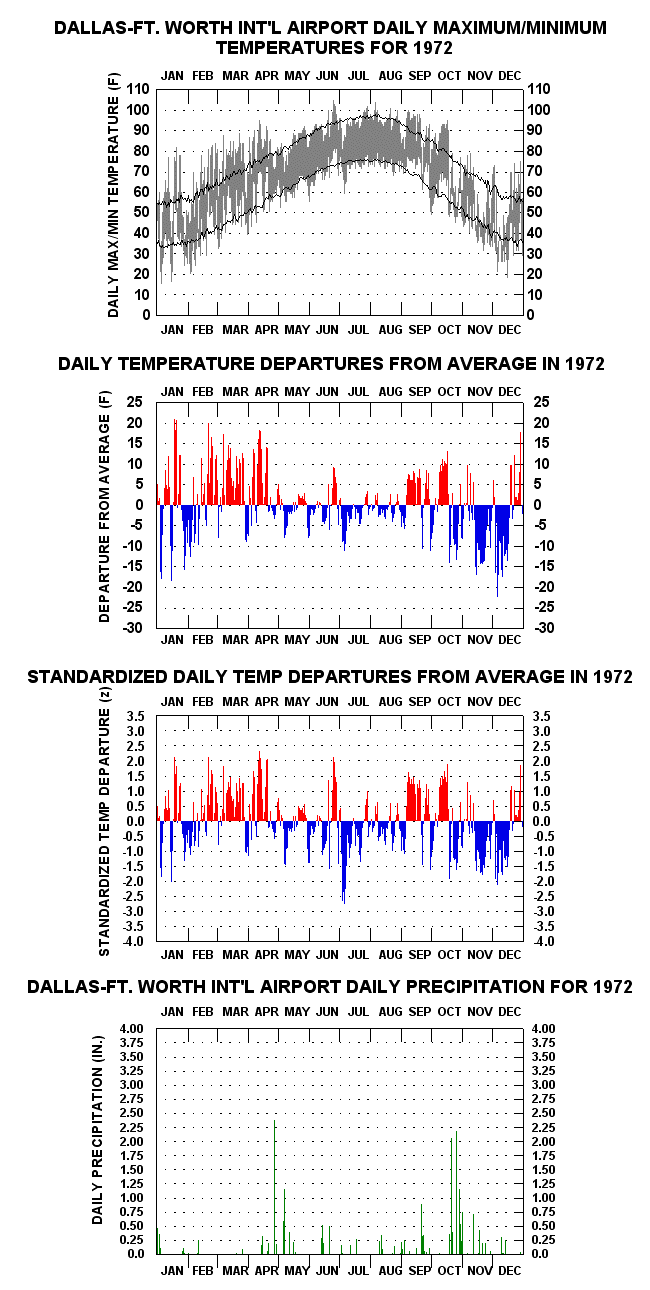
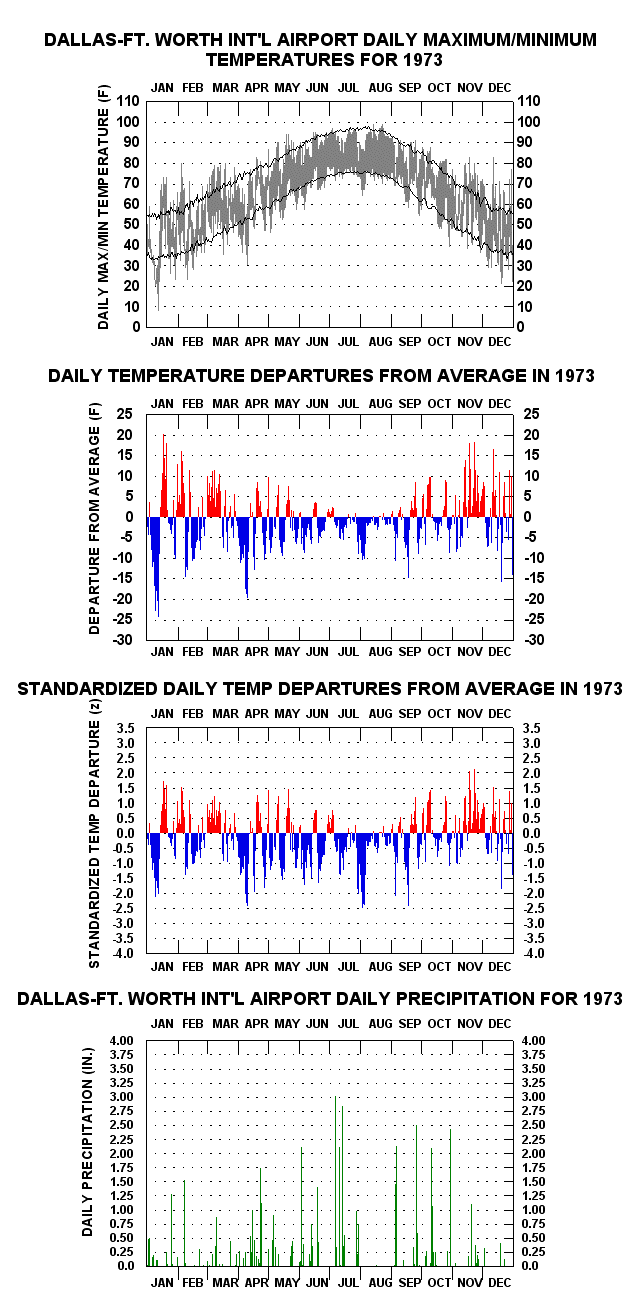
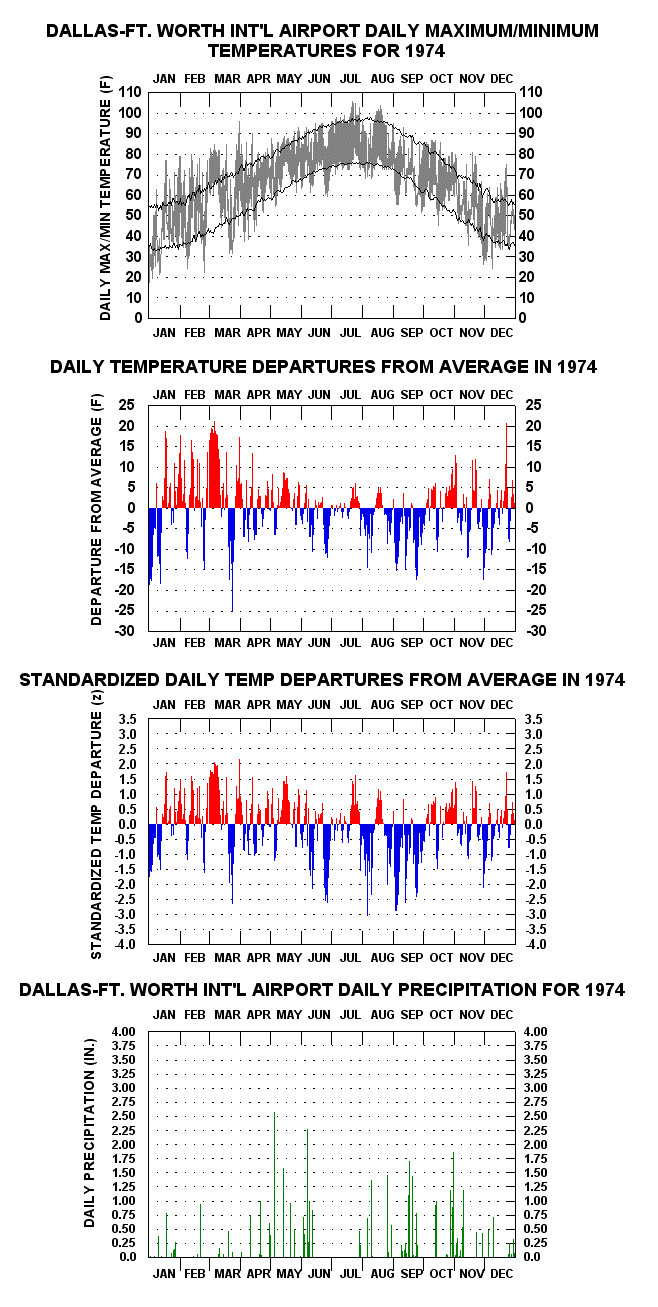
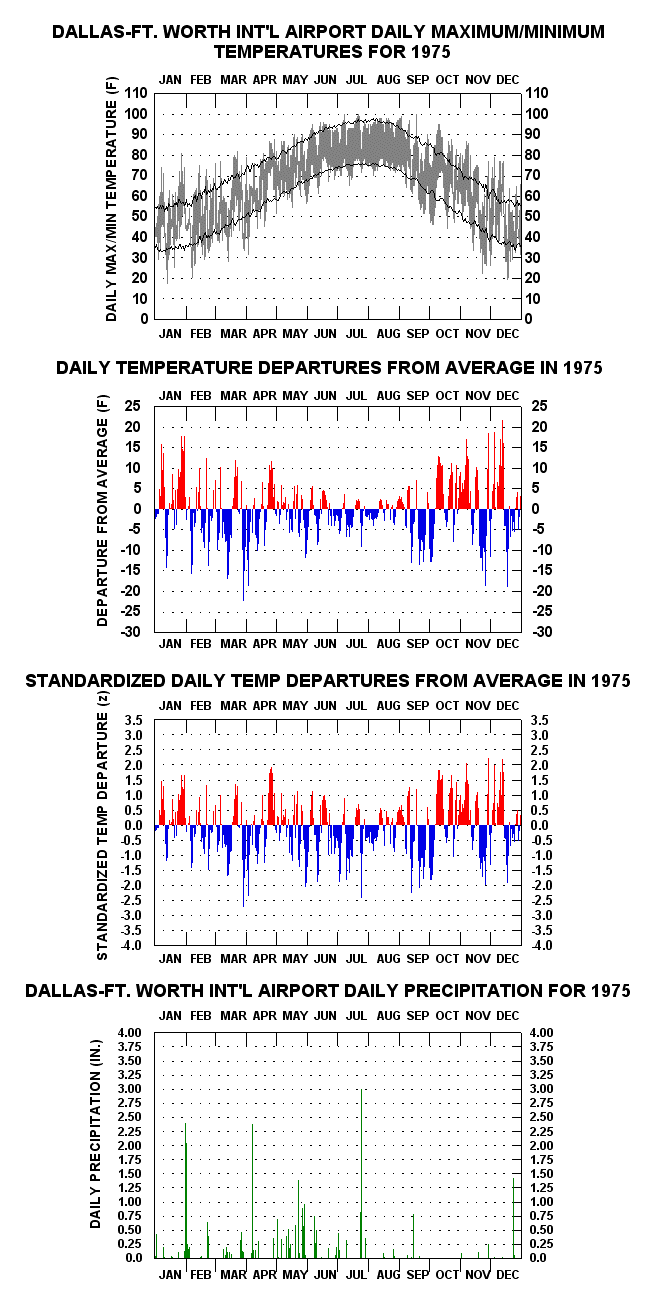
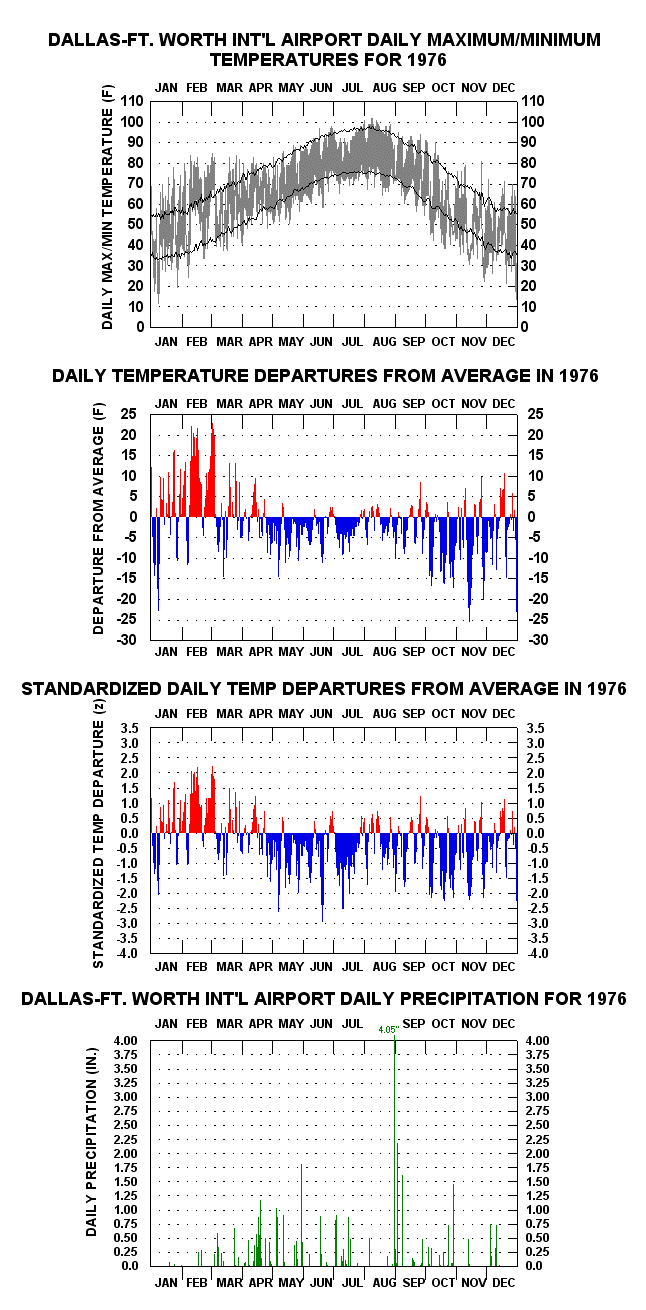
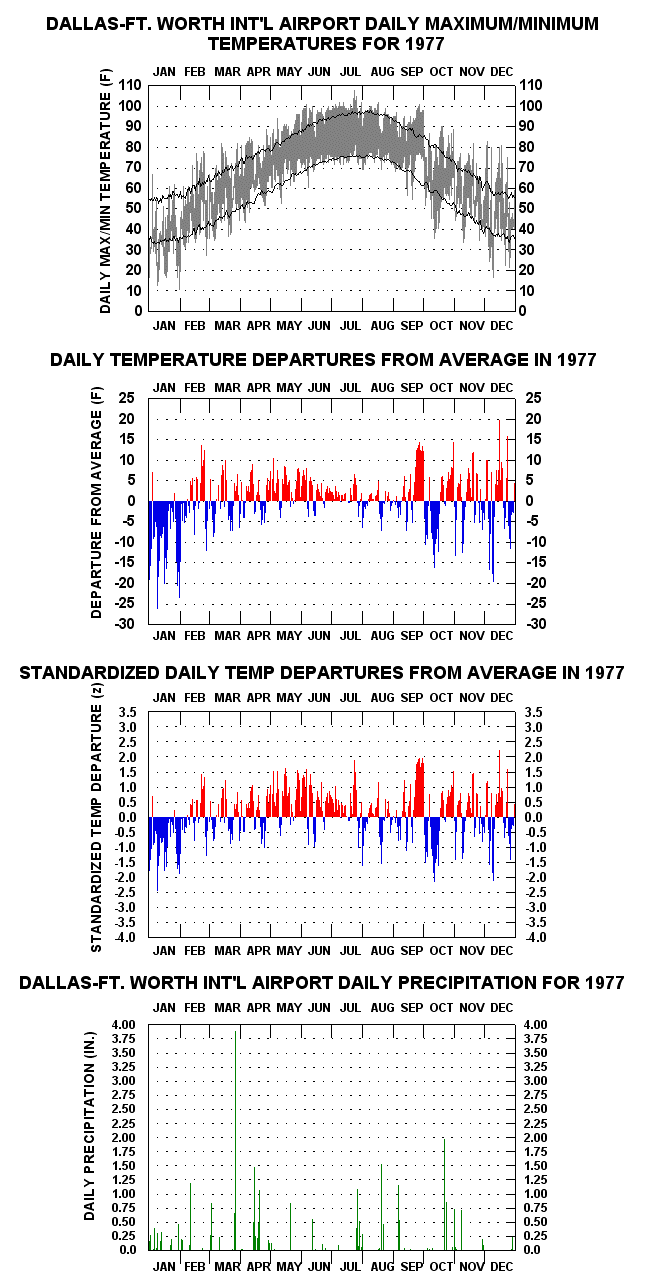
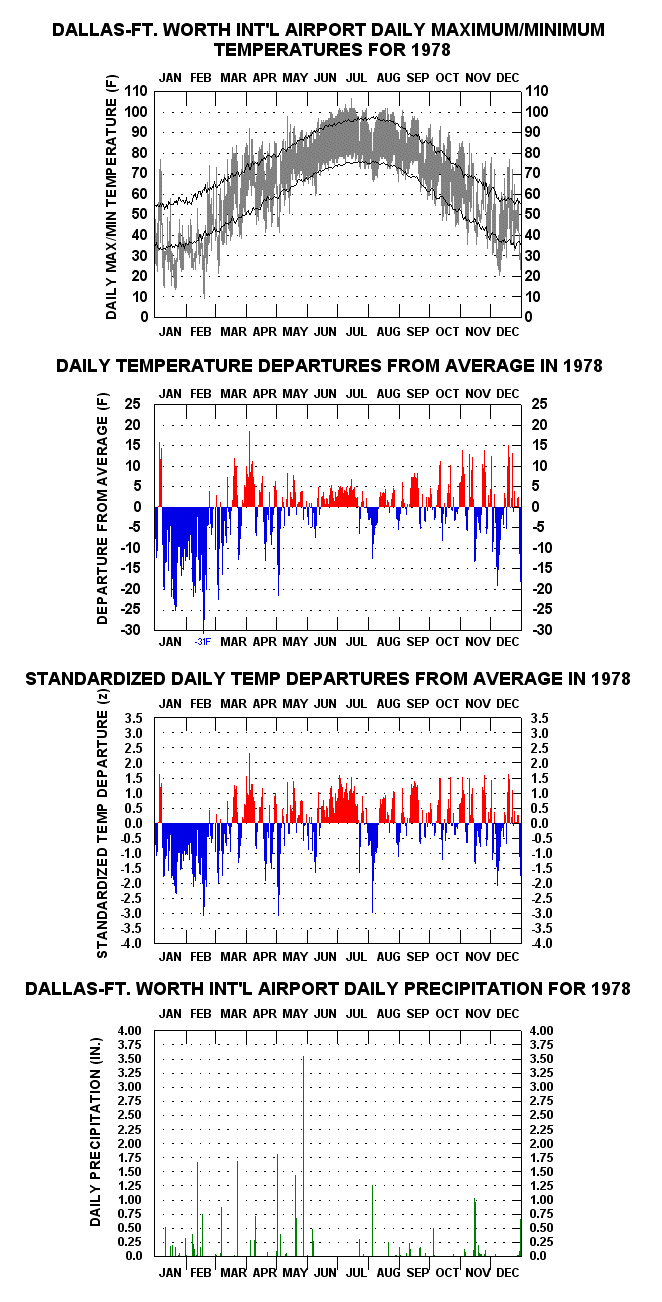
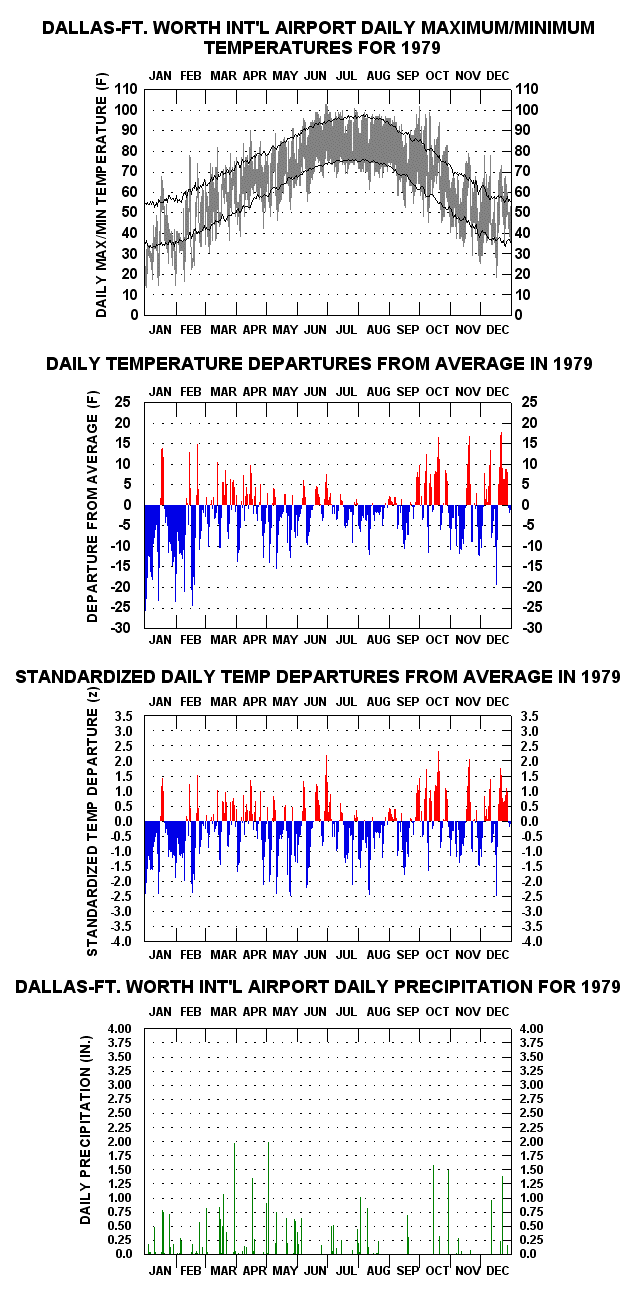
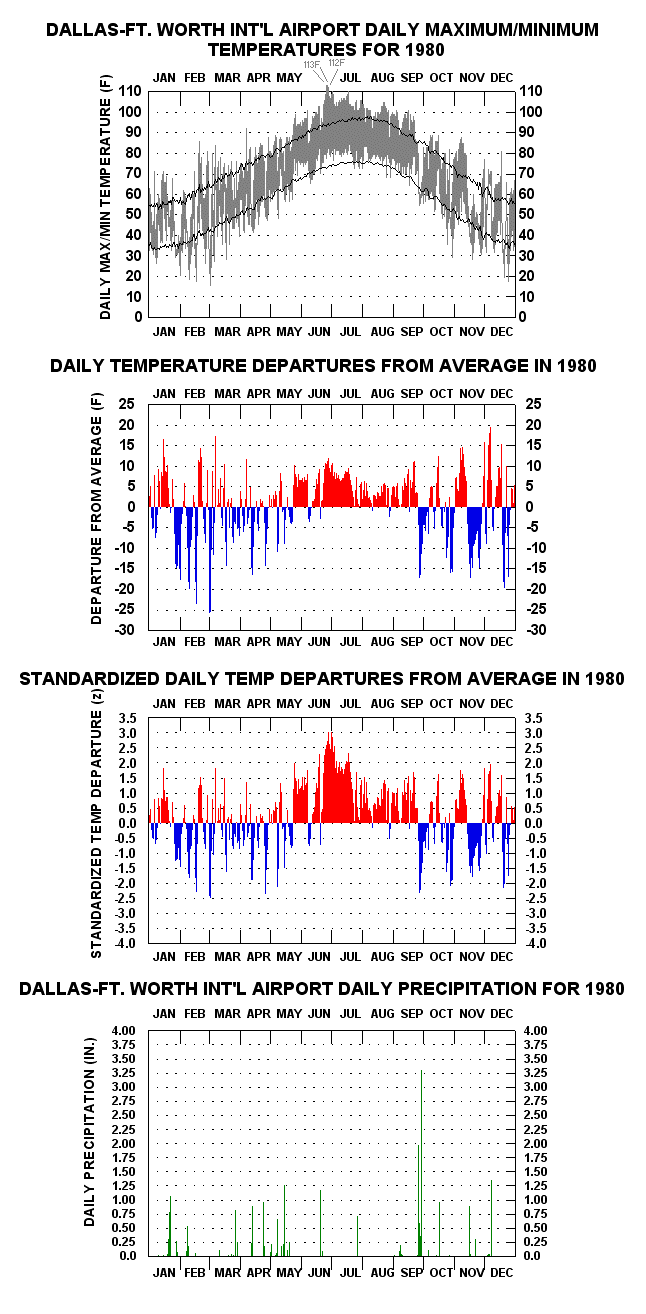
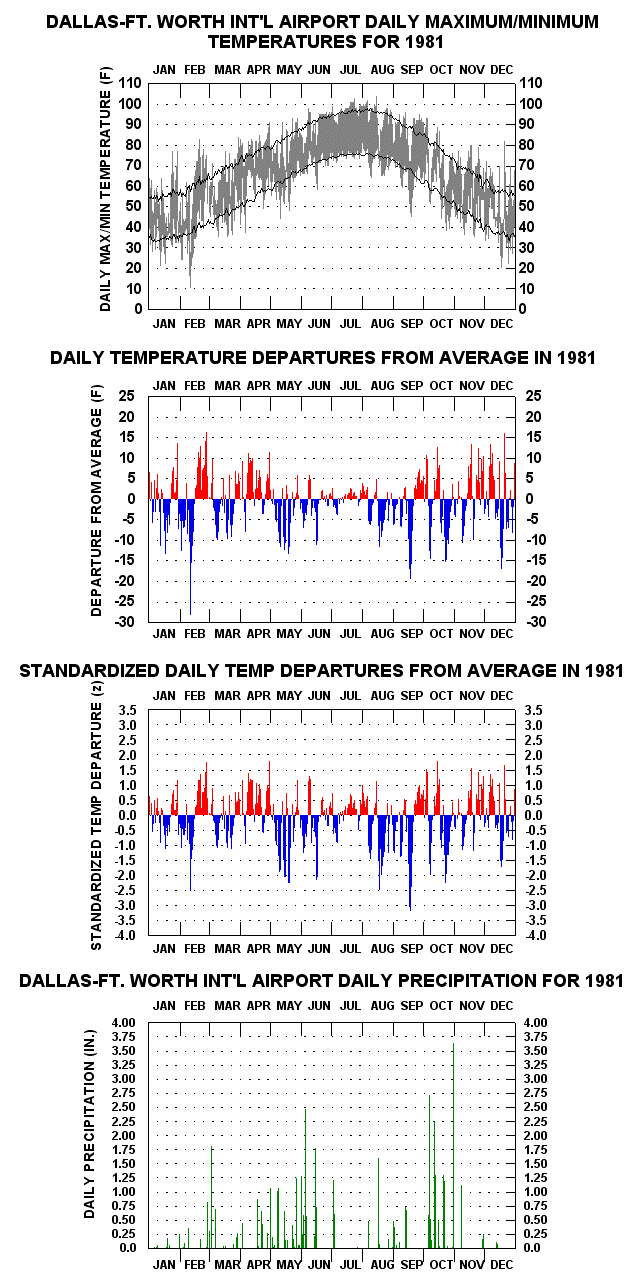
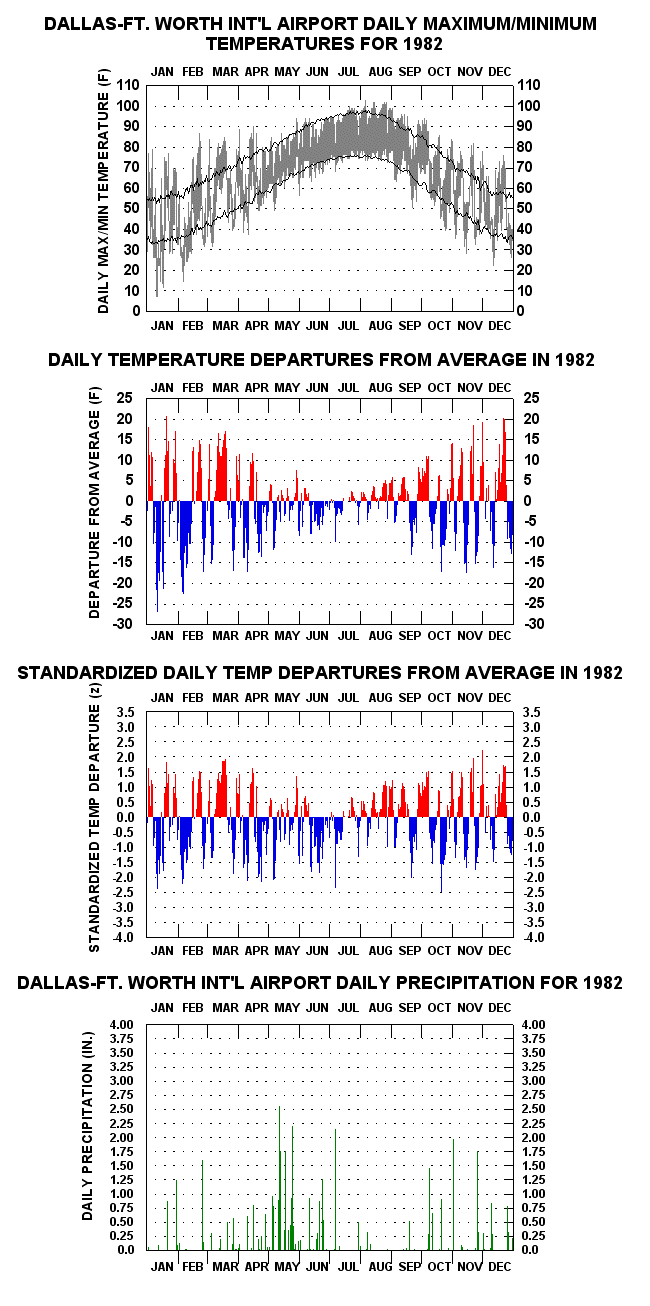
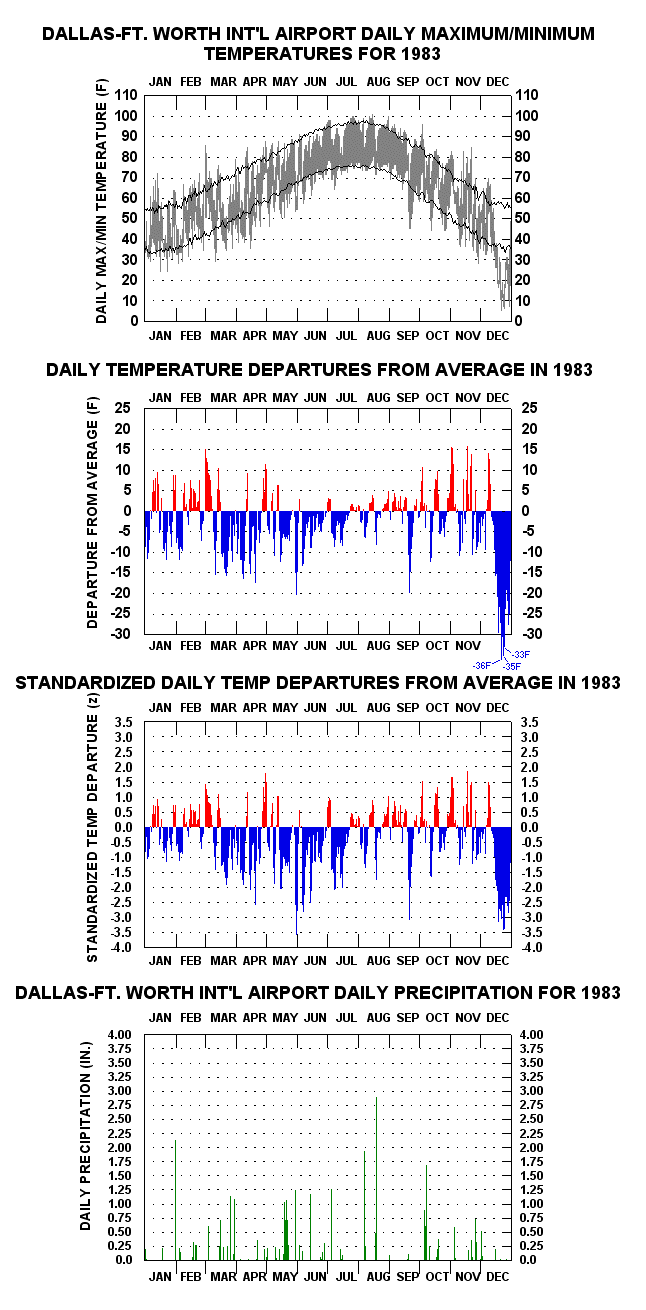
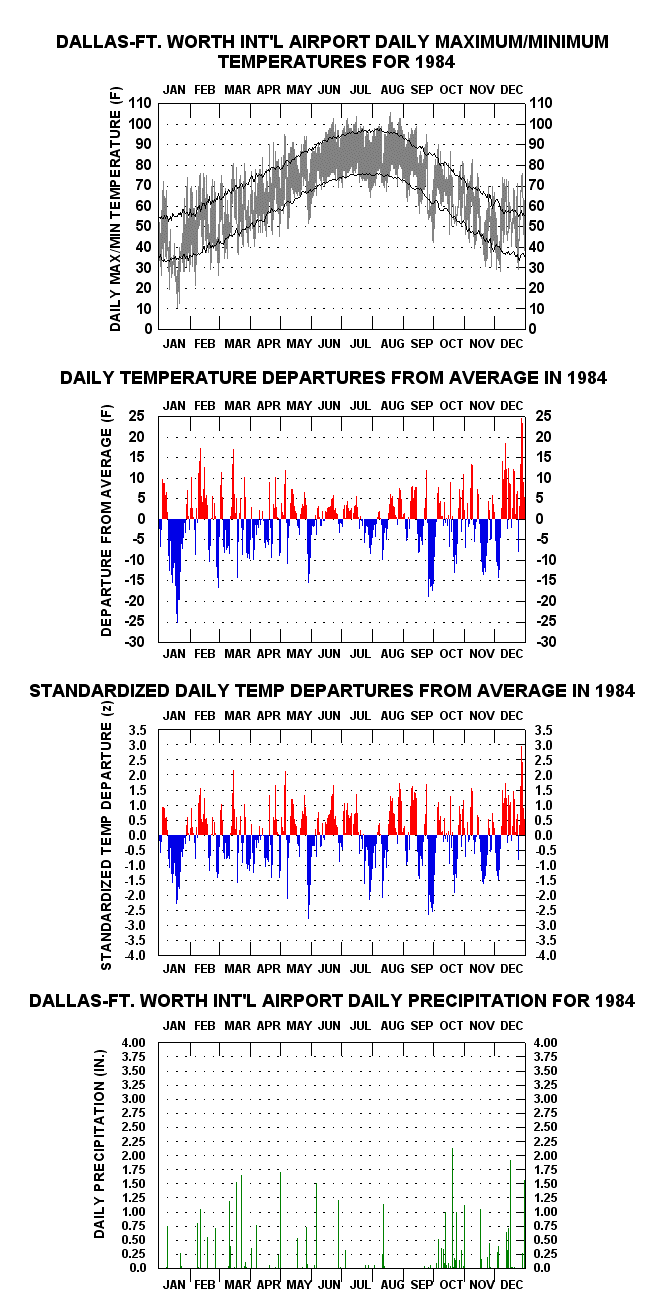
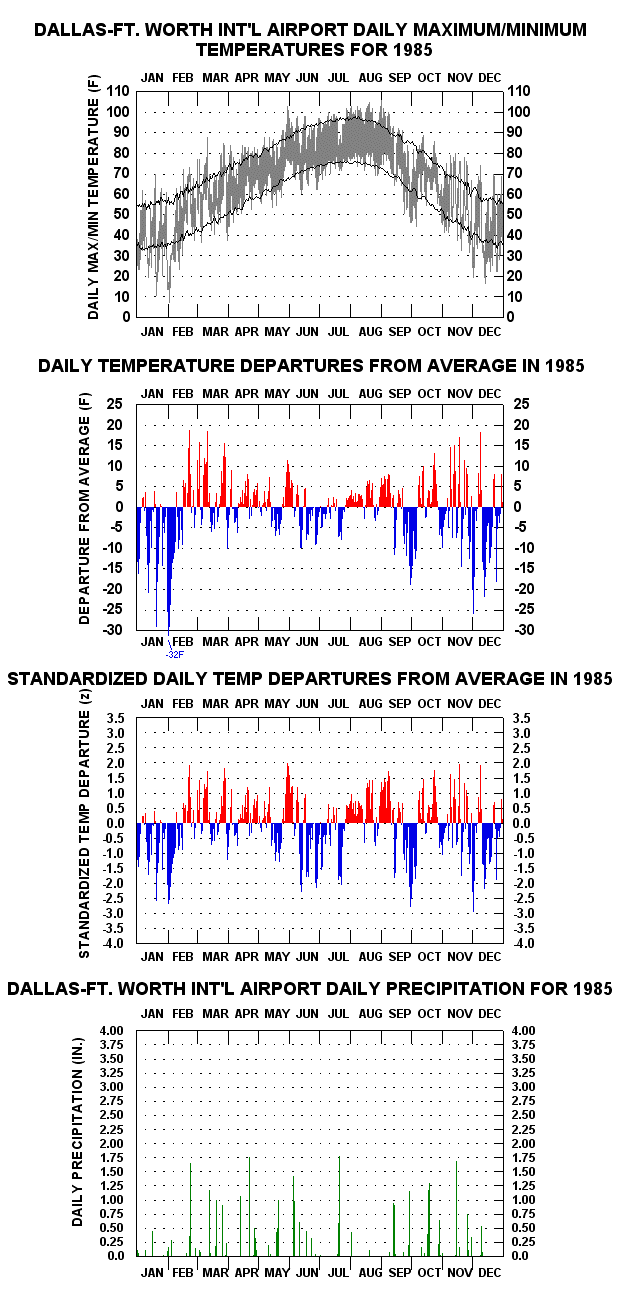
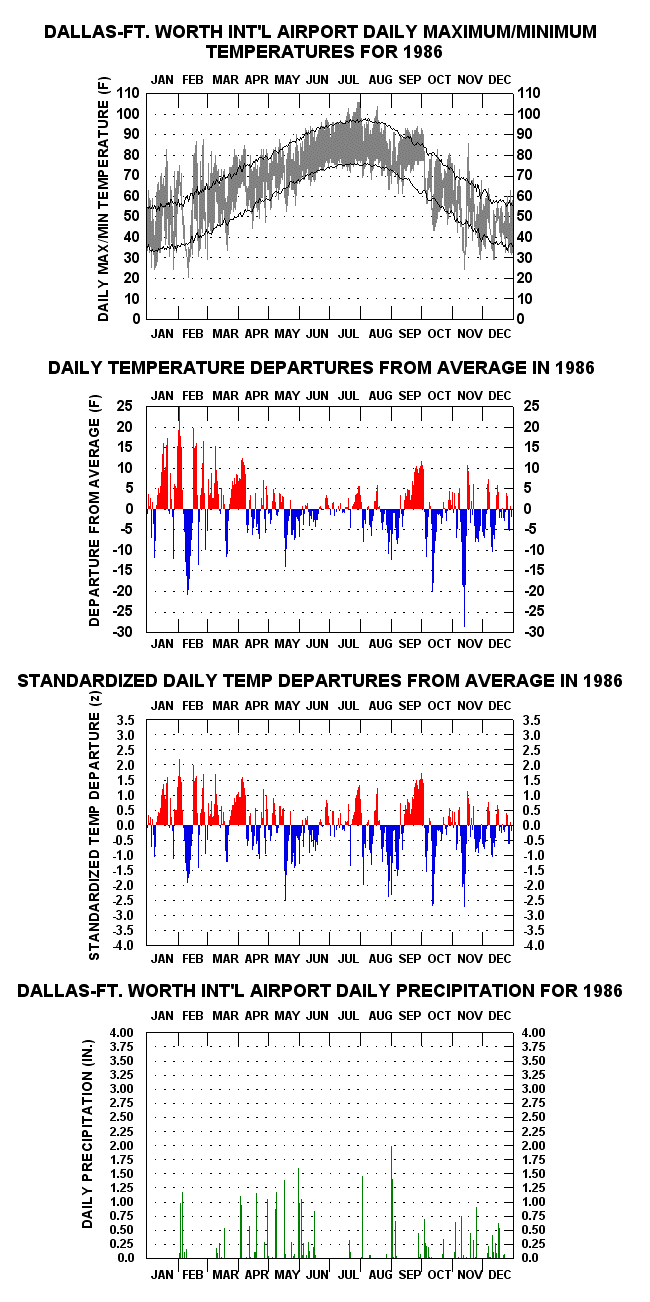
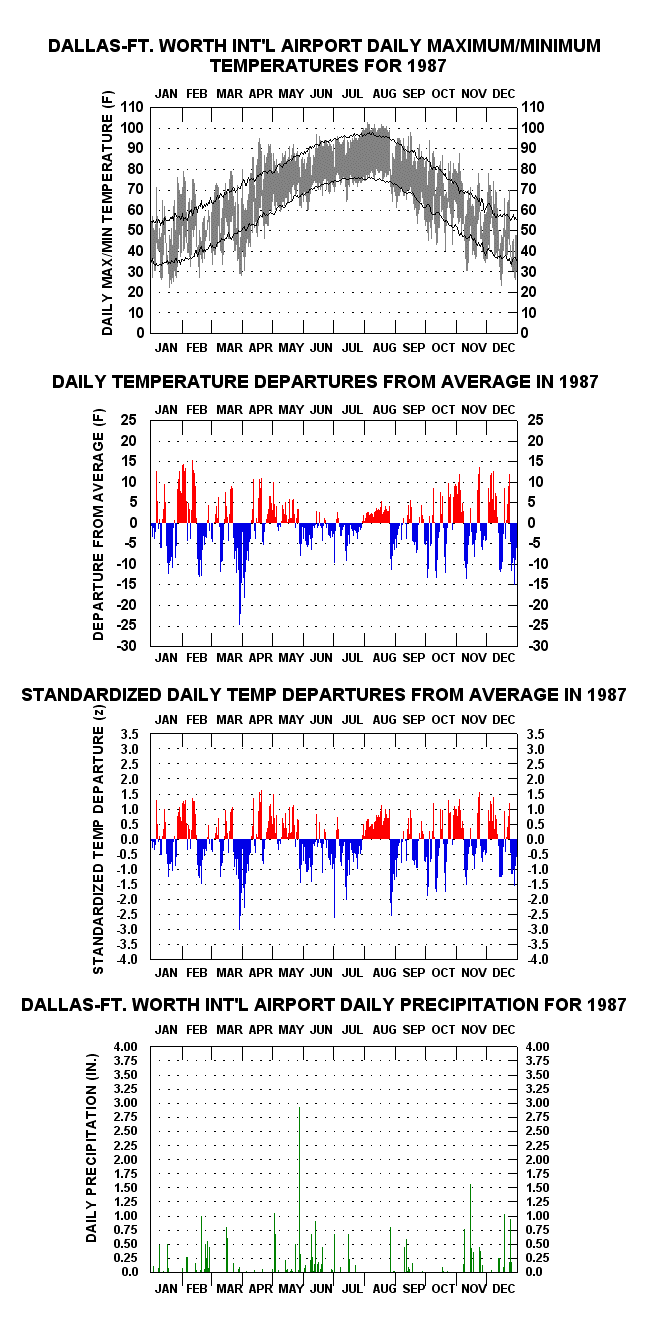
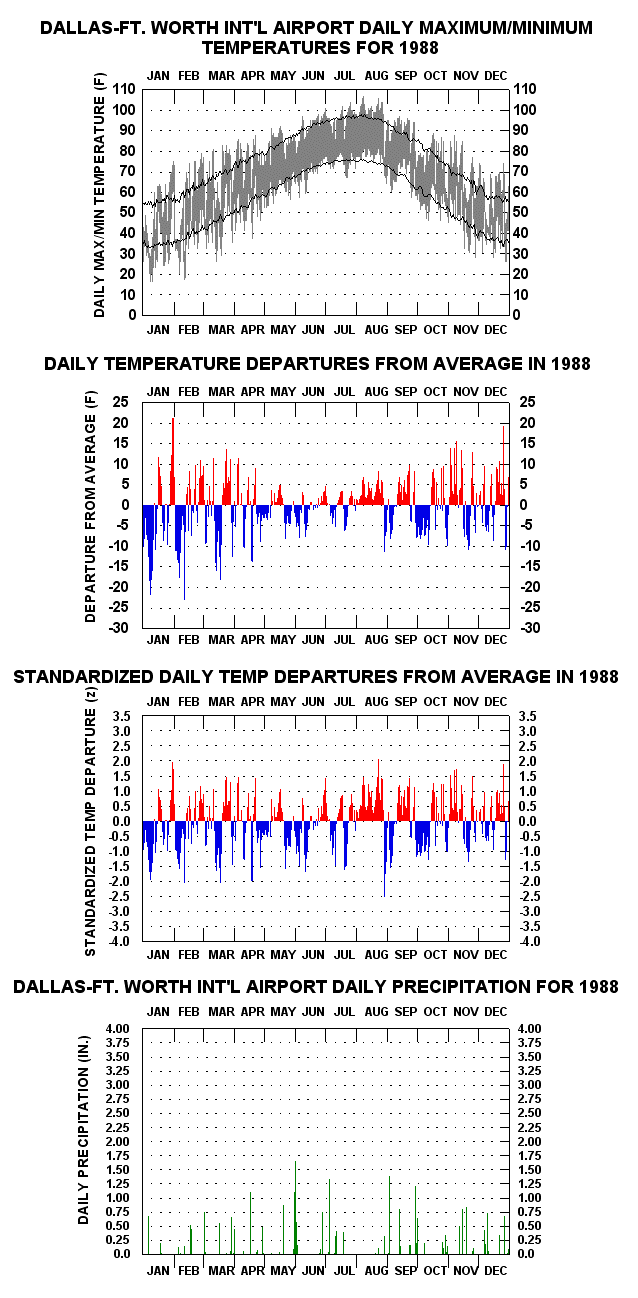
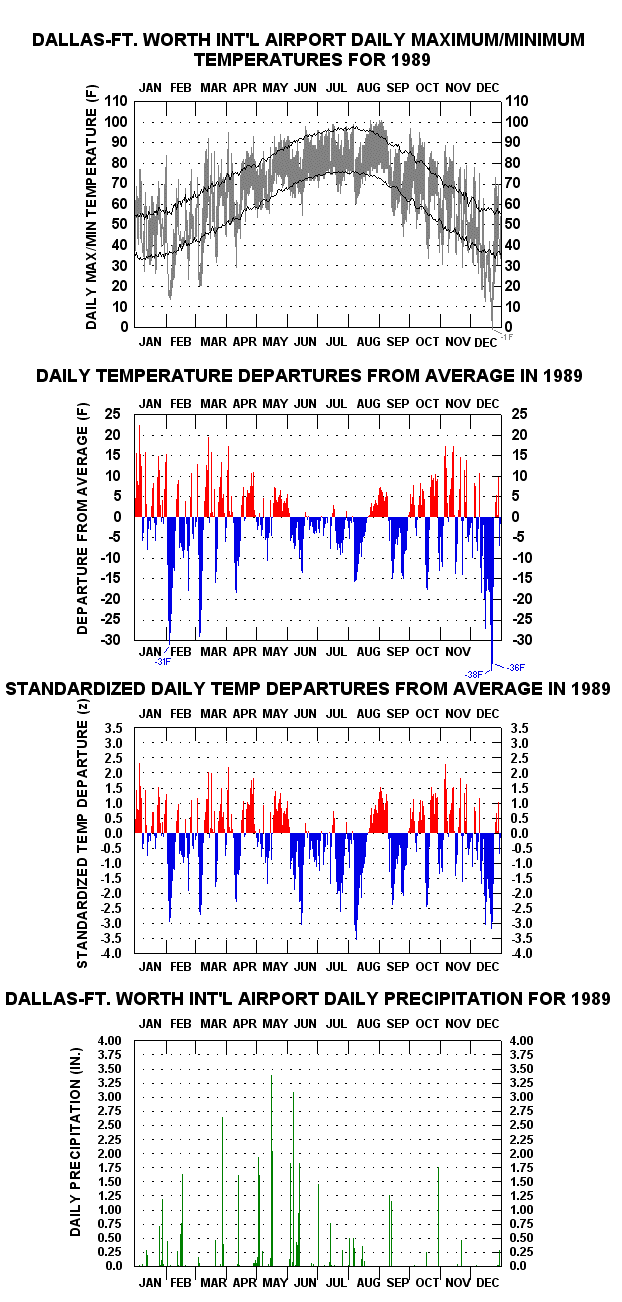
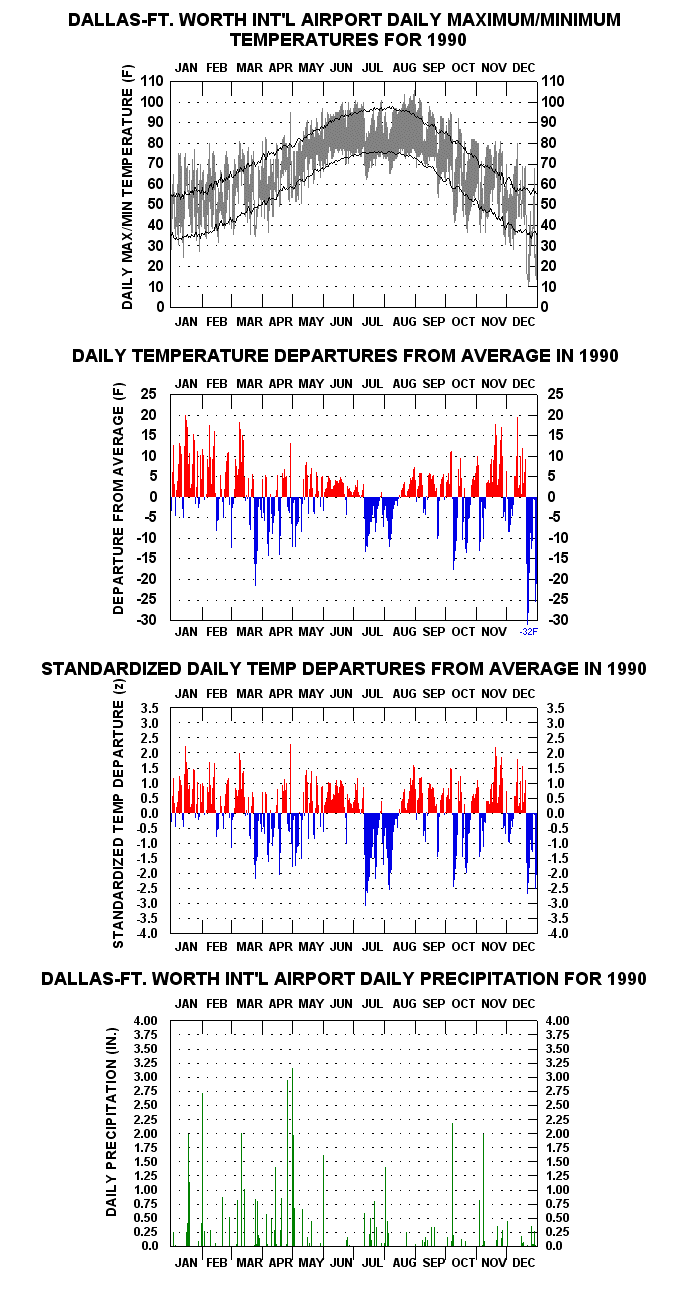
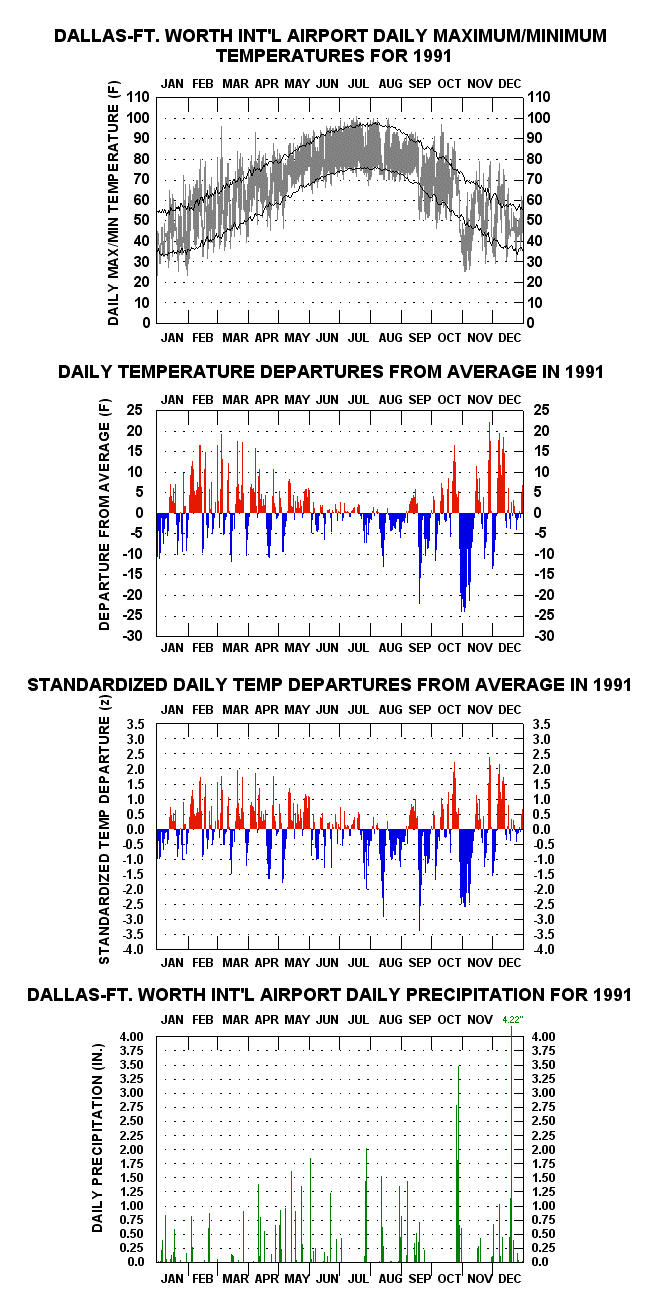
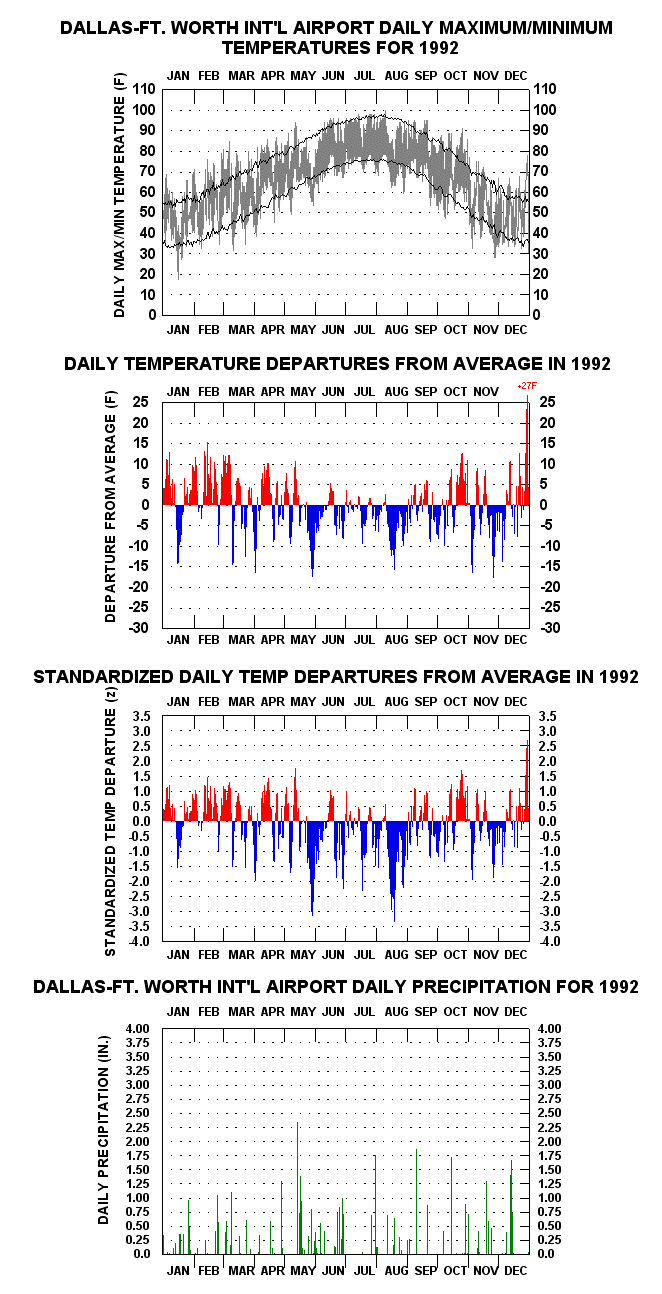
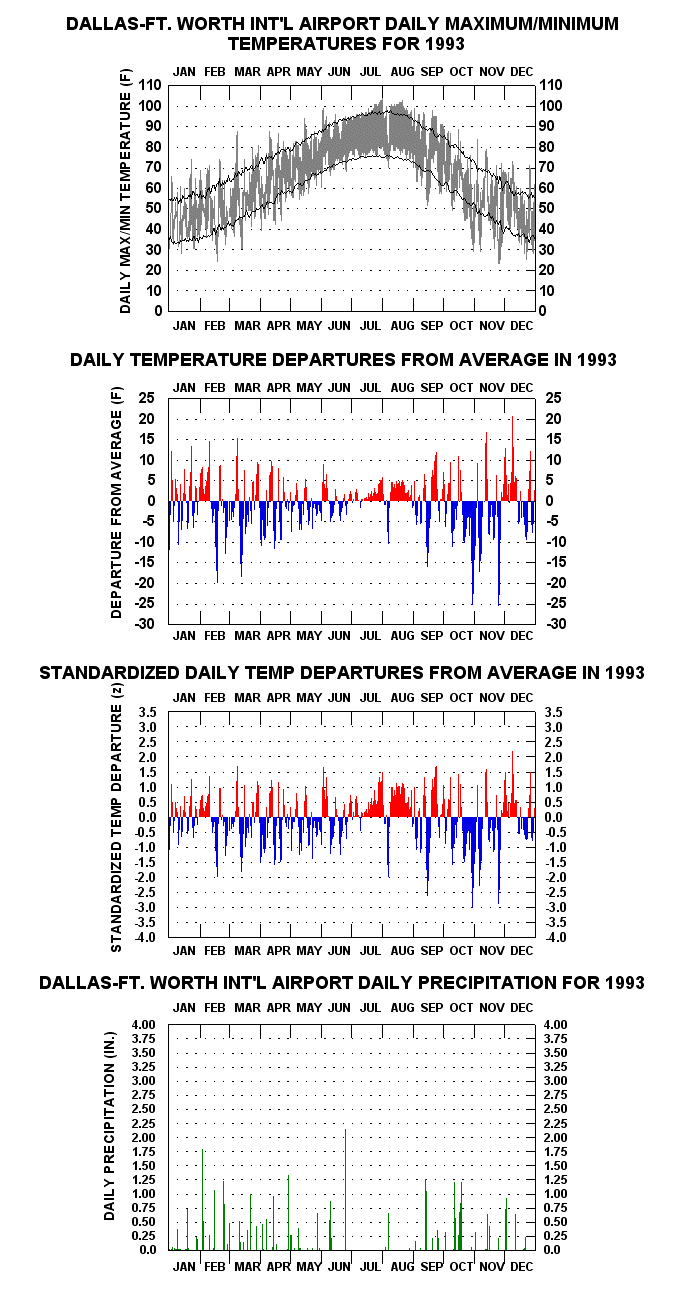
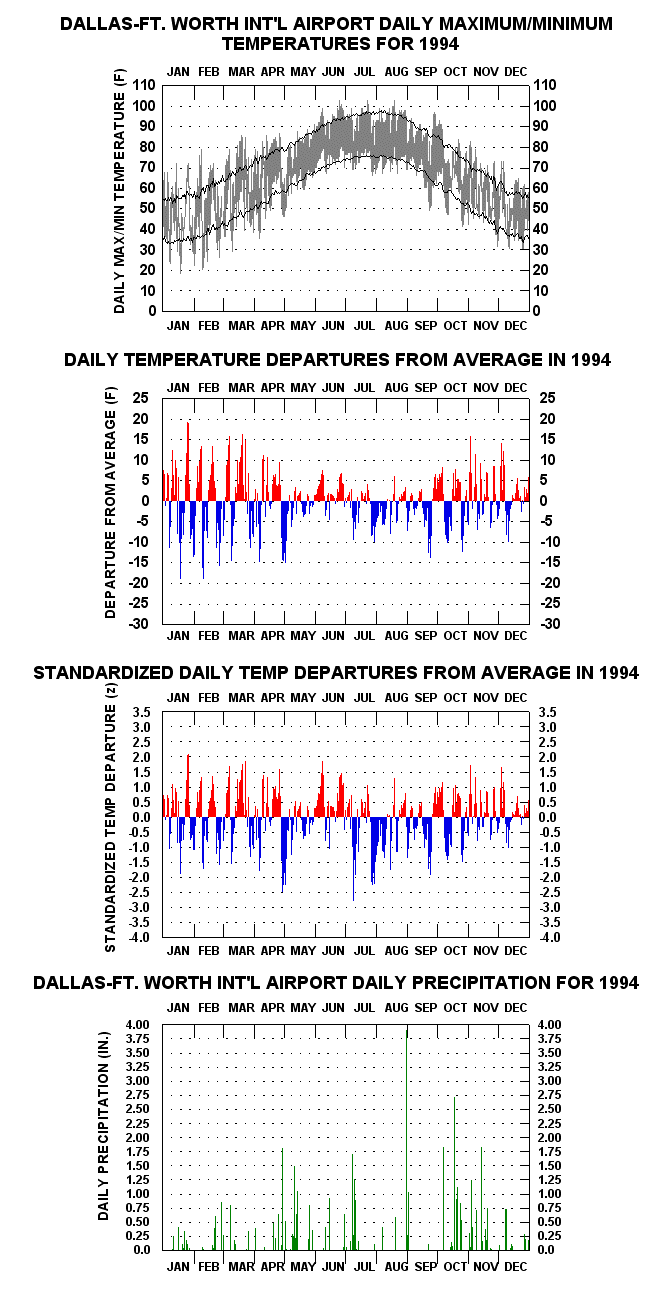
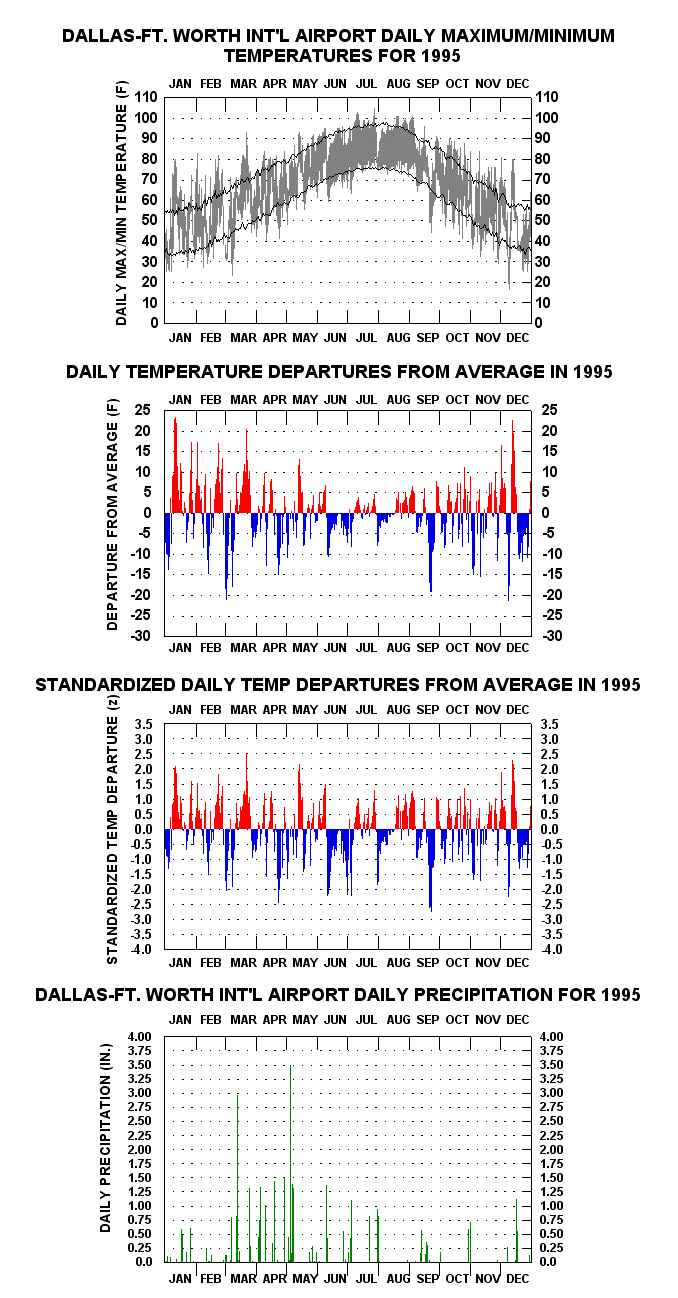
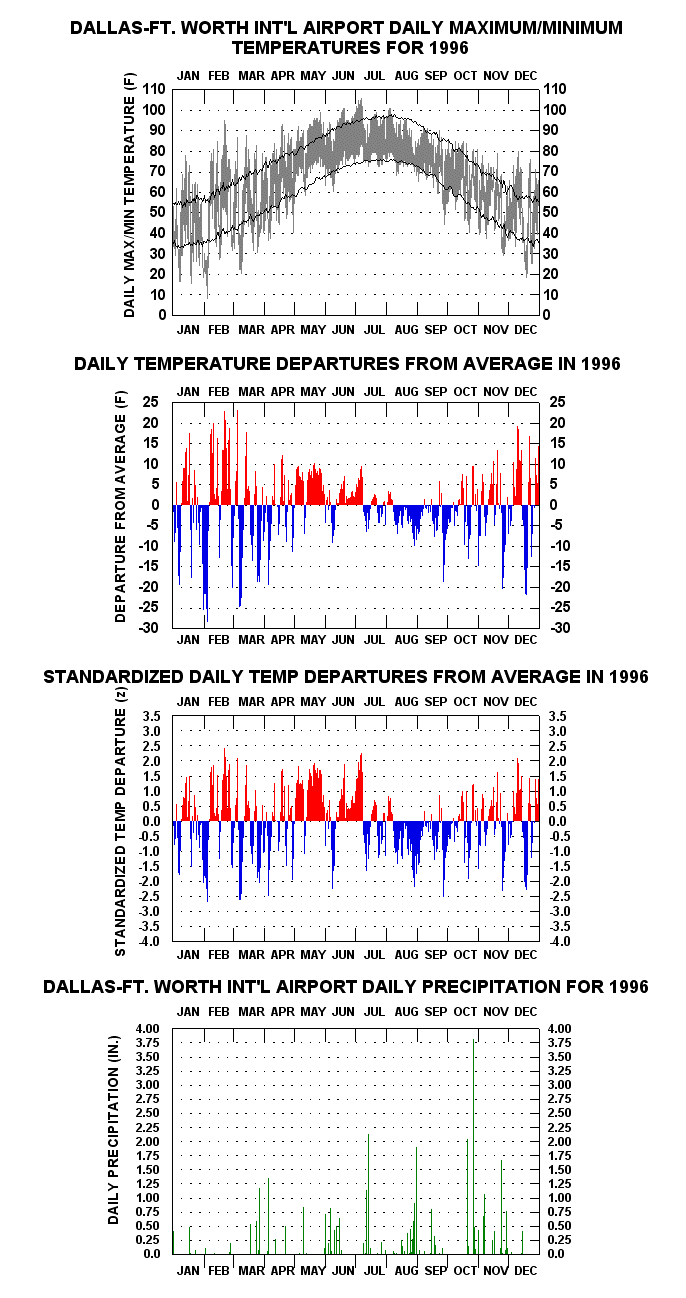
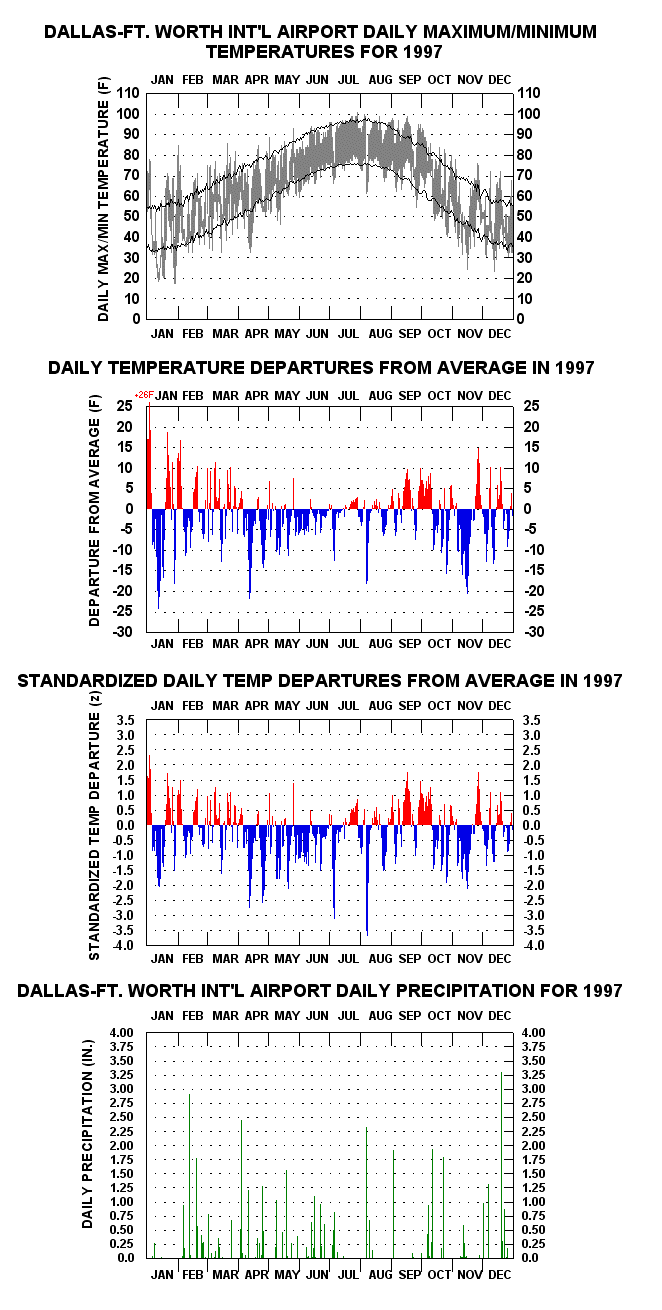
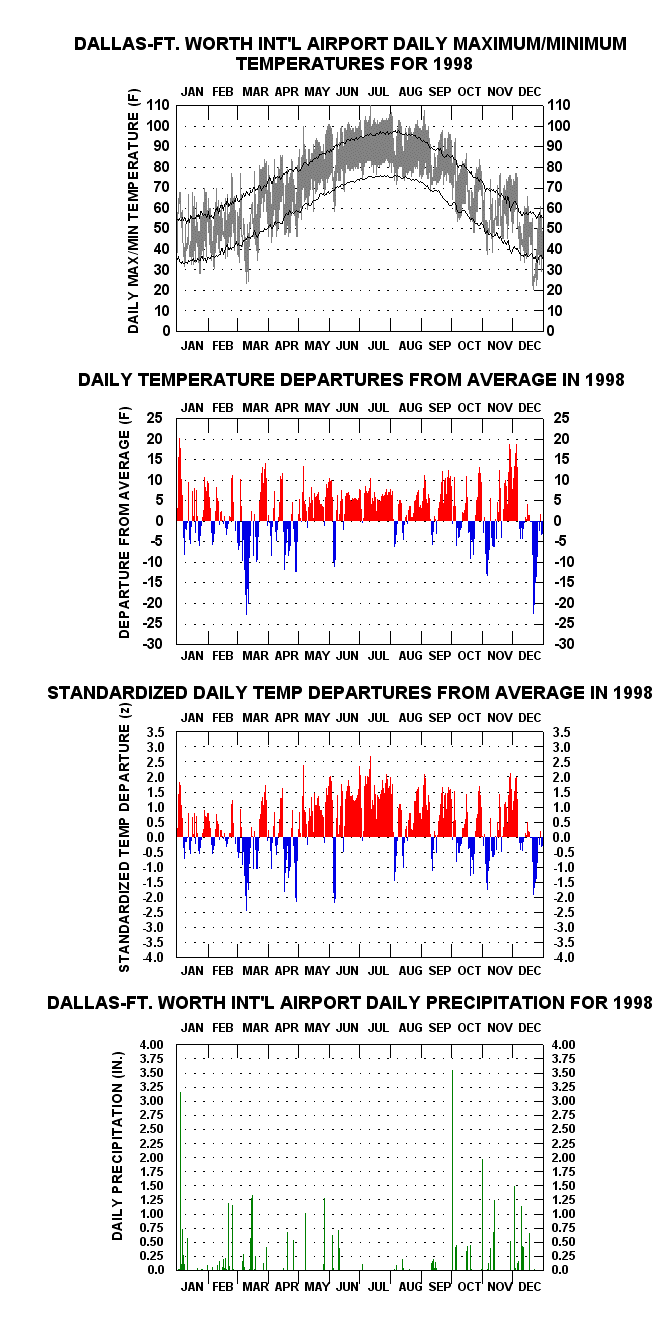
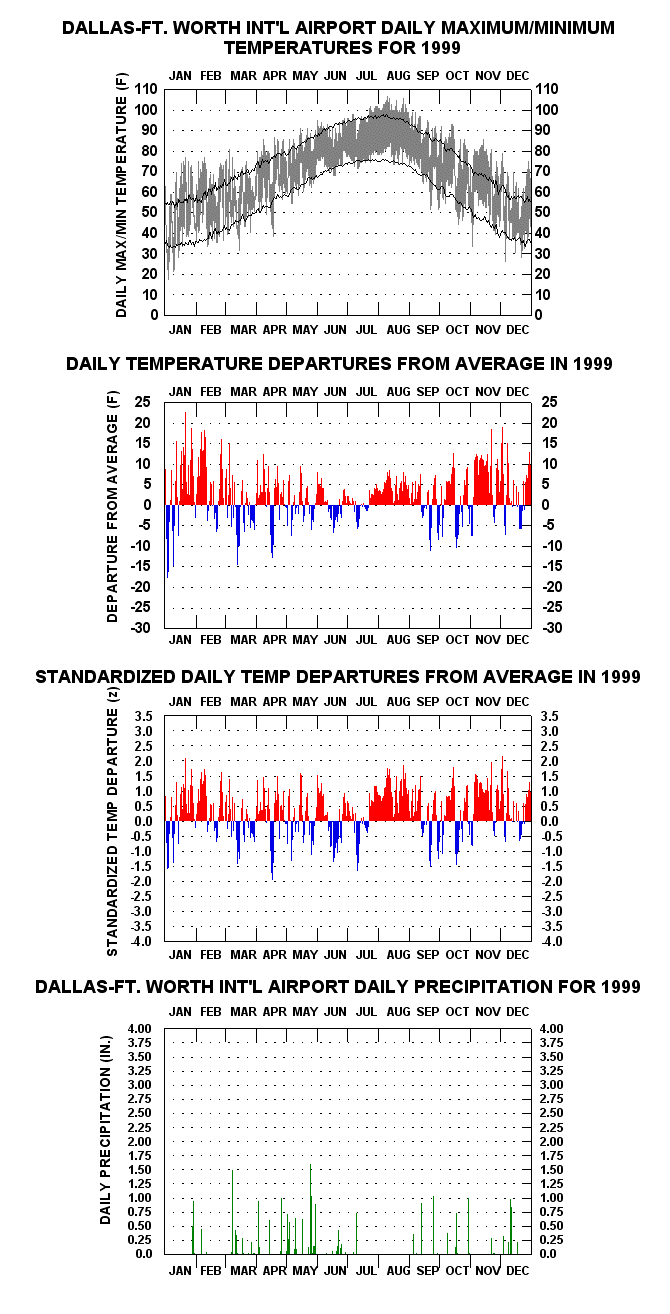
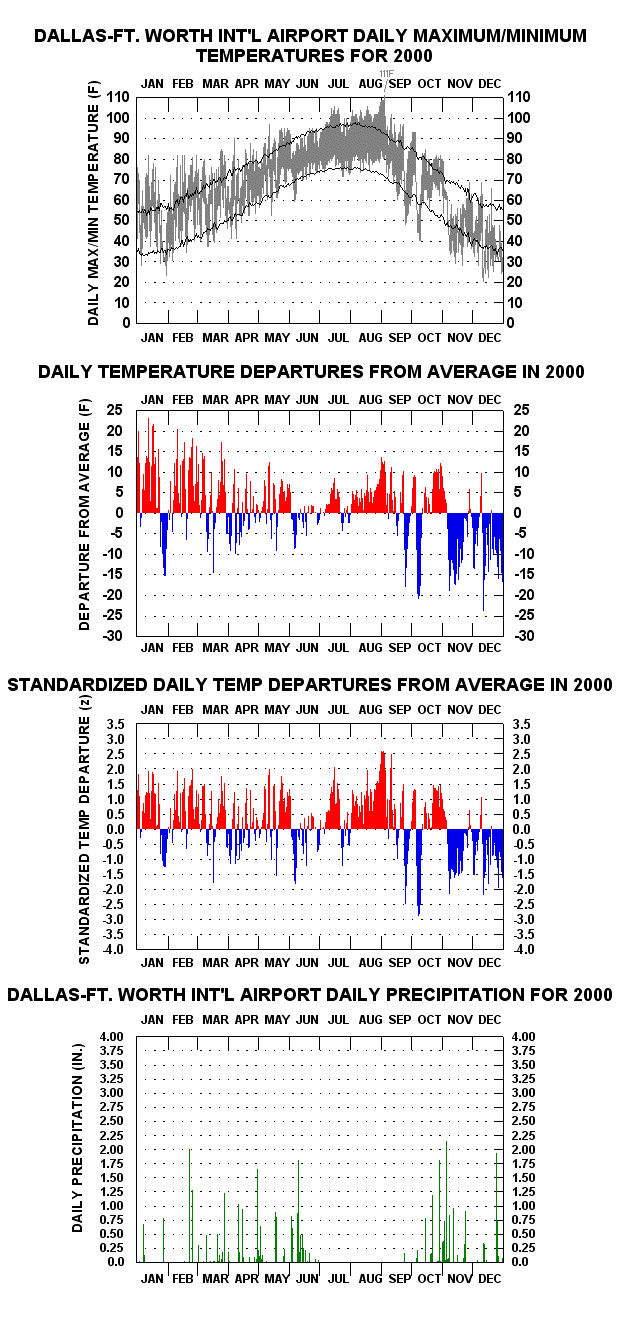
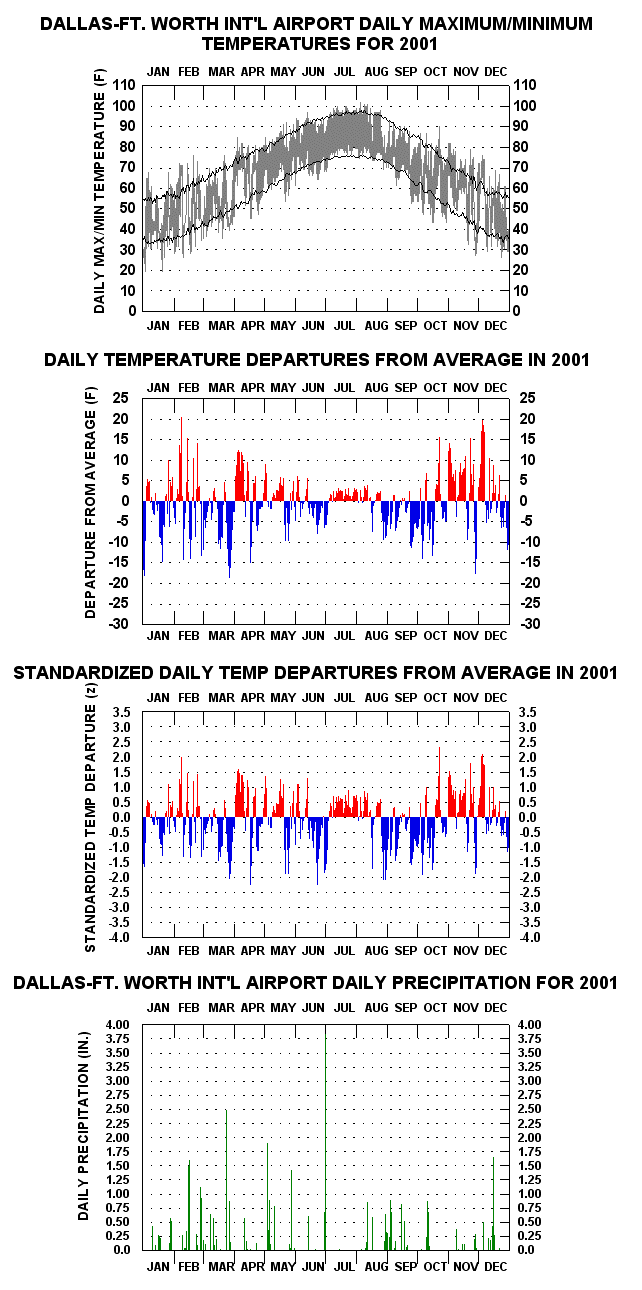
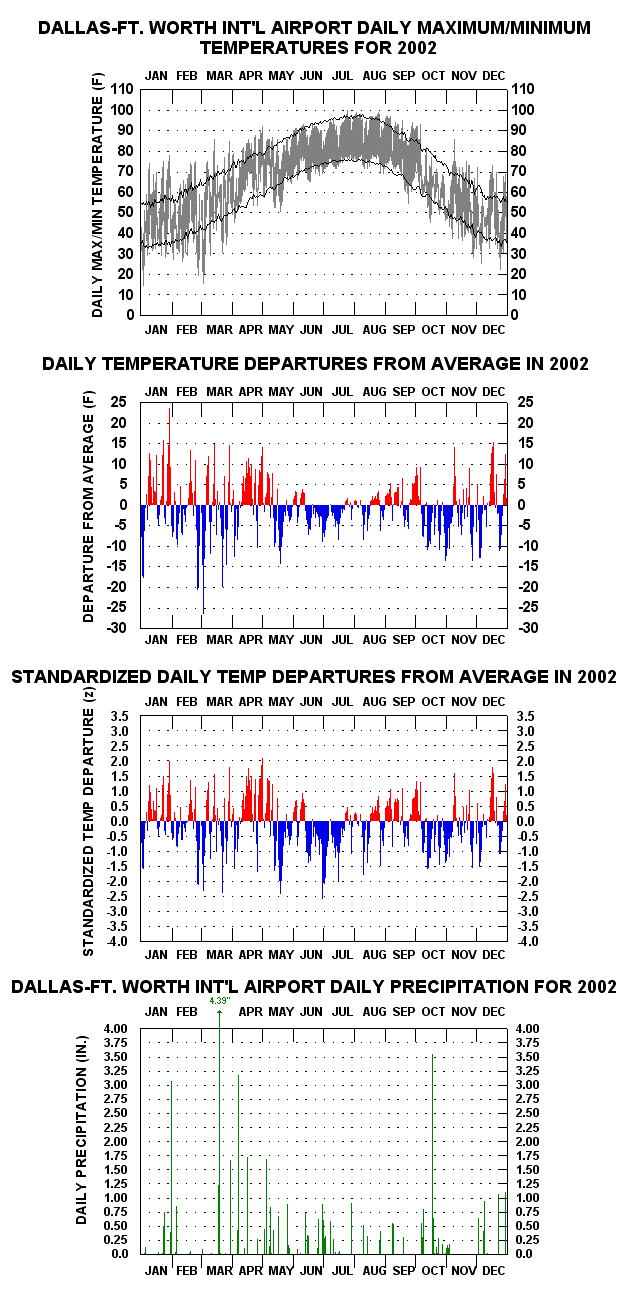
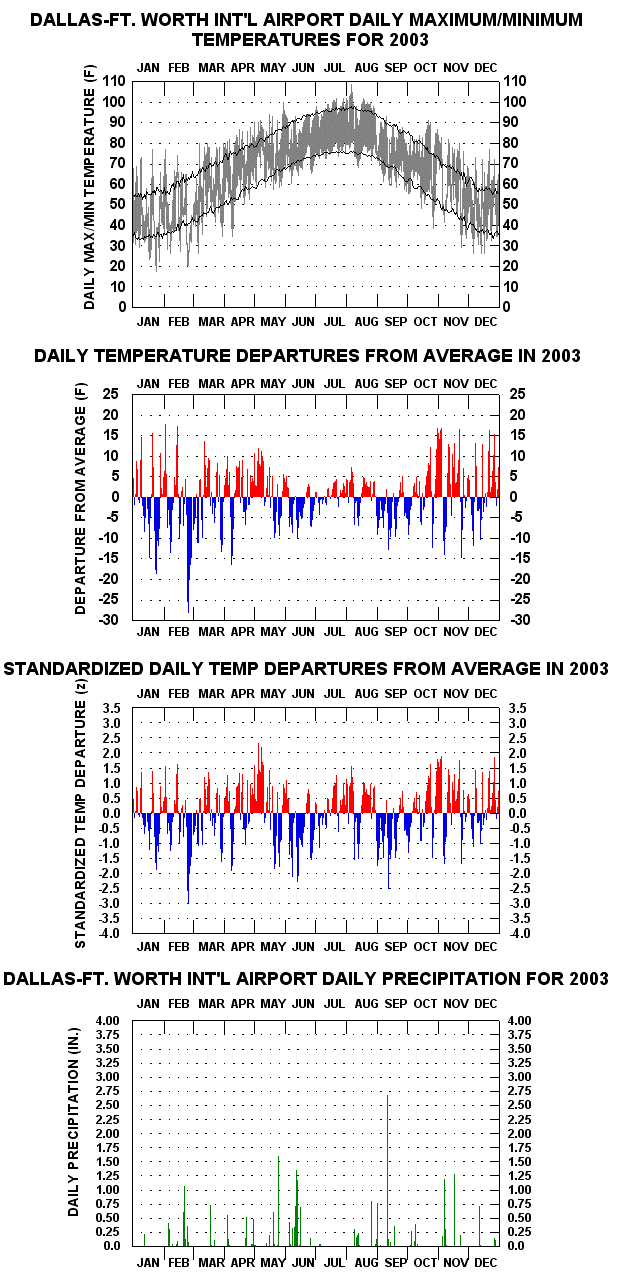
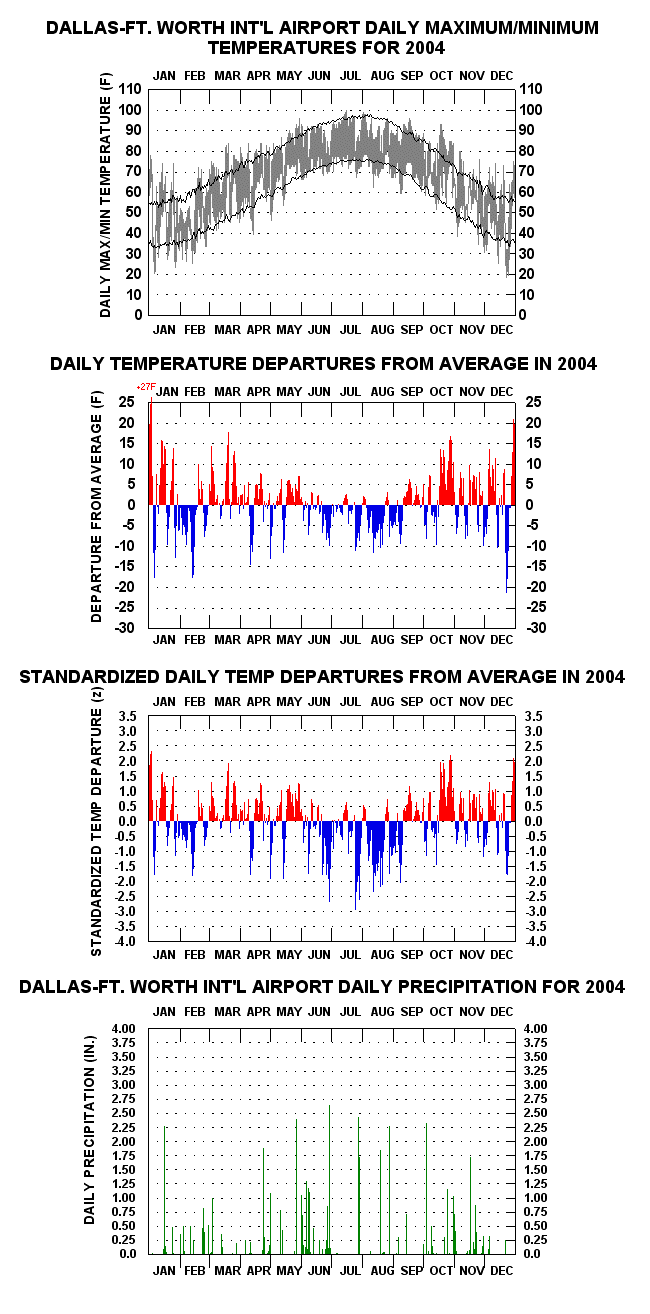
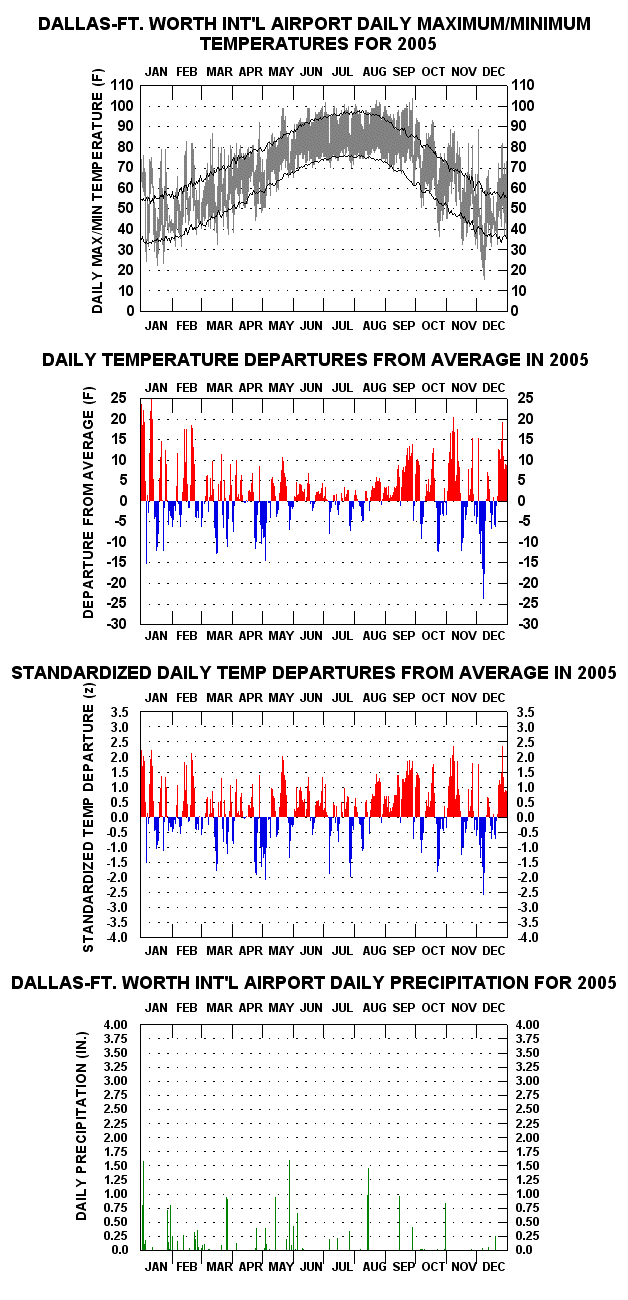
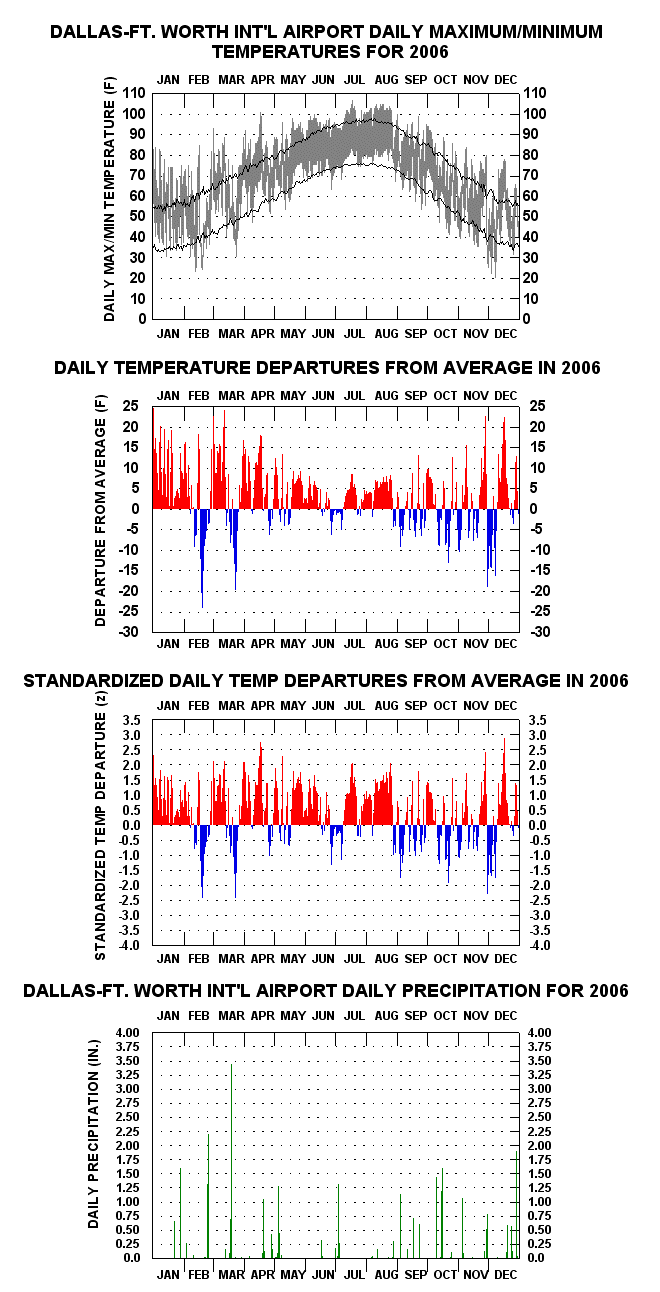
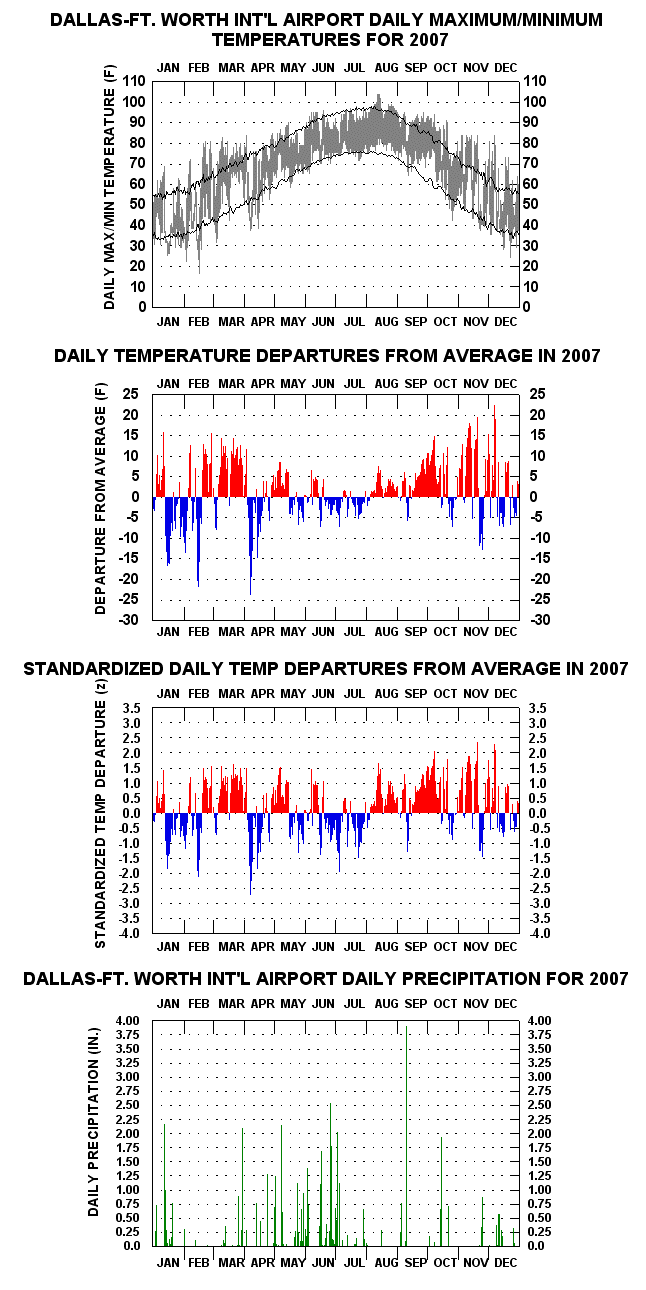
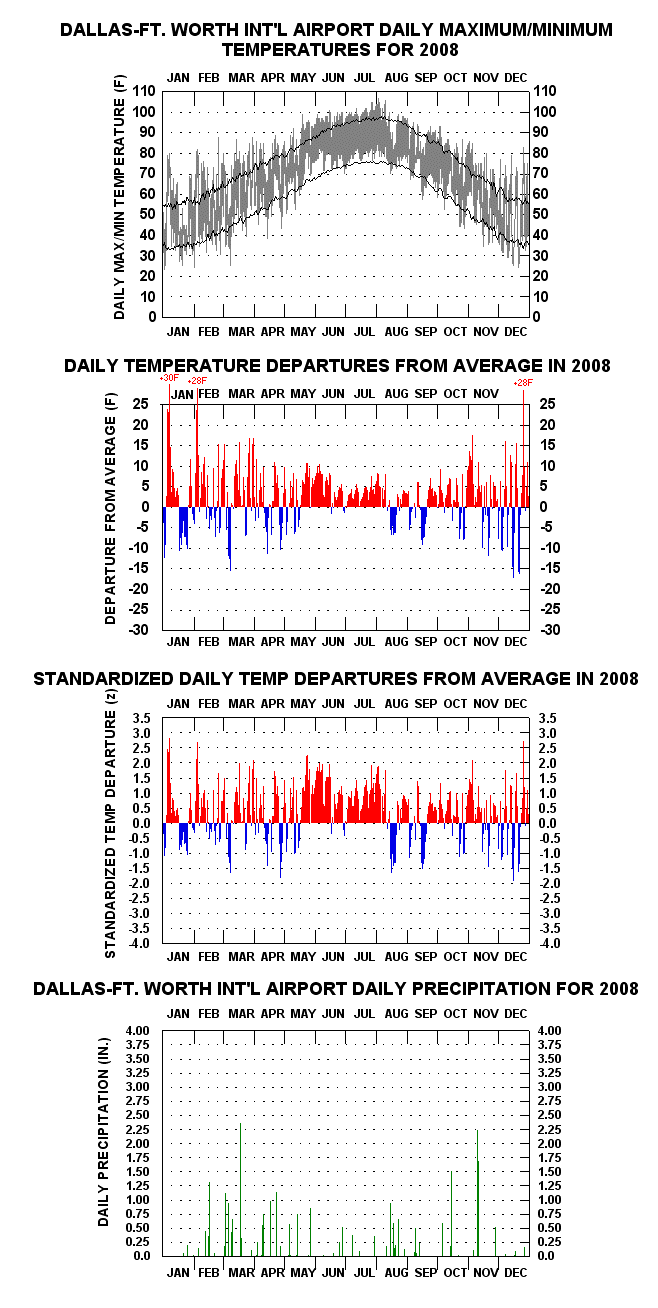
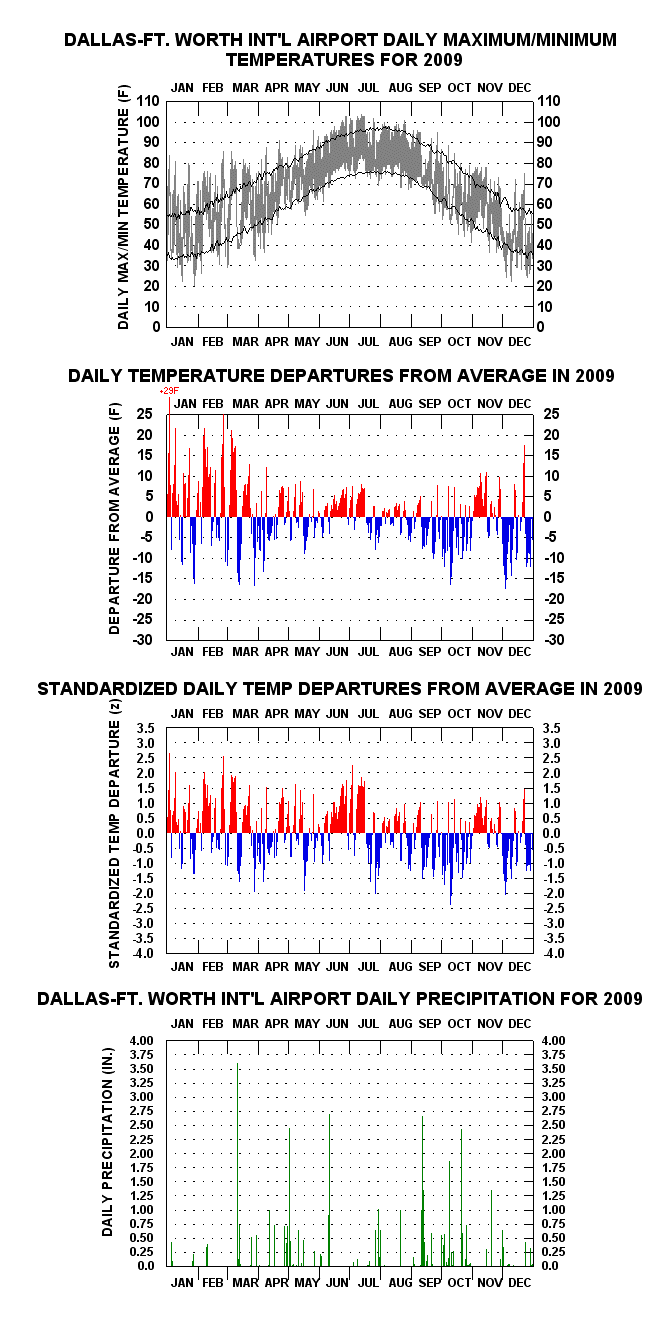
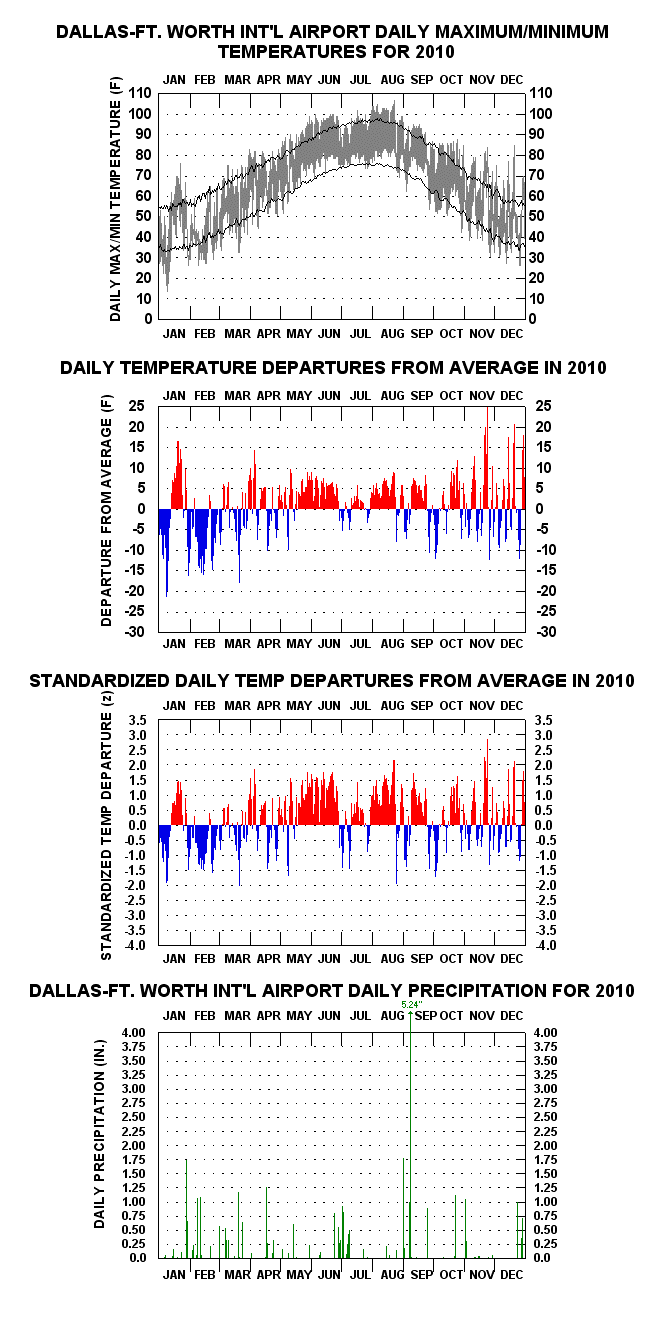
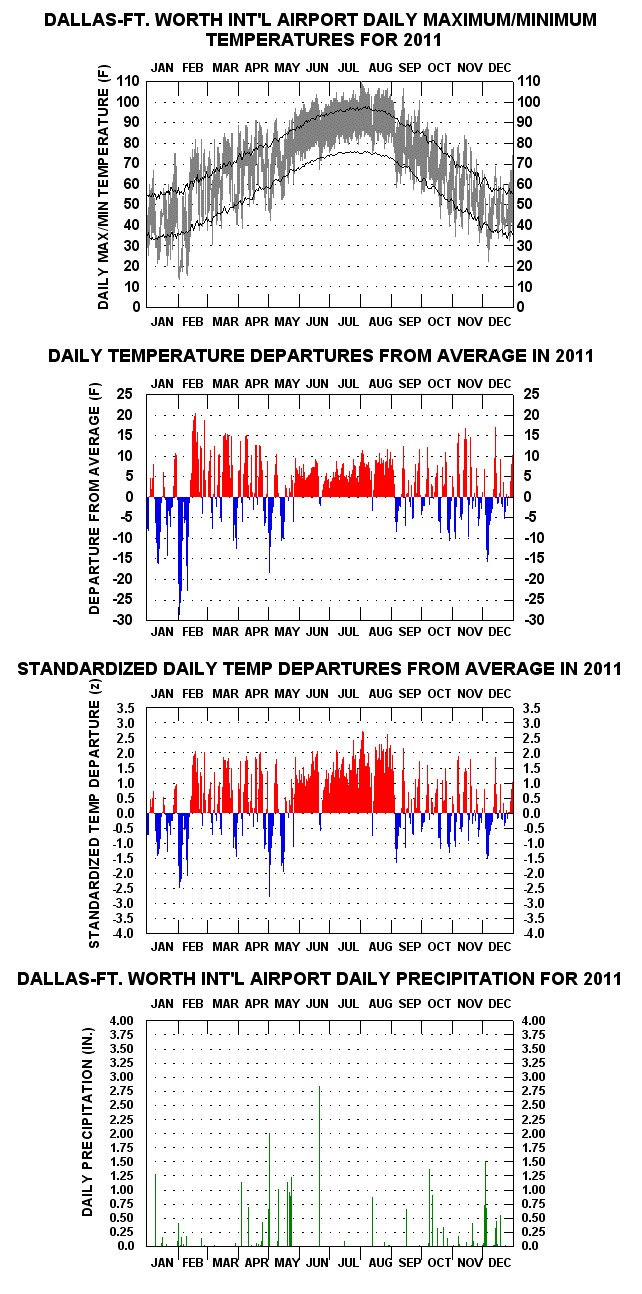
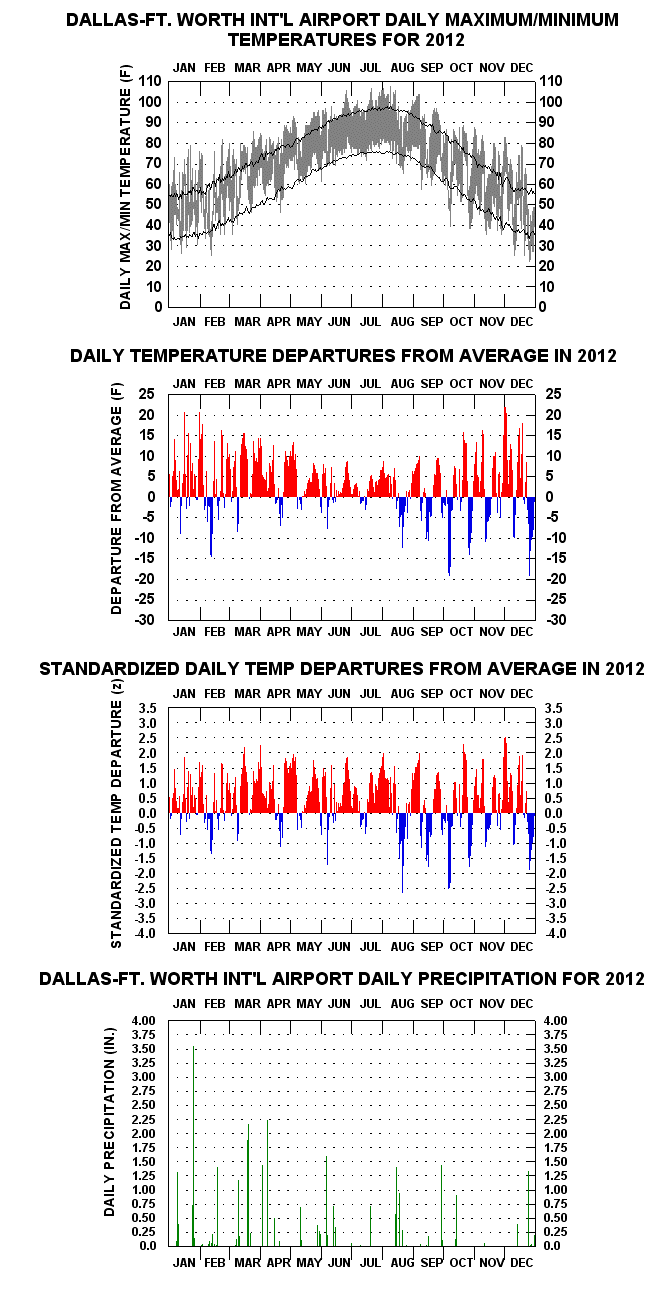
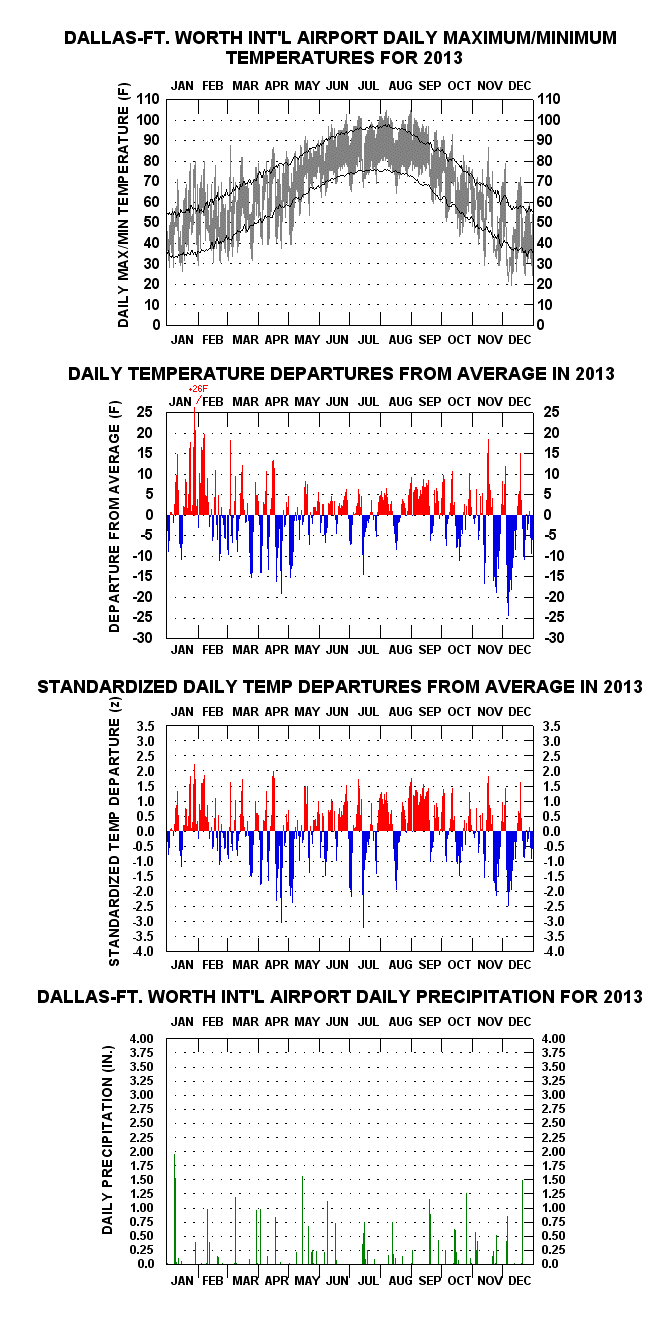
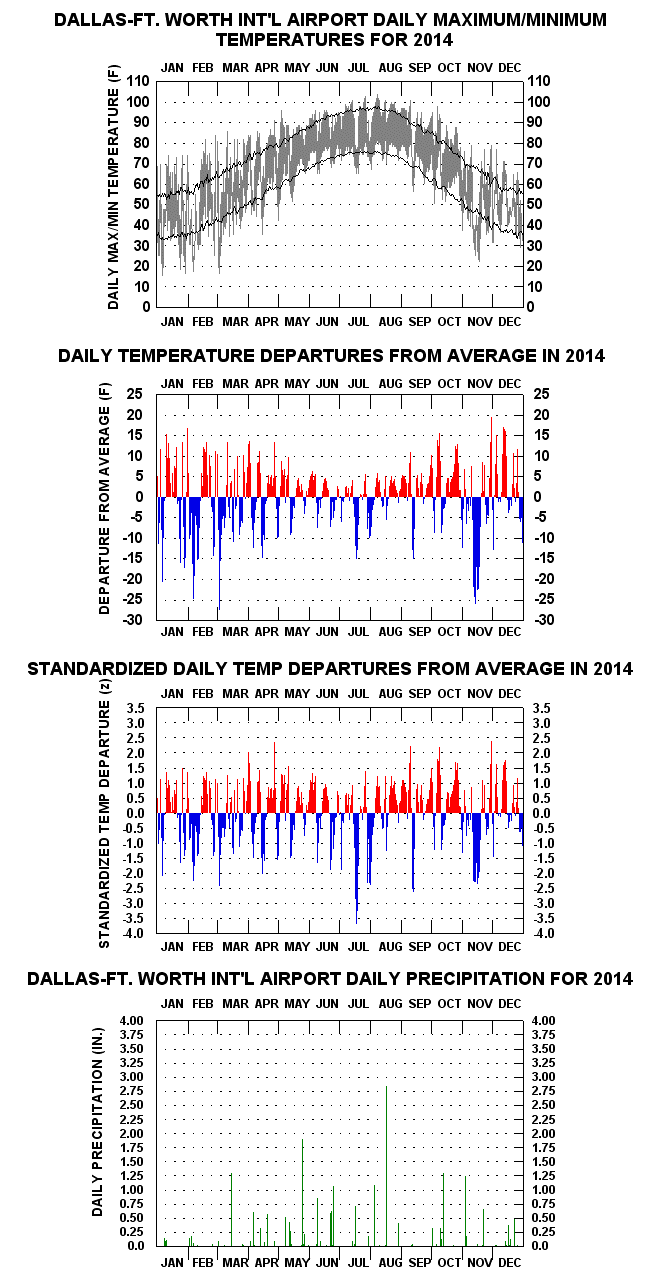
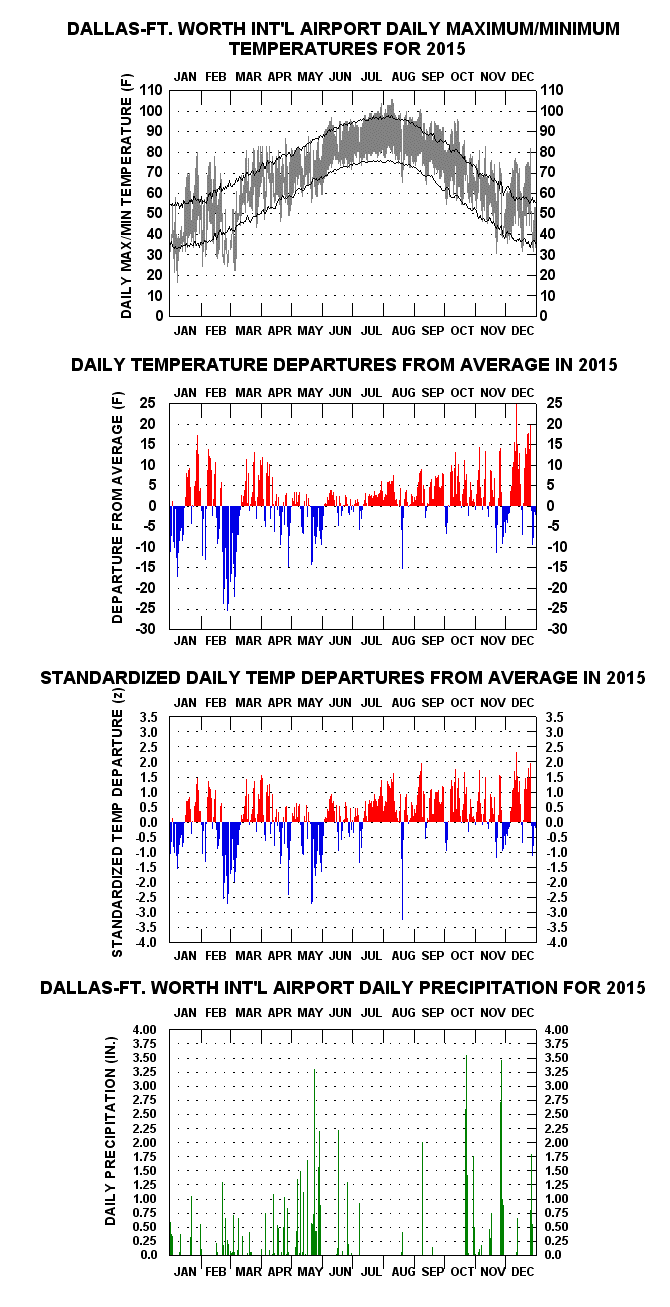
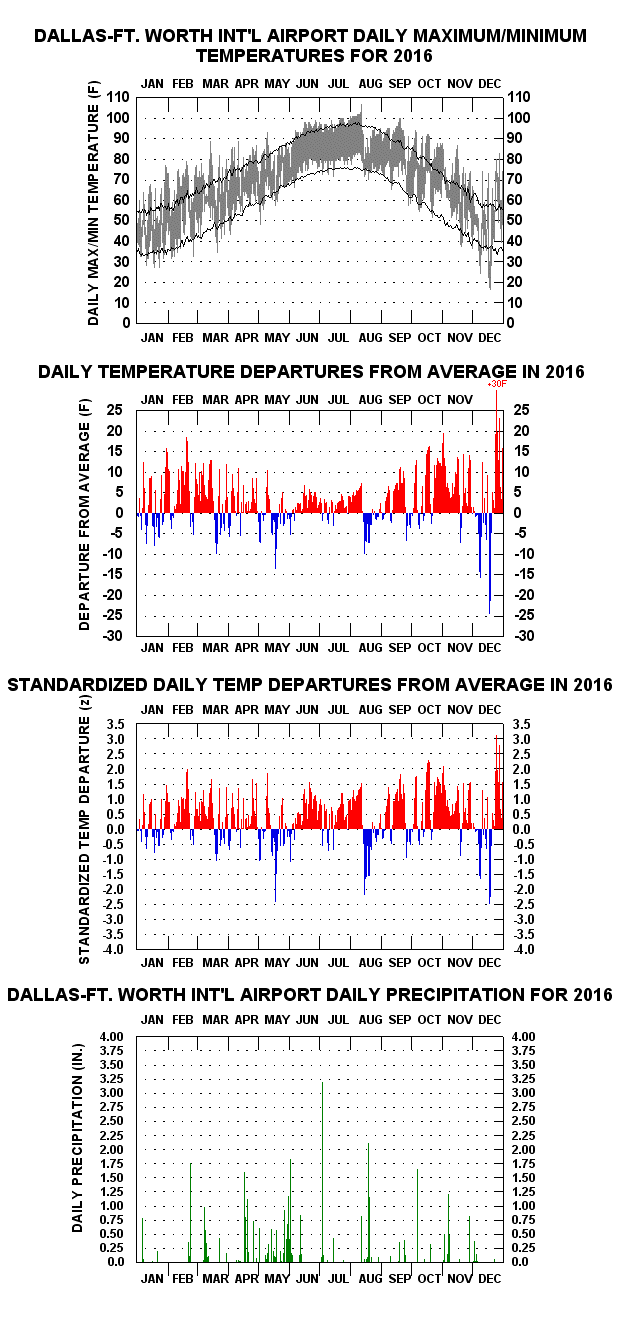
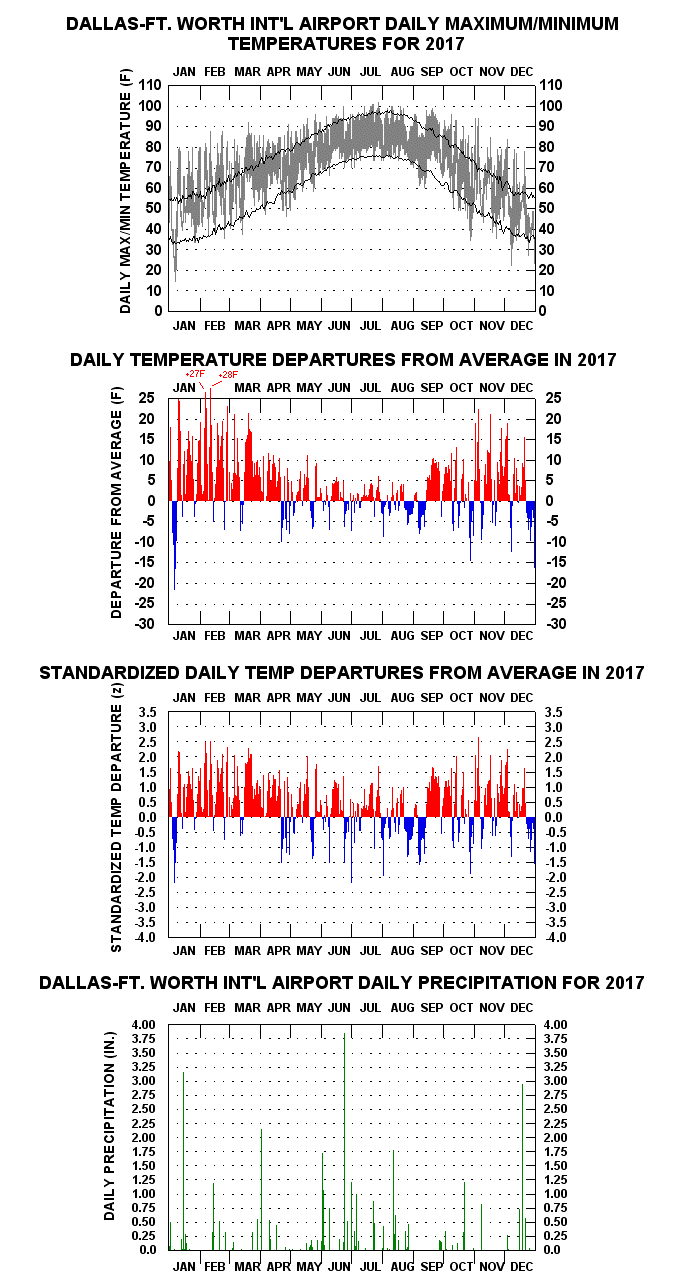
The third chart down shows the second chart’s daily mean temperature anomalies in deseasonalized (“standardized” or "z-scores") form . Those of plus or minus 3.0 z are the "extremes of the extremes", comprising just 0.23% (or 63 individual days' cases) over the entire DFW history. All but two of these are negatively signed. Greatest positive standardized departure is +3.12 z for 25 Dec 2016 (80 F/69 F daily temperature range), the greatest negative –4.03 z for 24 Aug 1966 (72 F/64 F temperature range, a day with 1.64" rain).
The bottom chart depicts daily precipitation totals, as high as 5.85 inches (24 Sept 2018).
Links To Some Of The More Interesting Year-To-Year Graphs, With Accompanying Notes
The links below depict daily temperature and precipitation patterns for years that were eventful in some way: individual day, months, and annual basis extremes, along with patterns which are just interesting display for their own sake. Dallas- Fort Worth is noteworthy for its great variability in temperature progressions, especially over the non-summer months, and many of the charts linked below, not to mention others not in the list, have visually striking patterns.
Second wettest year in history (55.97"). September and October combined with 28.35".
Annual Mean (69.9 F) surpasses 2006 by 0.5 F for warmest year to date.
Wettest Year to date (62.61"). May records 16.96", most for any calendar month in history.
August (93.4 F) warmest calendar month in history. Warmest Summer (90.5 F).
Warmest year to date (69.4 F).
Driest year (18.97") since 1956 .
Surpasses last year as warmest year to date (68.6 F)
Surpasses 1954 by 0.1 F as warmest year to date (68.3 F).
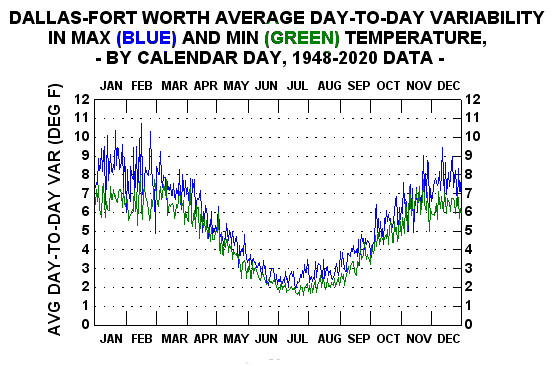
Great day-to-day variability in daily max temps over Jan & Feb. Mean figure (10.2 F) - highest for any two-month adjacent segment in history.
Minus 1 F on 23 December.
Coldest year in history (63,3 F). Very cold December (34.9 F - 3.8 standard deviations below average).
Striking daily mean temperature departure pattern over course of year.
Warmest Summer up to this time (89.2 F). Max temps of 113 F and 112 F - highest in history down to the present.
January (33.8 F) & February (36.7 F) each the coldest months of their name of the 1948-present history. Three coldest Januarys in DFW history, 1948-present, occurred in this year, 1977 and 1979.
January average day-to-day variability in daily max temperature (13.1 F) highest of any individual calendar month in history.
Driest year (18.55") of 1948-present history.
In midst of six year 1951-56 drought, warmest year (68.2 F) until 1998 .
Average day-to-day variability in daily maximum temperature (7.0 F), highest of any year (1948-present)
Minus 2 on 31 January.
* Member, American Meteorological Society
Data Collection 07Analytics
Sample Regimes, PCA Modes, PDFs & Extremes+
Temperature+
Regimes+
Sample analysis: group years by recurring seasonal temperature patterns for Dallas–Fort Worth, then compare transitions between common, unusual and persistent regimes. This is sample Analytics content for layout and workflow testing. Replace it with the station’s verified analysis when the final material is ready.
Extremes+
Sample analysis: review the upper and lower tails of the temperature record for Dallas–Fort Worth and identify years that merit detailed chart interpretation. This is sample Analytics content for layout and workflow testing. Replace it with the station’s verified analysis when the final material is ready.
Rainfall+
PCA Modes+
Sample analysis: demonstrate how leading modes can separate broad rainfall variability variability from shorter-lived anomalies at Dallas–Fort Worth. This is sample Analytics content for layout and workflow testing. Replace it with the station’s verified analysis when the final material is ready.
Extremes+
Sample analysis: review the upper and lower tails of the rainfall record for Dallas–Fort Worth and identify years that merit detailed chart interpretation. This is sample Analytics content for layout and workflow testing. Replace it with the station’s verified analysis when the final material is ready.
Wind+
PDFs+
Sample analysis: compare the central distribution and tail behavior of wind speed observations at Dallas–Fort Worth. This is sample Analytics content for layout and workflow testing. Replace it with the station’s verified analysis when the final material is ready.
Extremes+
Sample analysis: review the upper and lower tails of the high-wind events record for Dallas–Fort Worth and identify years that merit detailed chart interpretation. This is sample Analytics content for layout and workflow testing. Replace it with the station’s verified analysis when the final material is ready.
Continue Exploring
Compare Climate History Across Every Station
Browse domestic and international climate archives, long-term trends and original statistical visualizations.