

Station Overview
Graphical Climatology of Washington DC: Daily Temperatures and Rainfall, by Year (1872 – Present)
The following is a graphical climatology of Washington DC temperatures, precipitation, and various other variables, from 1872 into 2026.
Presented are daily climatological overview charts (temperature), annual time-series (temperature and precipitation), “climograms” (hour-by-month depictions of temperature, humidity, and winds), followed by year-to-year graphs that depict daily maximum/minimum temperature, daily mean temperature anomalies, and daily rainfall. Data were obtained courtesy of the NWS Washington/Baltimore site, mostly from the NOWDATA section, with occasional referrals to the old Washington DC Monthly Weather Reviews for earlier years.
Explore the Climate Data
Use these shortcuts to move directly to the principal charts, analyses and historical records.
Climate Overview Graphs — RECENT DATA
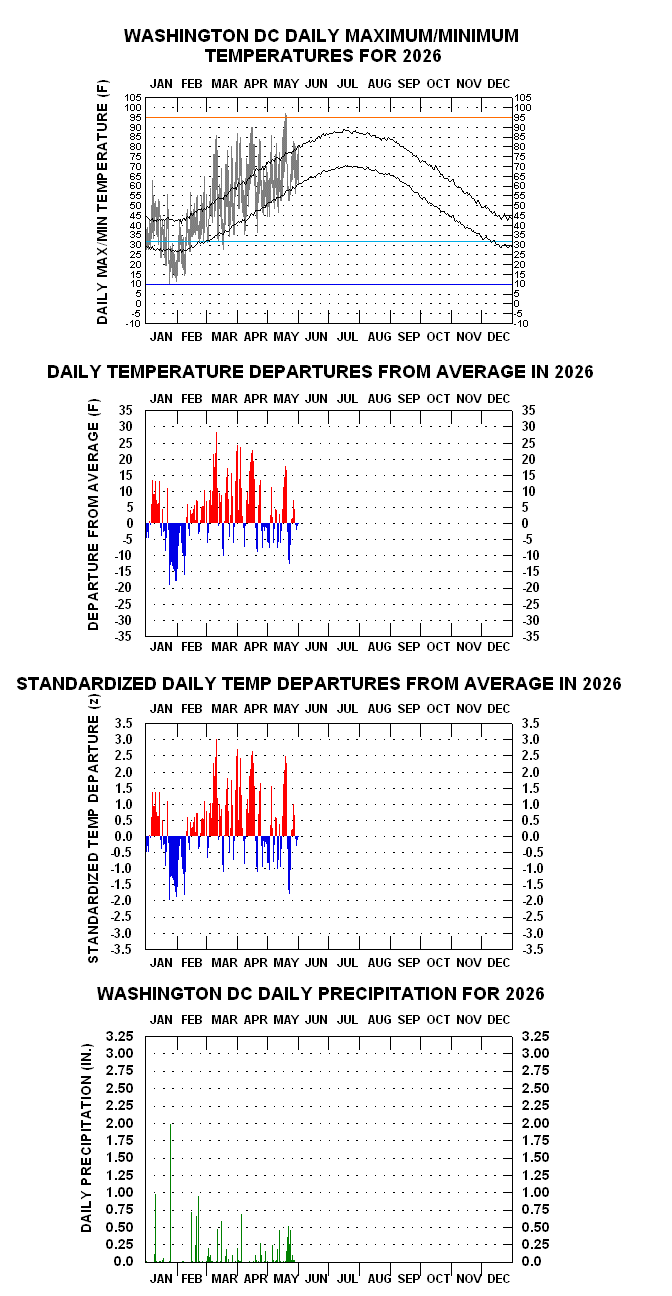
- 2026 Daily Temperature/Precipitation Graphs for Washington DC - NewNew (5/31/26)
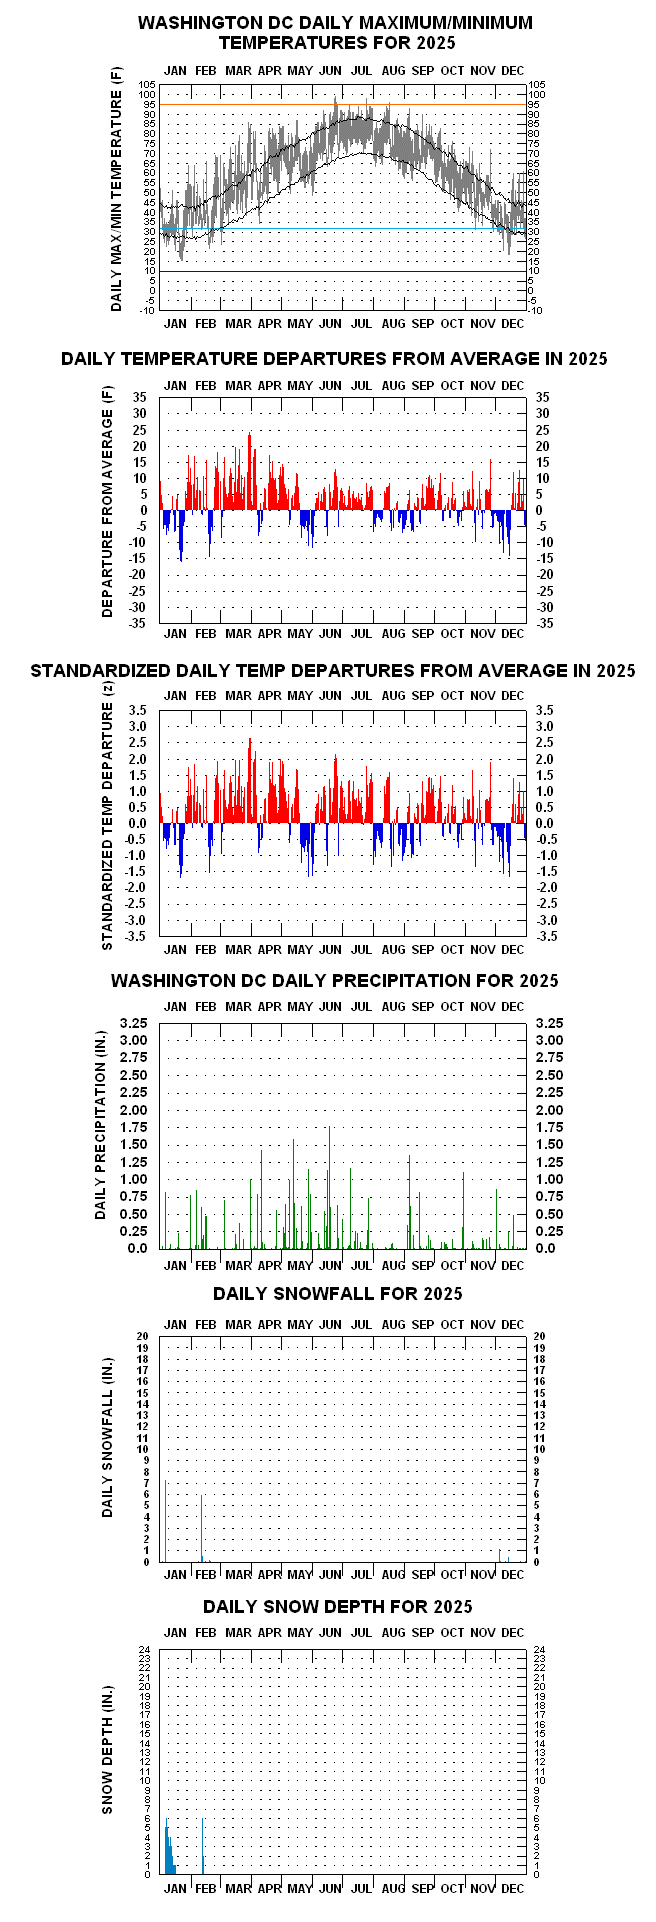
- 2025 Daily Temperature/Precipitation Graph for Washington DC NewNew (12/31/25)
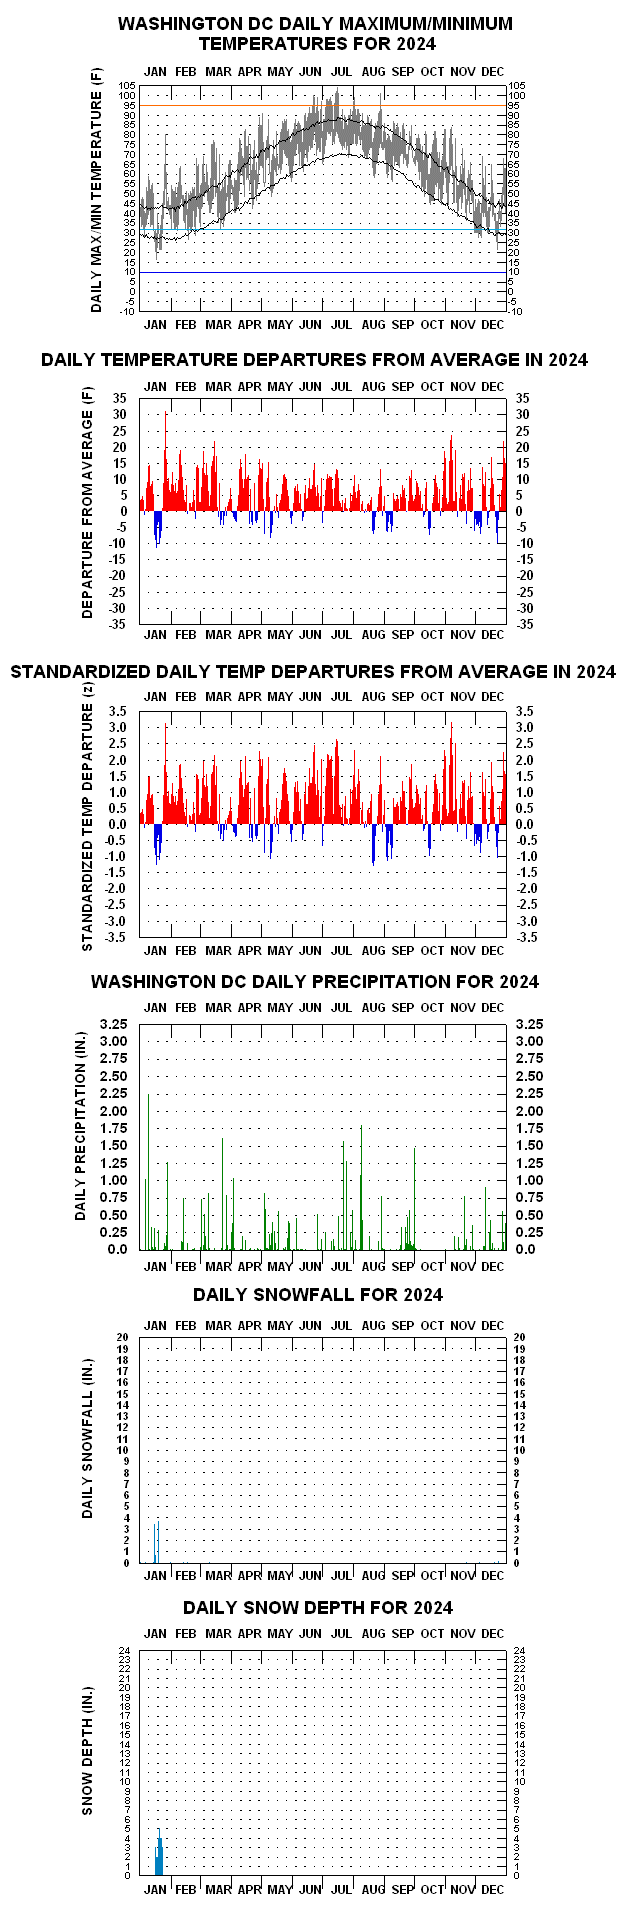
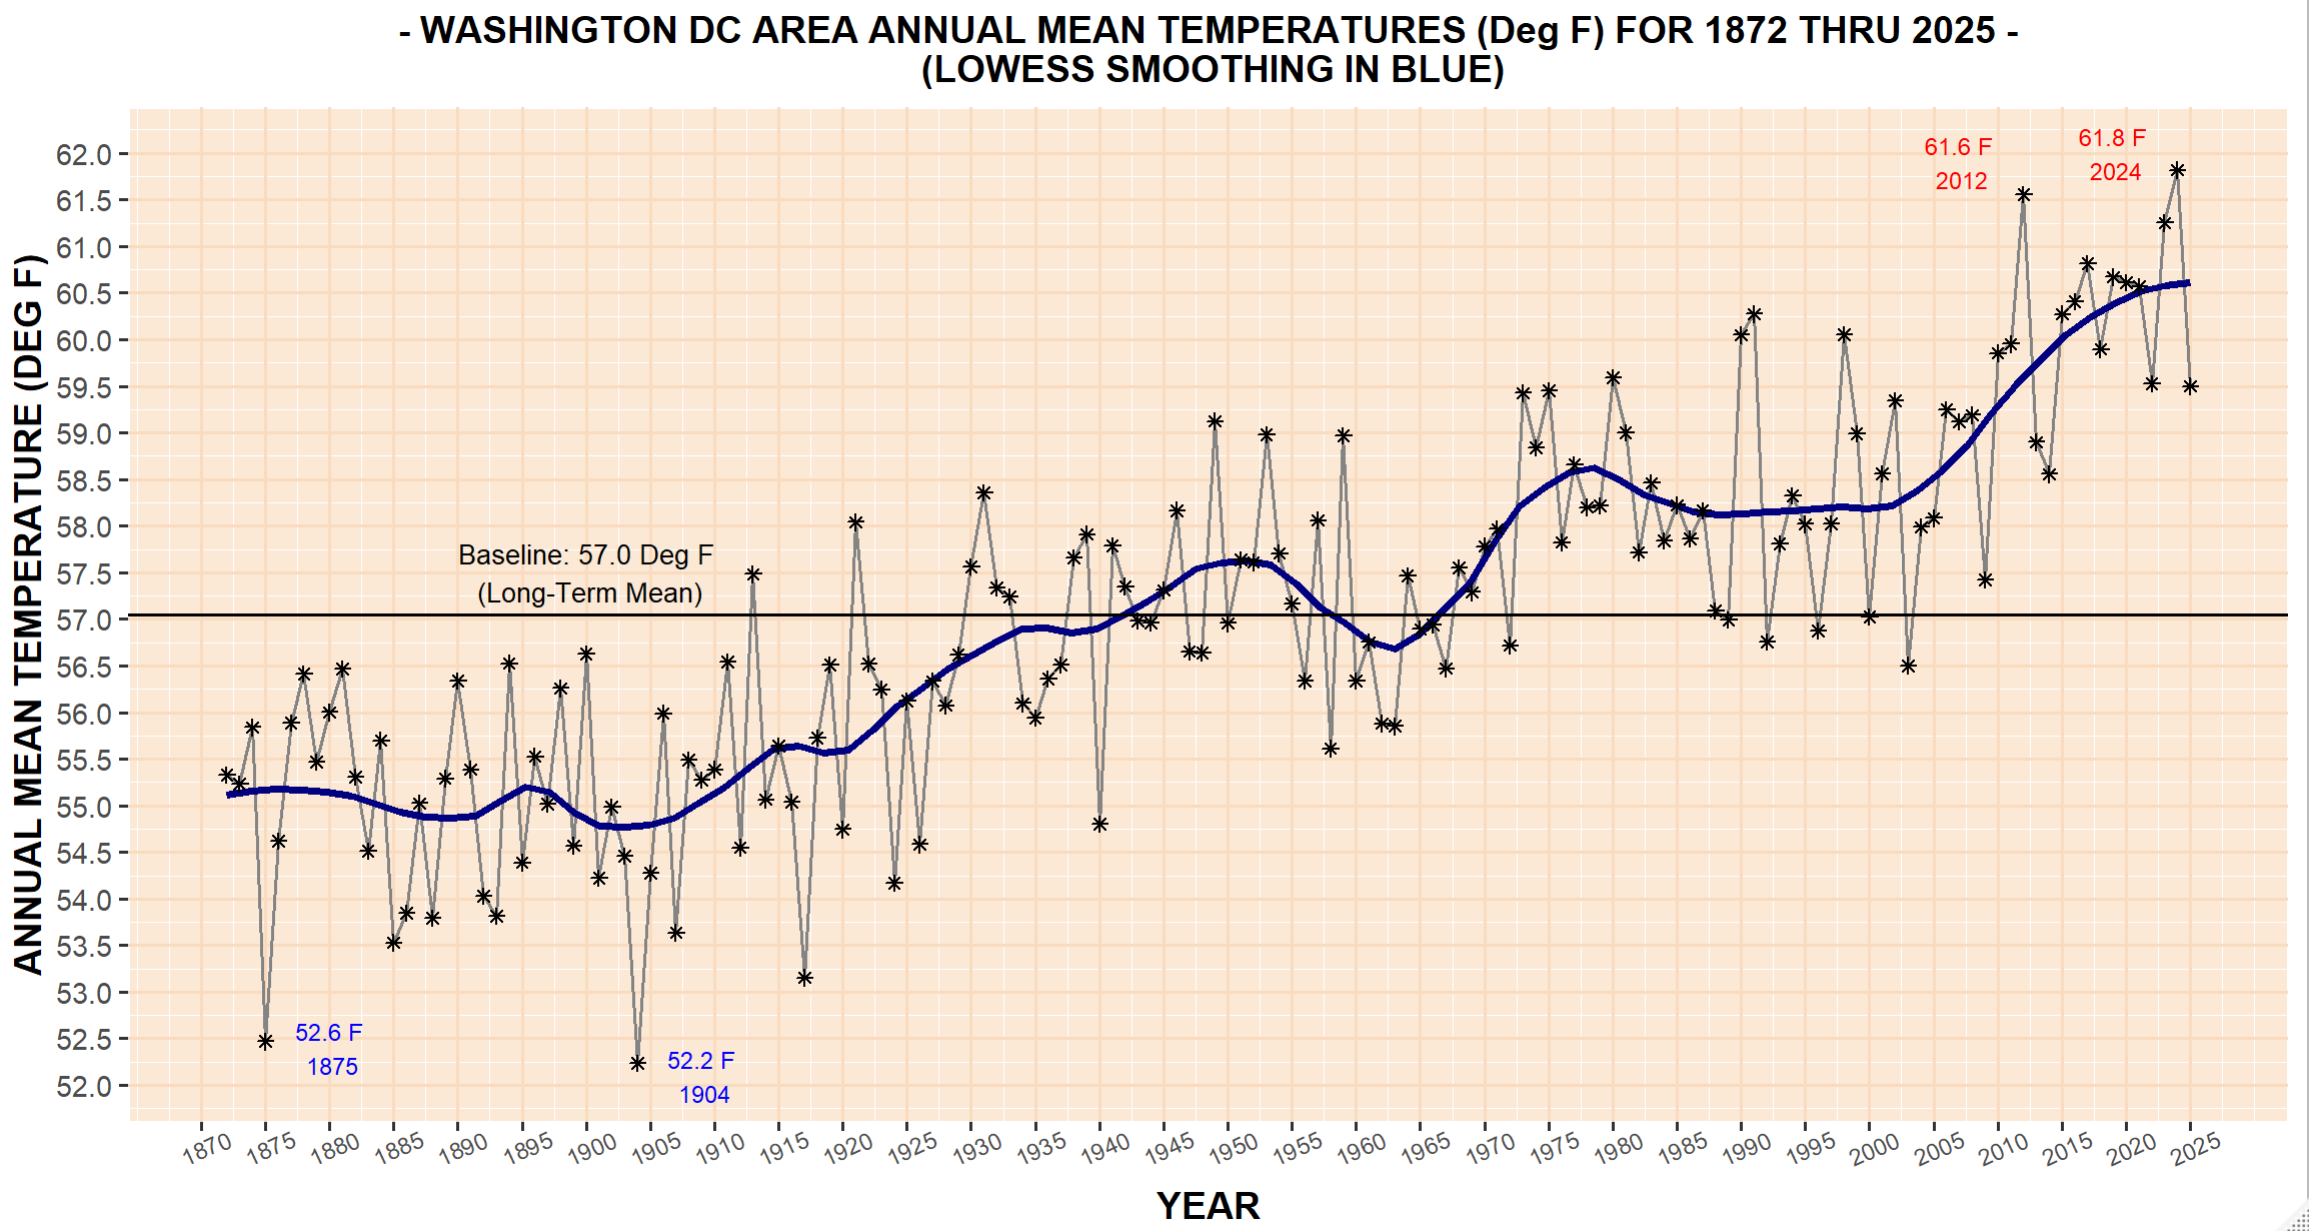
- 2024 Daily Temperature/Precipitation Graph for Washington DCWarmest Year in History (61.8 F). Surpasses 2012 by +0.3 F
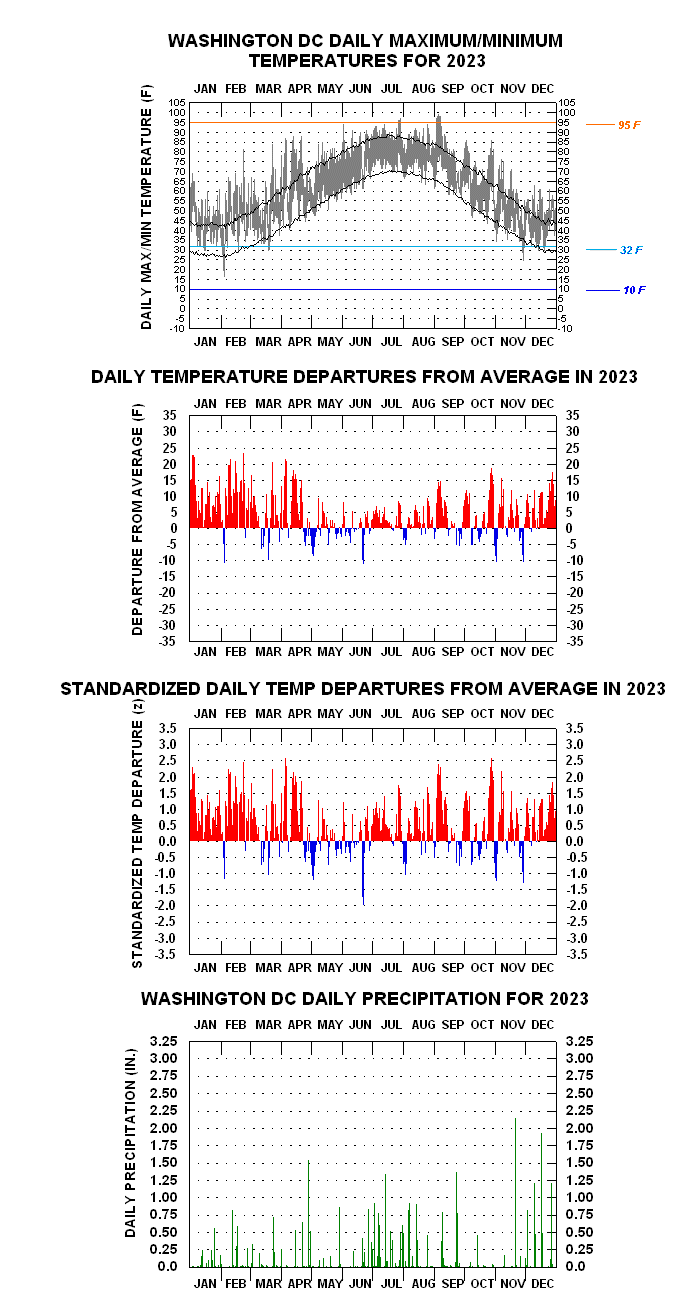
- 2023 Daily Temperature/Precipitation Graph for Washington DC
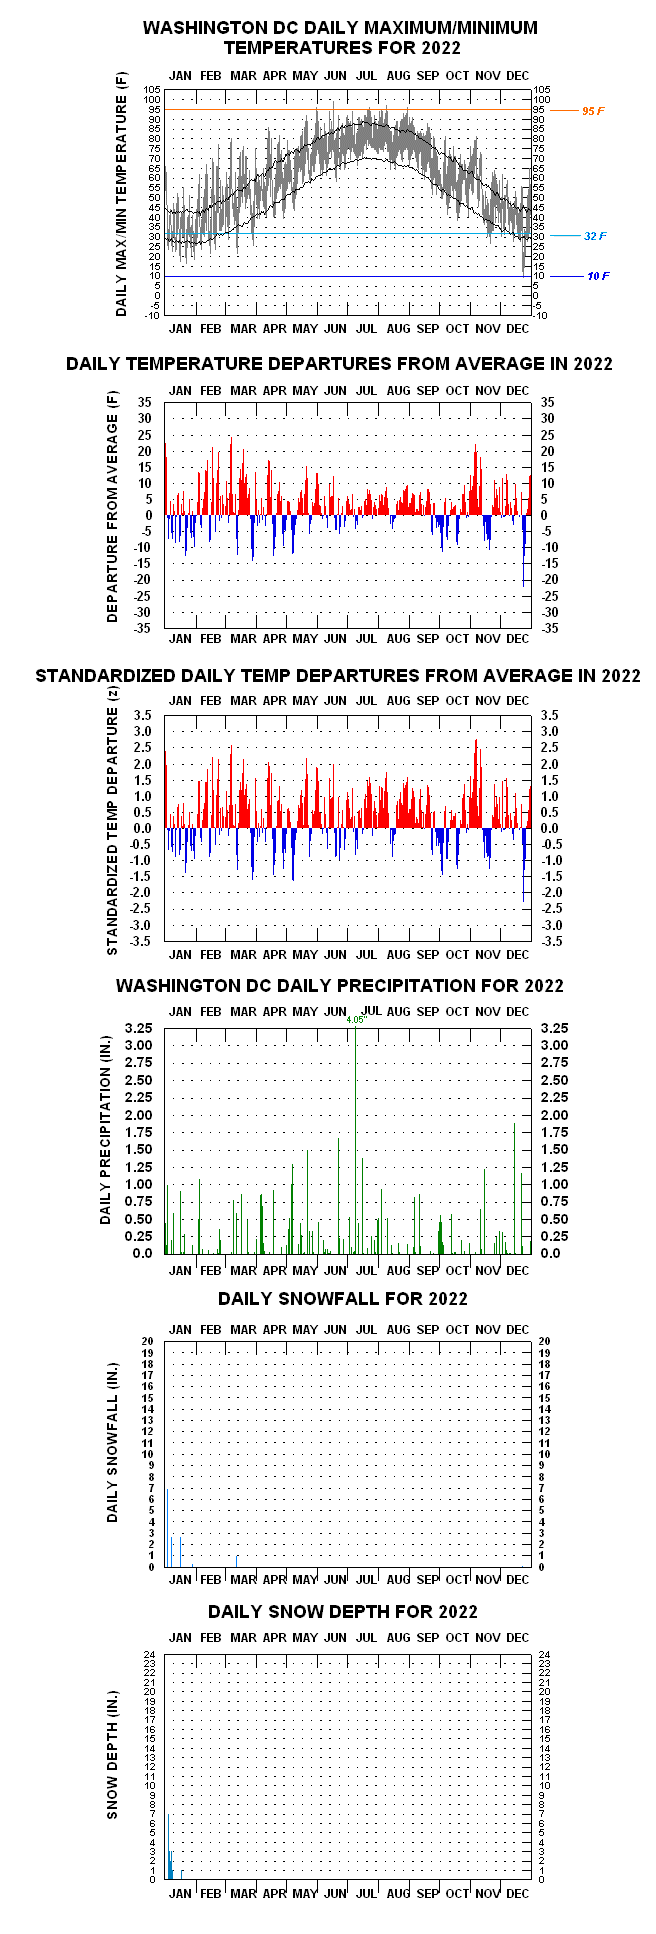
- 2022 Daily Temperature/Precipitation Graph for Washington DC
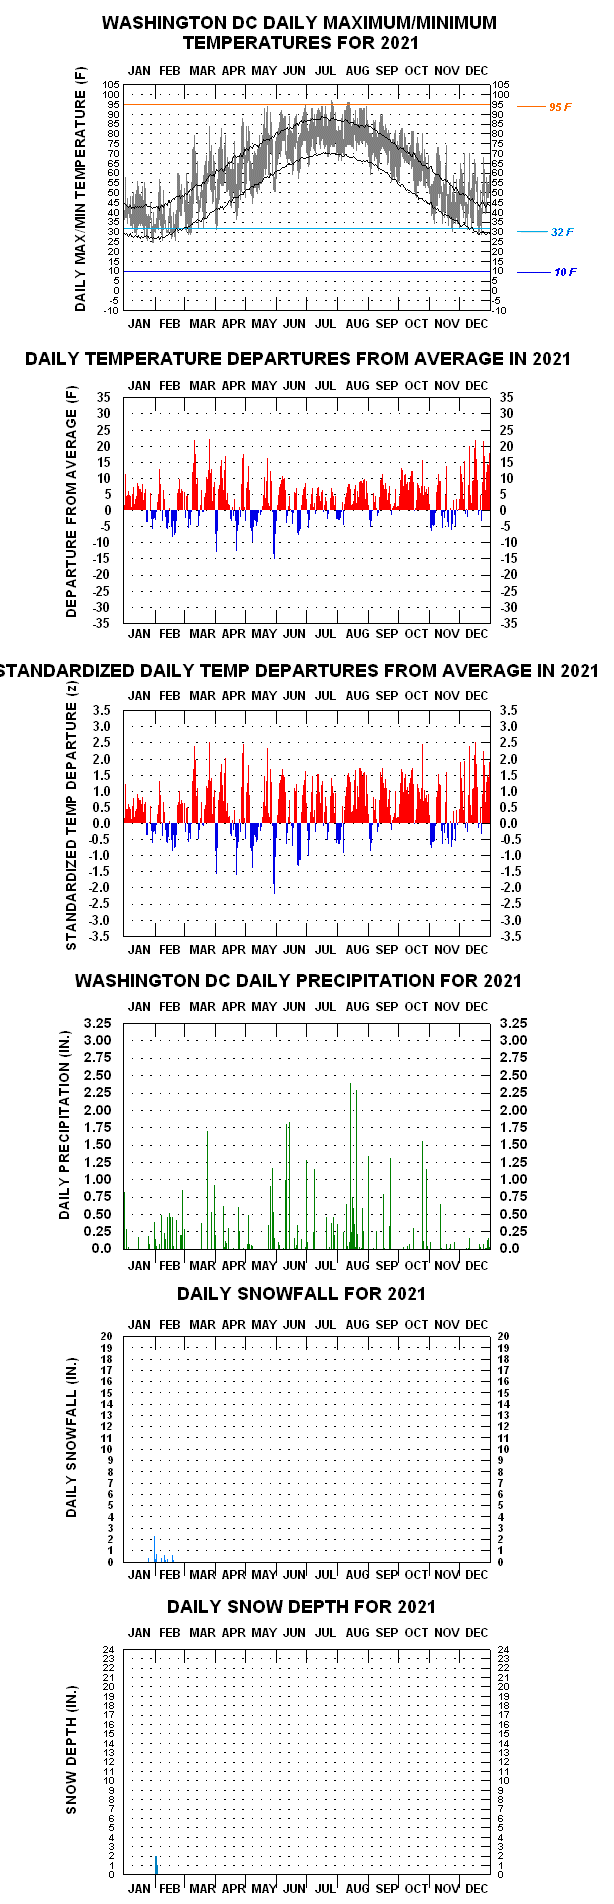
- 2021 Daily Temperature/Precipitation Graph for Washington DC
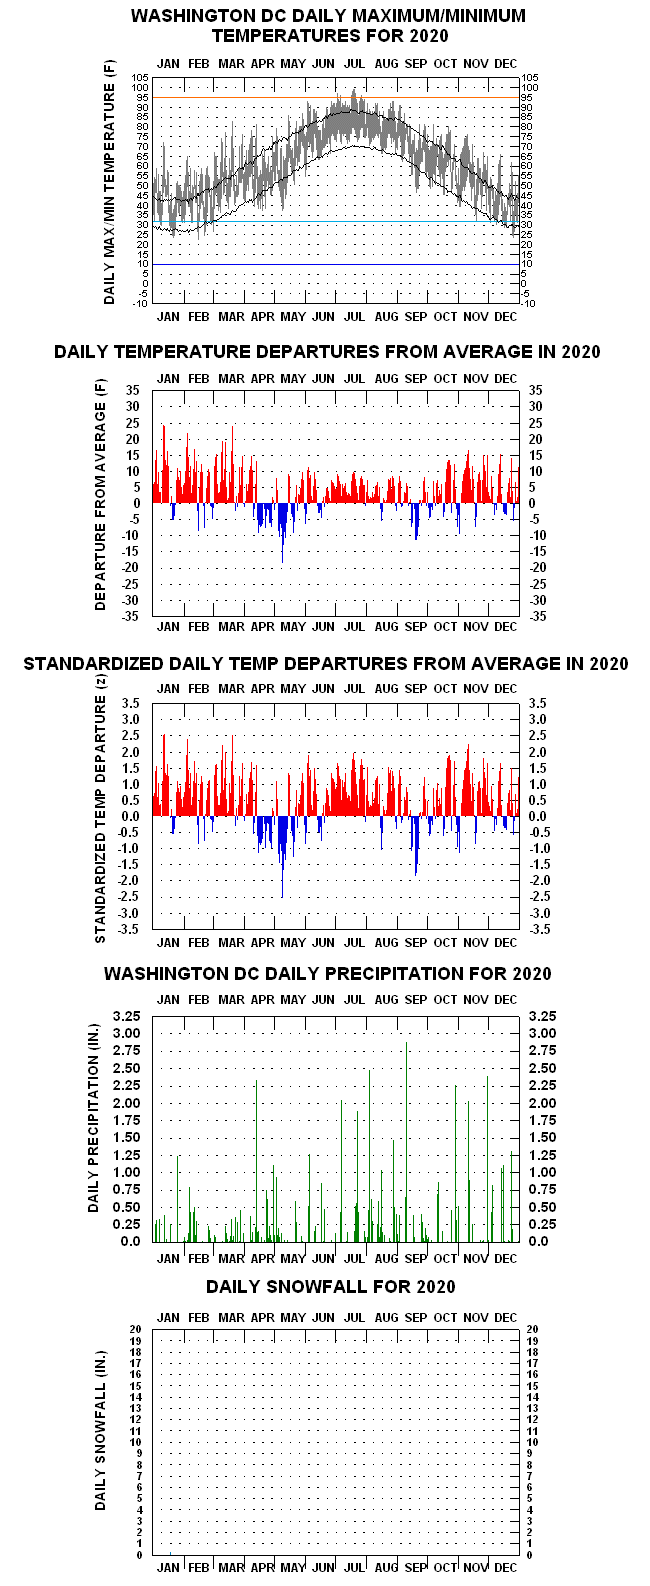
- 2020 Daily Temperature/Precipitation Graph for Washington DC
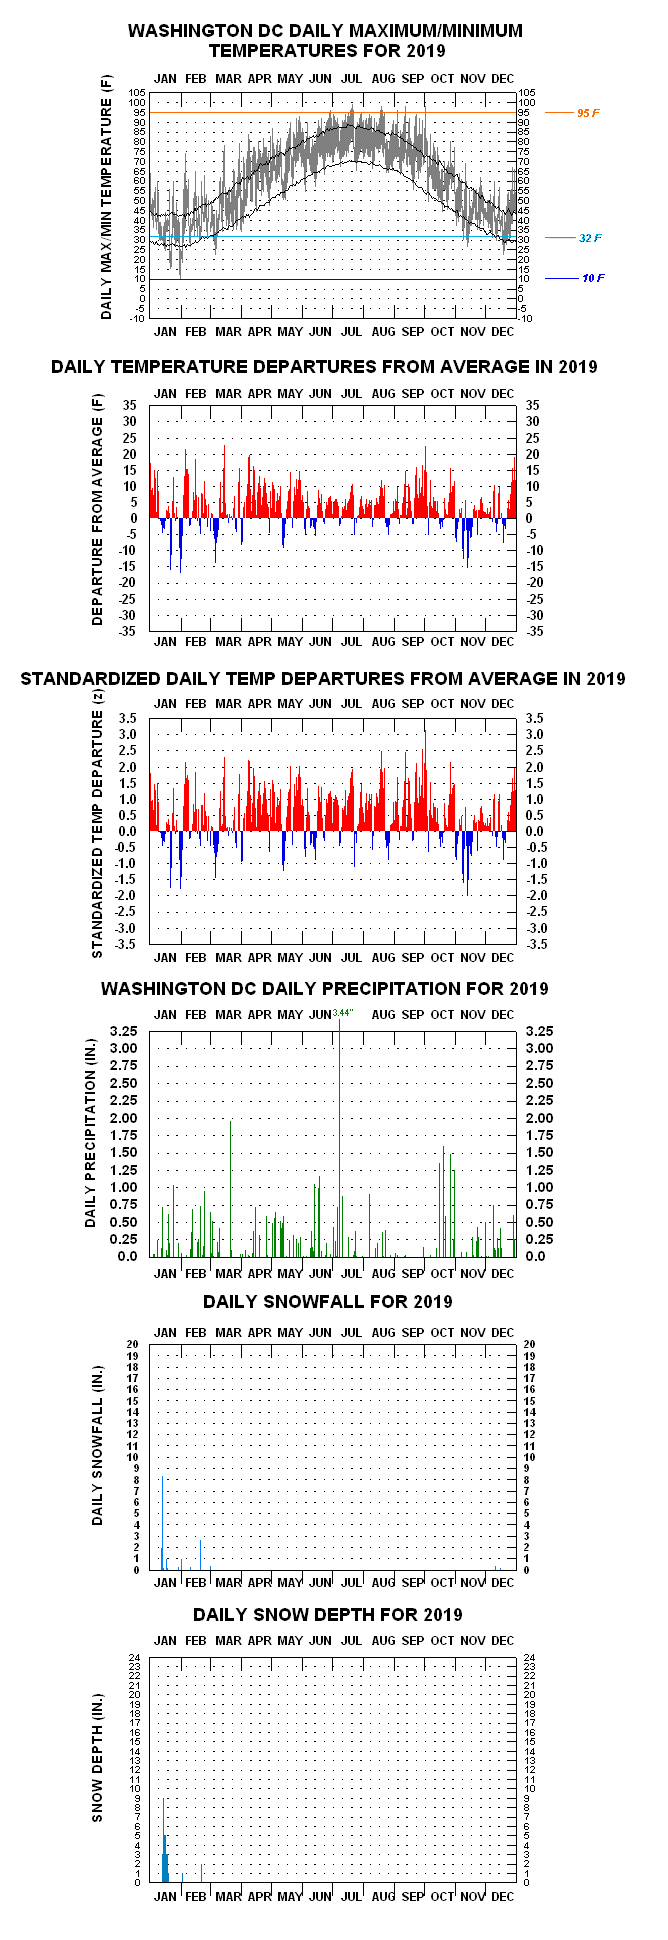
- 2019 Daily Temperature/Precipitation Graph for Washington DC
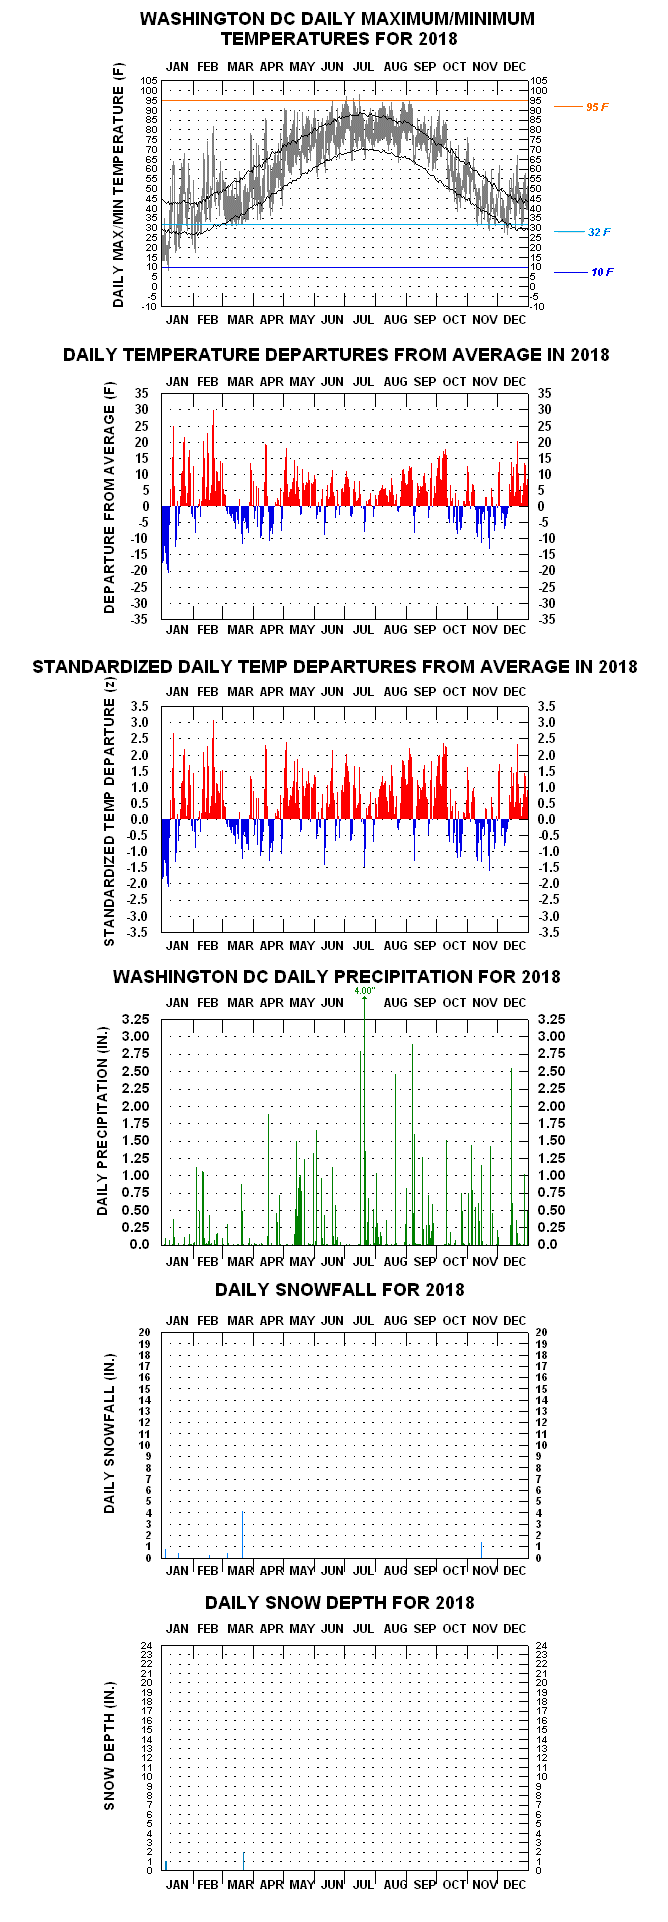
- 2018 Daily Temperature/Precipitation Graph for Washington DC
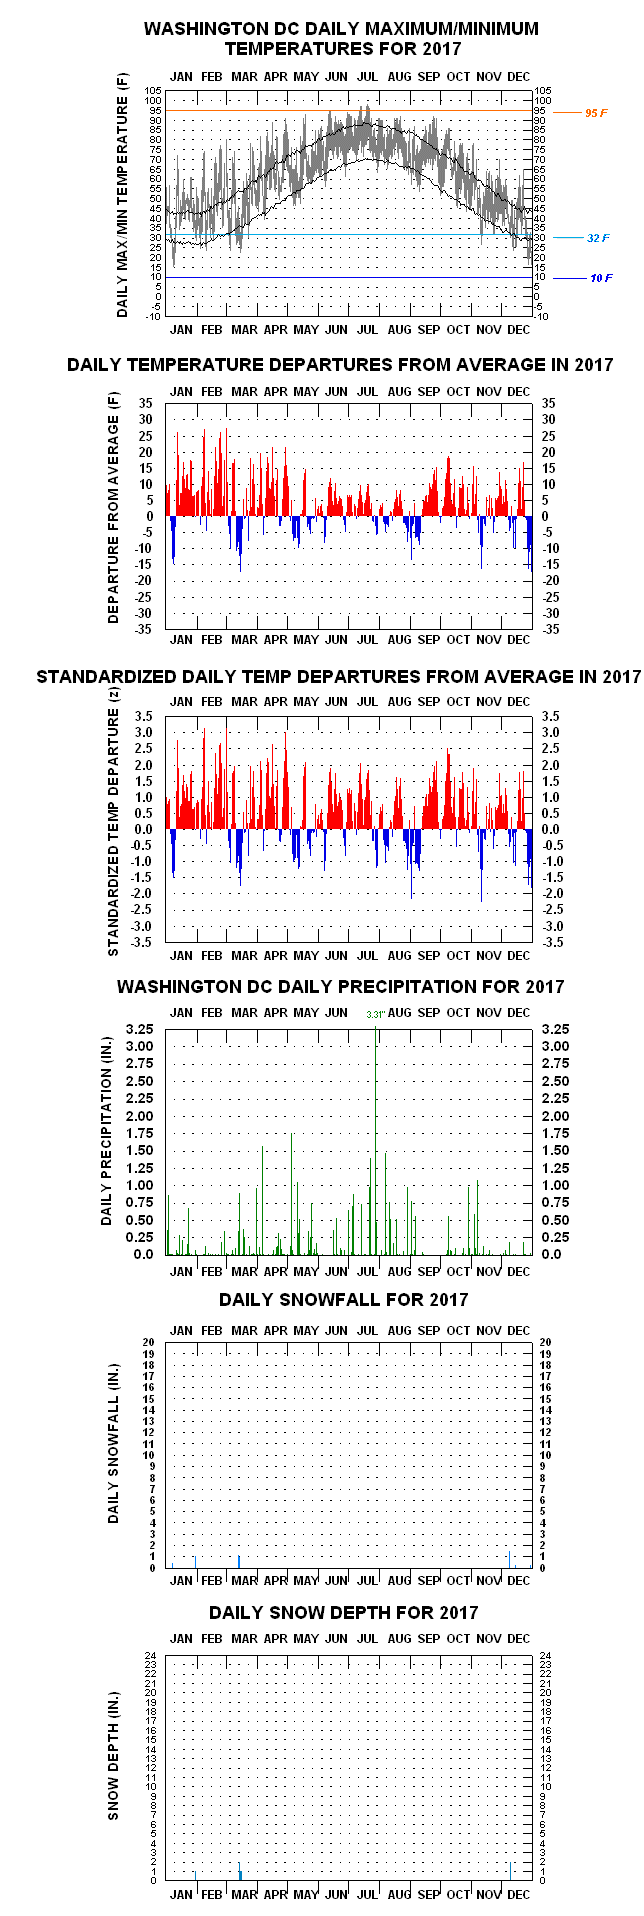
- 2017 Daily Temperature/Precipitation Graph for Washington DC
- View resource2017 Daily Temperature/Precipitation Graph for Washington DC
Historical Series
- Washington DC Annual Mean Temperature History (1872-2025) NewNew (1/5/26)
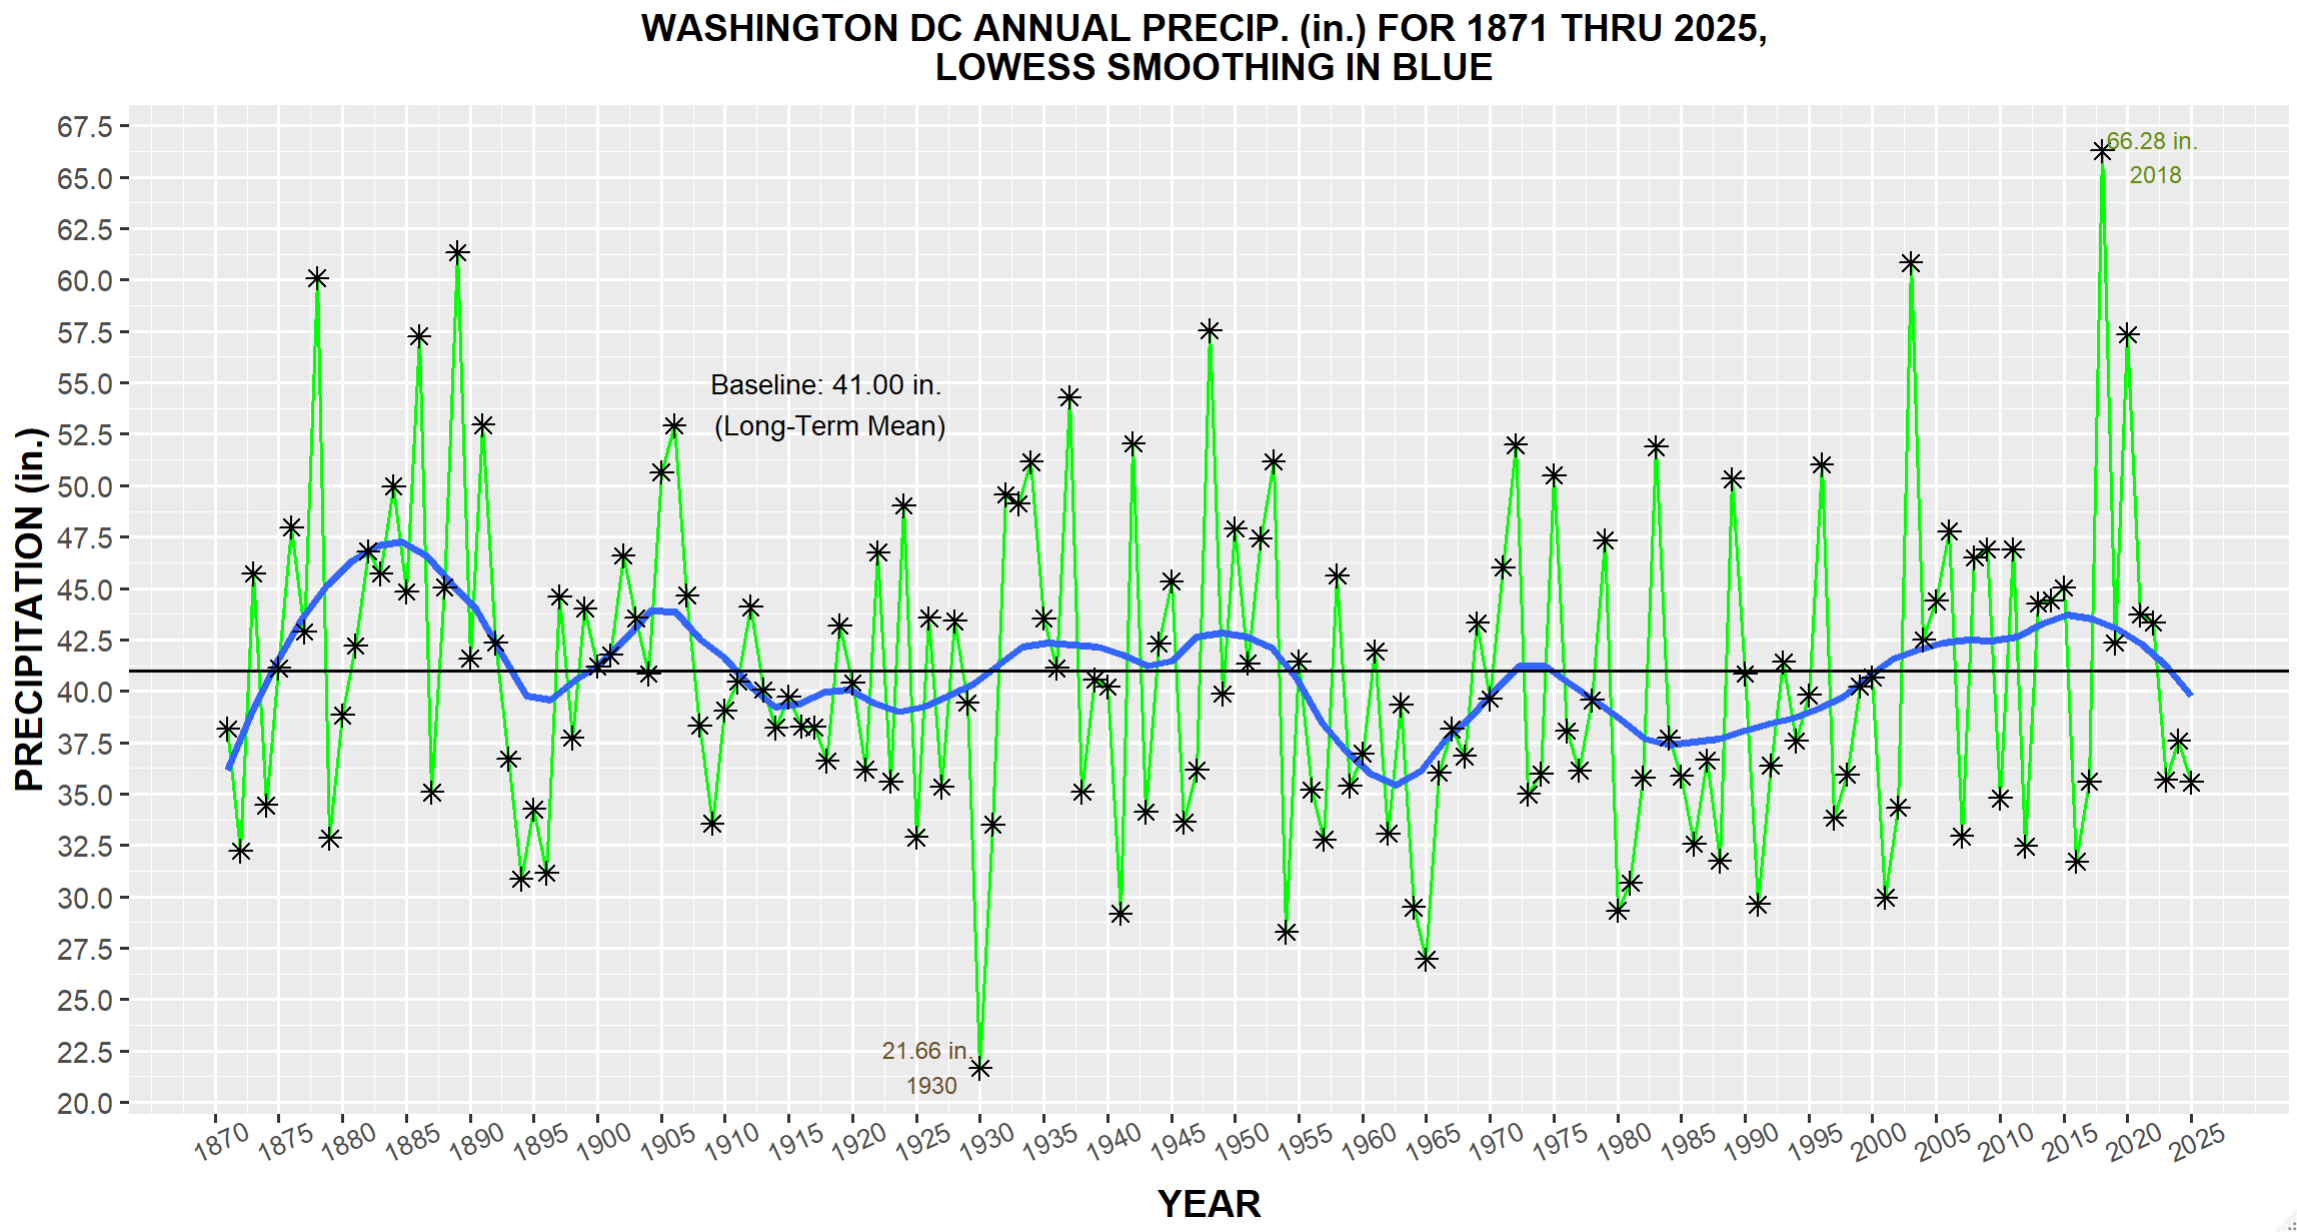
- Washington DC Annual Precipitation History (1871-2025) _ NewNew (1/5/2026)
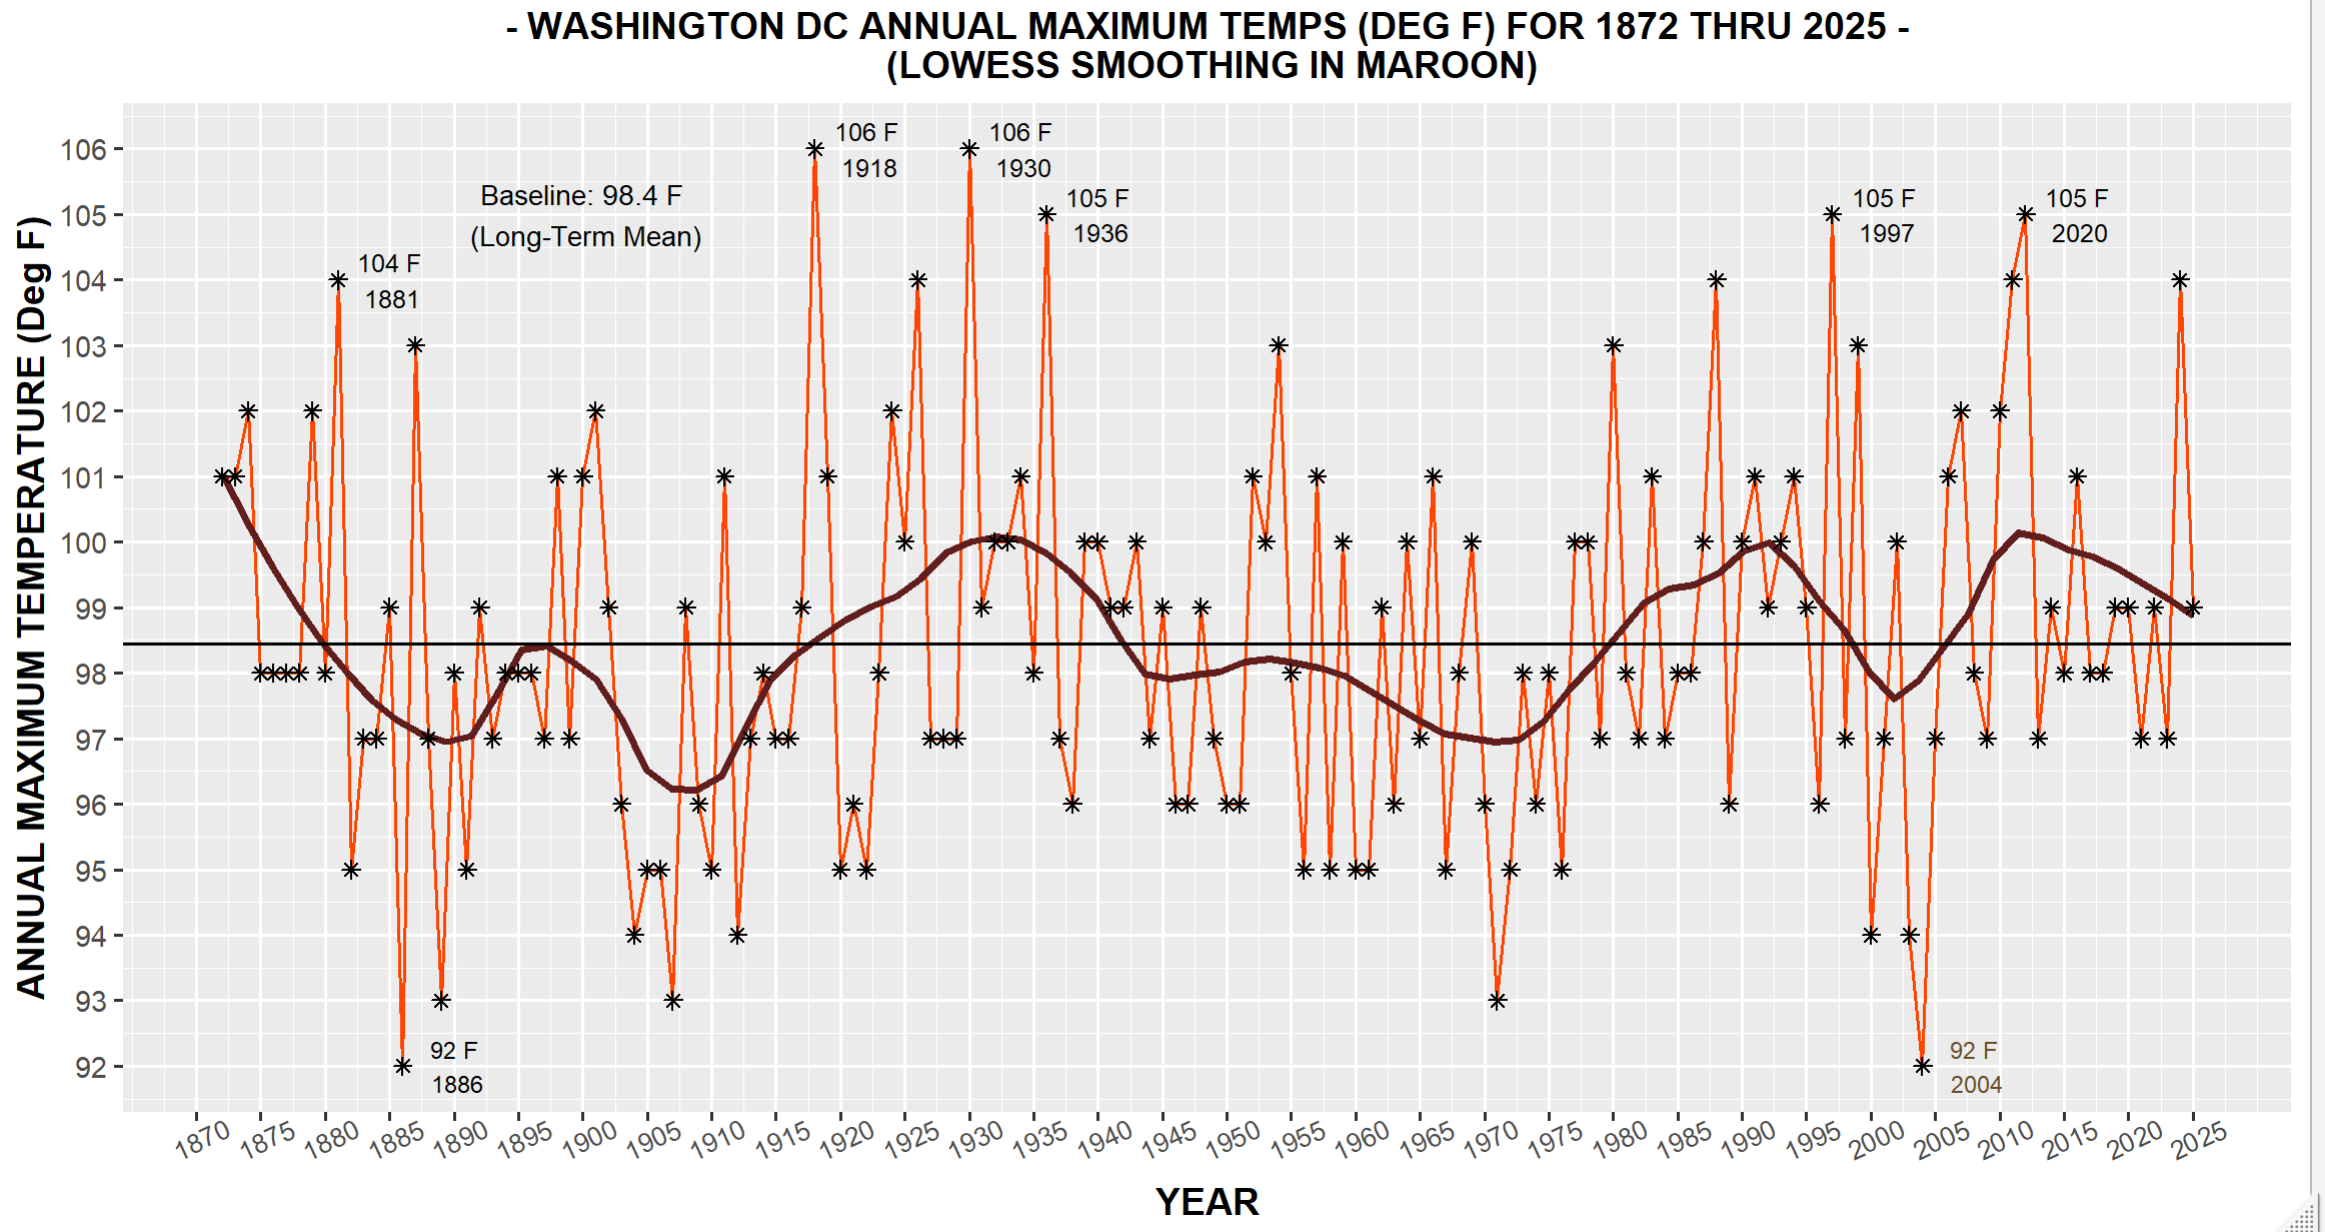
- Washington DC Annual Maximum Temperatures (1872-2025) NewNew (1/5/2026)
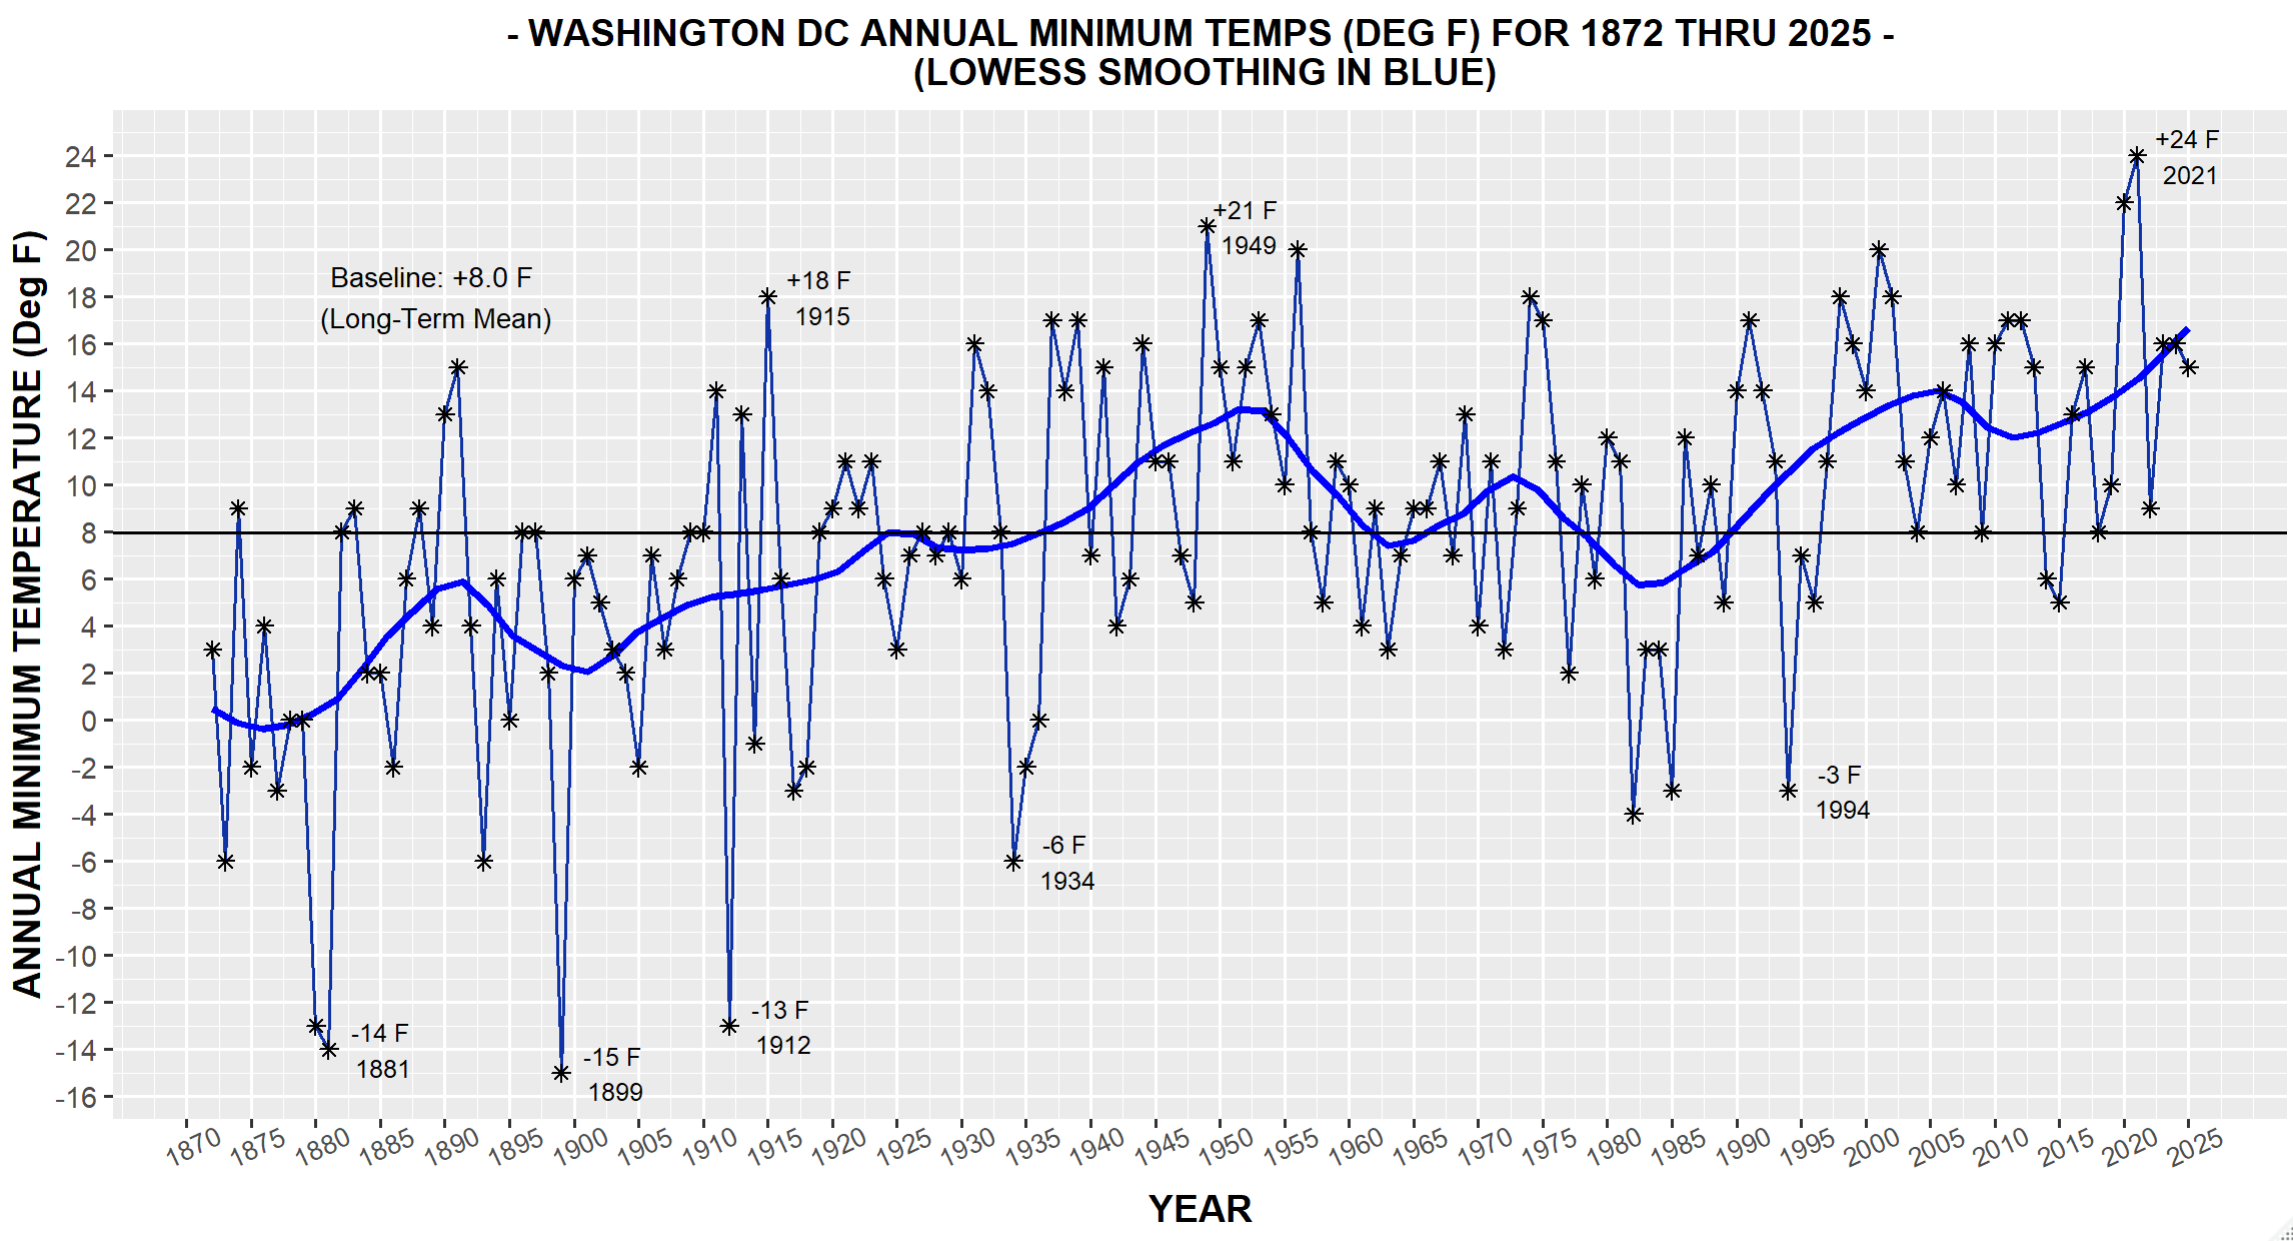
- Washington DC Annual Minimum Temperatures (1872-2025) NewNew (1/5/2026)
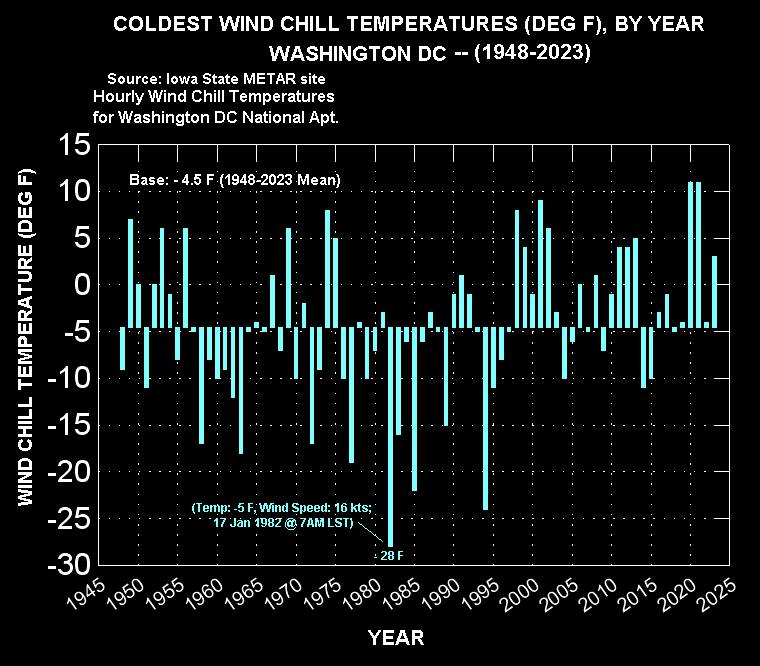
- Coldest Wind Chill Temps, by Year (1948-2023)
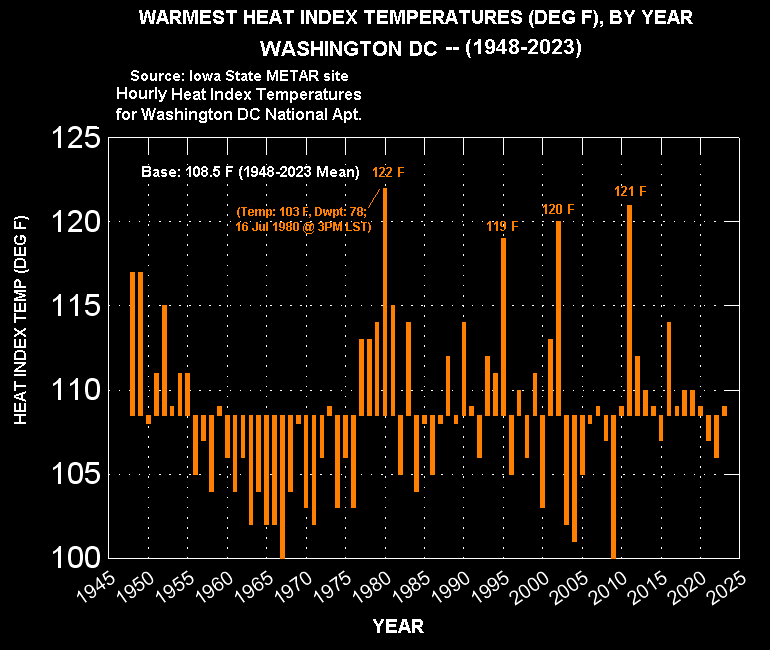
- Warmest Heat Index Temps, by Year (1948-2023)
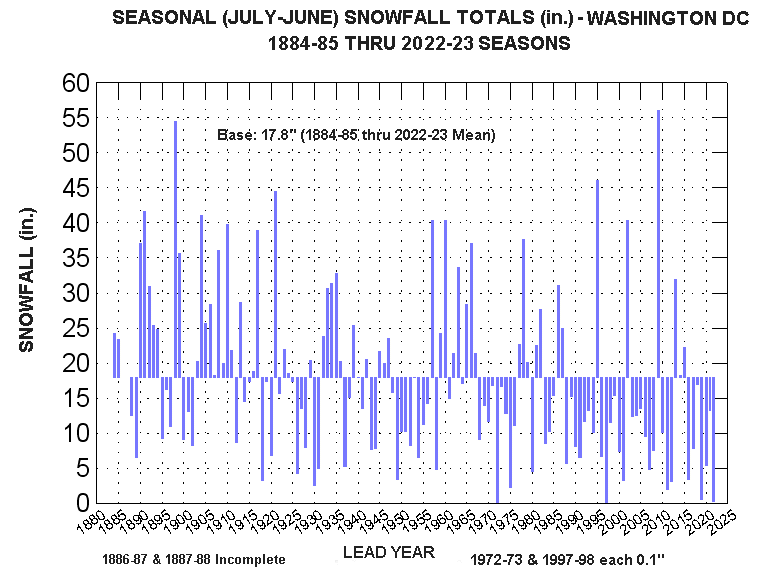
- Seasonal (July-June) Snowfall Totals (1884-85 thru 2022-23)
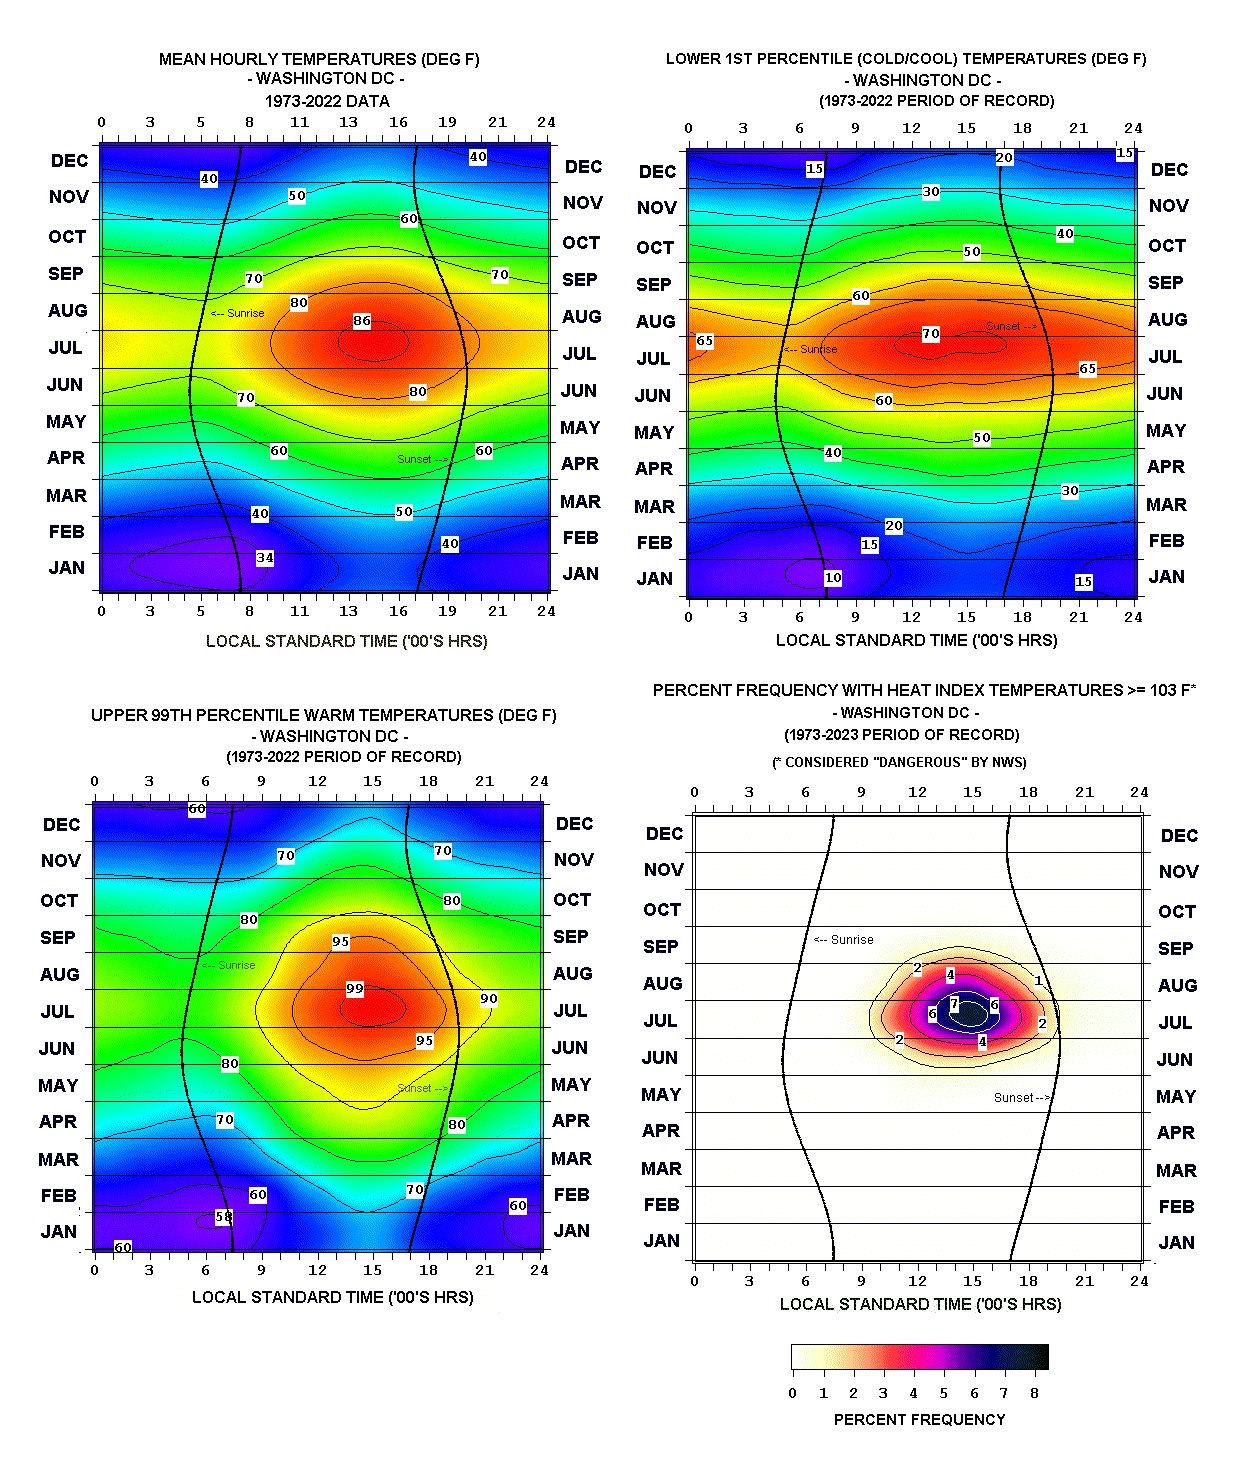
Hour-By-Month Climograms for Washington DC
- Hourly Temperatures (4) - Means, 99th Percentile Threshold Extremes, and Heat Index >-103 F Threshold Frequencies
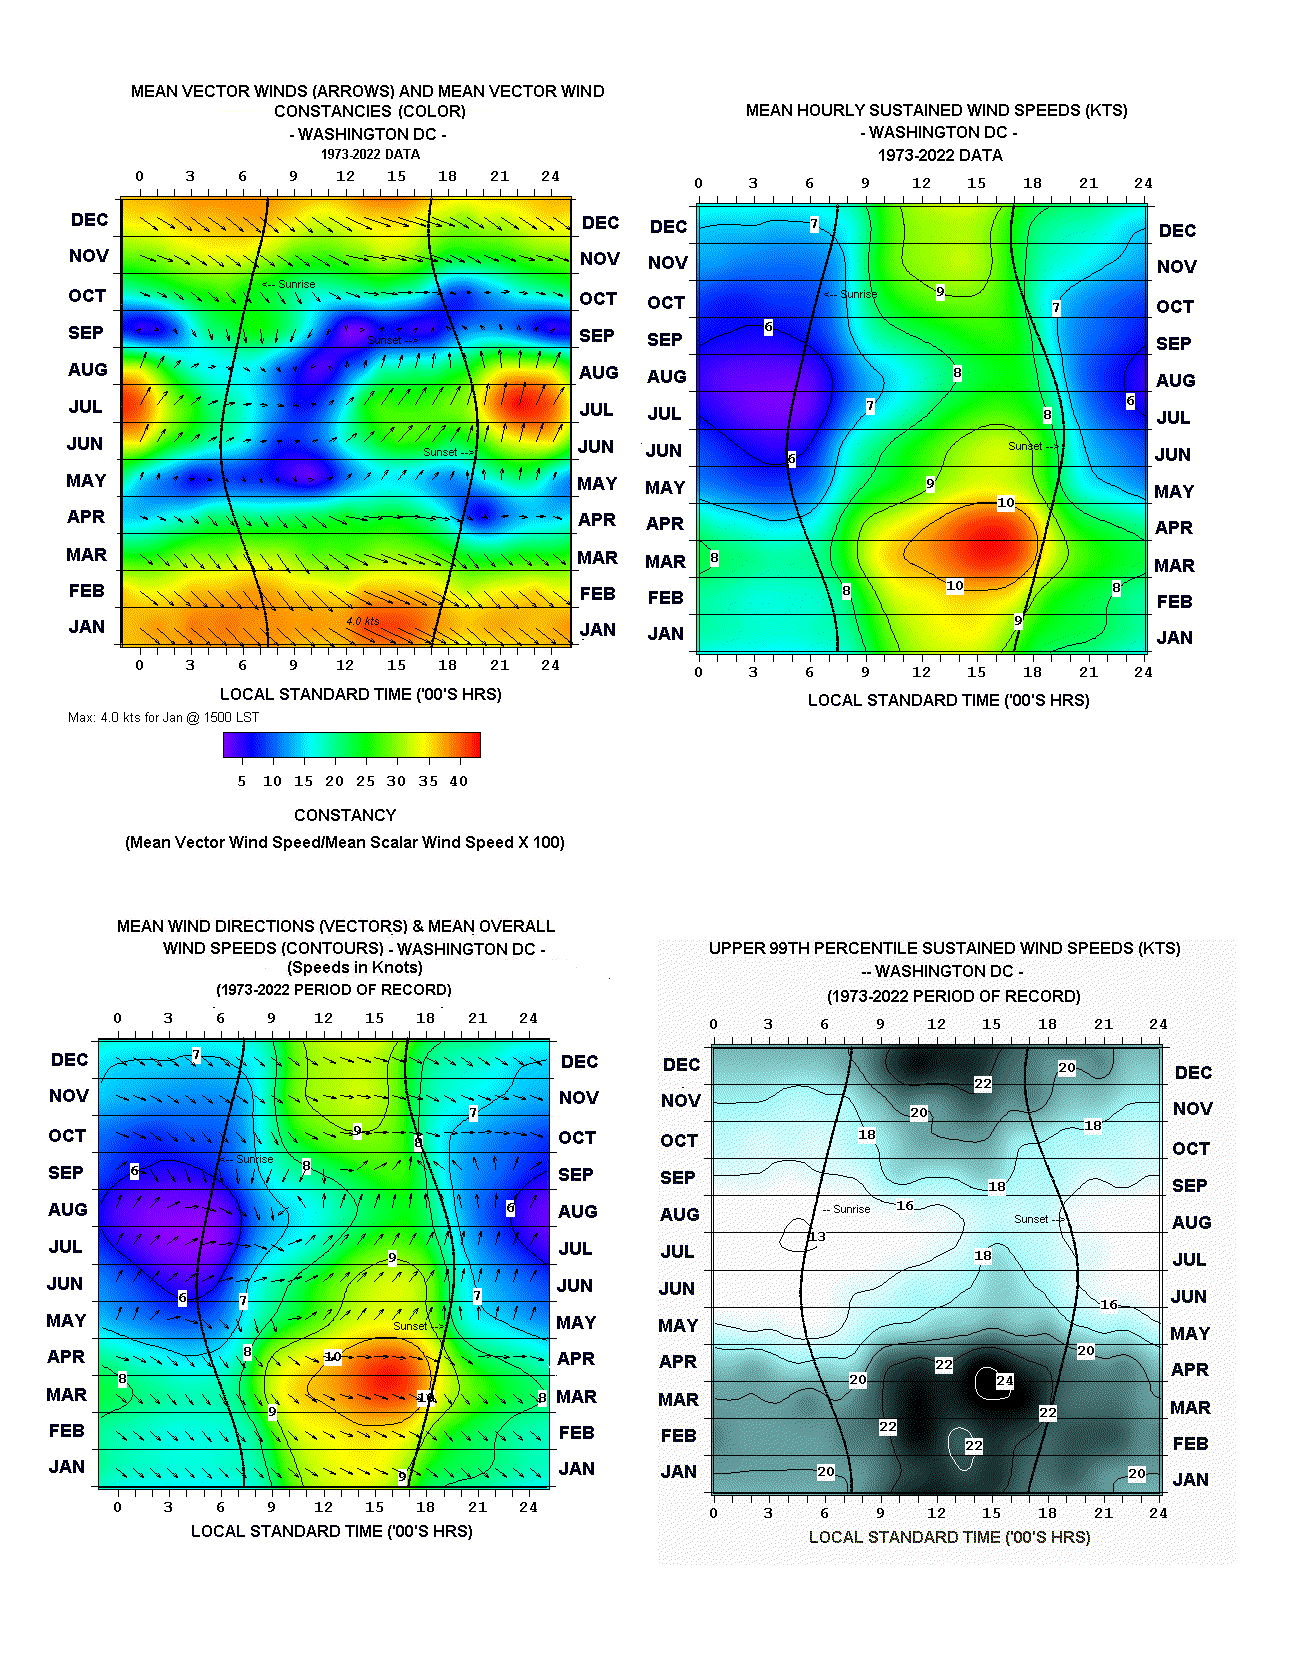
- Hourly Winds (4) - Resultants, Mean Scalar Speeds, Mean Directions/Scalar Speeds, and Upper 99th Percentile Threshold High Sustained Speeds
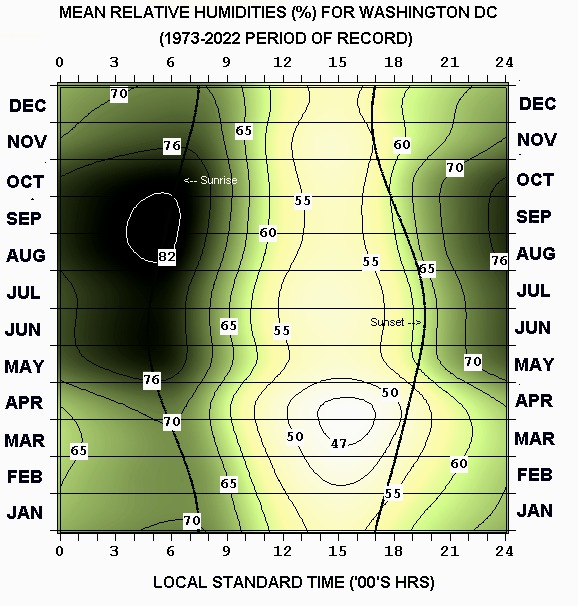
- Mean Hourly Relative Humidities
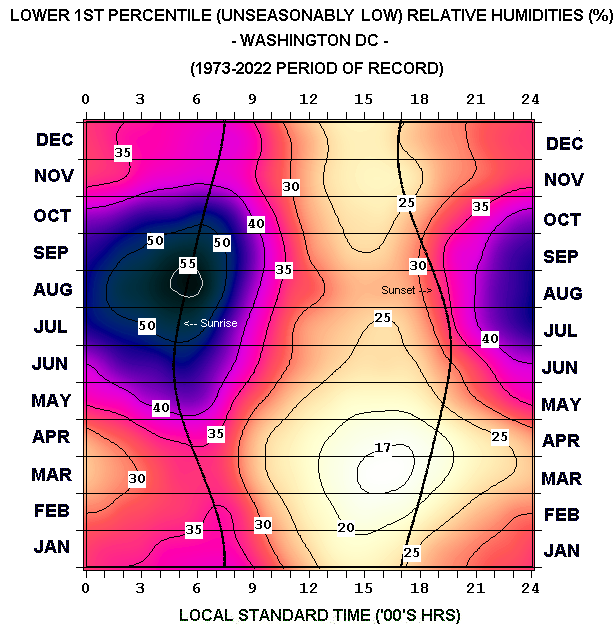
- Lower 1st Percentile Threshold (Unseasonably Low) Relative Humidities
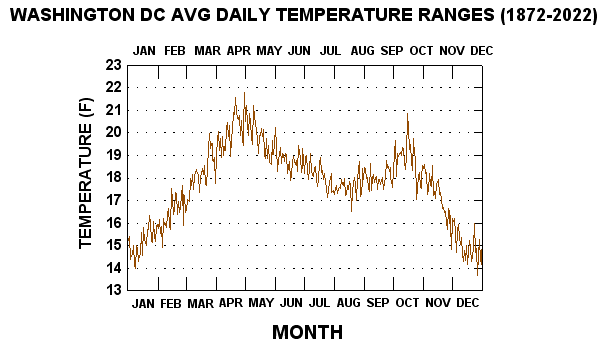
Other Summary Climate Charts:
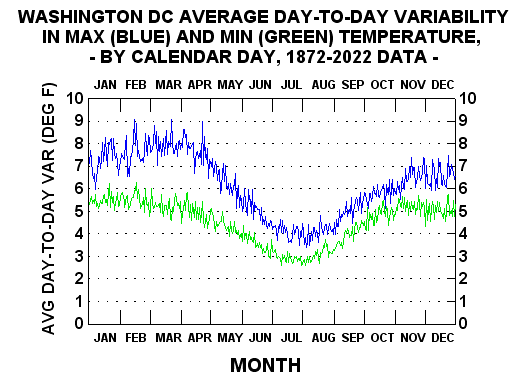
Year-To-Year Graphs - Interpretation
The top chart for a given year’s page (accessed by the links below) are “floating-bars” of the year's daily maxima and minima temperatures. Superimposed on the bars are two line traces, the upper one connecting long-term (1872-2022) mean daily maxima, the lower one mean daily minima.
Second chart down depicts the day-to-day mean temperature anomalies (daily mean temperature less the corresponding long-term 1872-2022 climatological mean). Departures extending upward in red from the zero line indicate warmer than average means for the day, those extending downward in blue indicate below average ones.
(Note: Clicking on the floating-bar charts a second time after they appear on the screen will enlarge them further and make the details more viewable).
Year-To-Year Graphs — OLDER YEARS
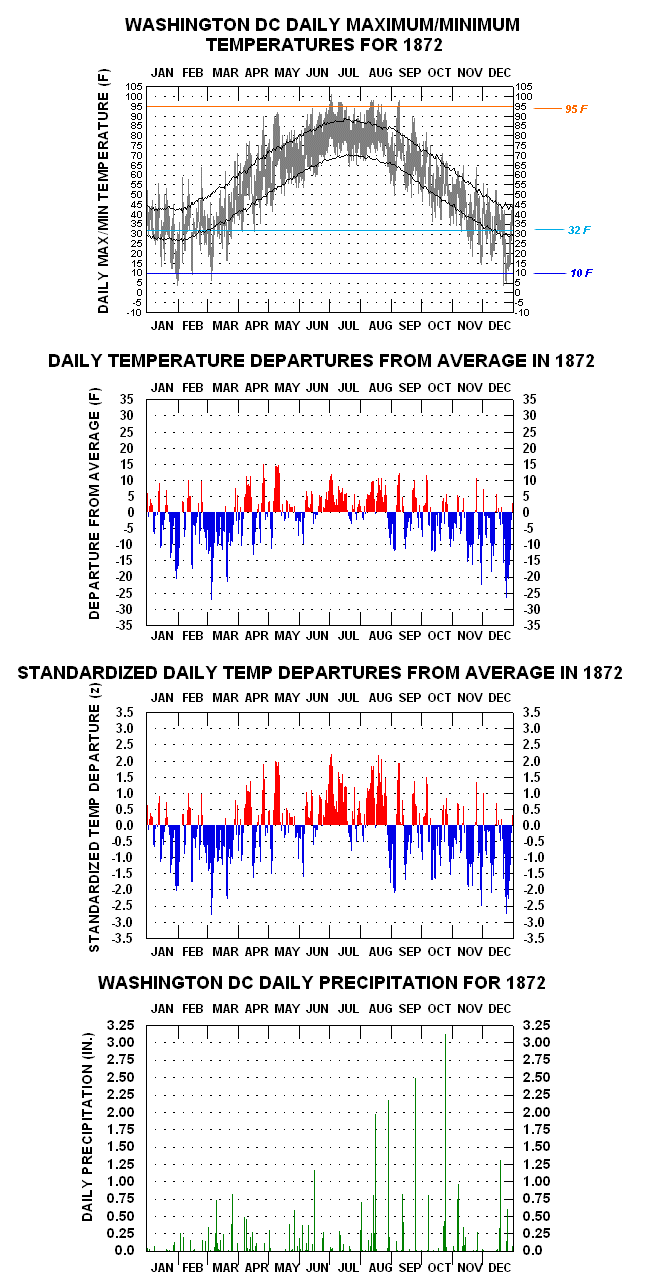
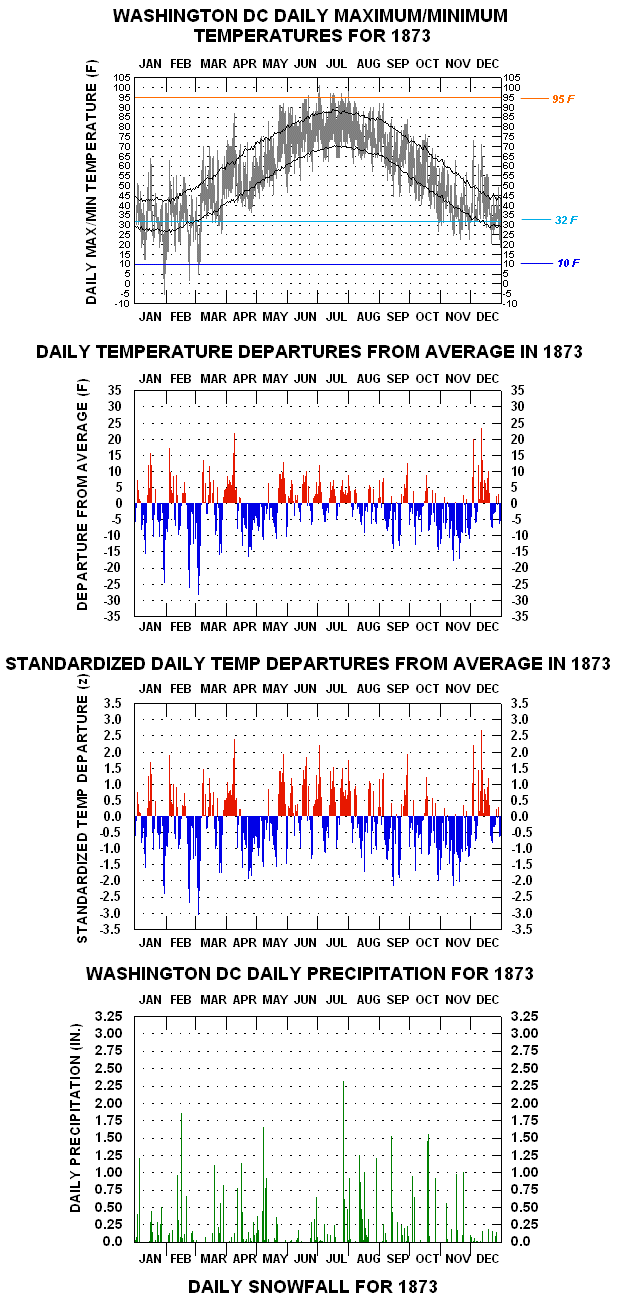
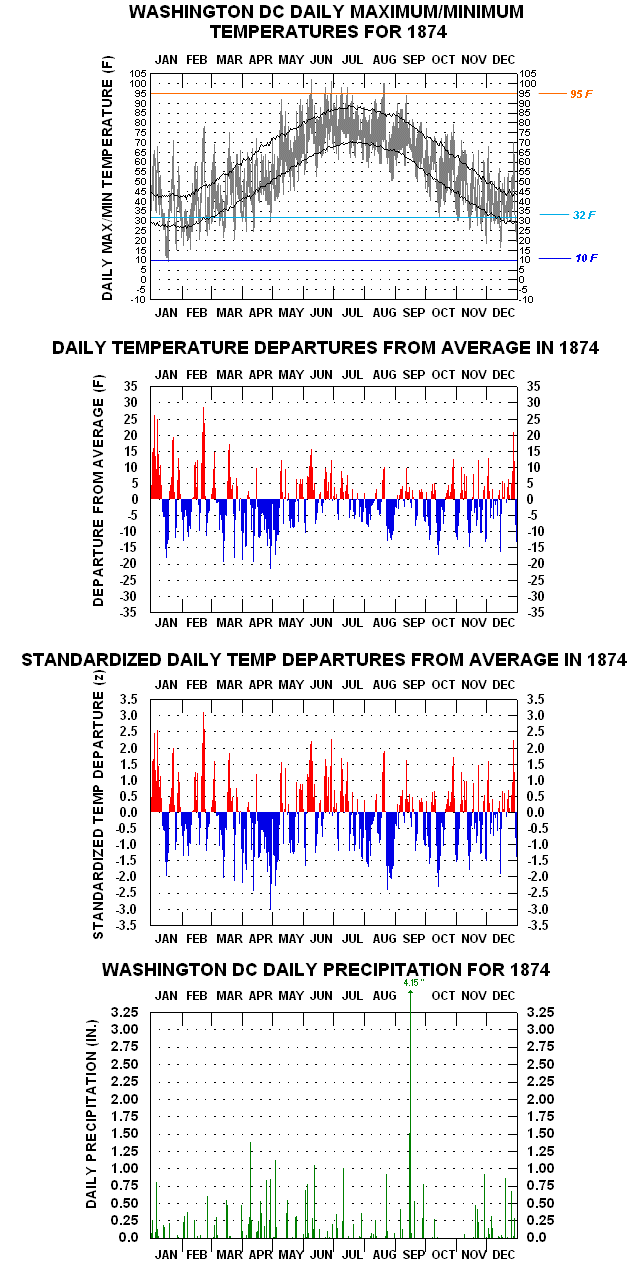
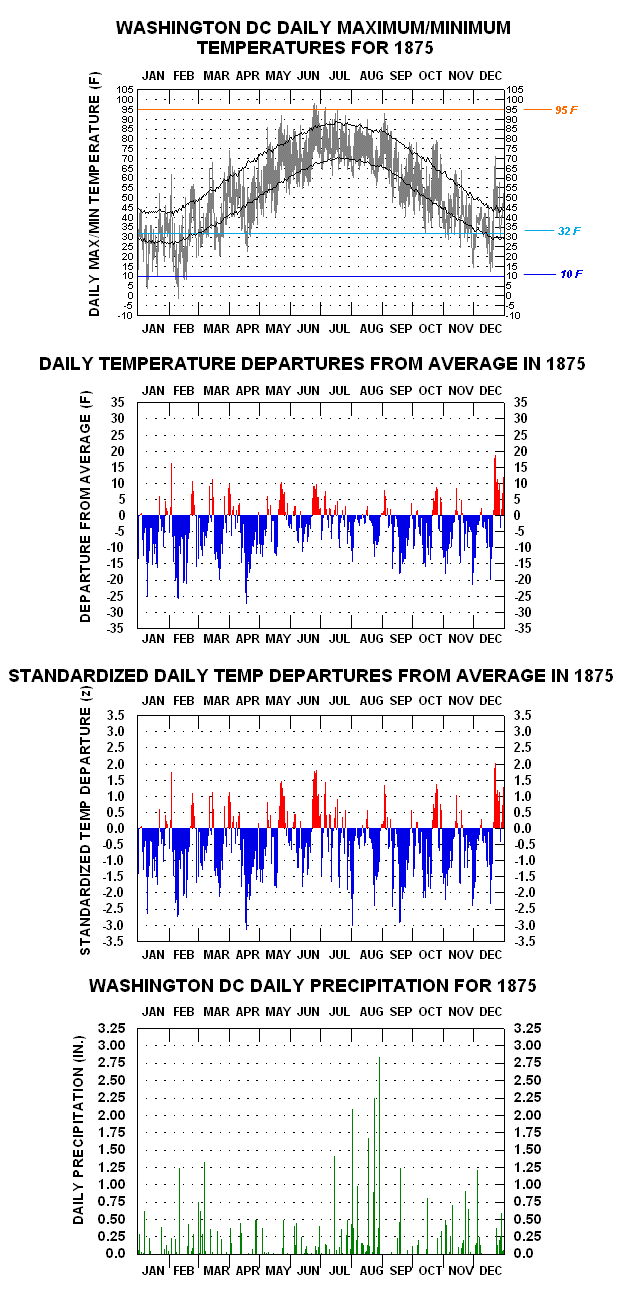
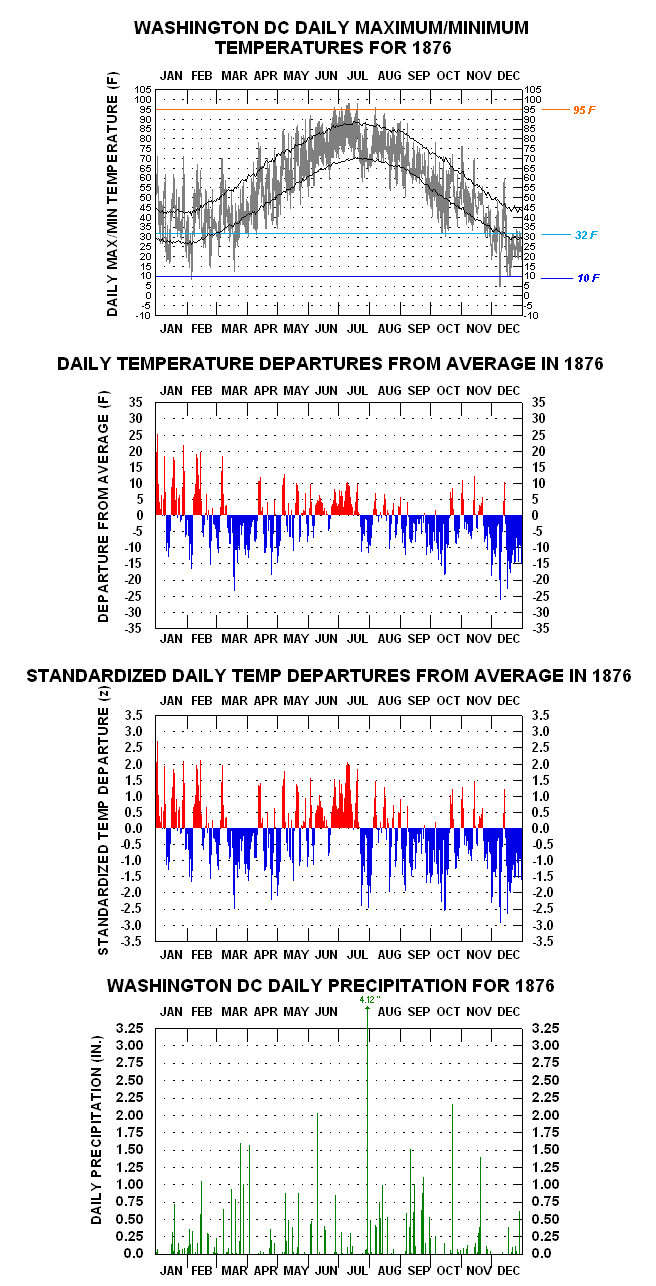
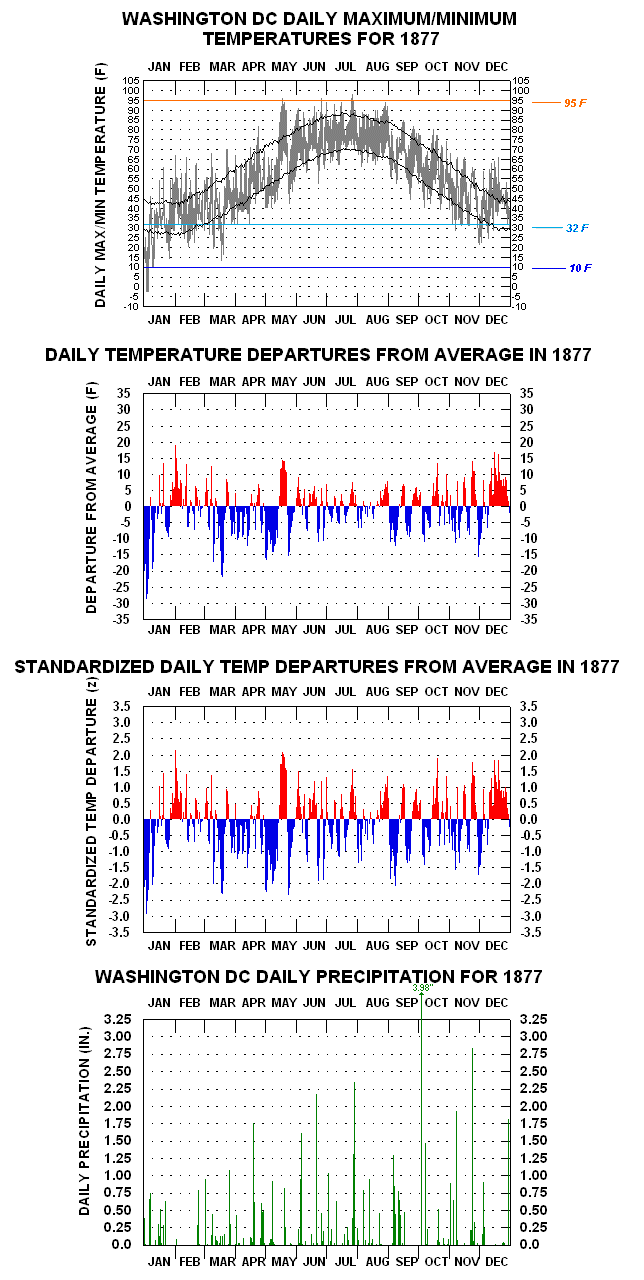
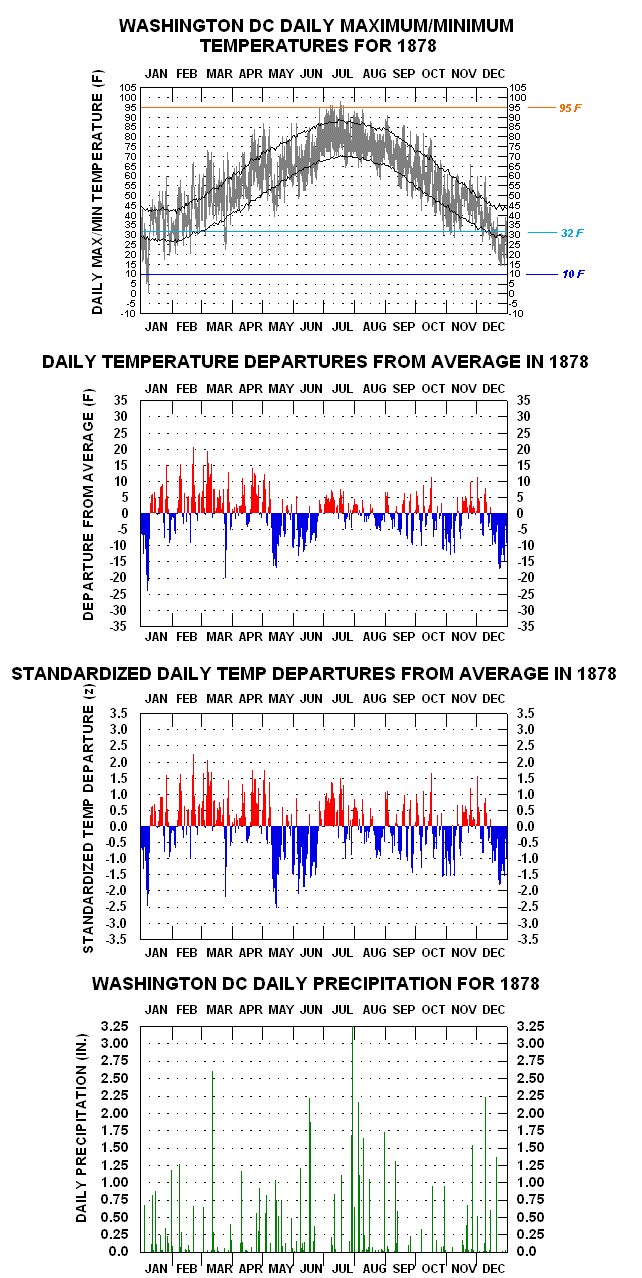
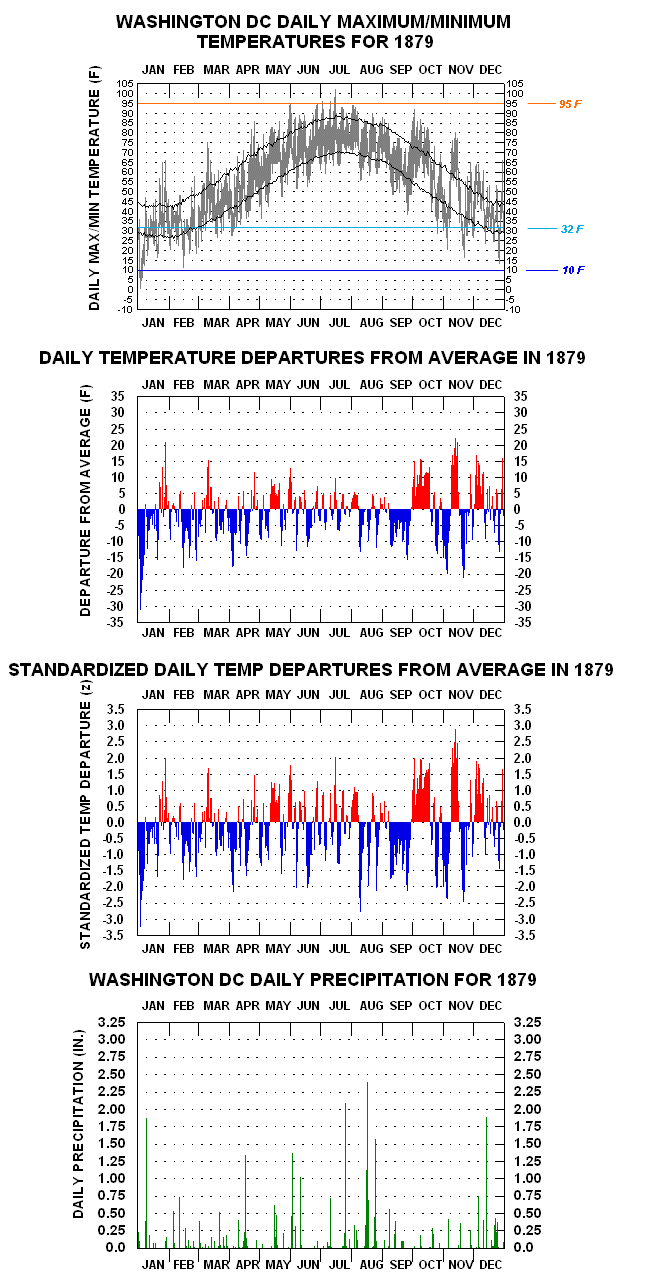
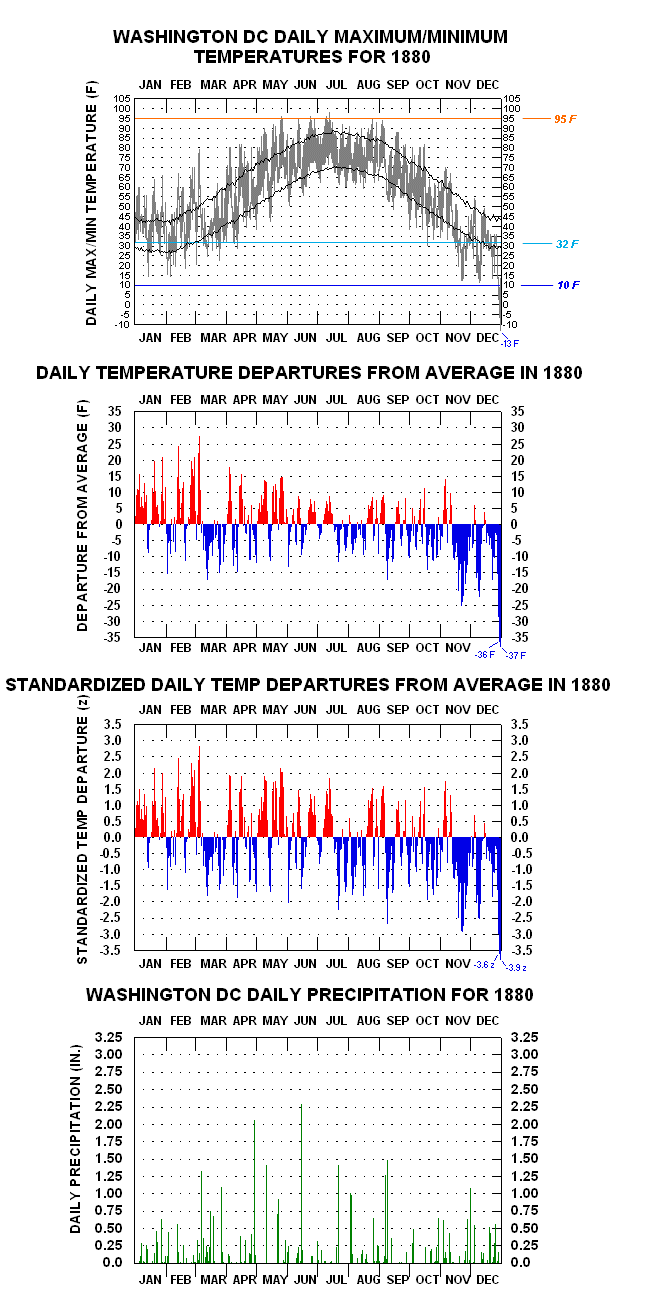
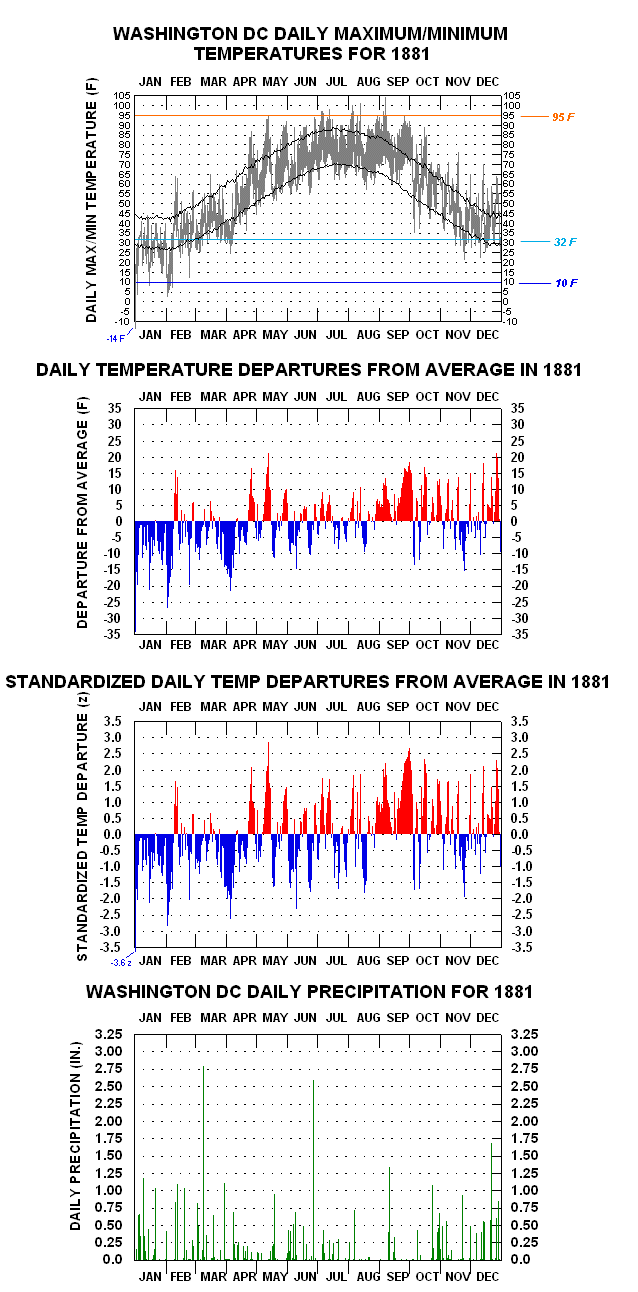
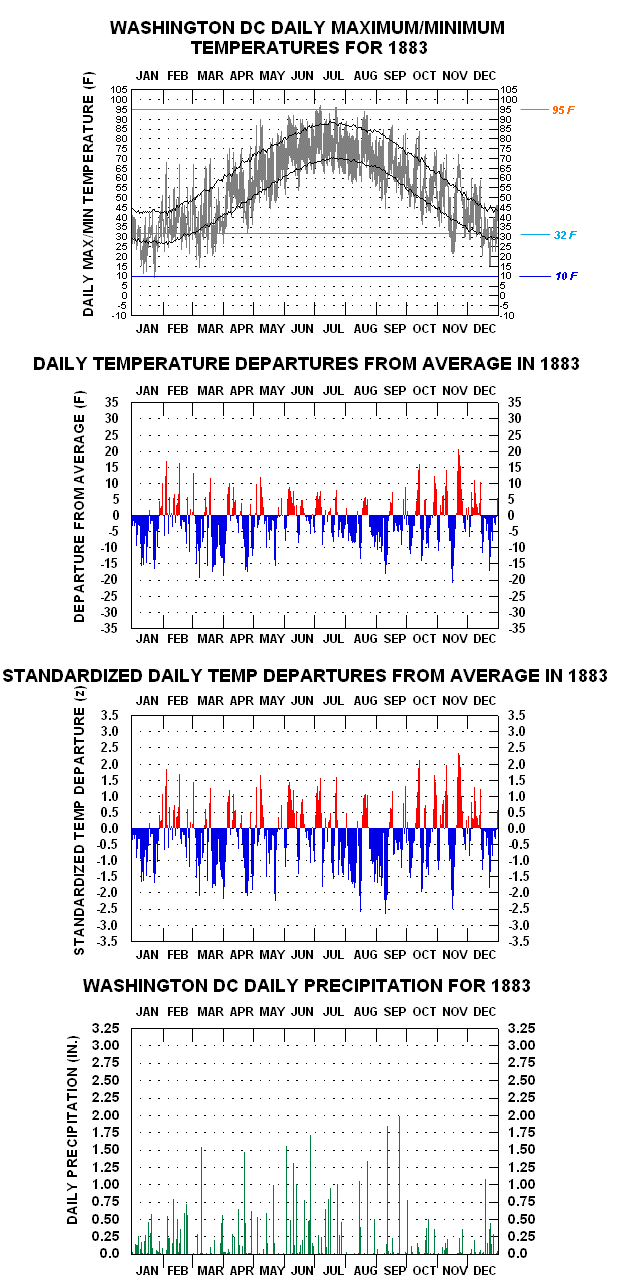
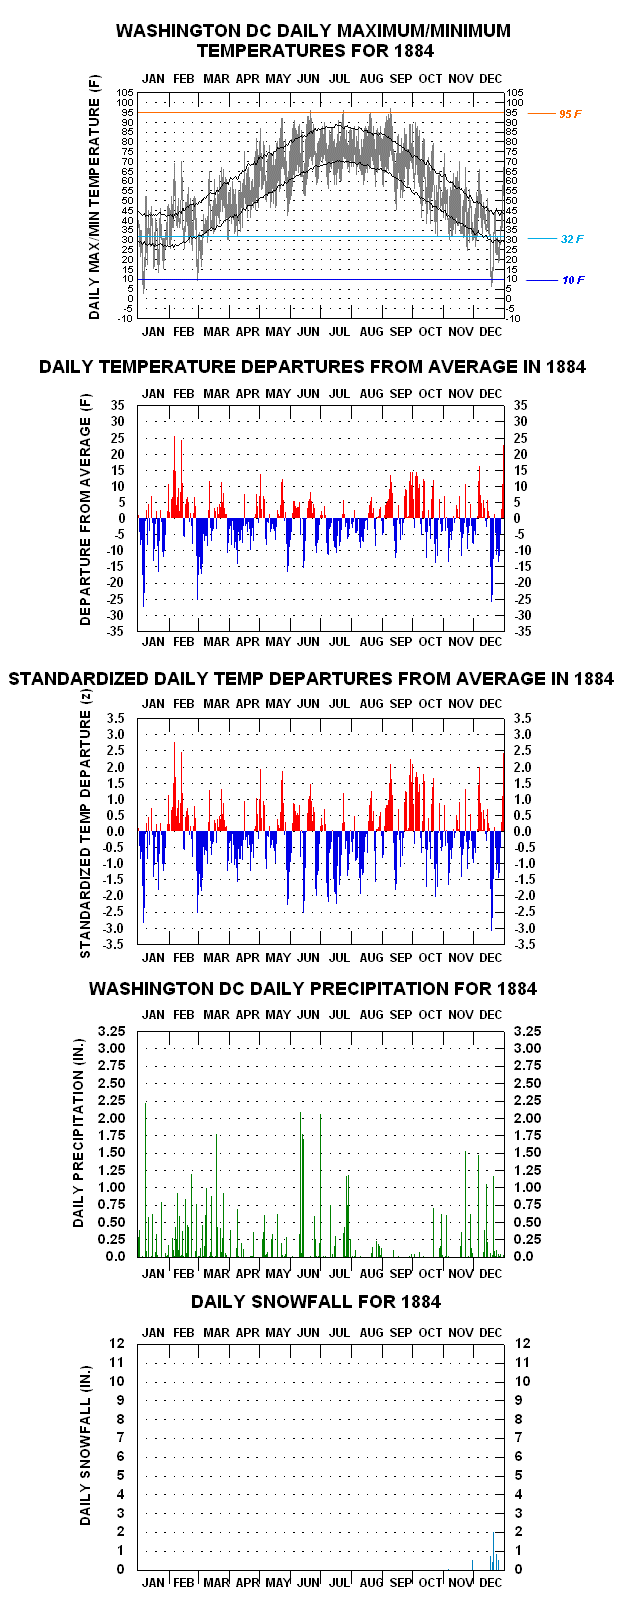
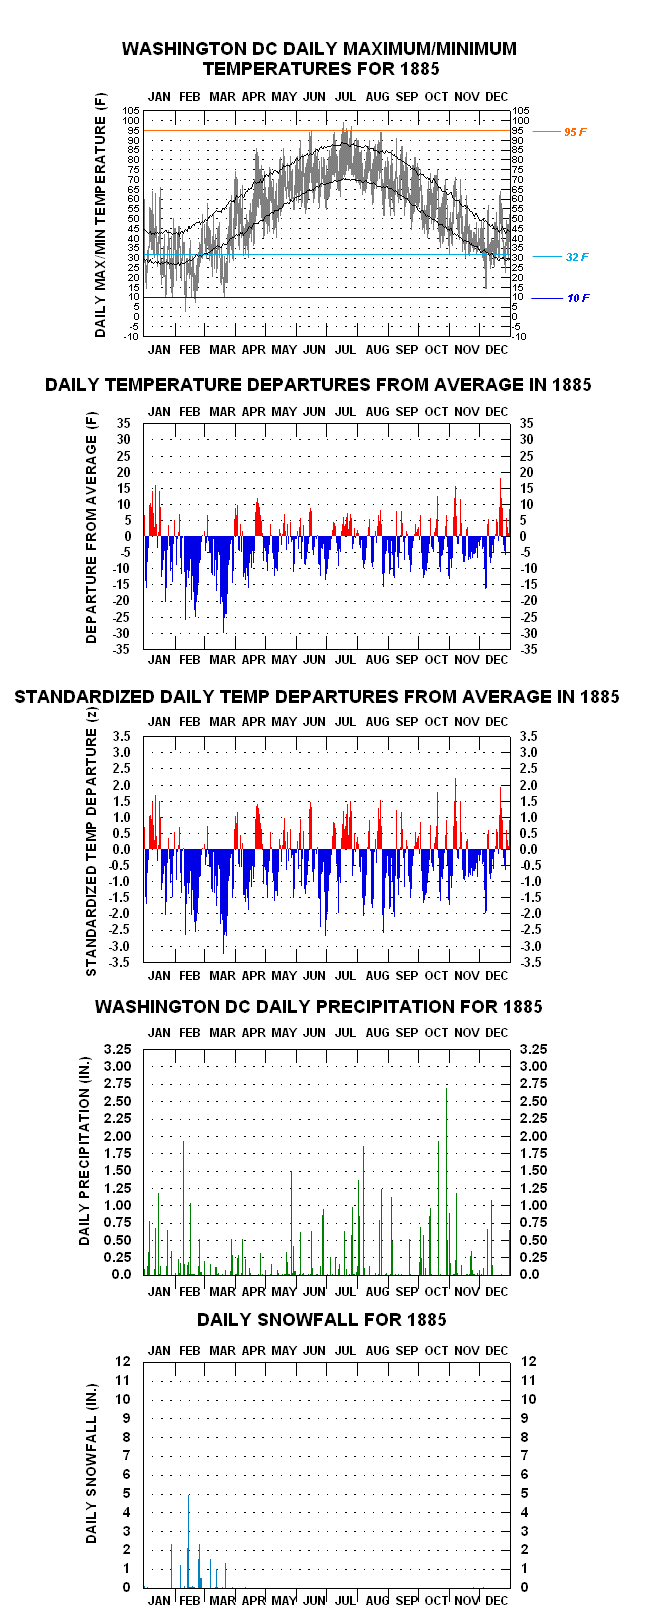
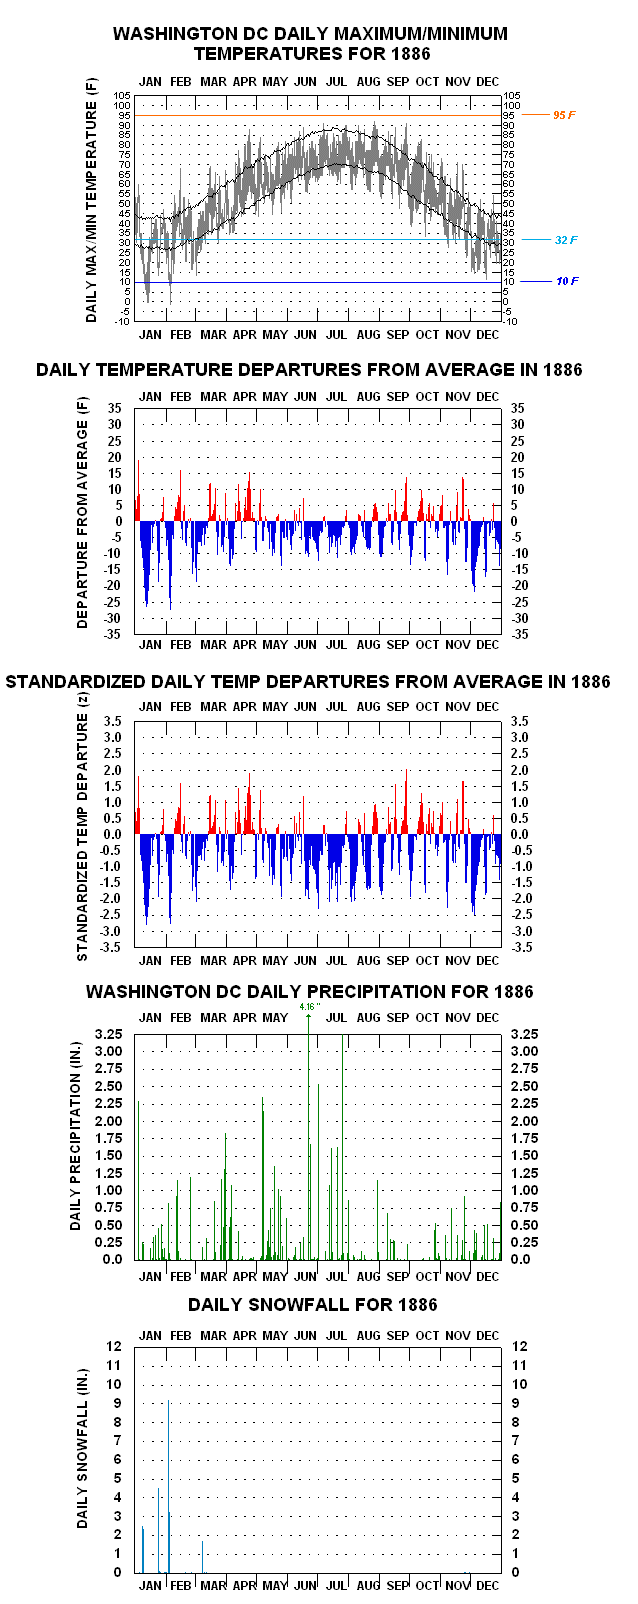
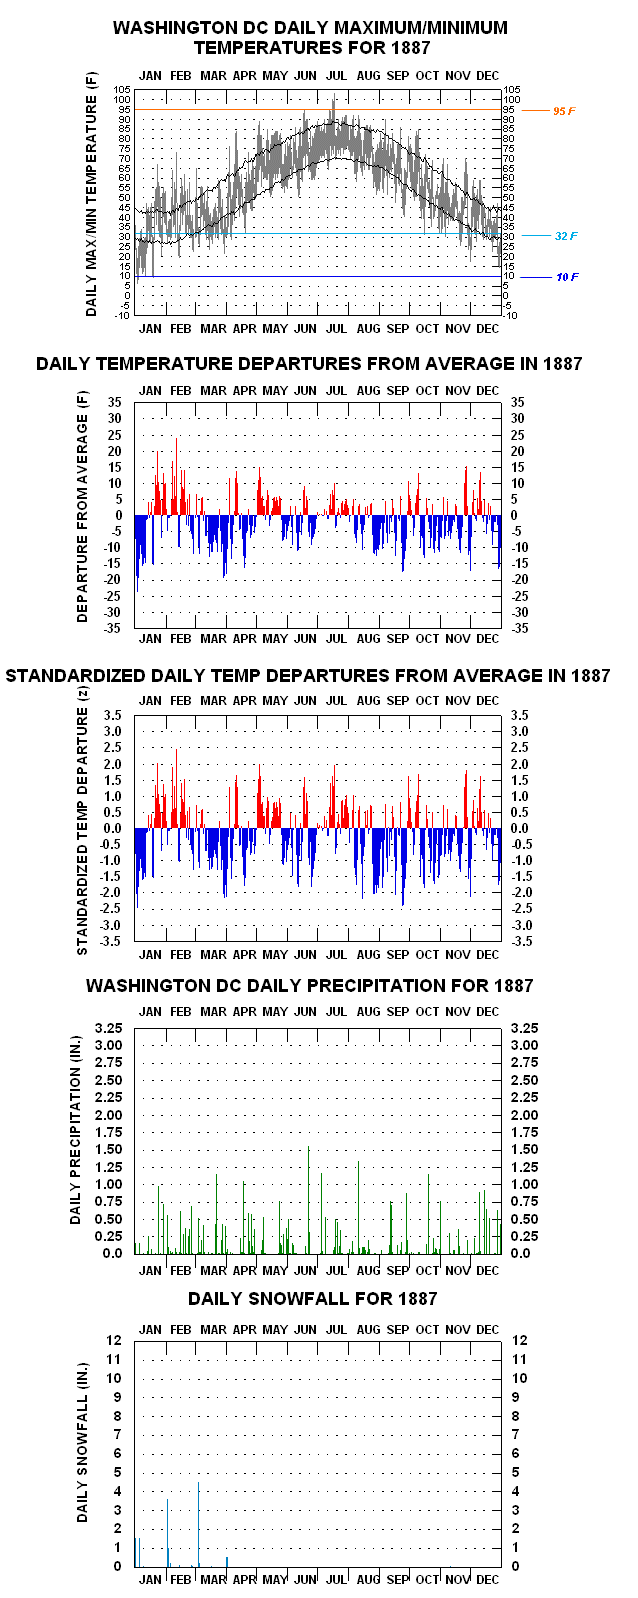
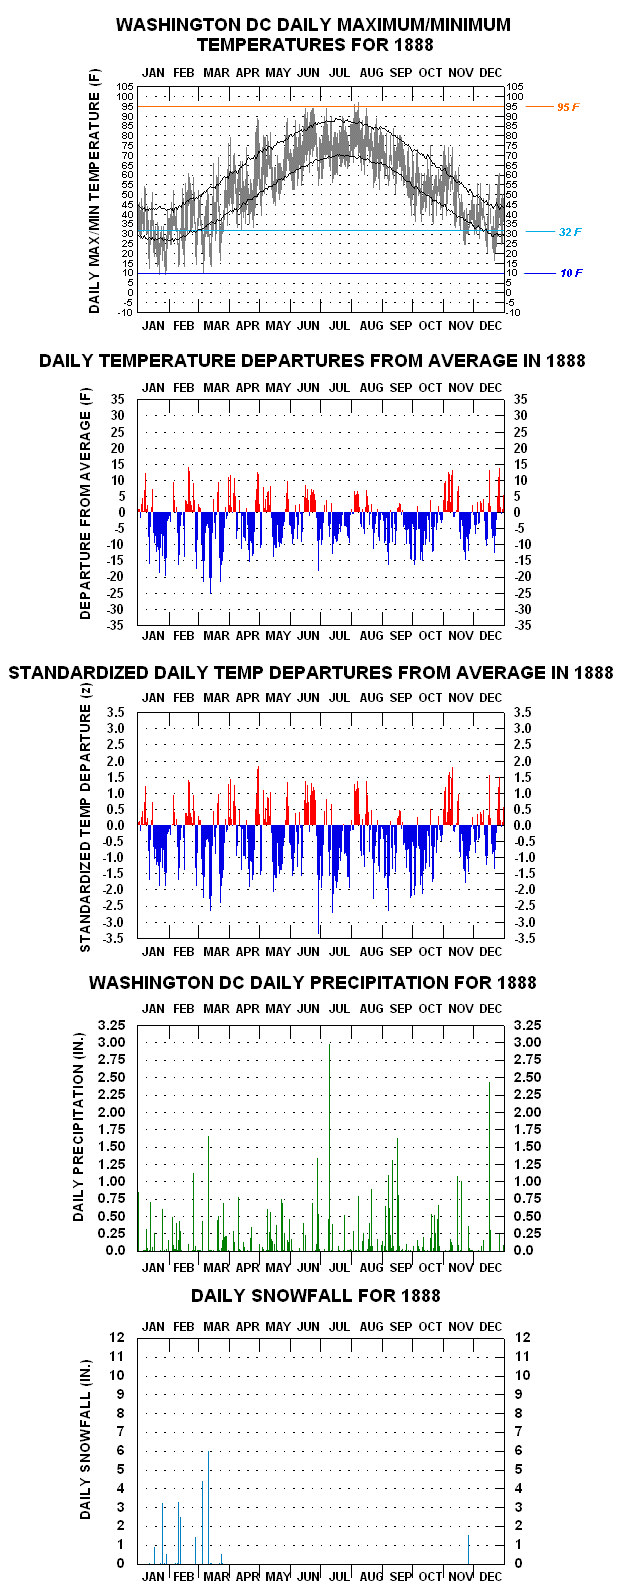
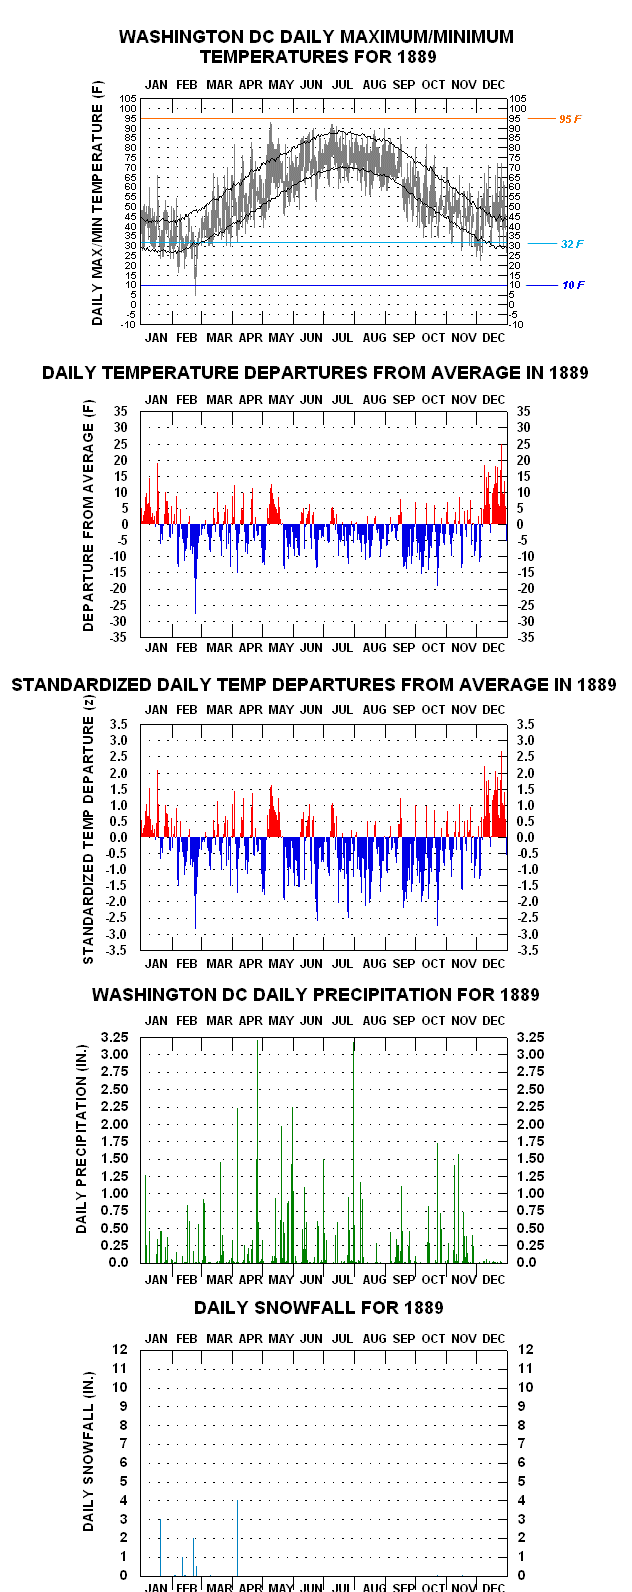
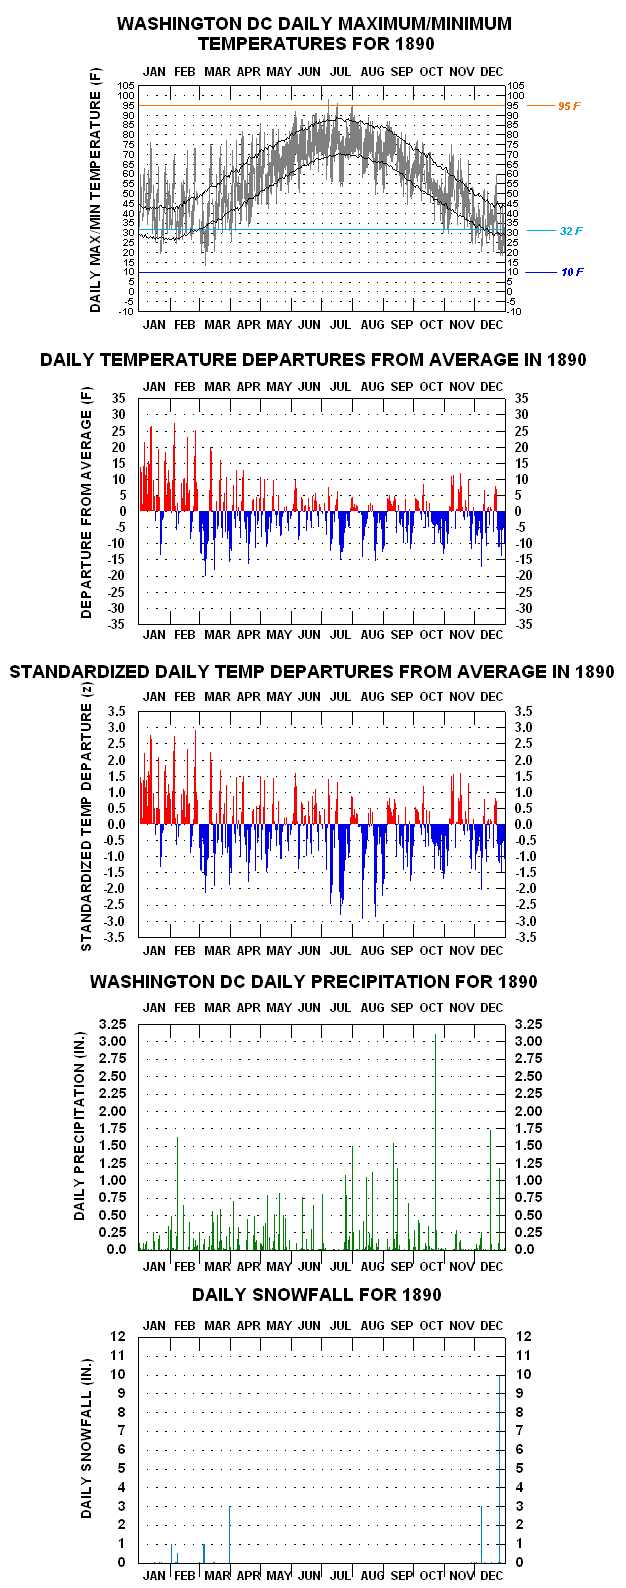
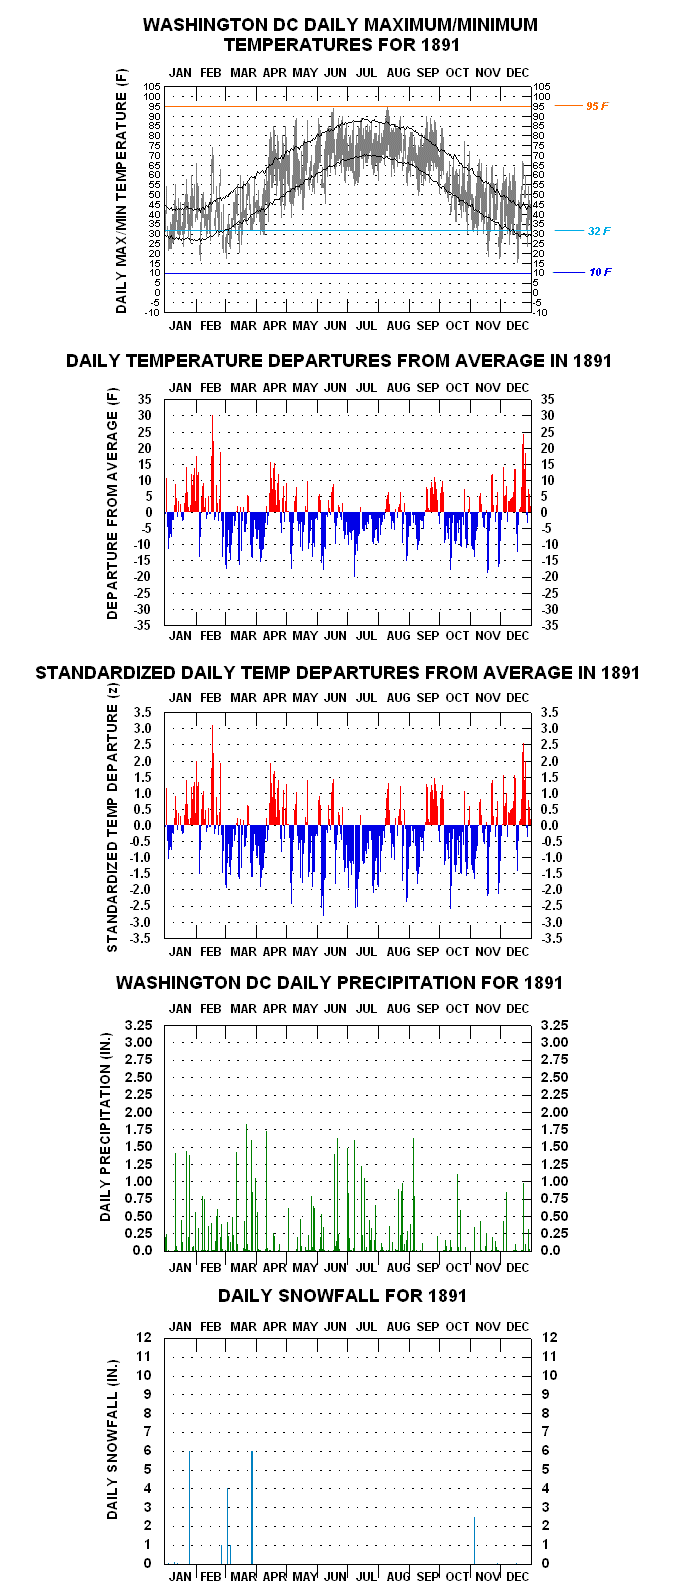
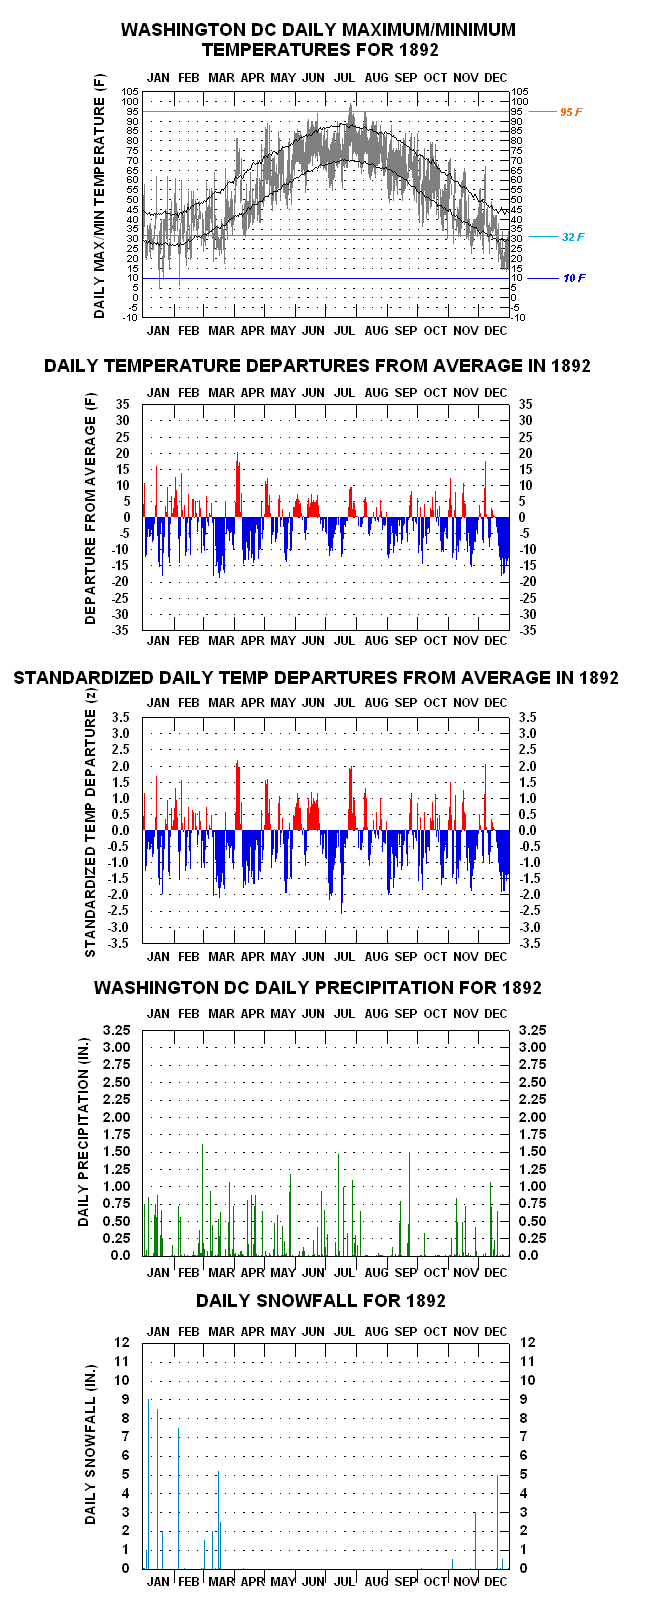
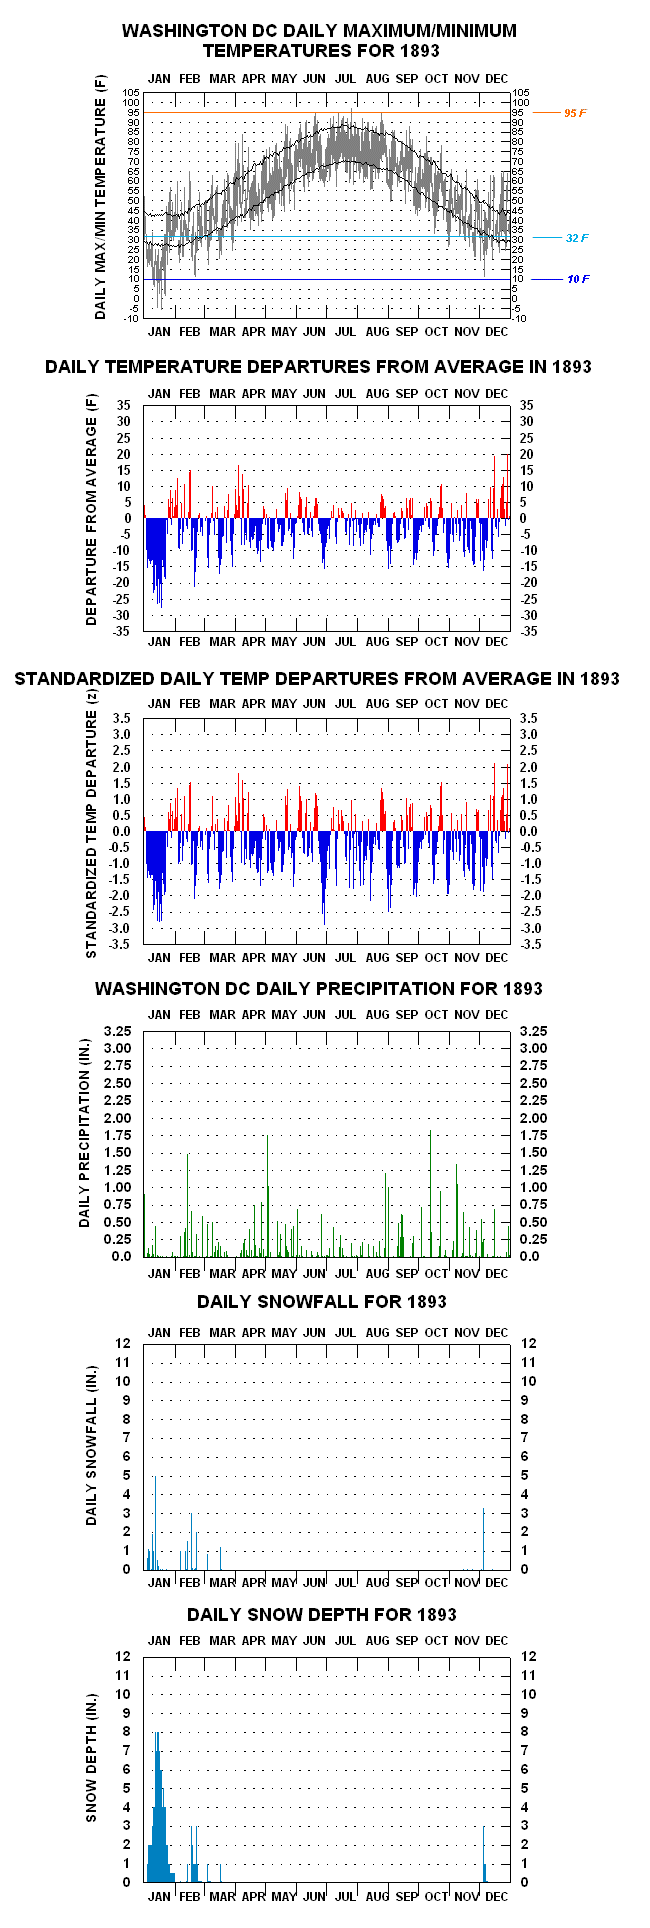
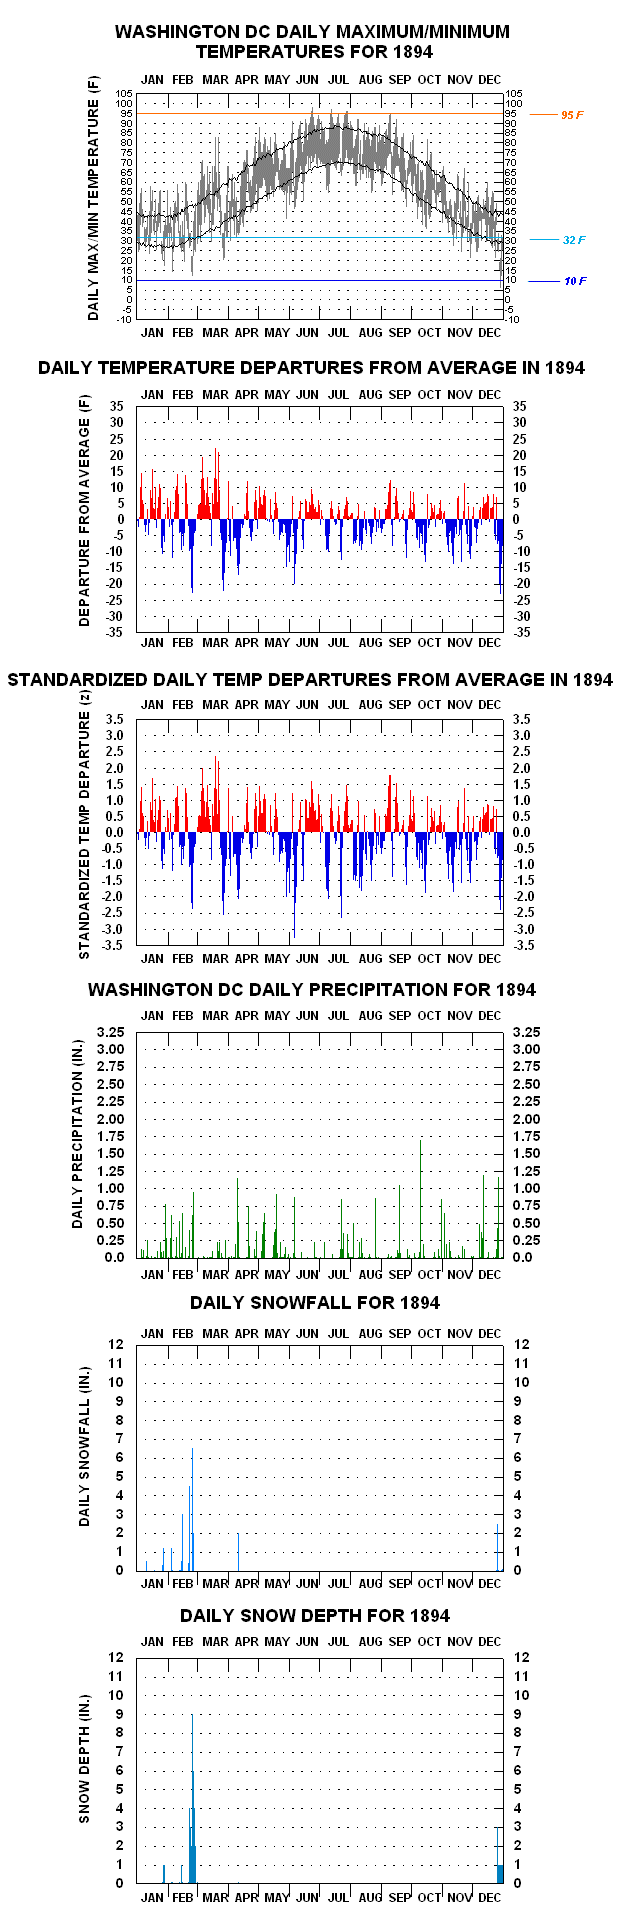
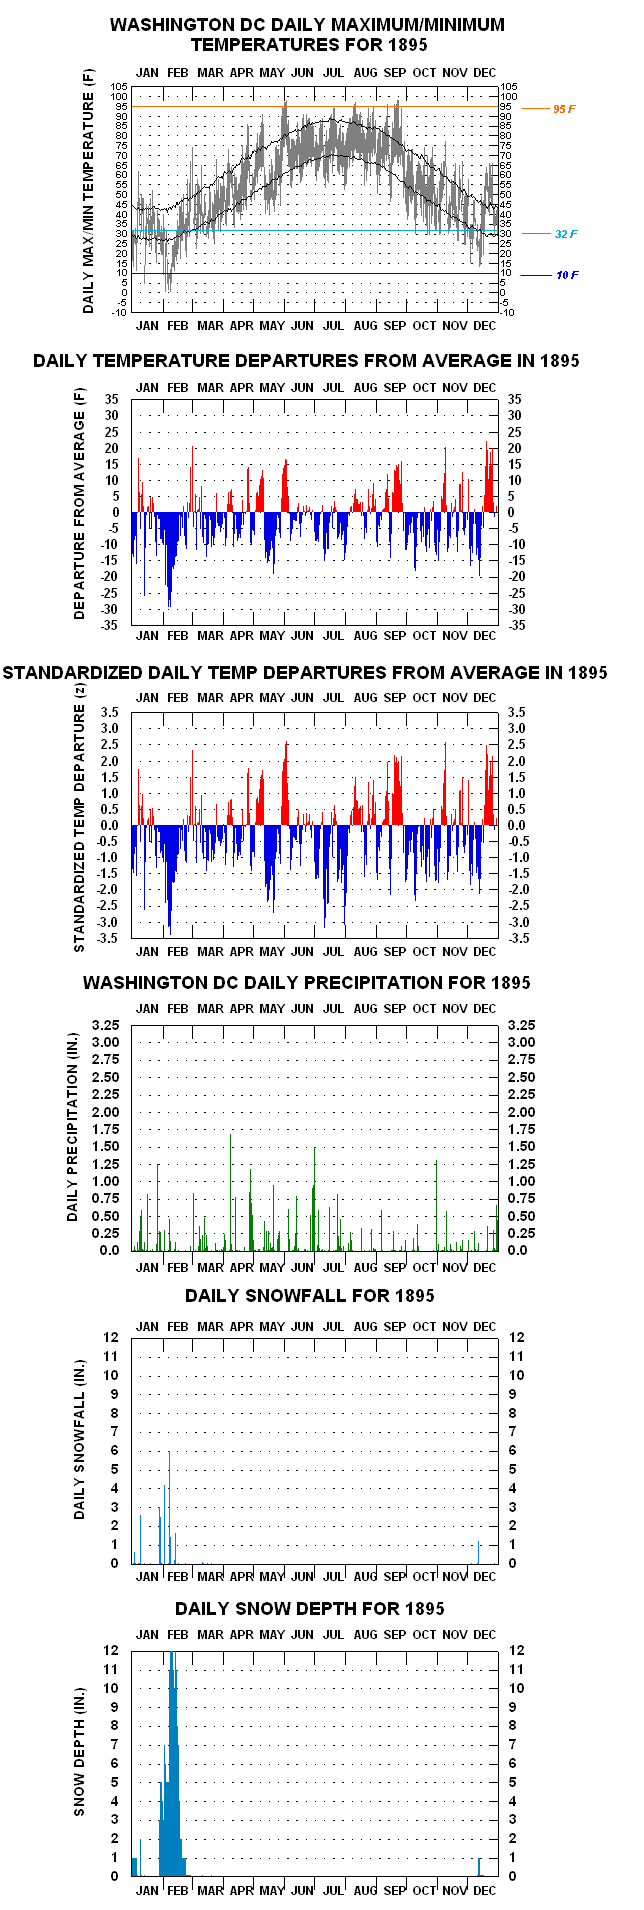
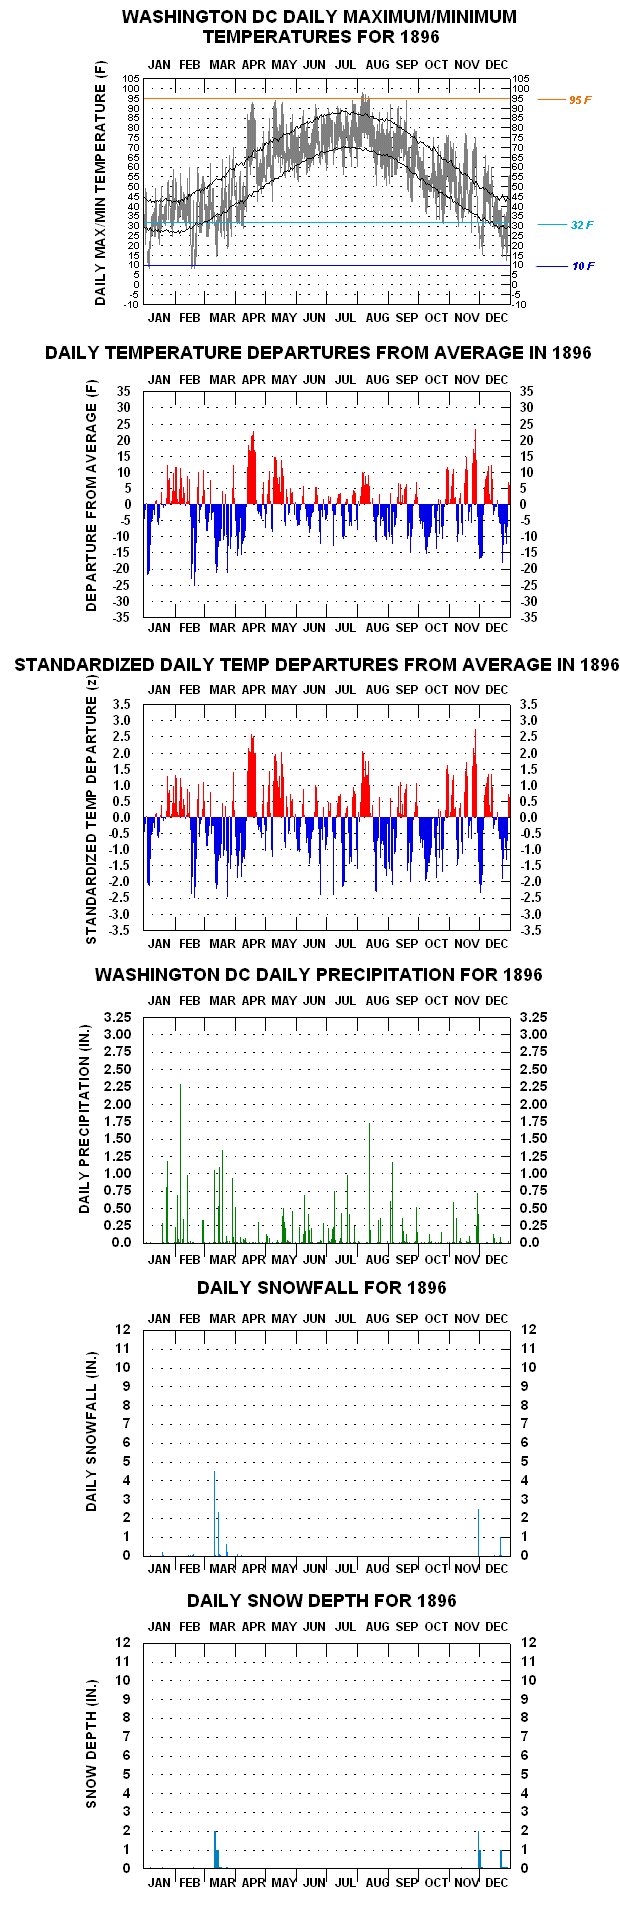
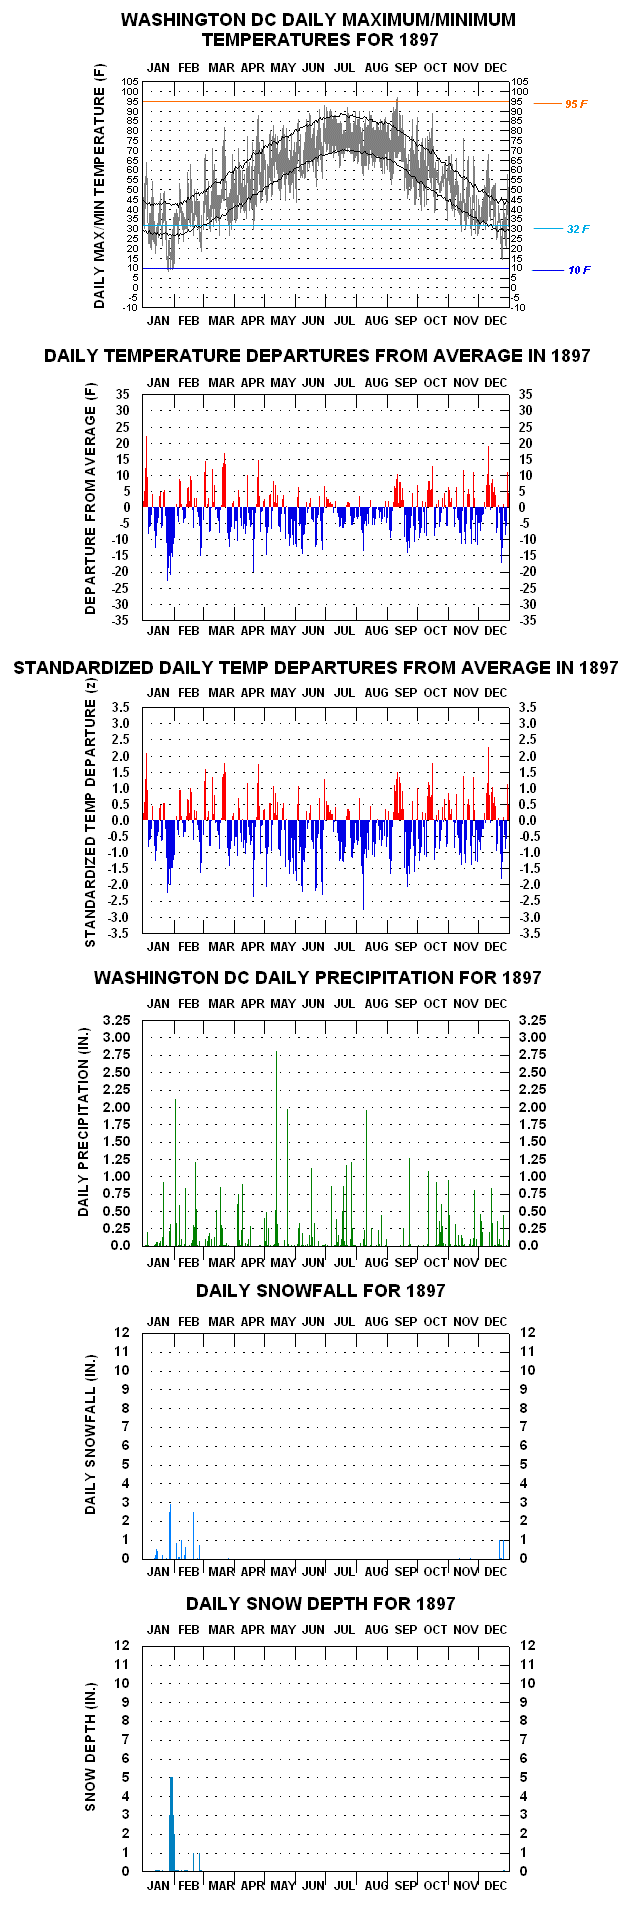
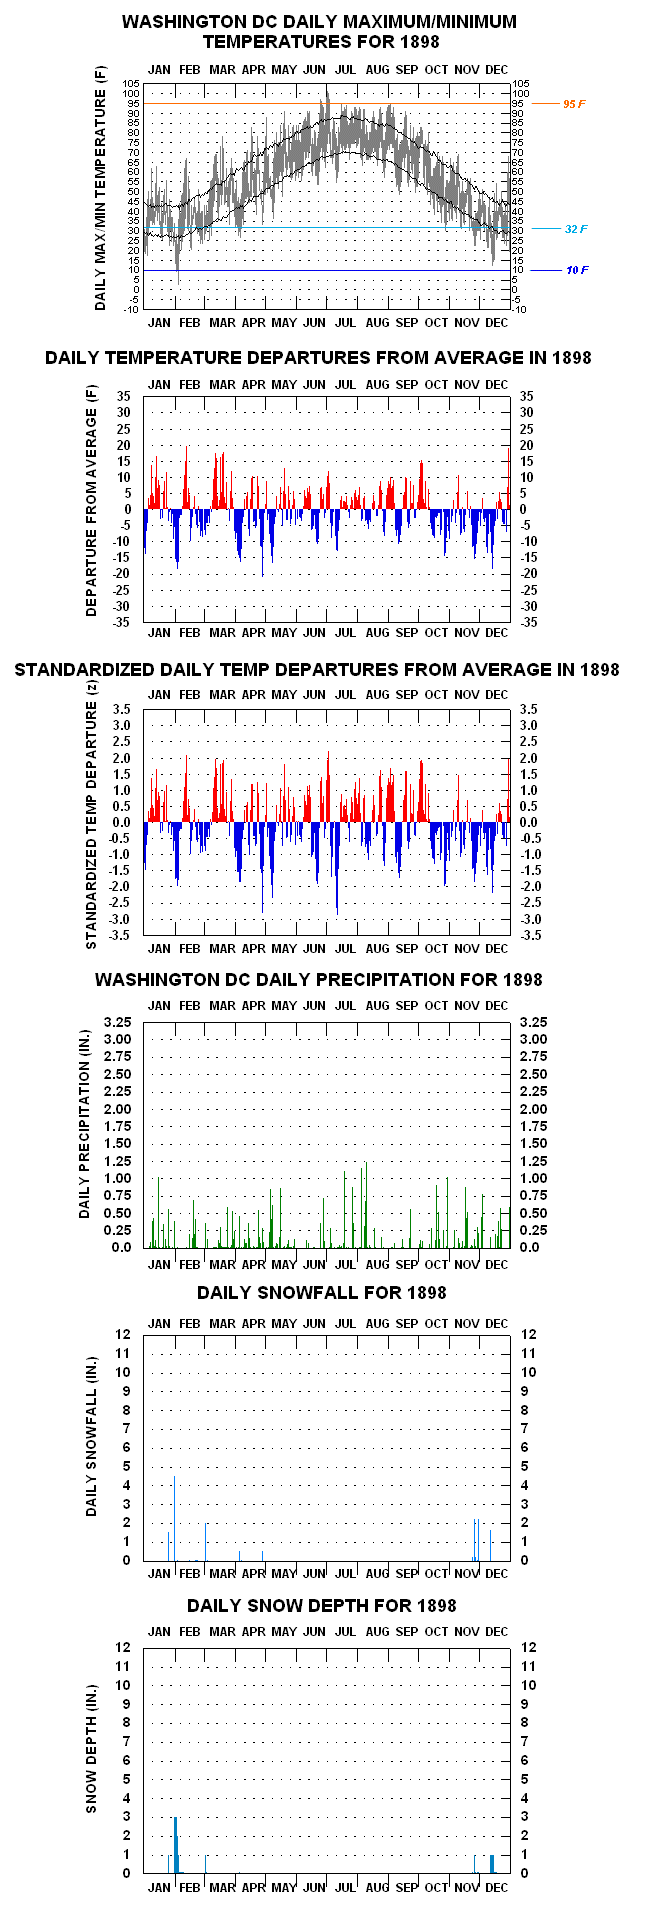
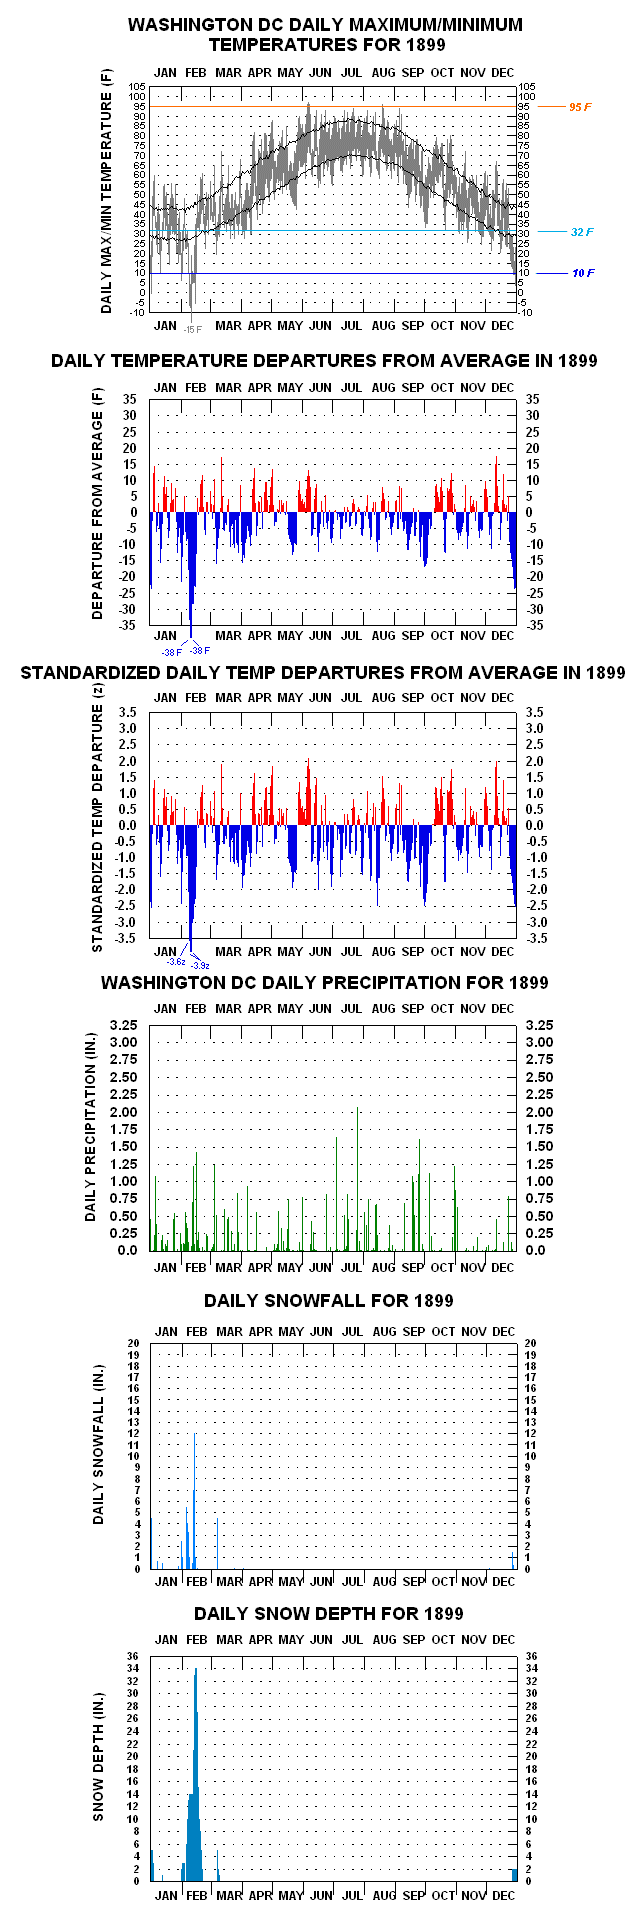
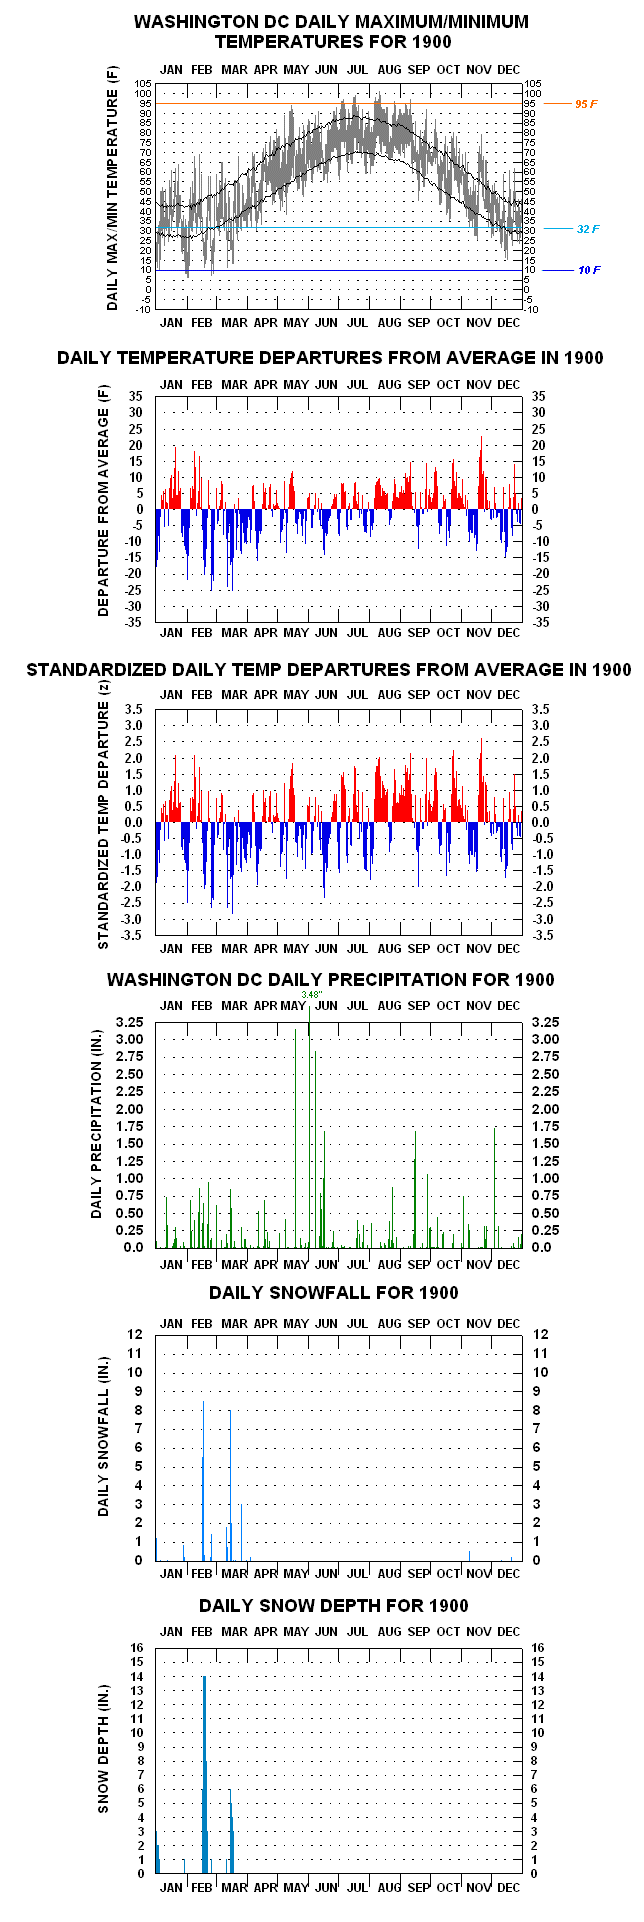
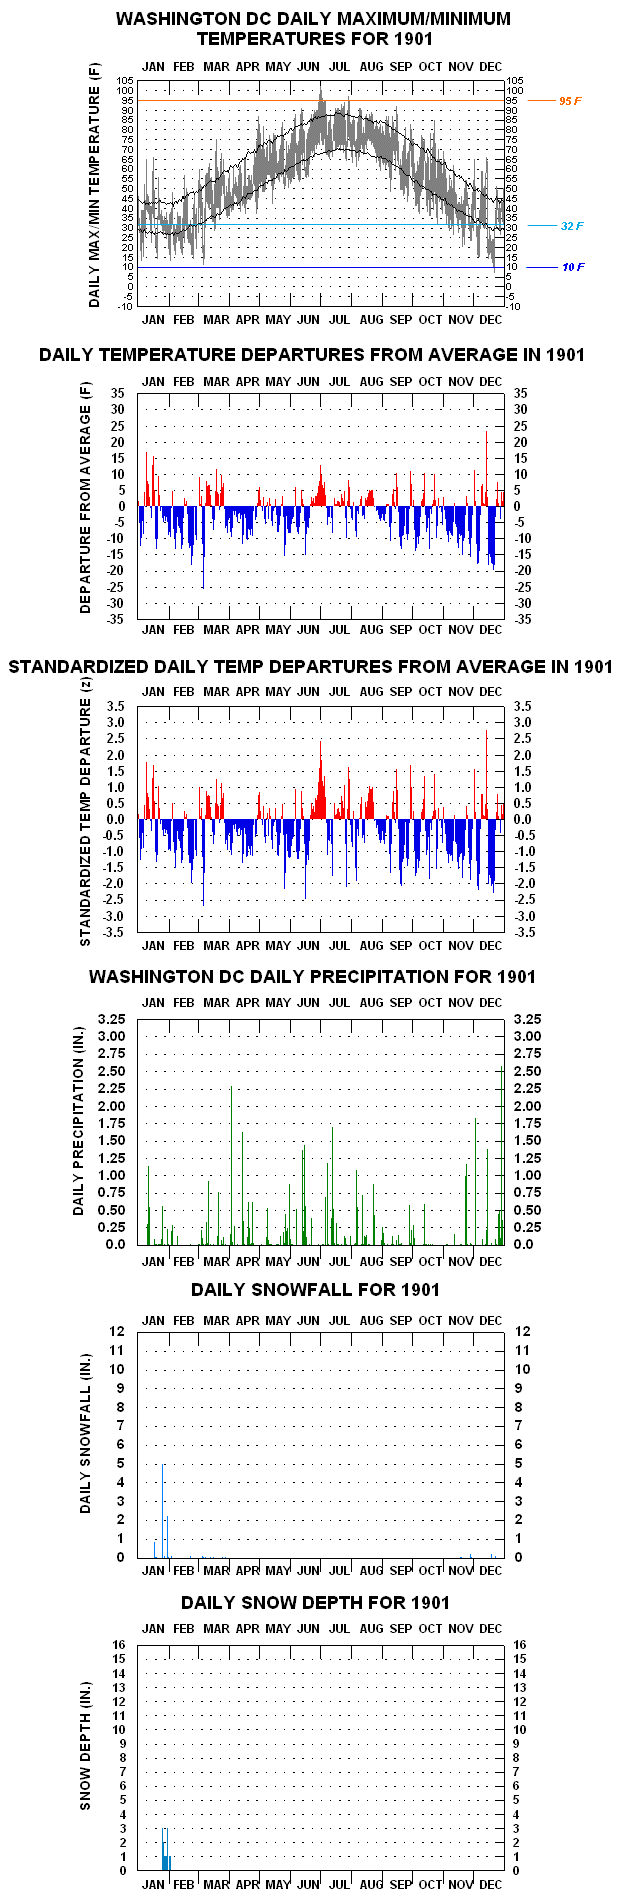
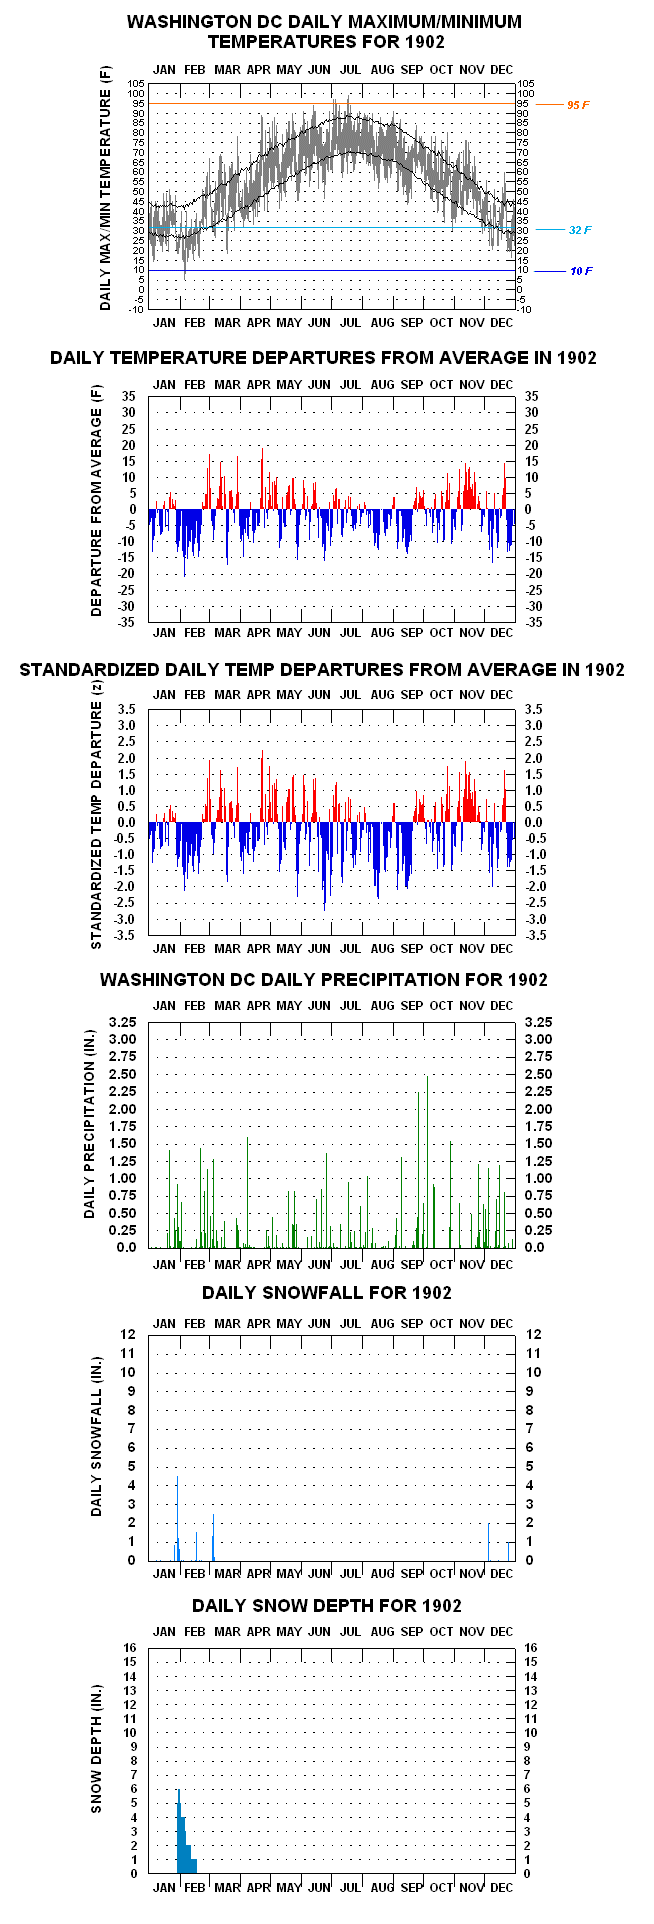
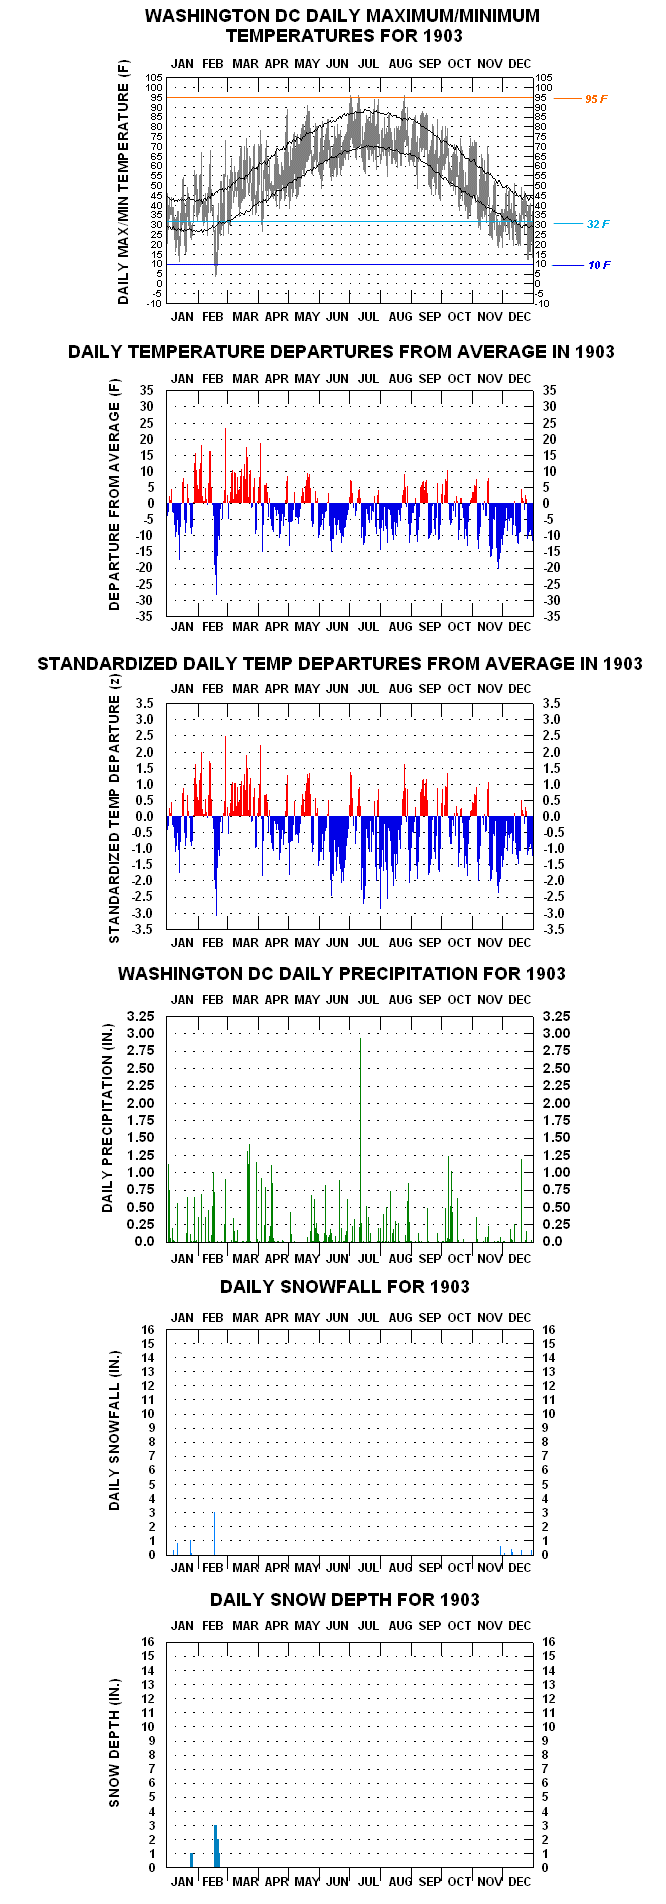
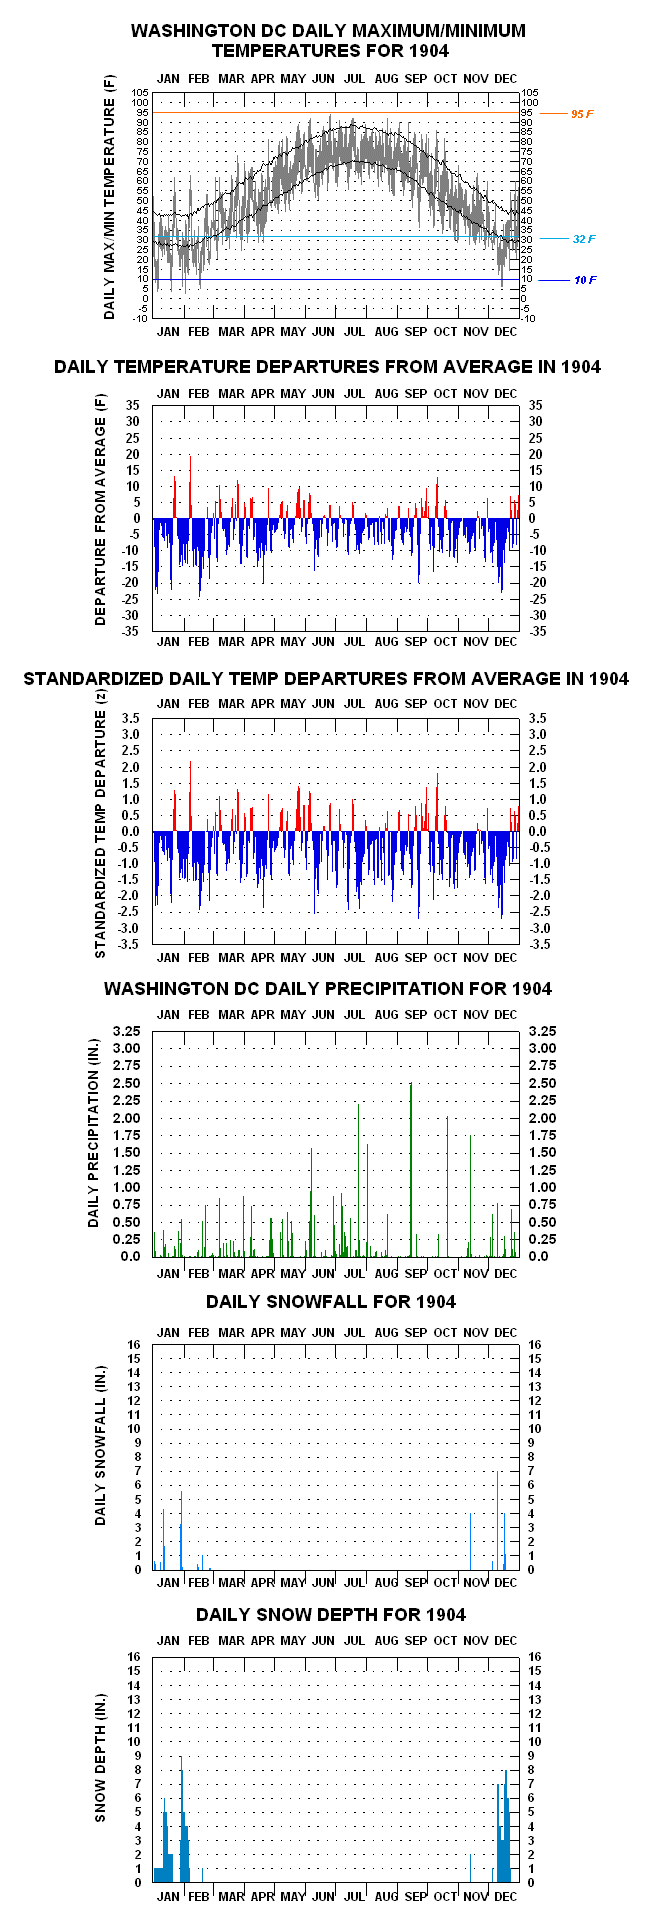
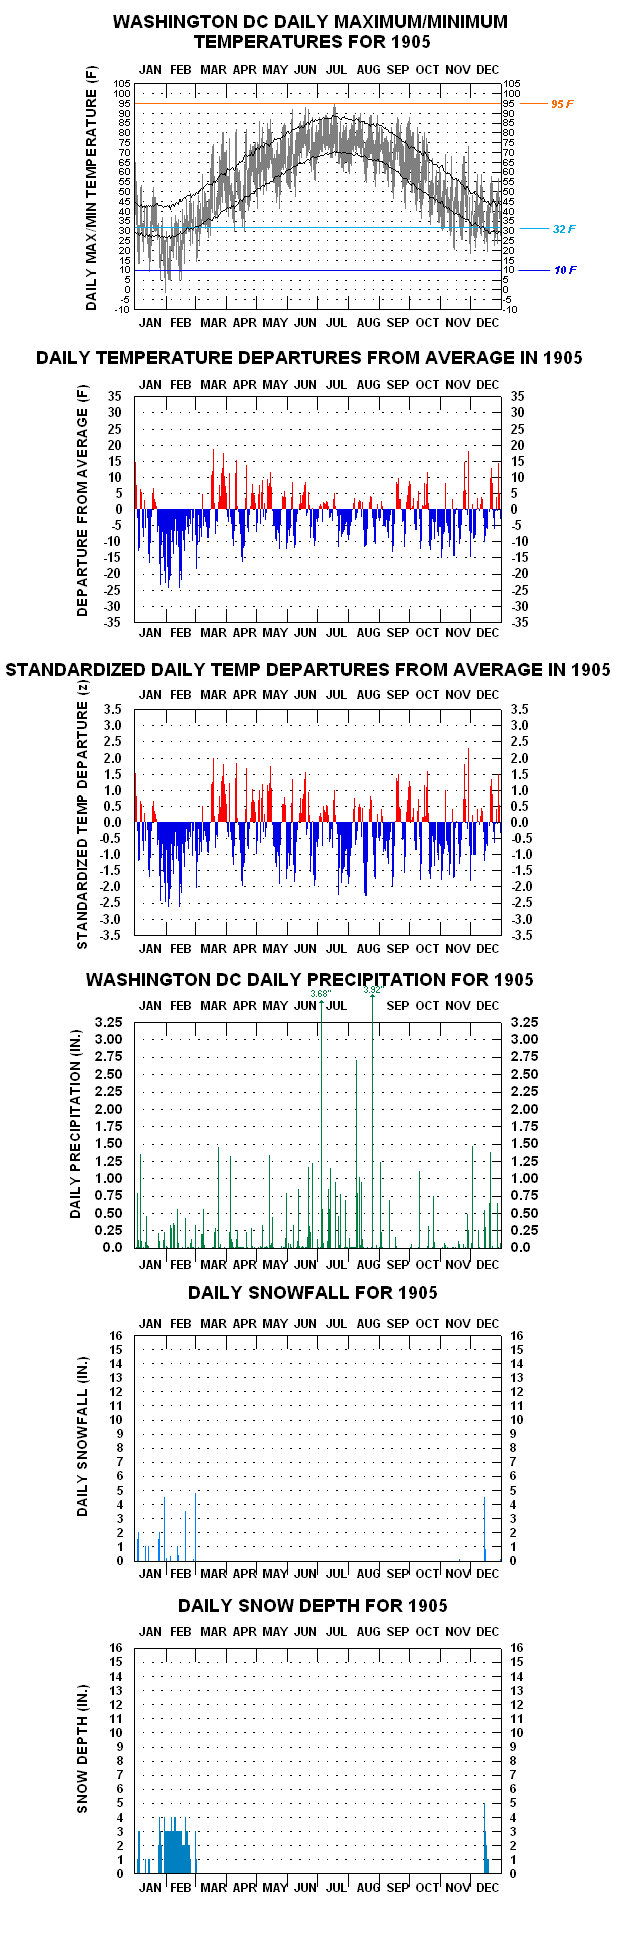
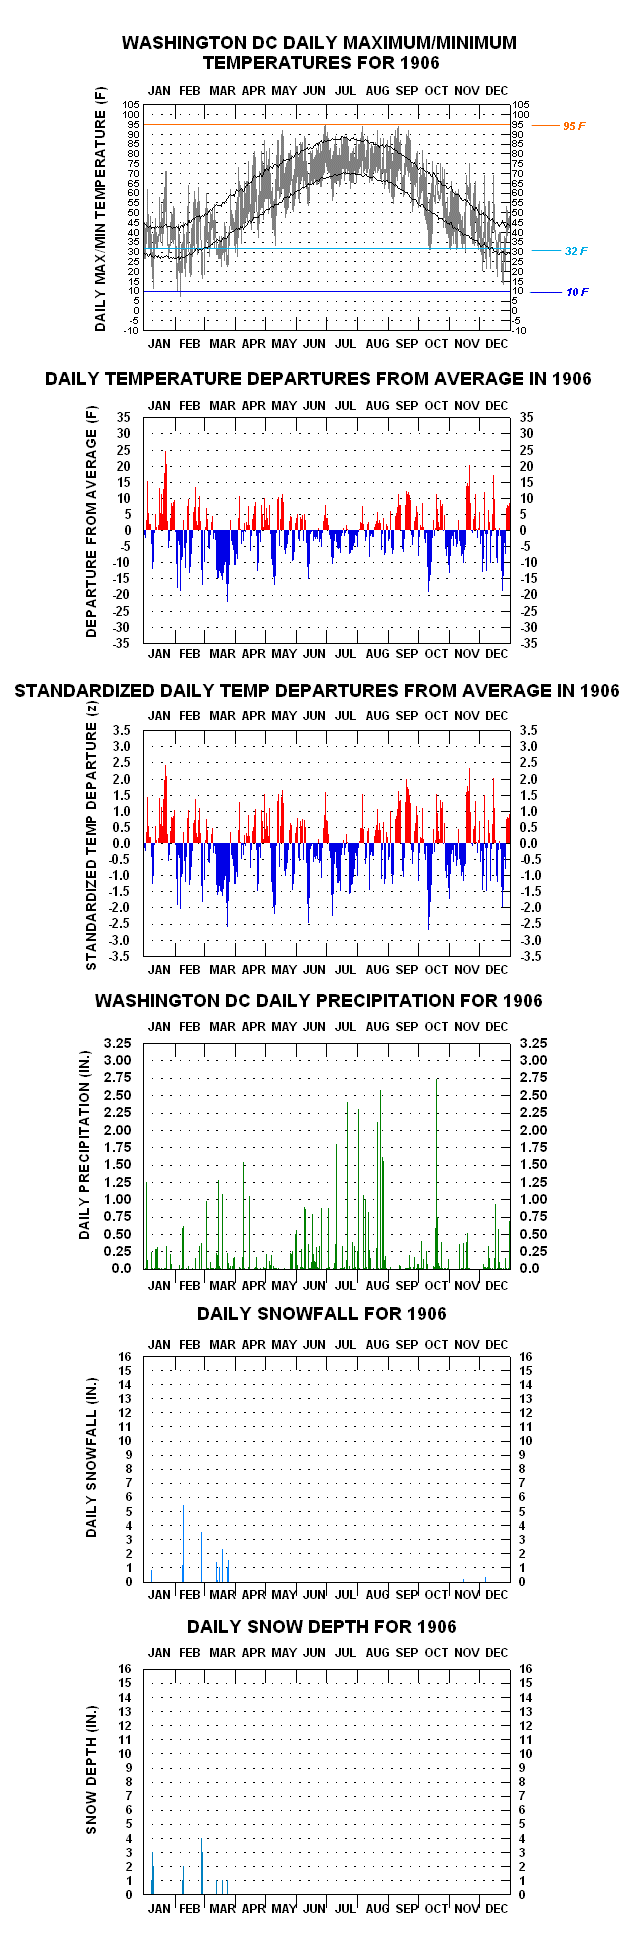
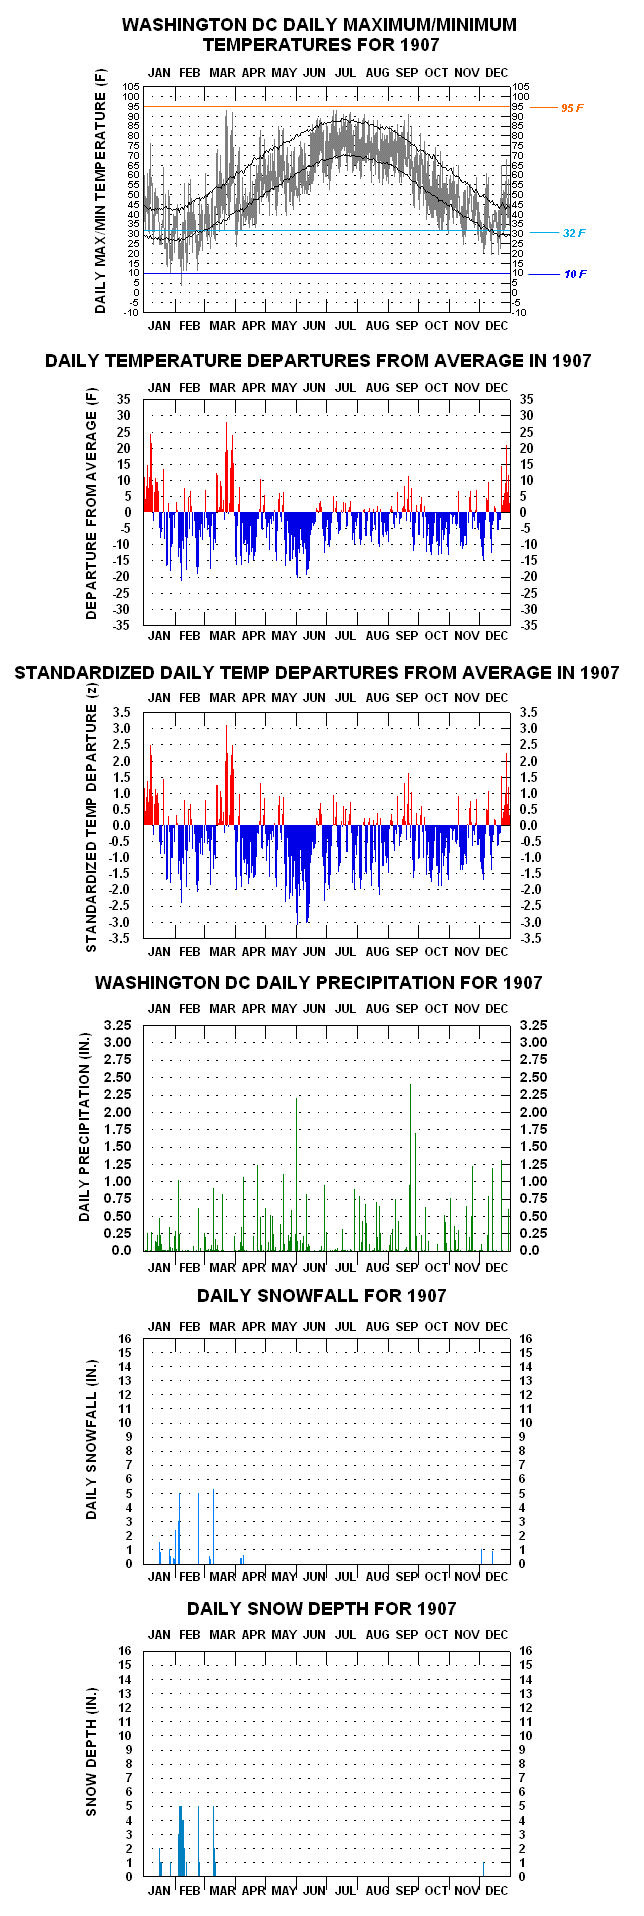
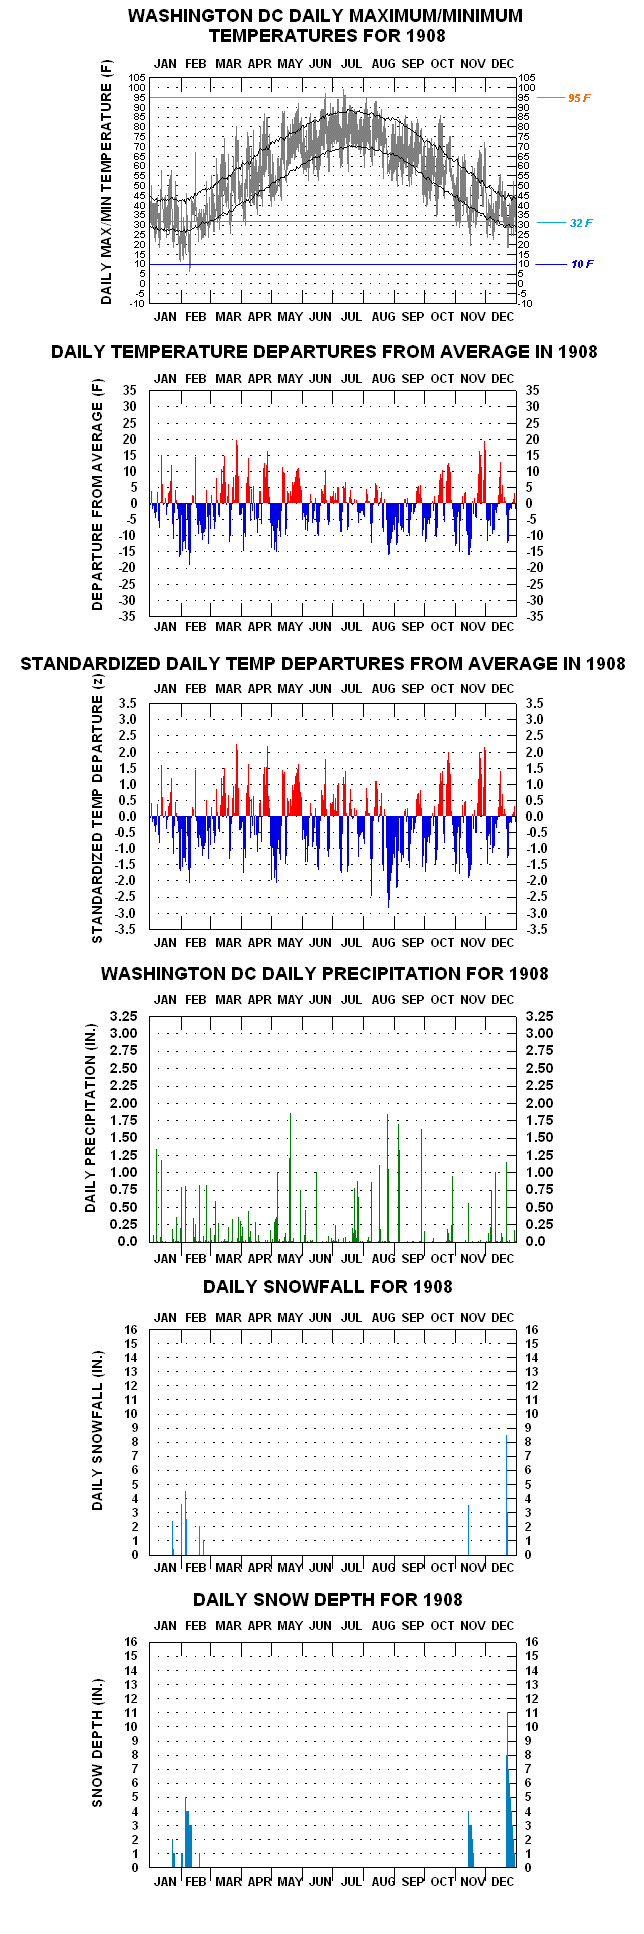
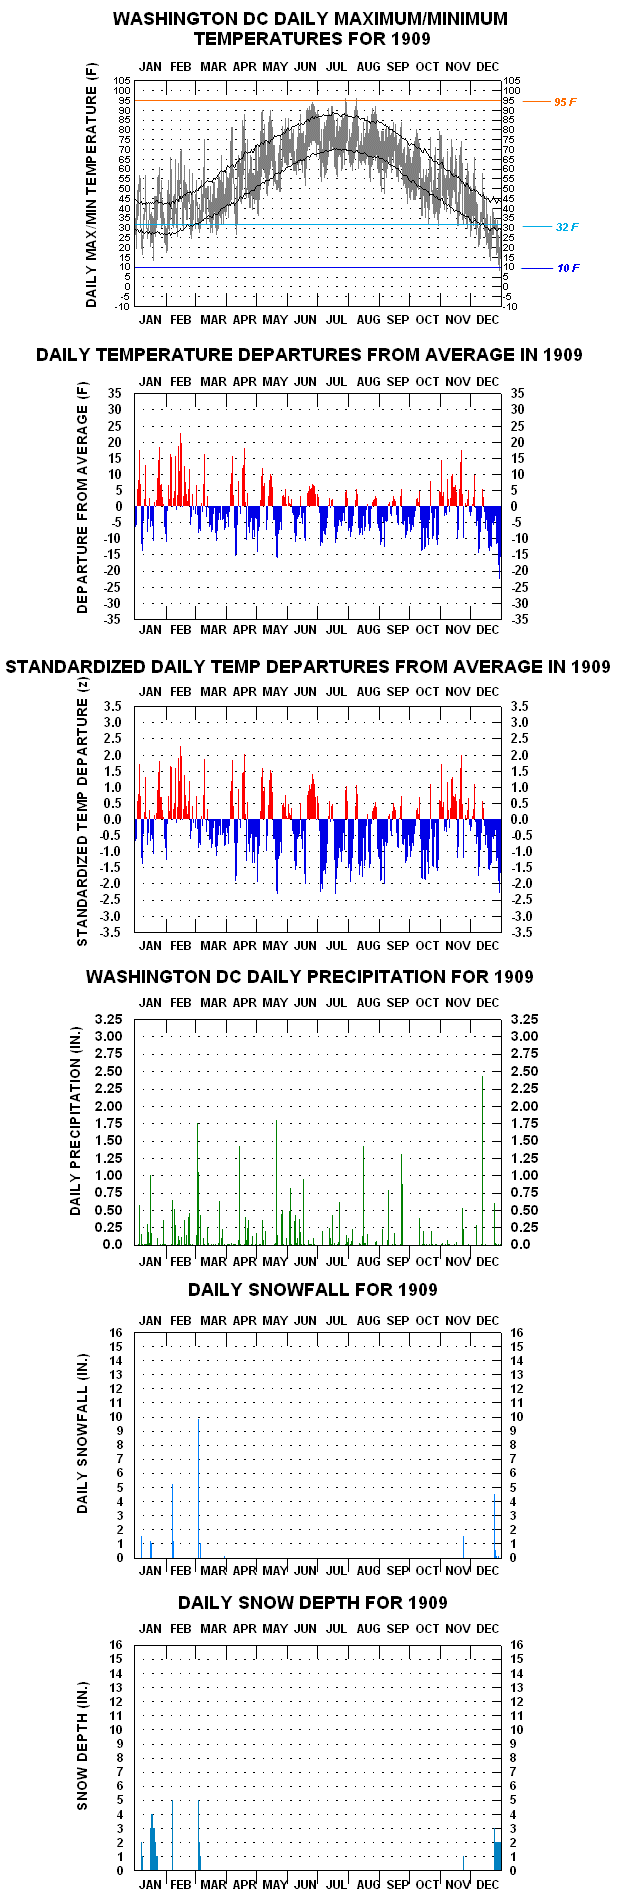
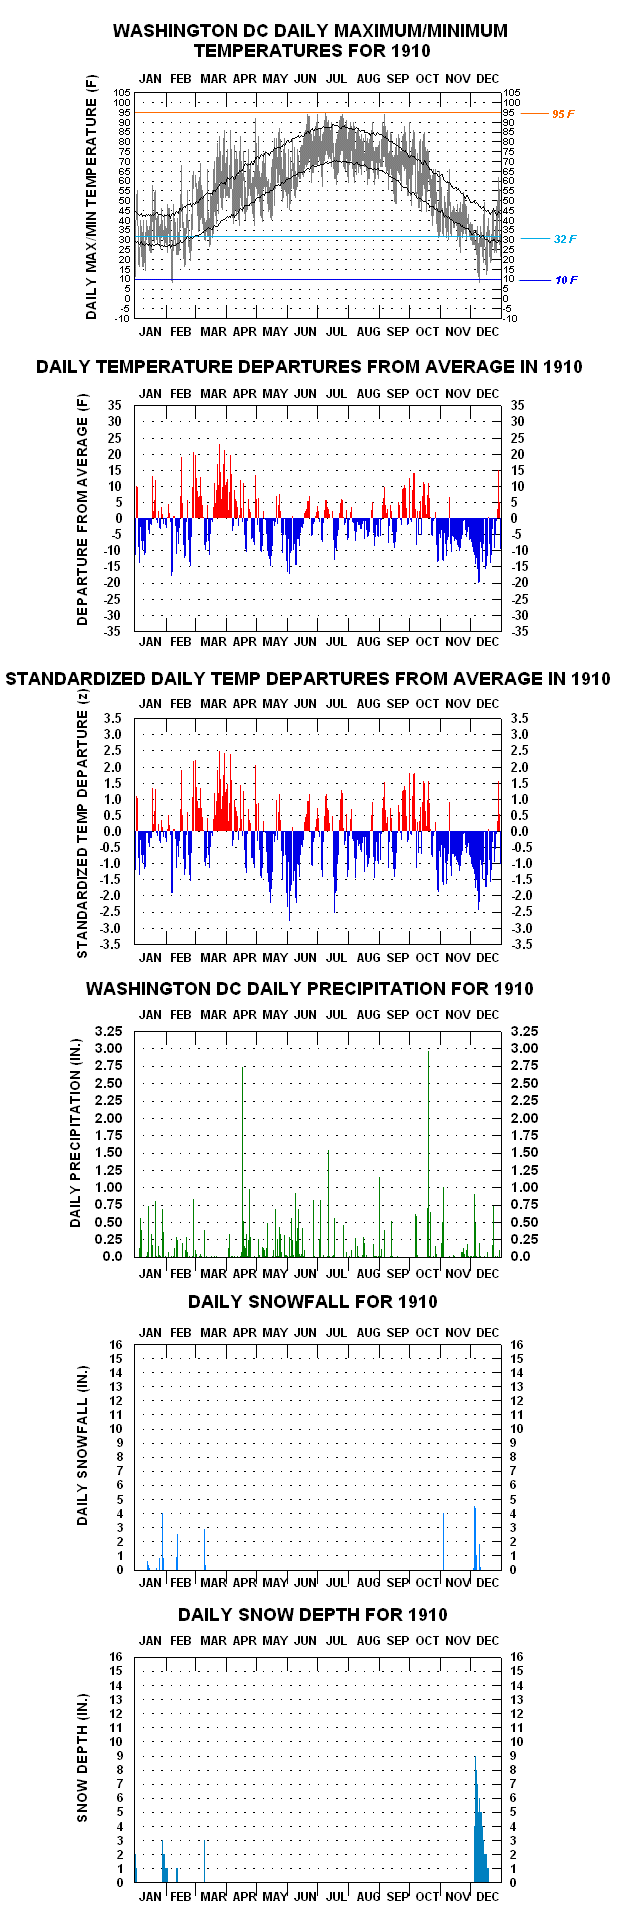
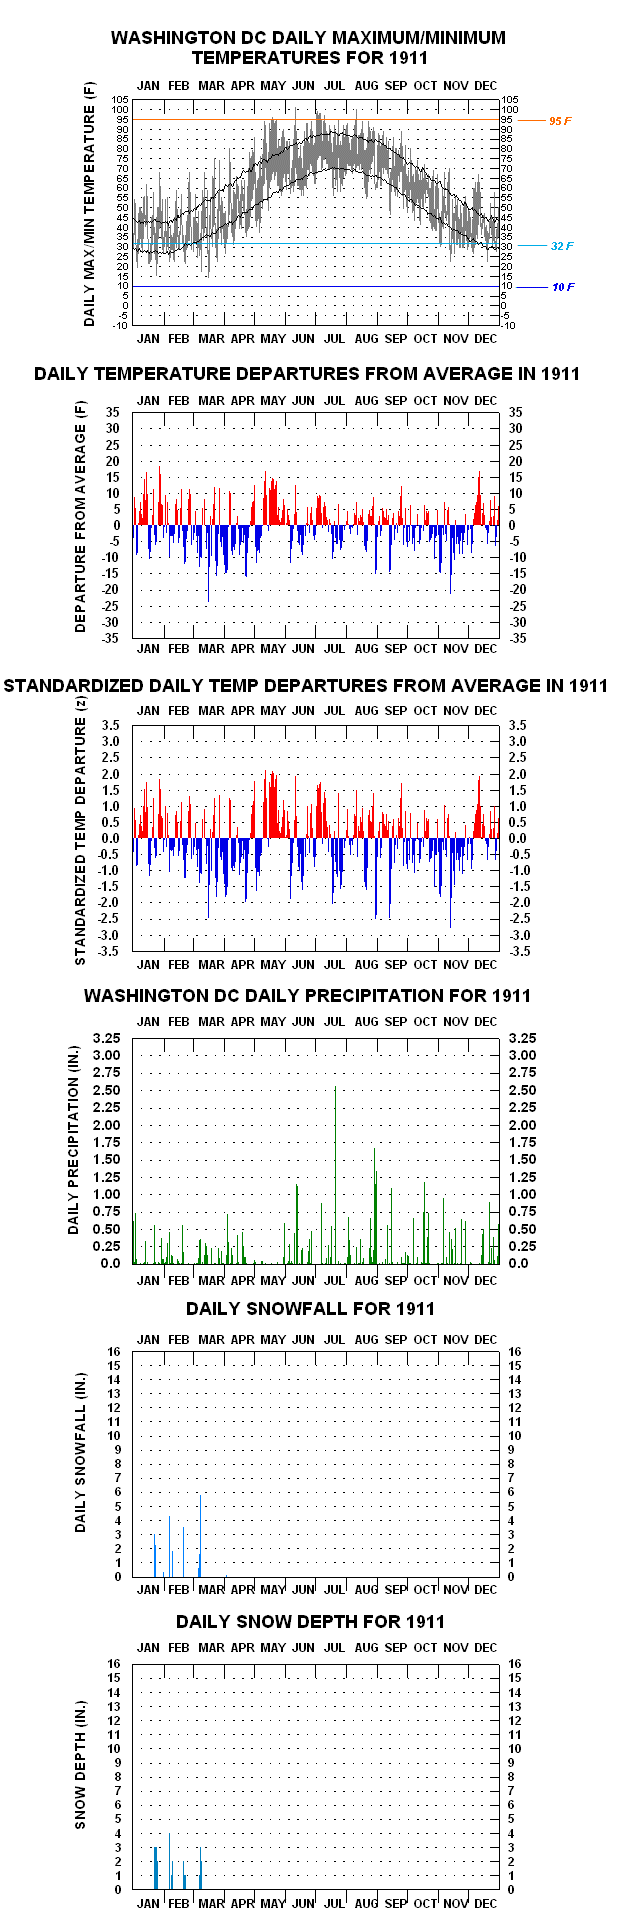
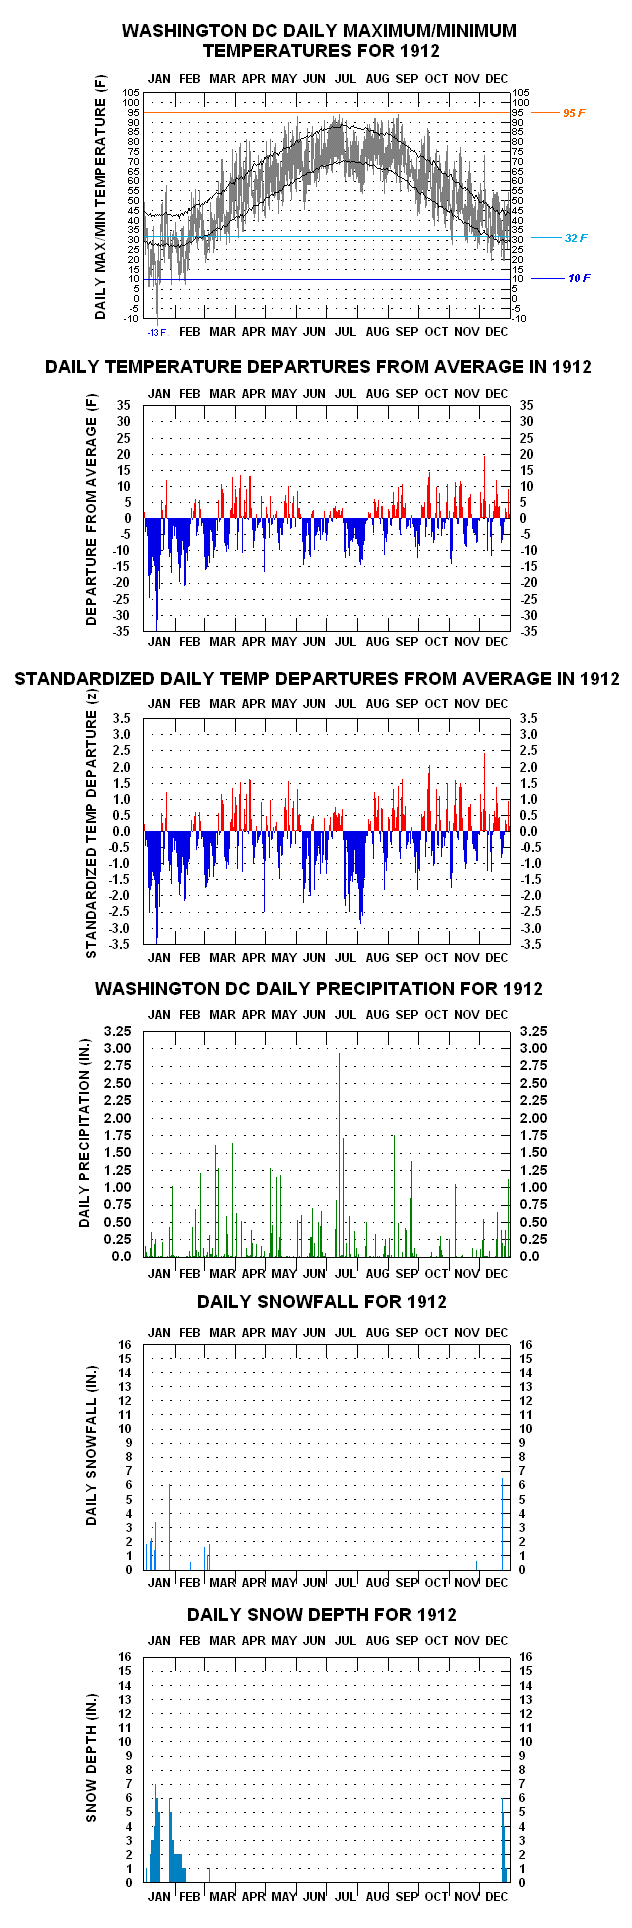
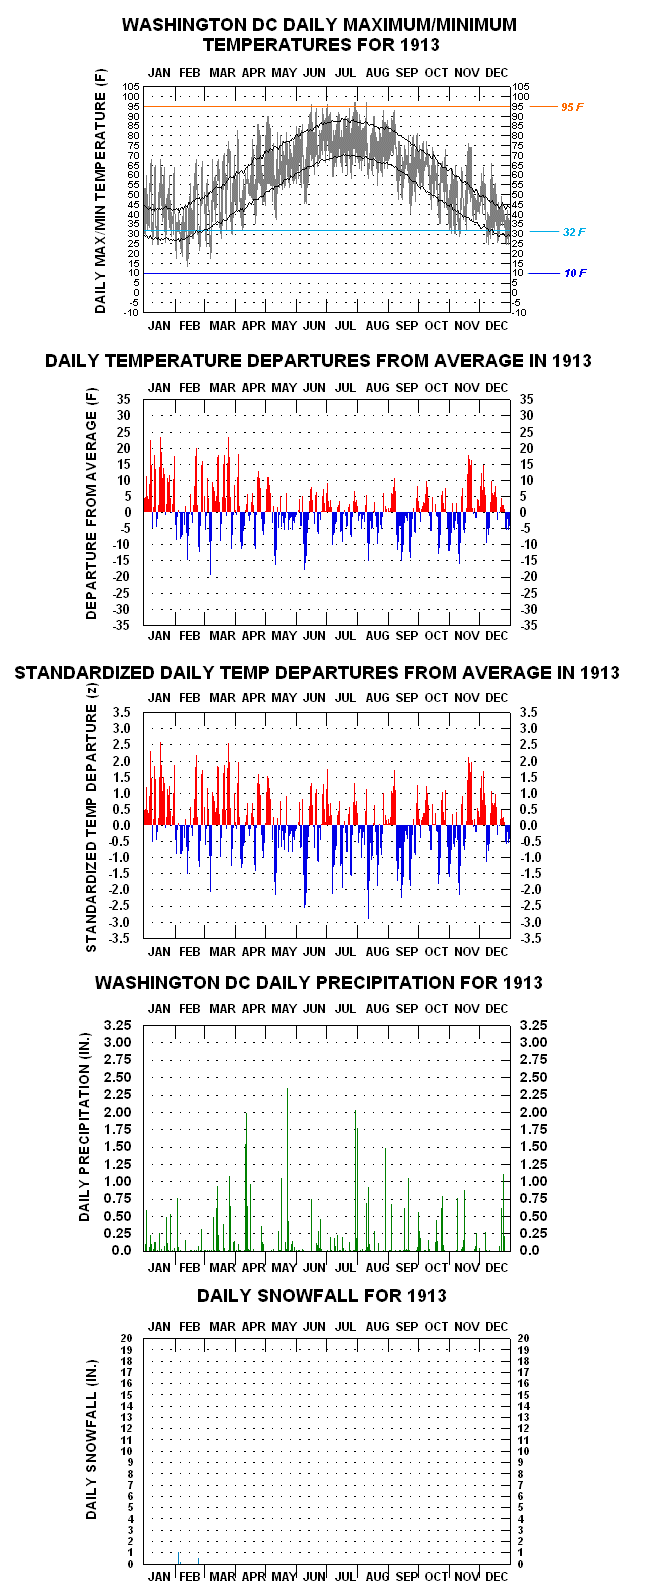
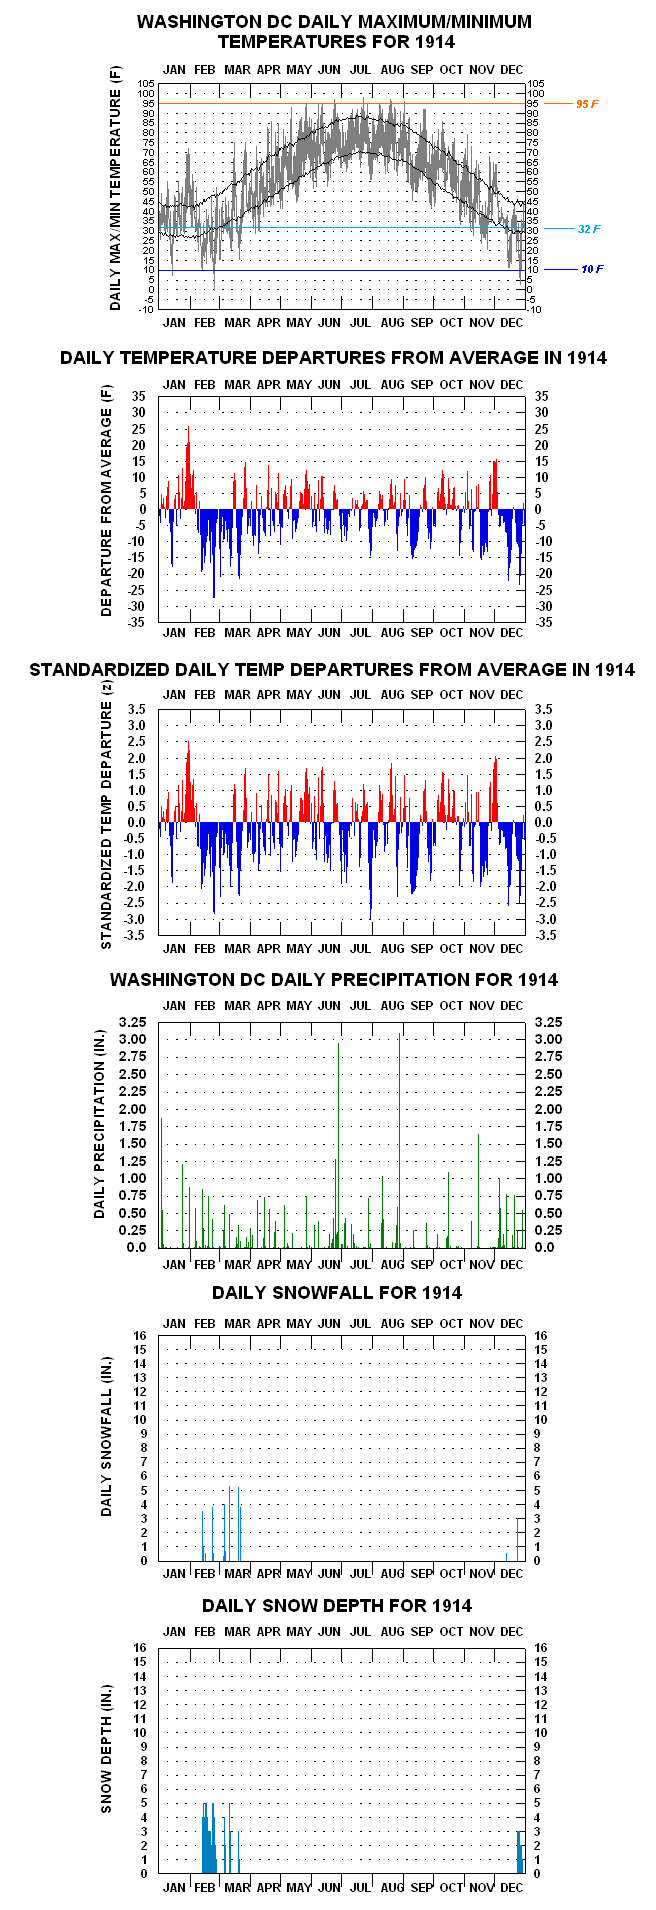
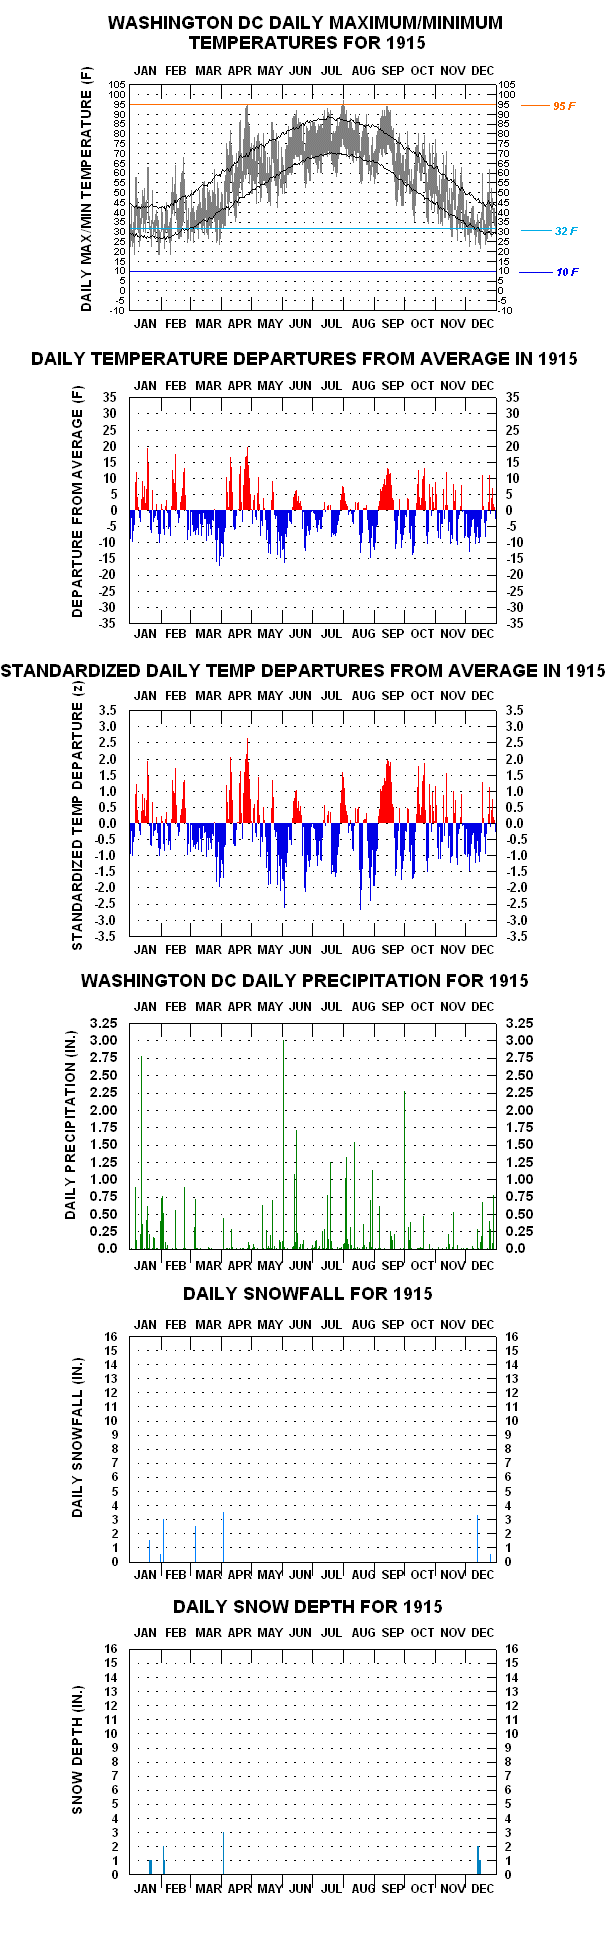
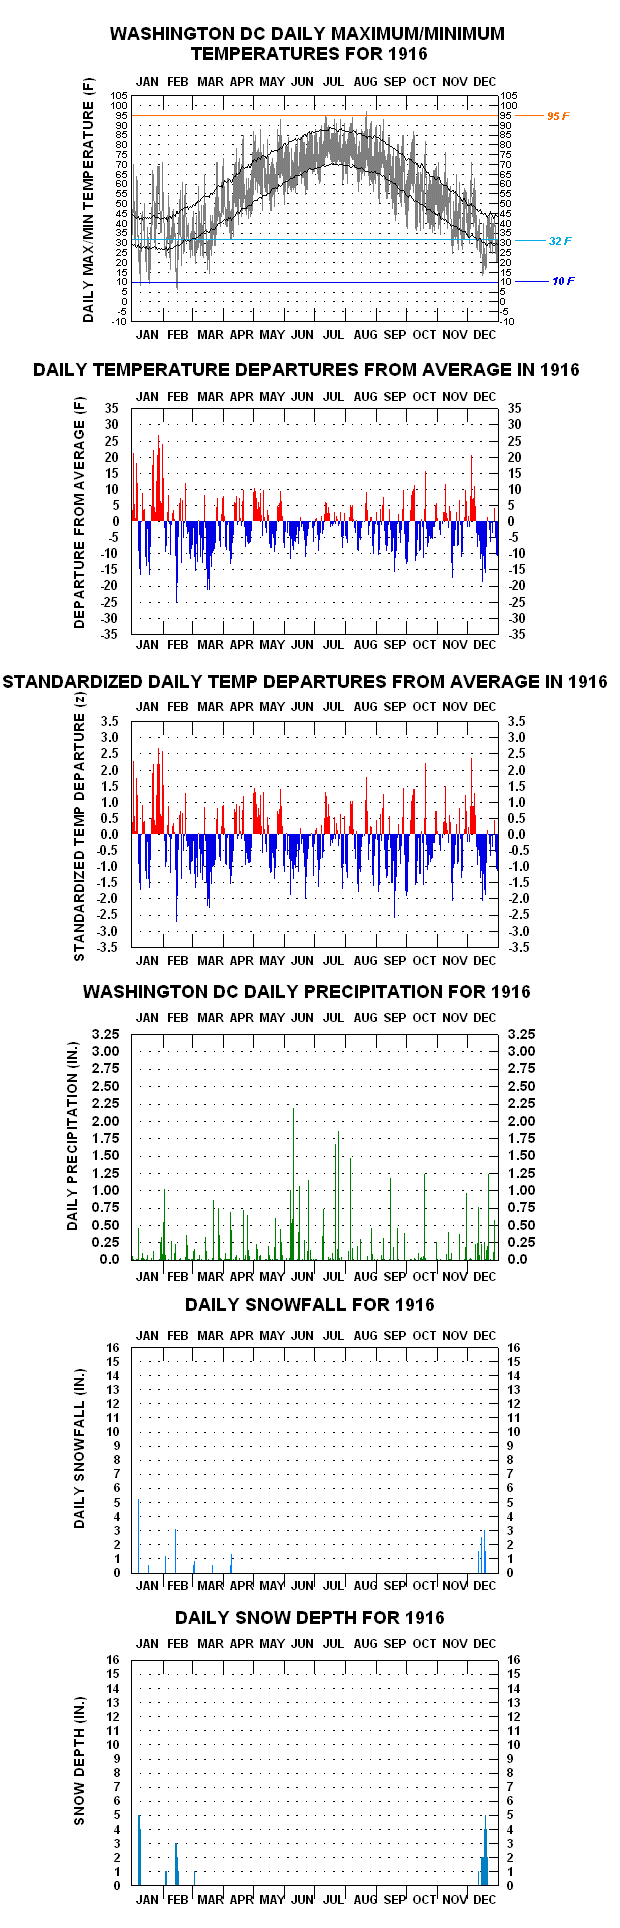
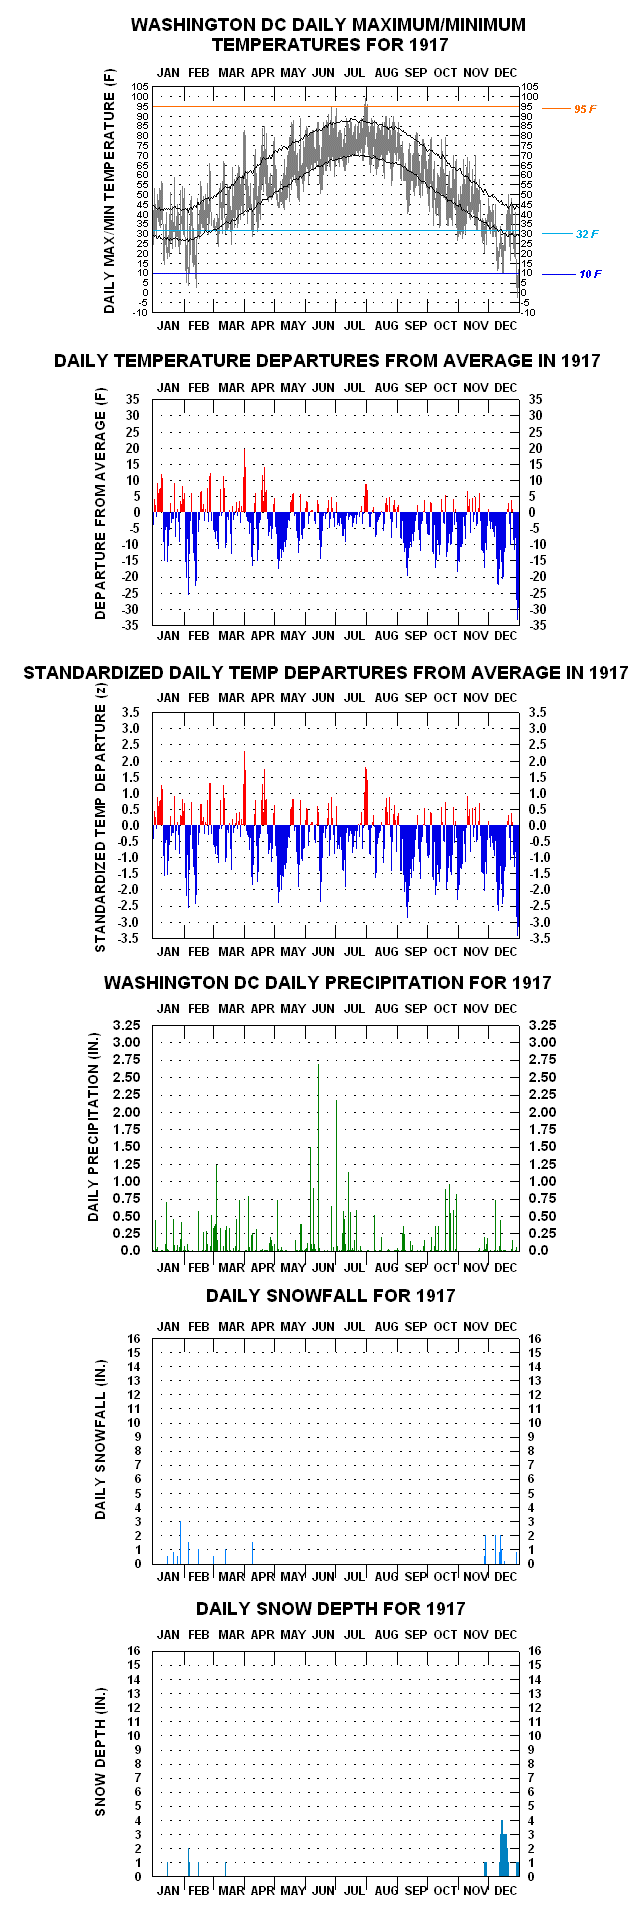
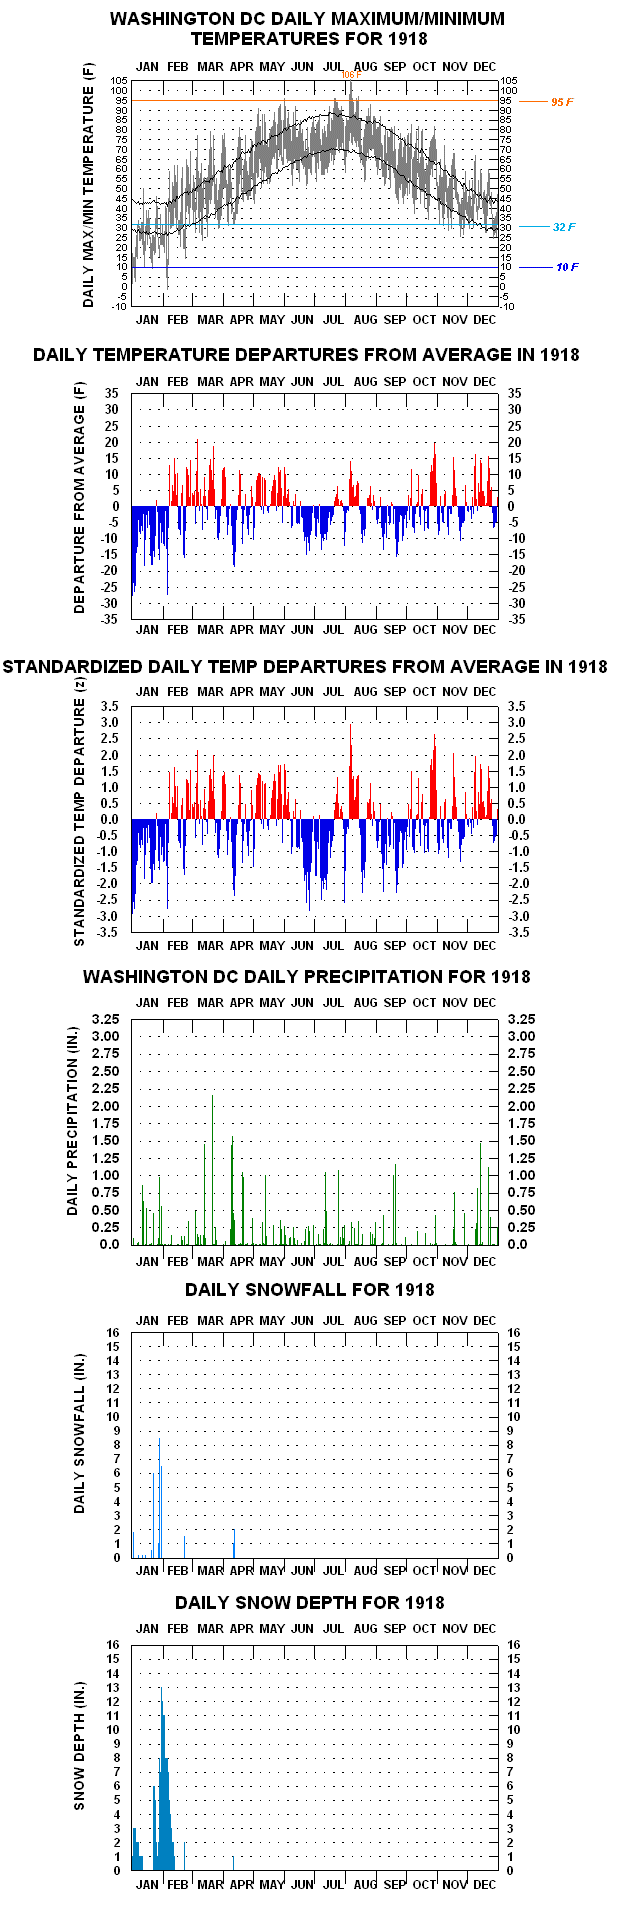
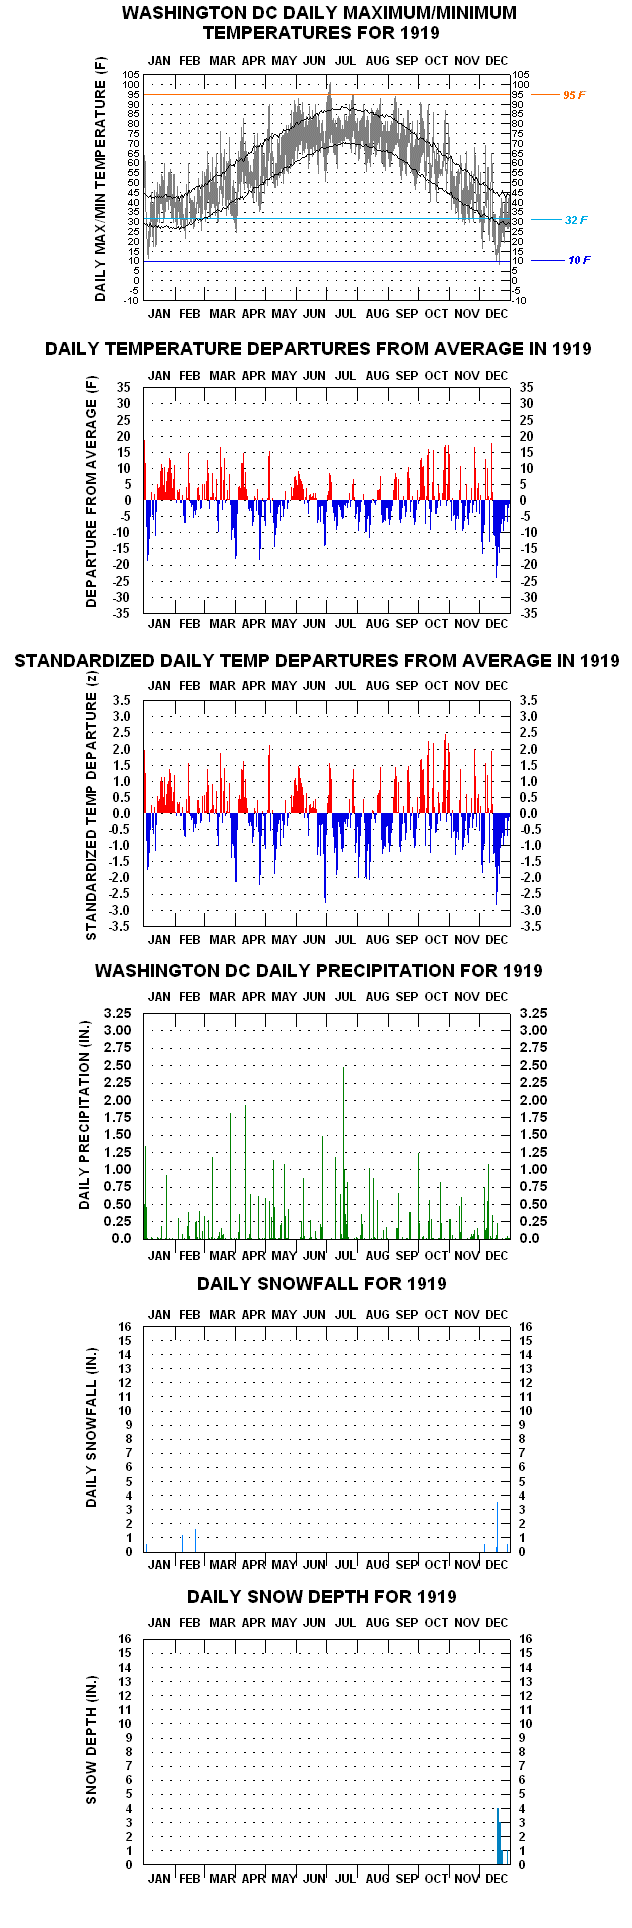
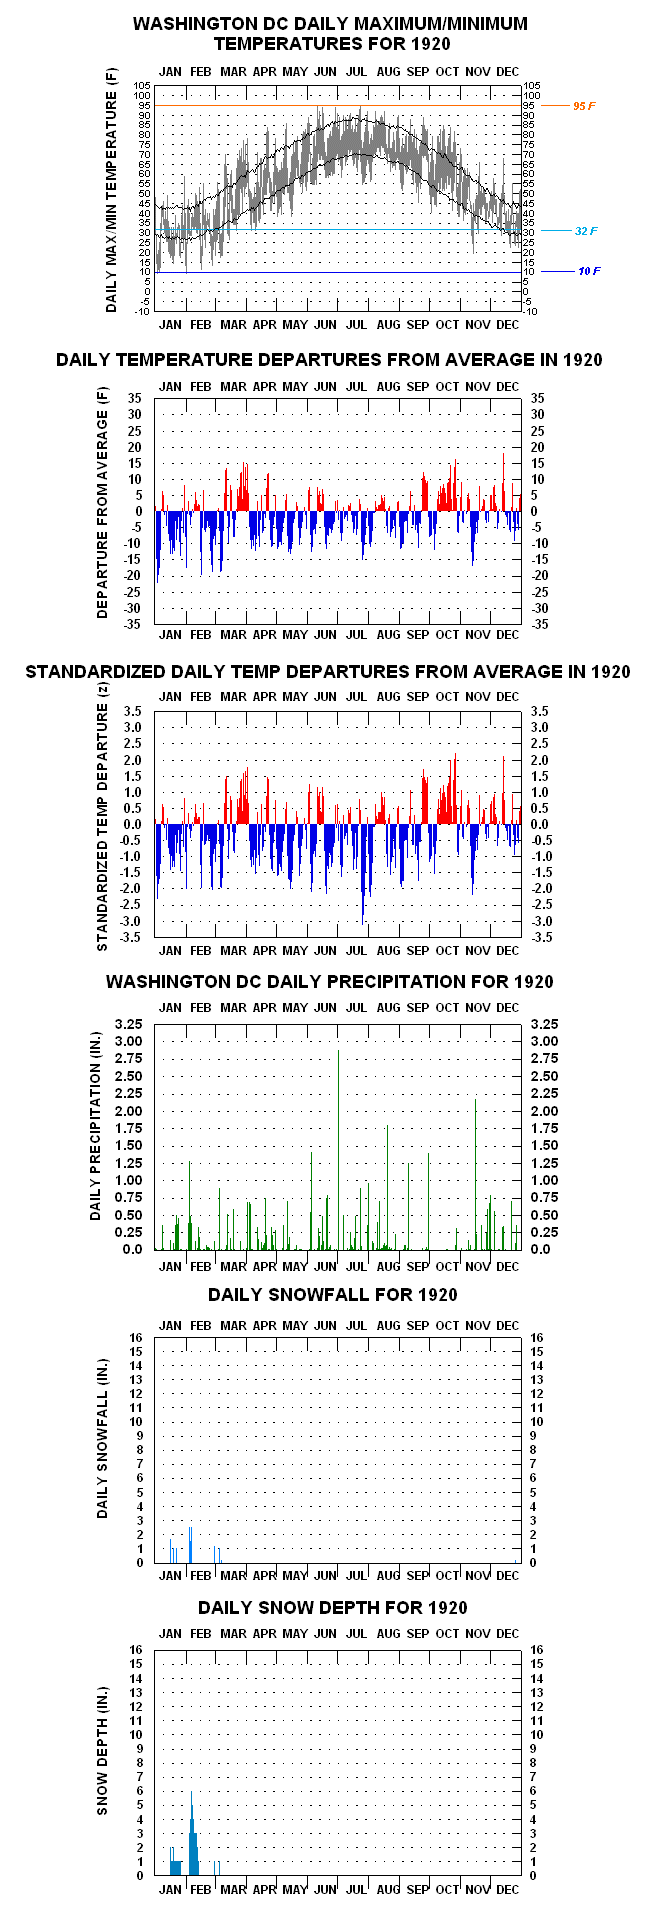
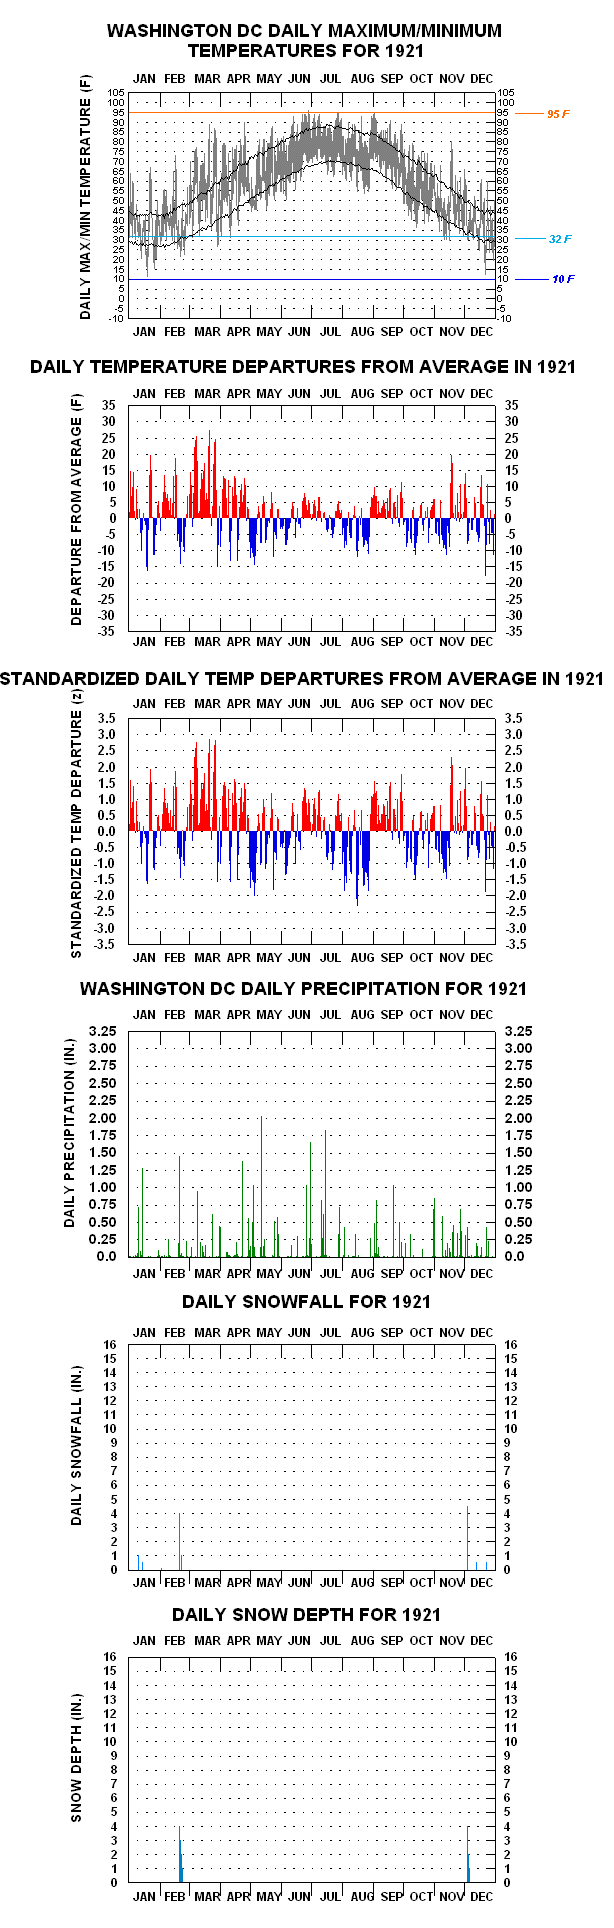
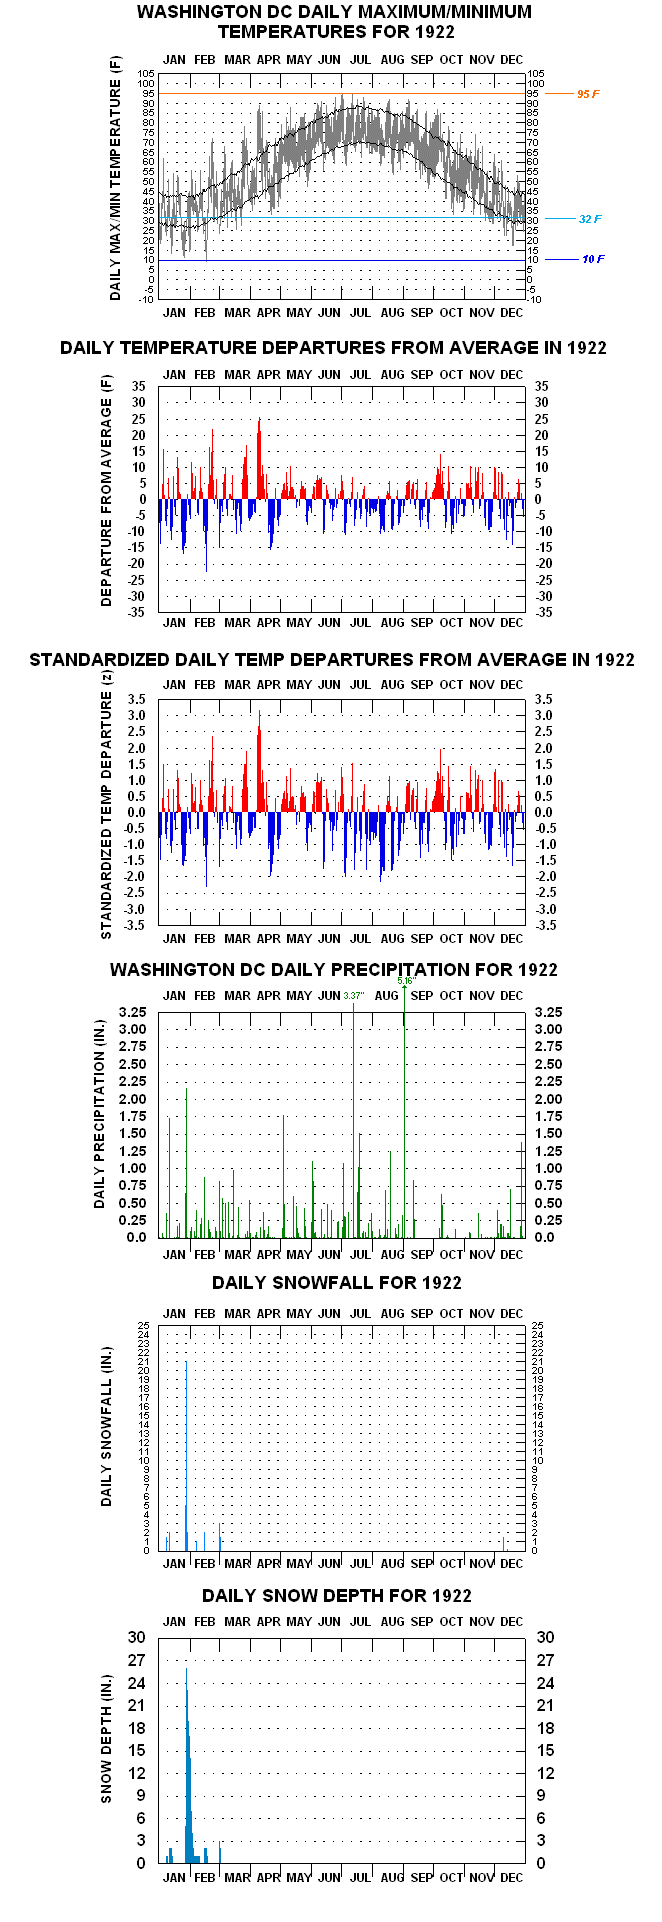
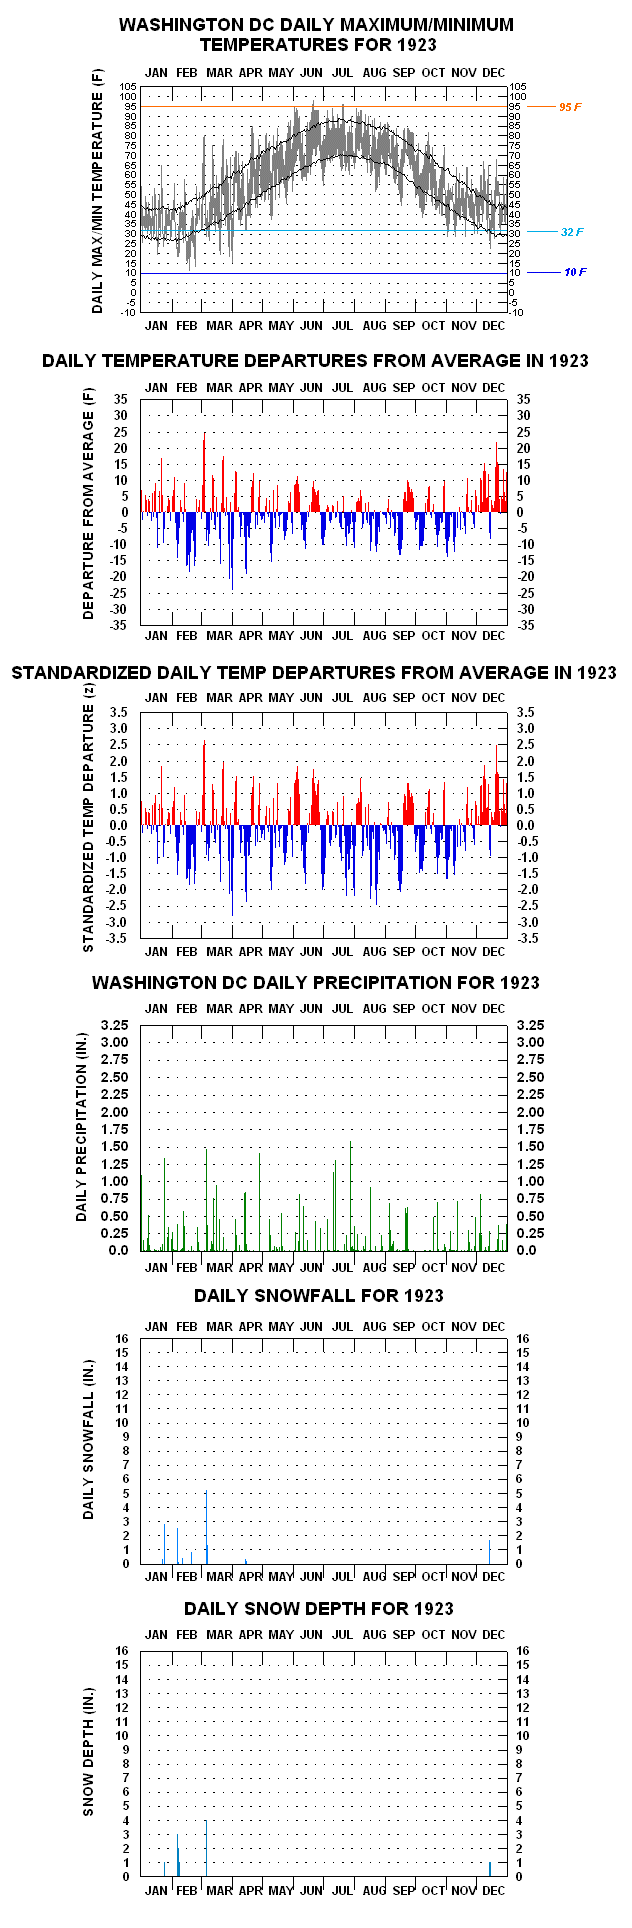
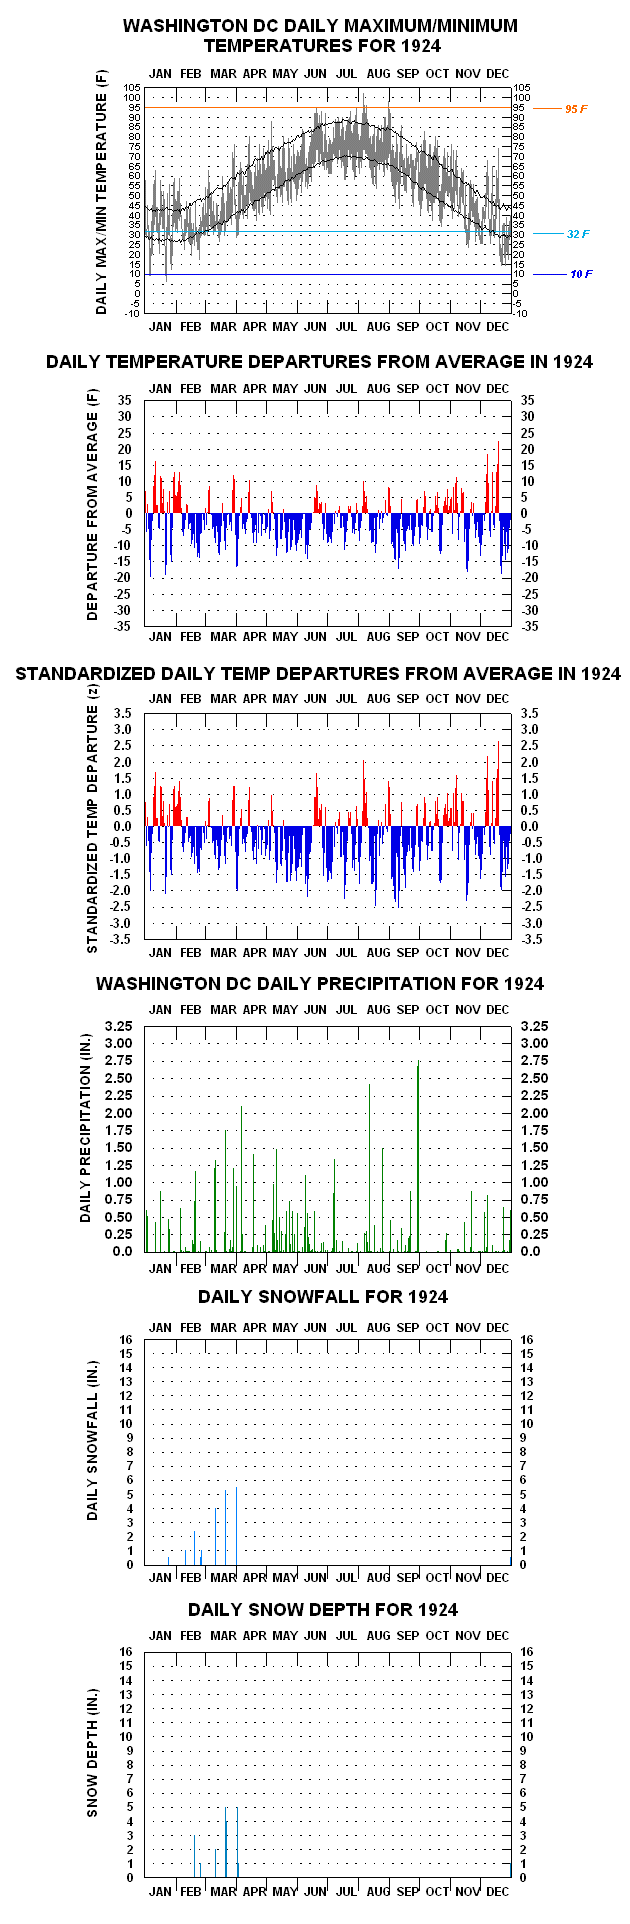
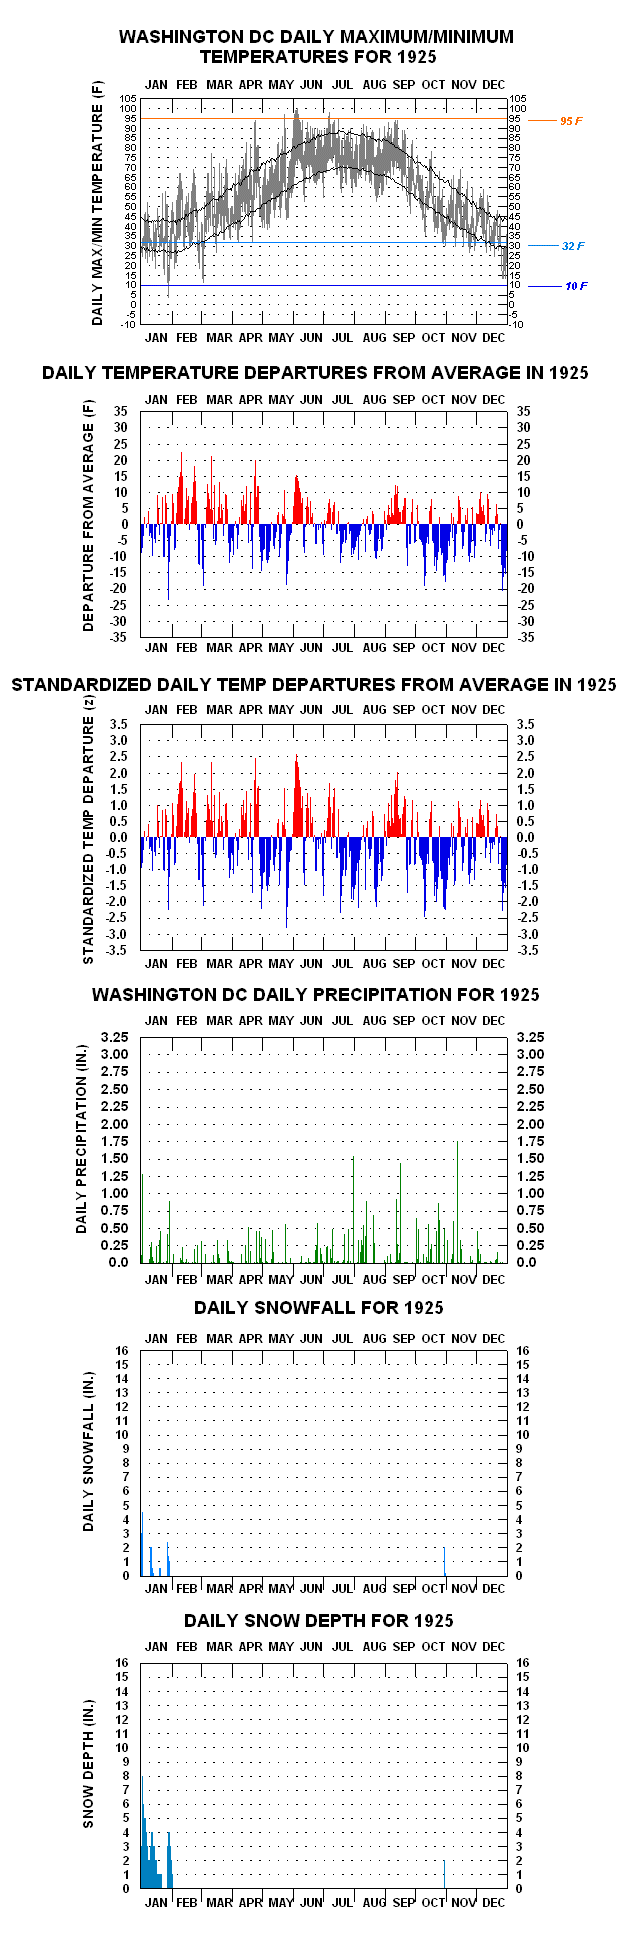
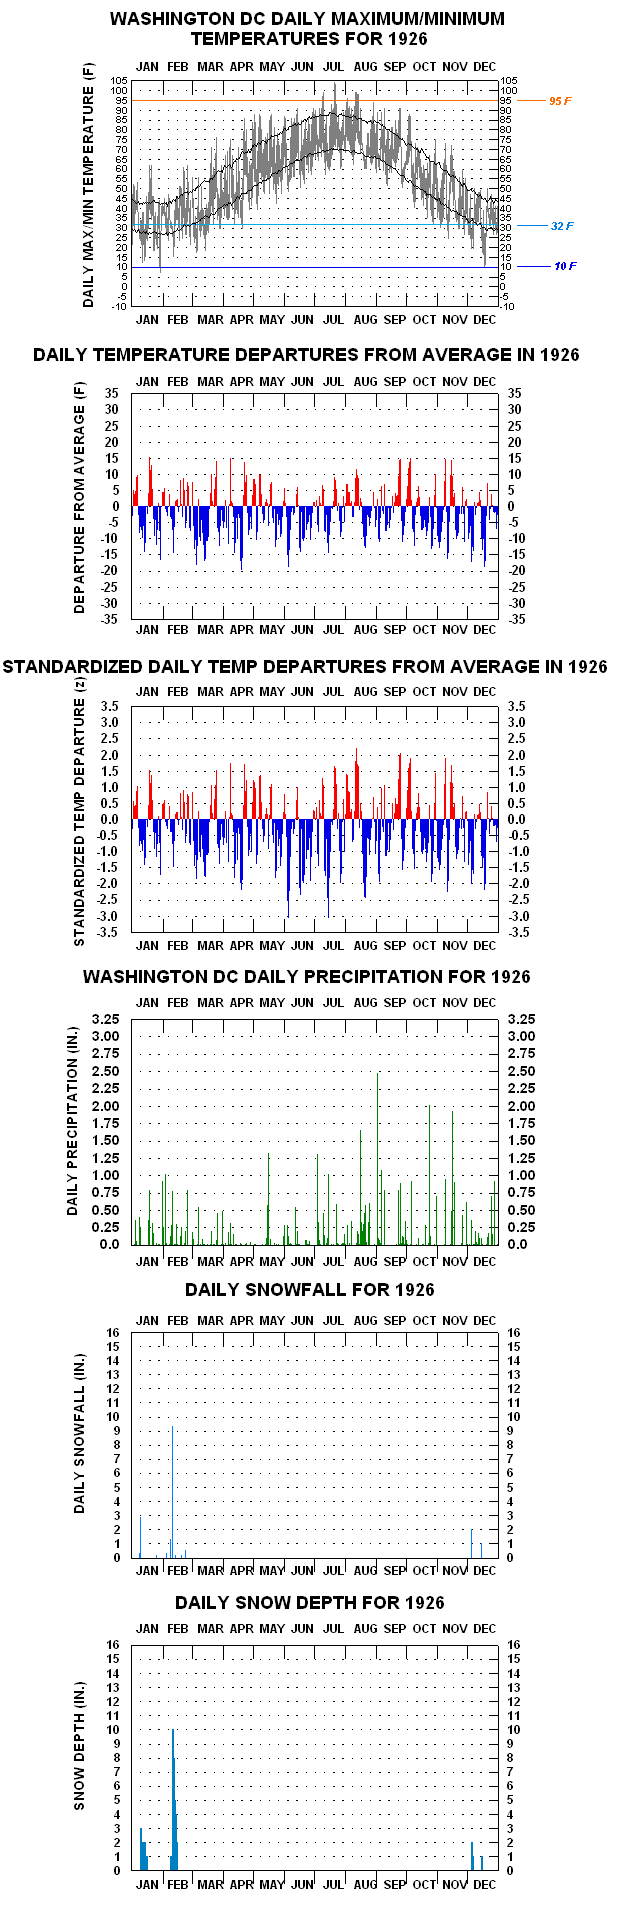
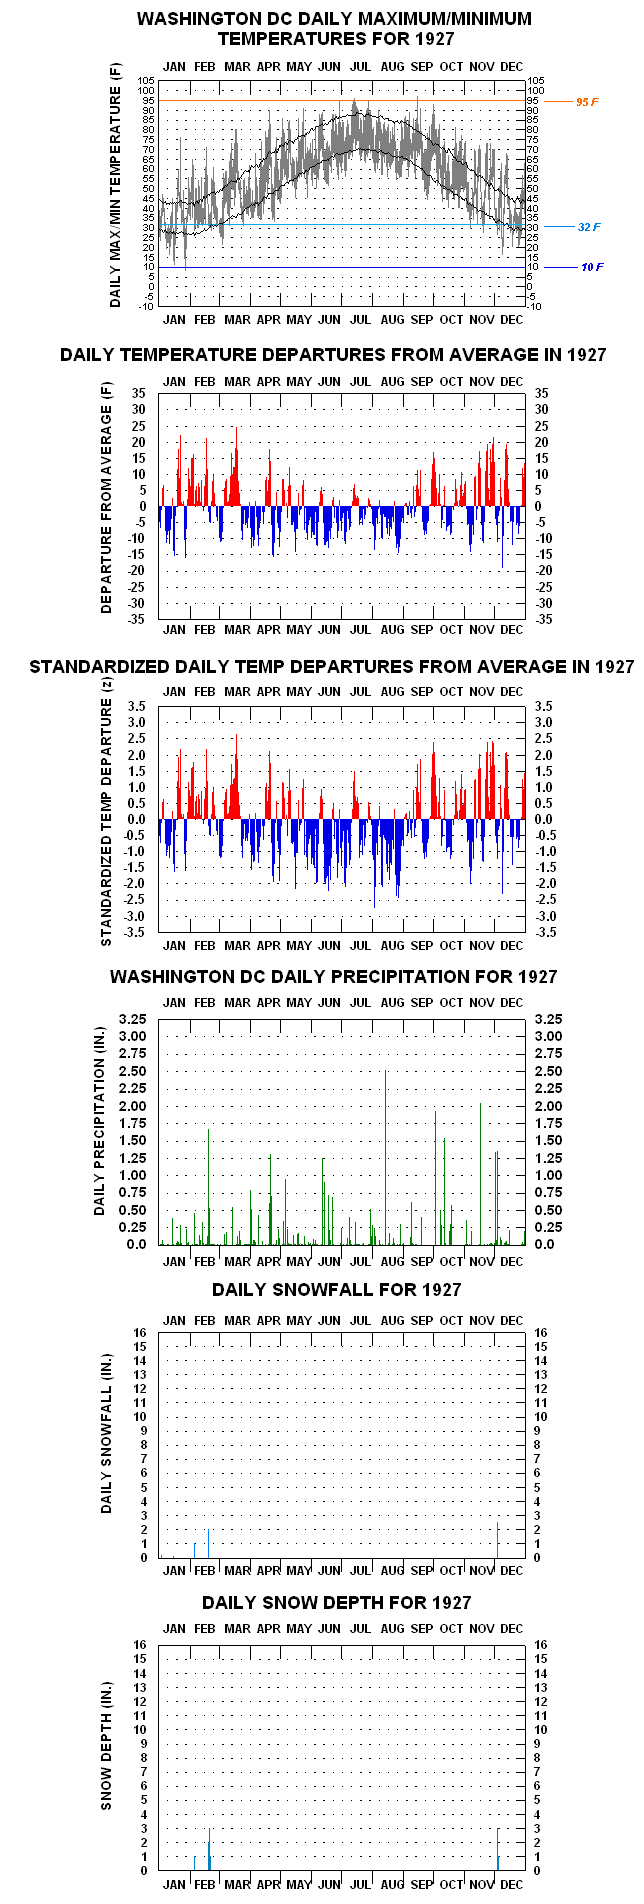
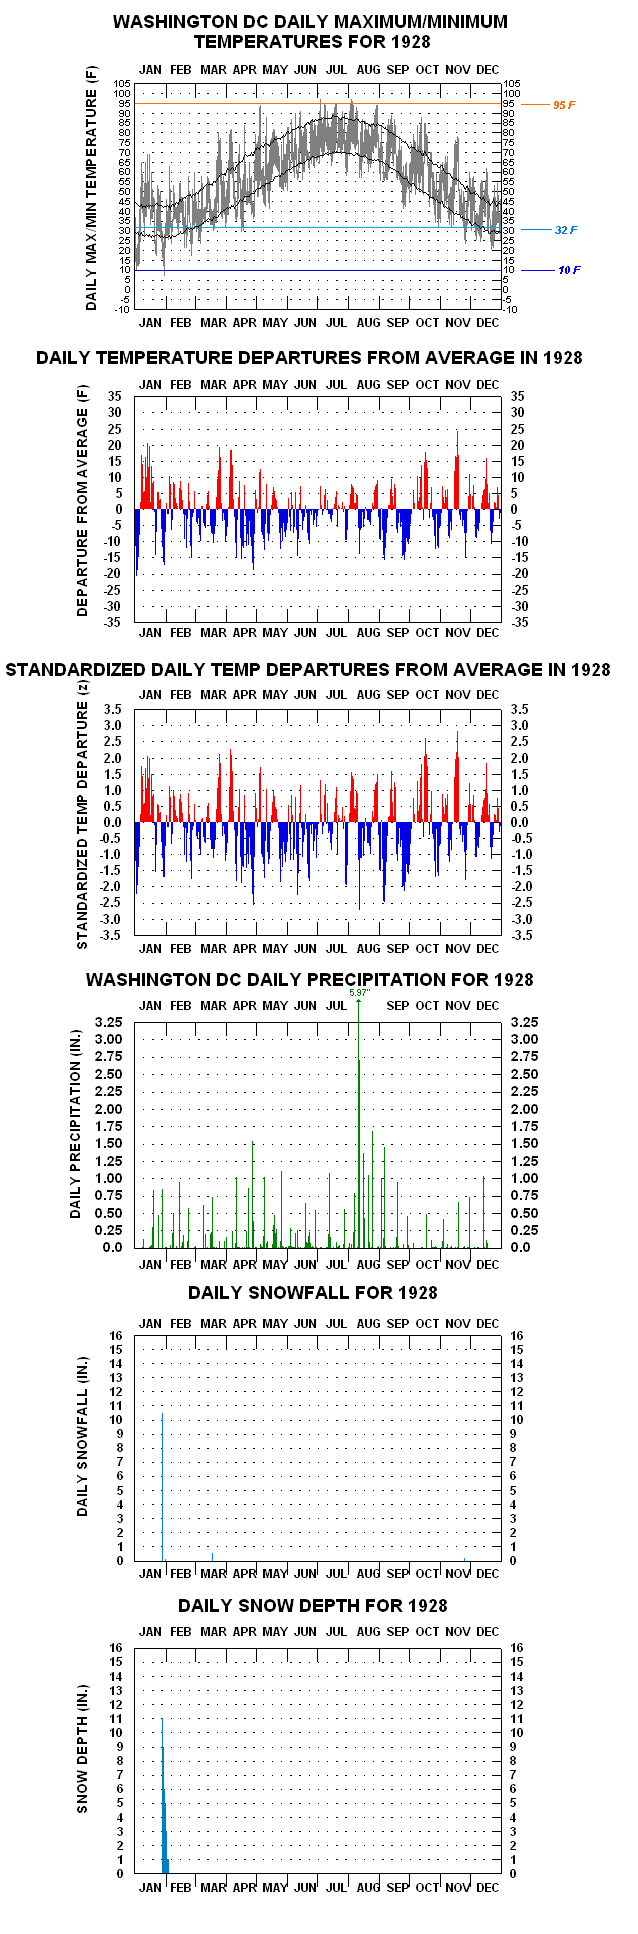
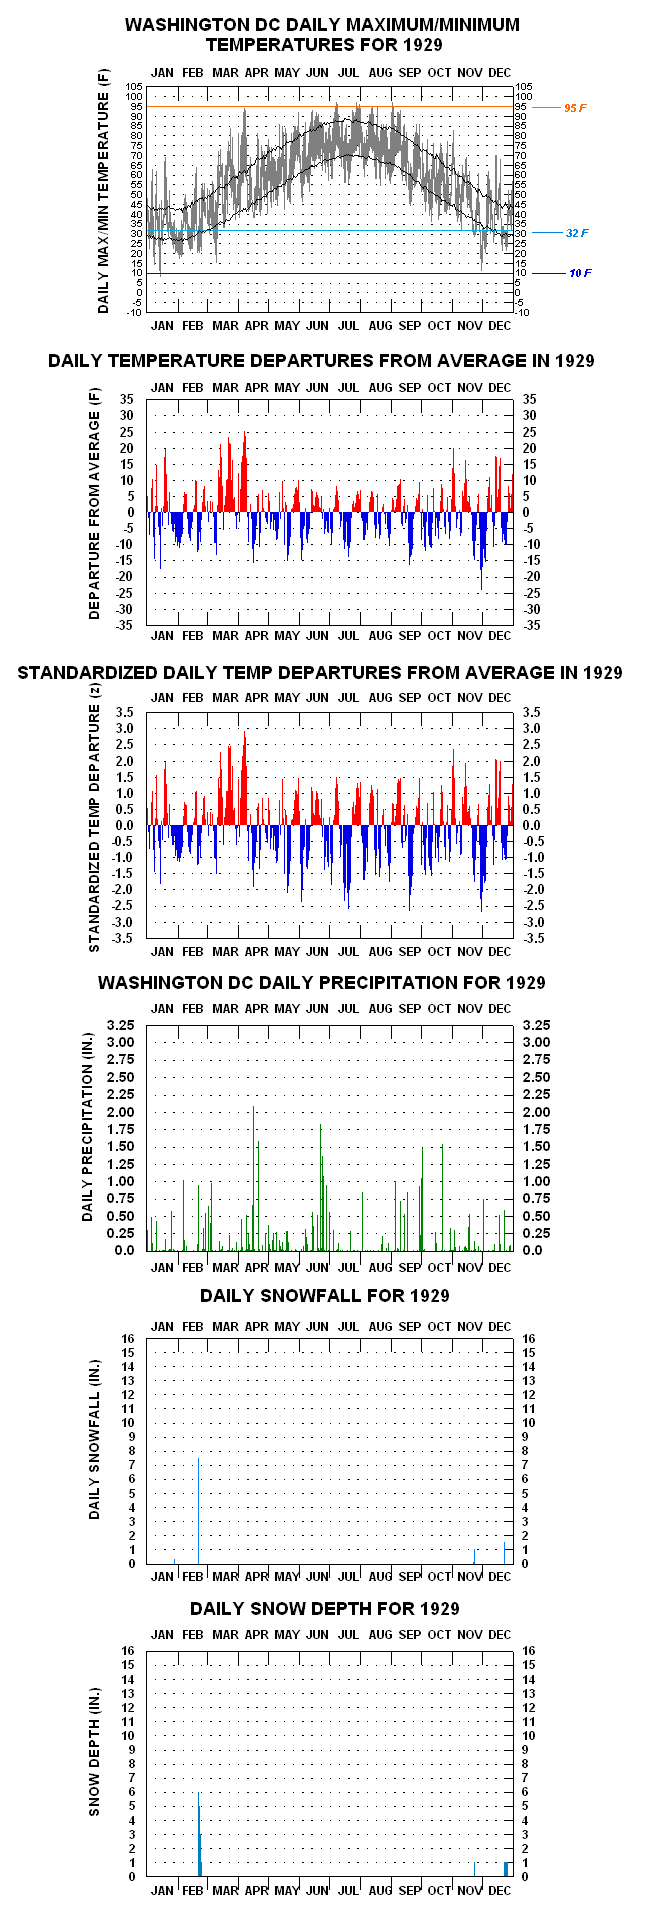
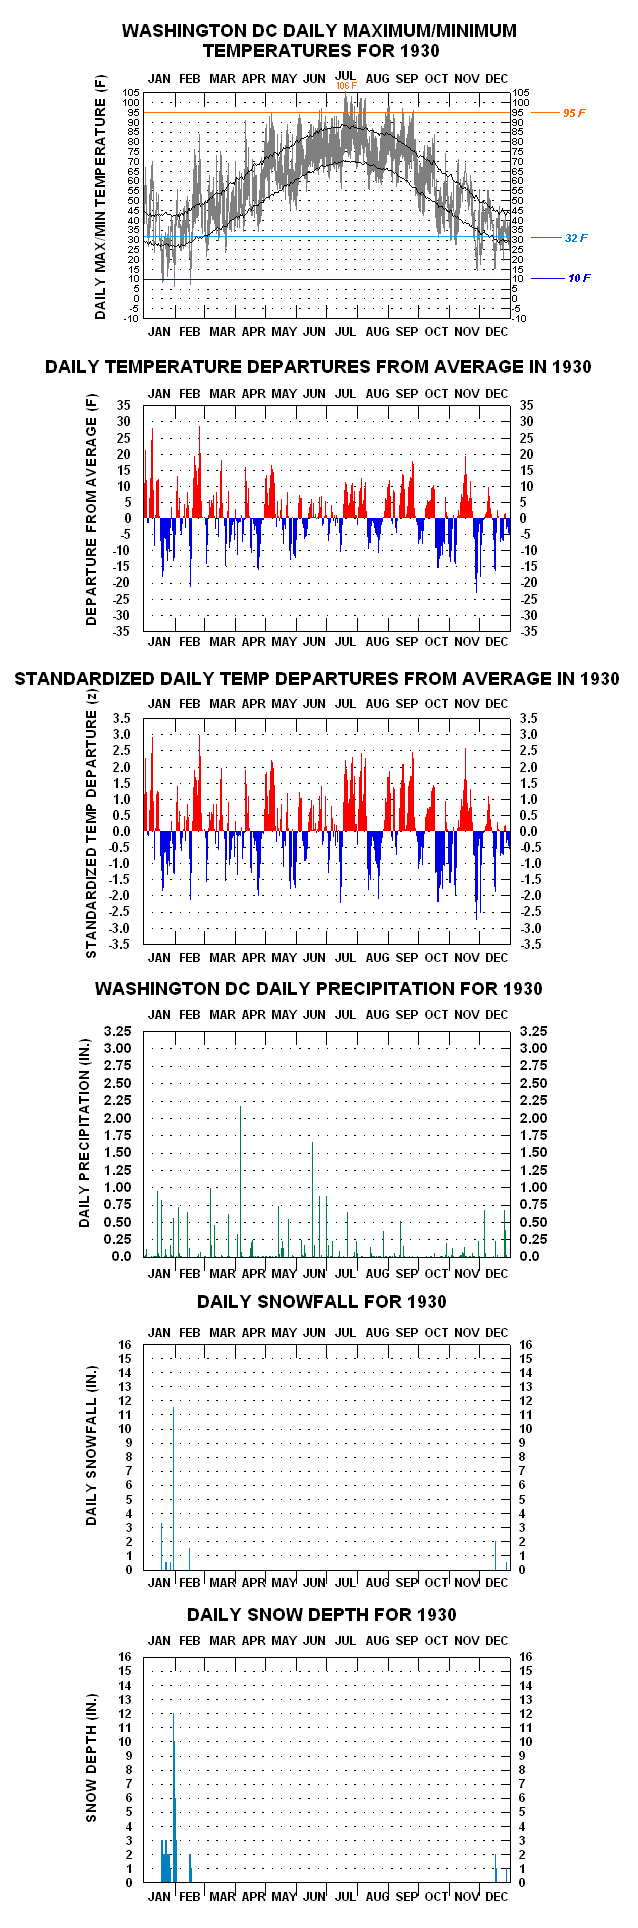
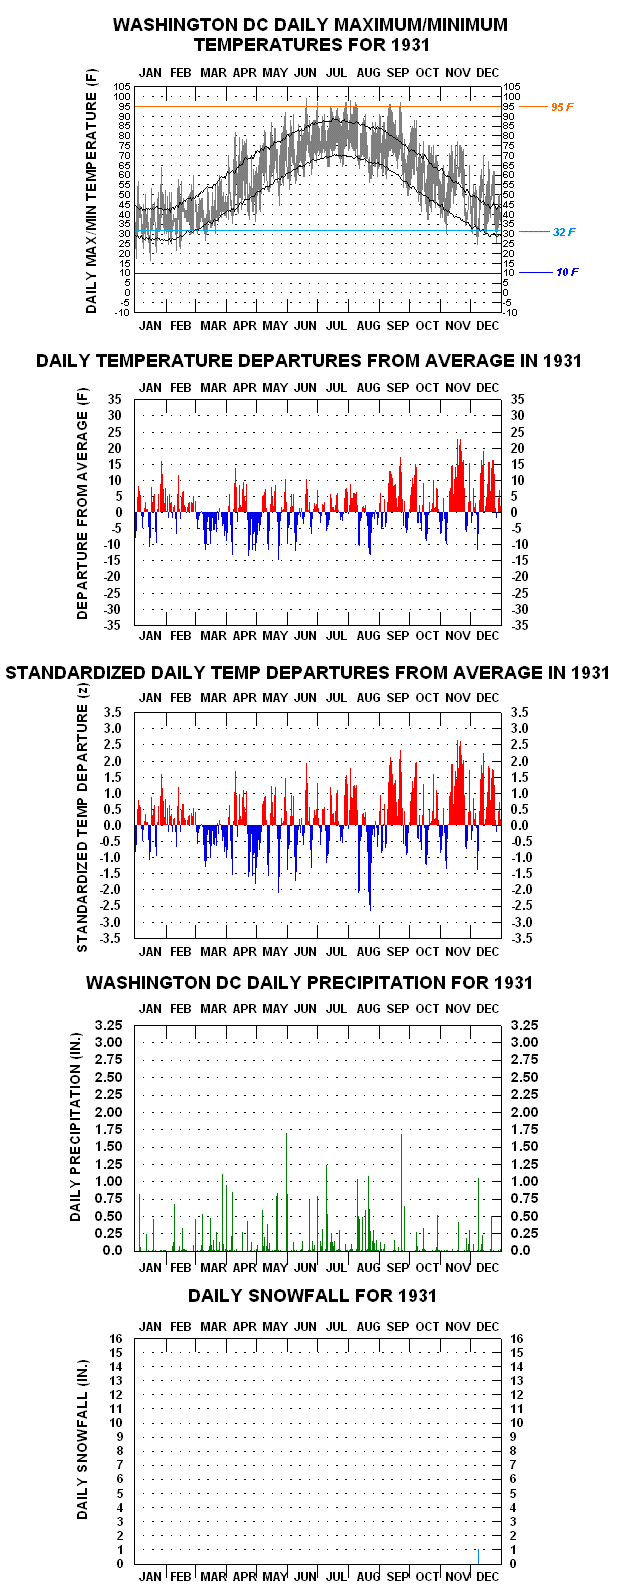
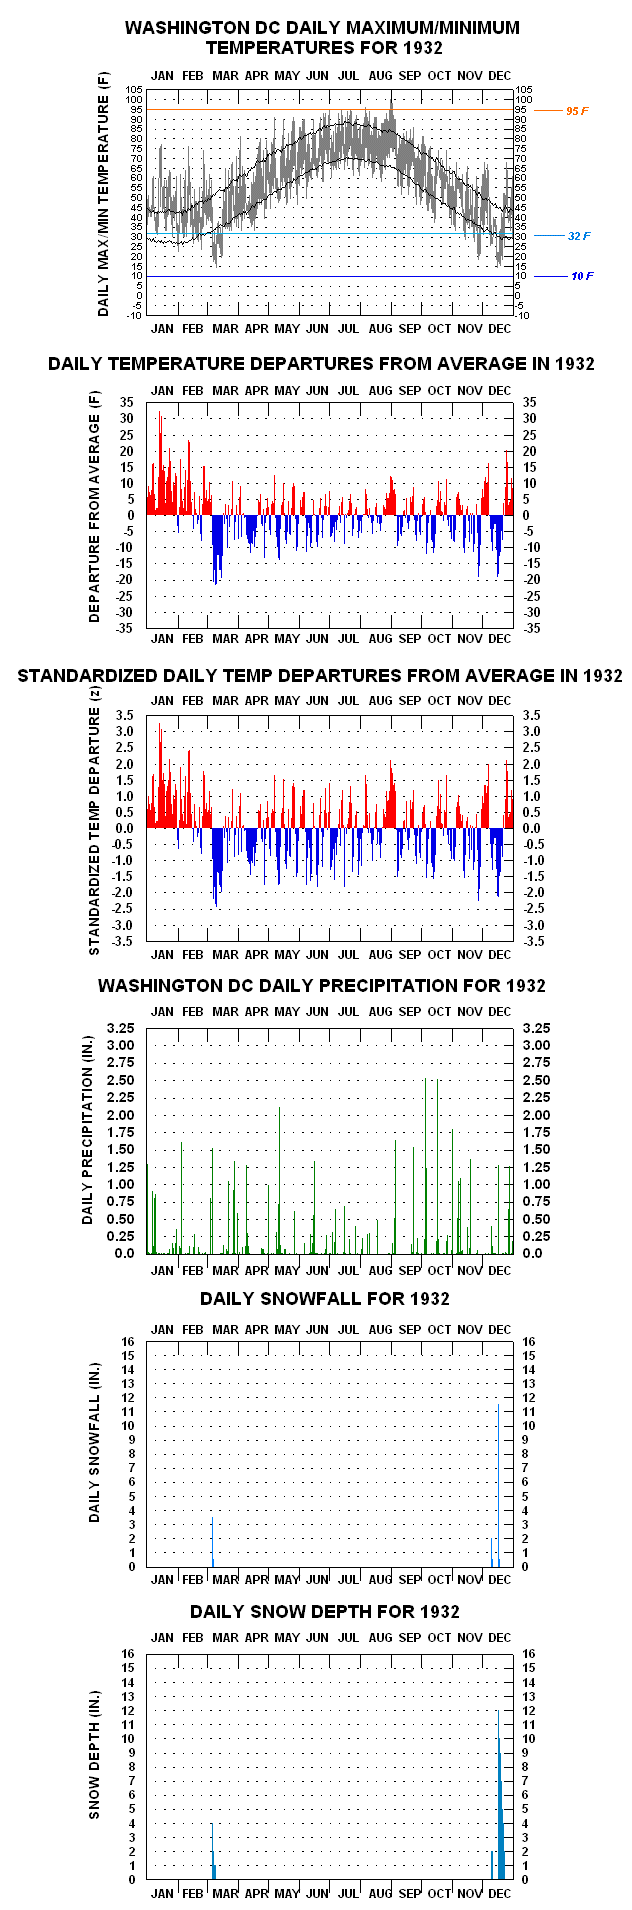
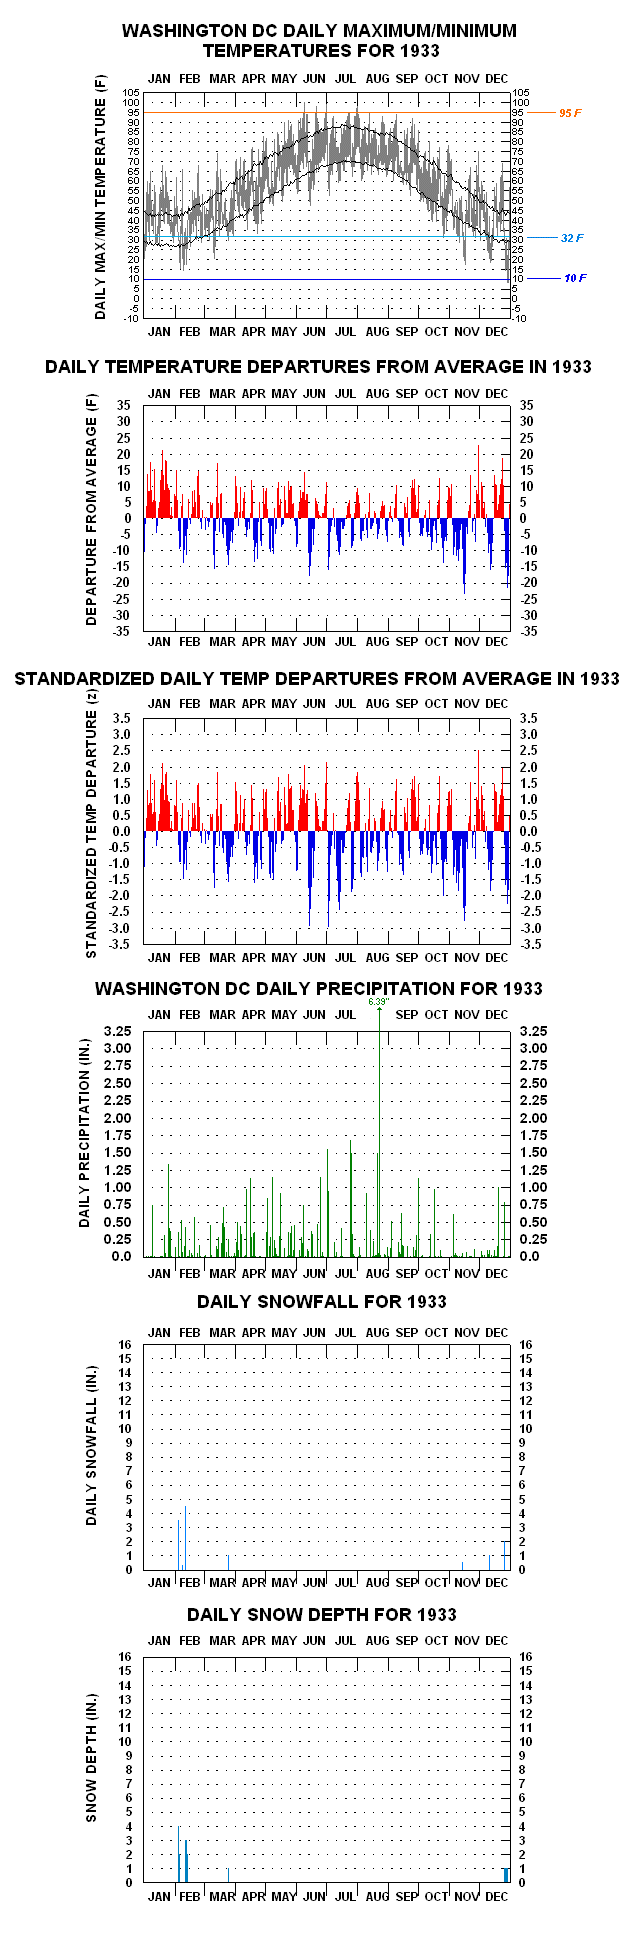
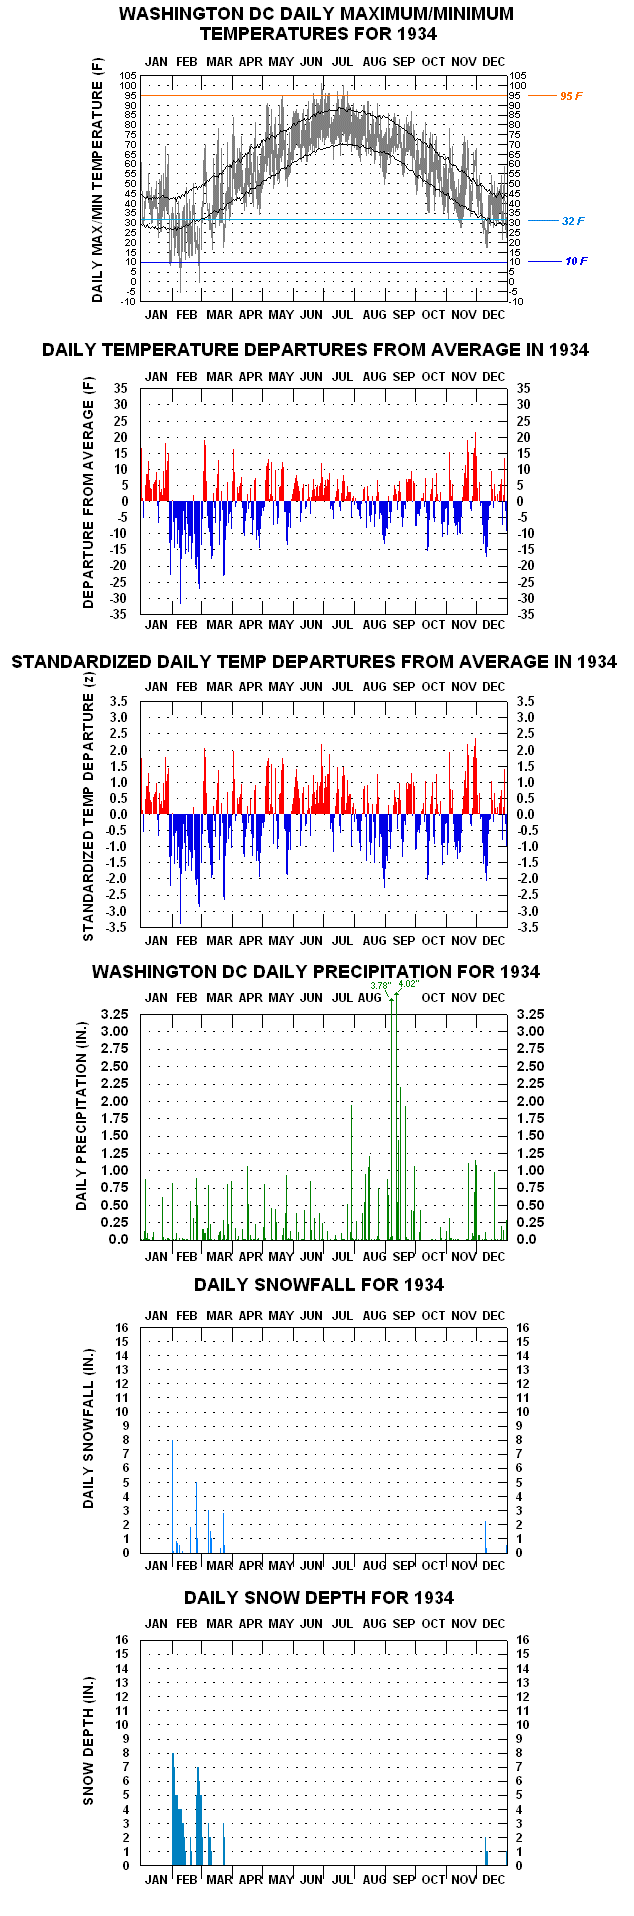
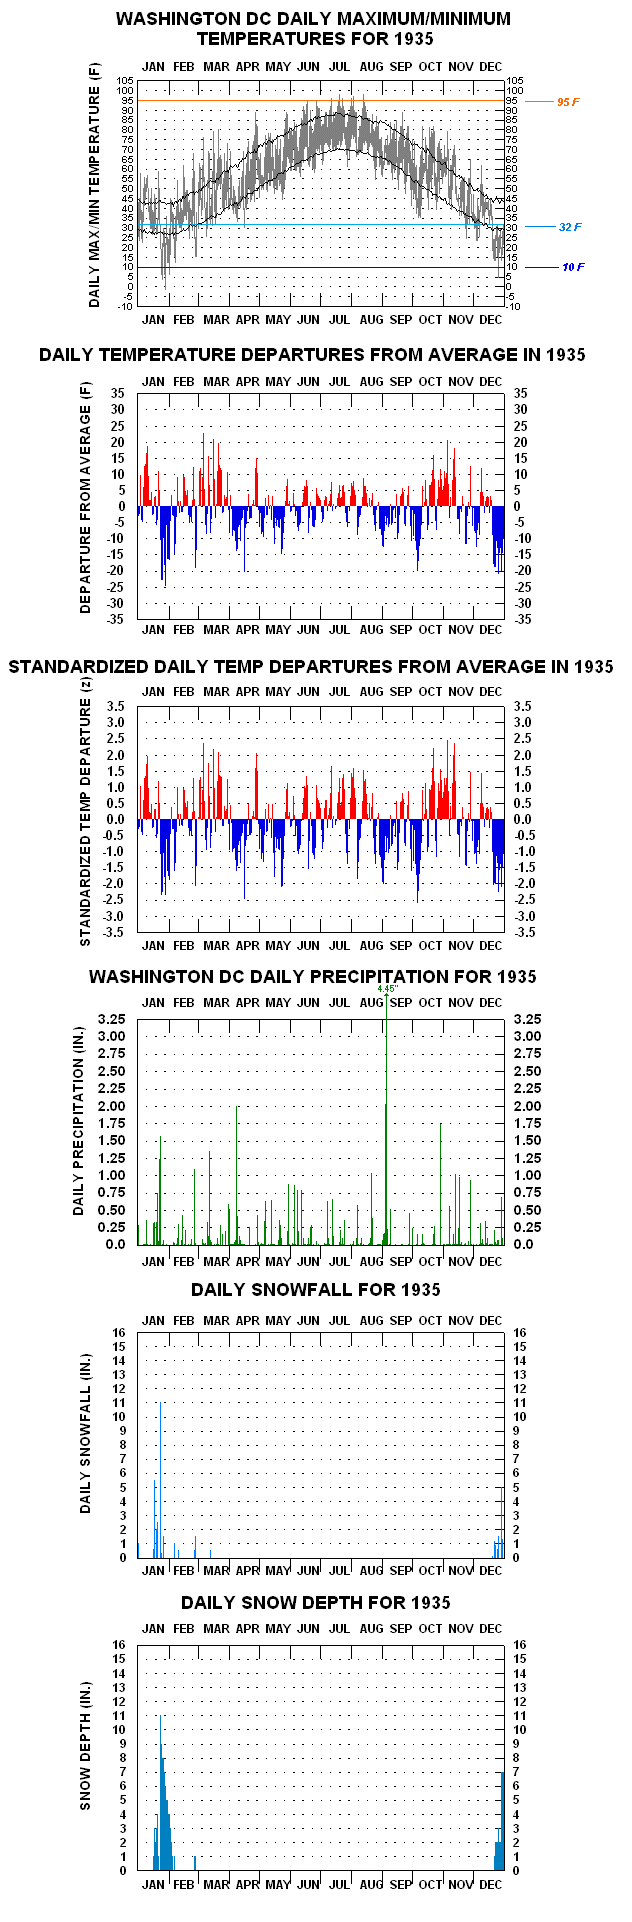
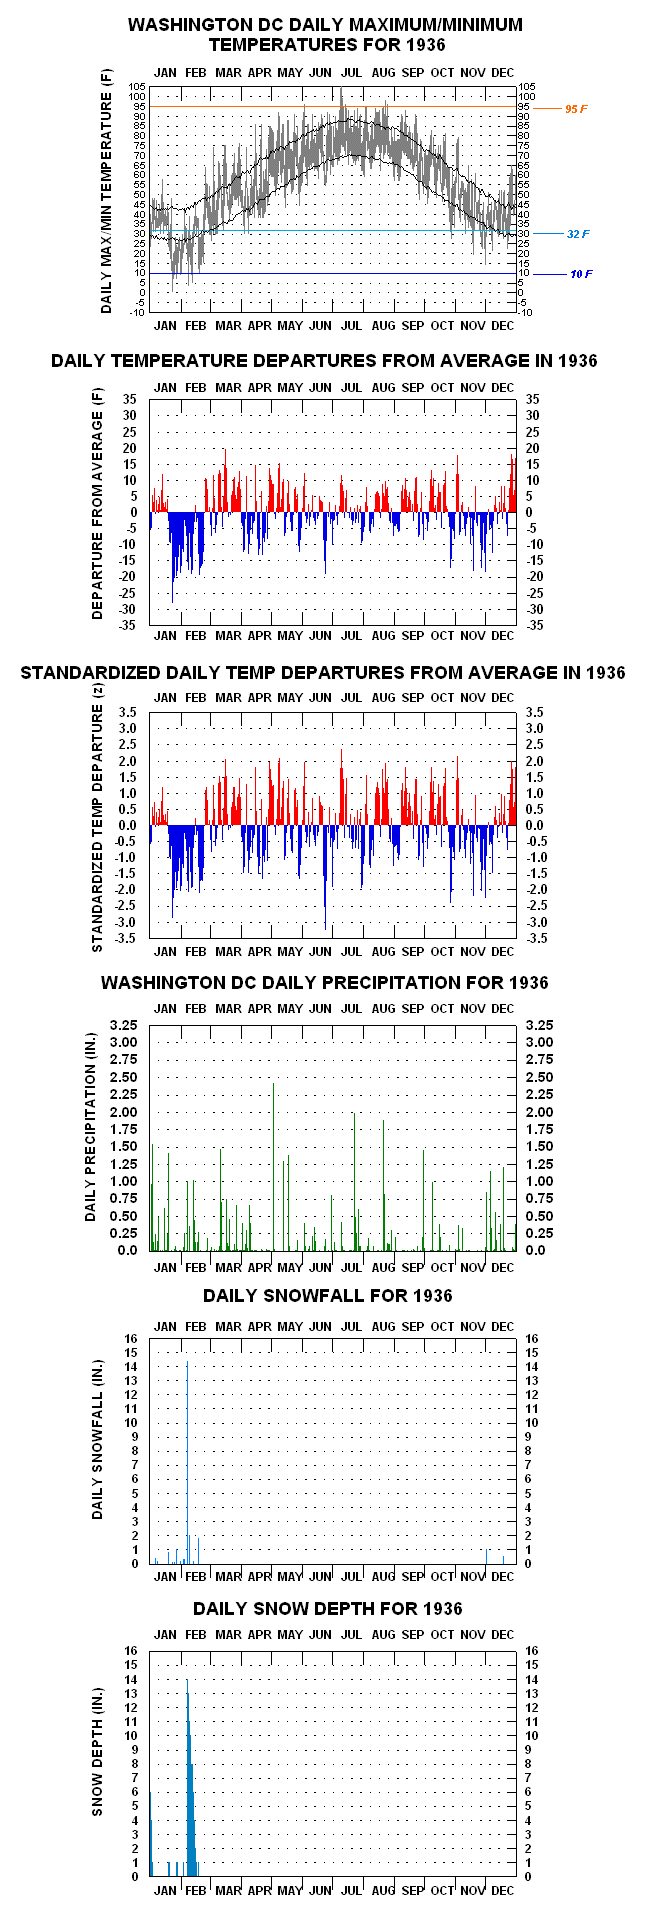
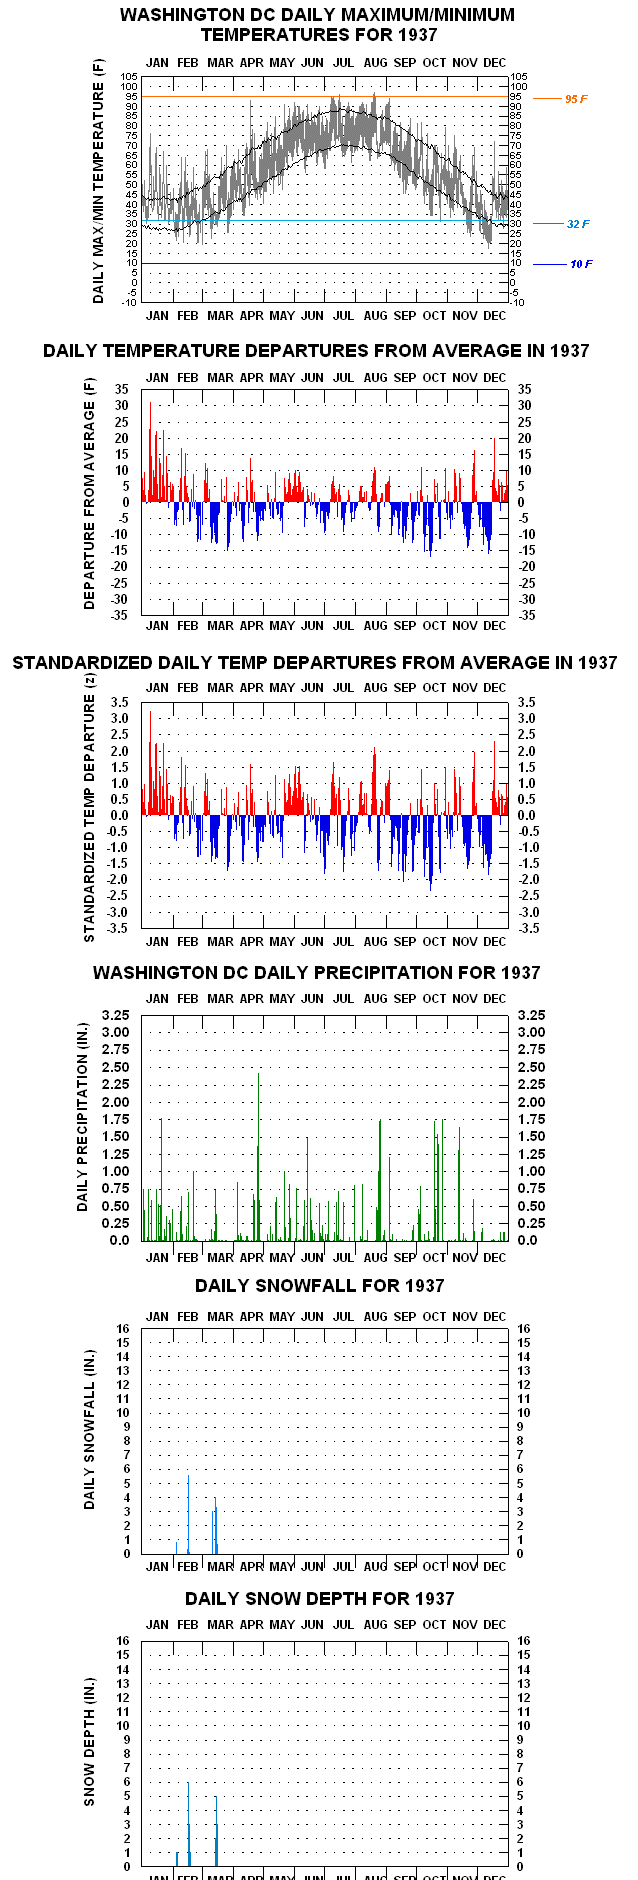
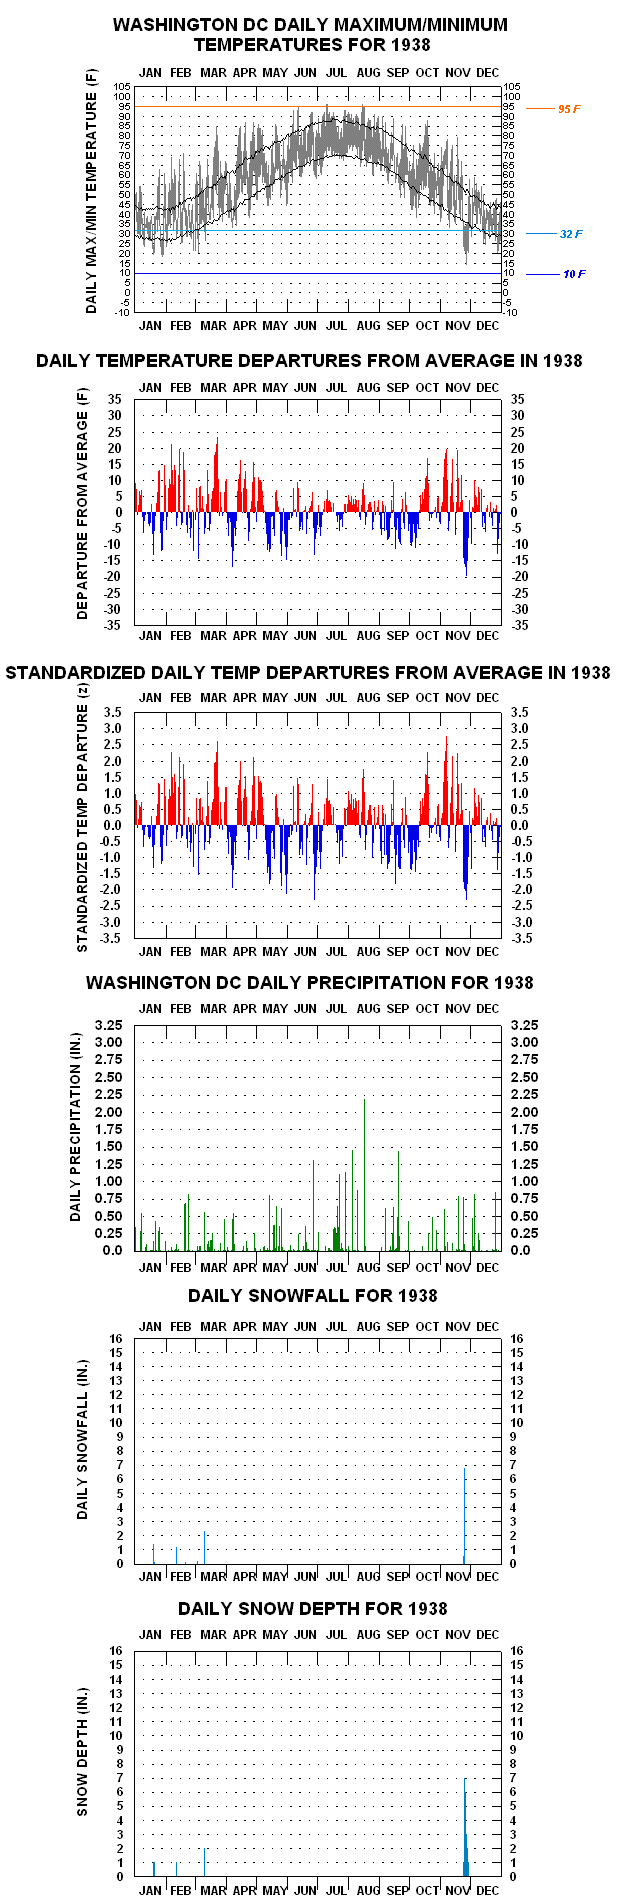
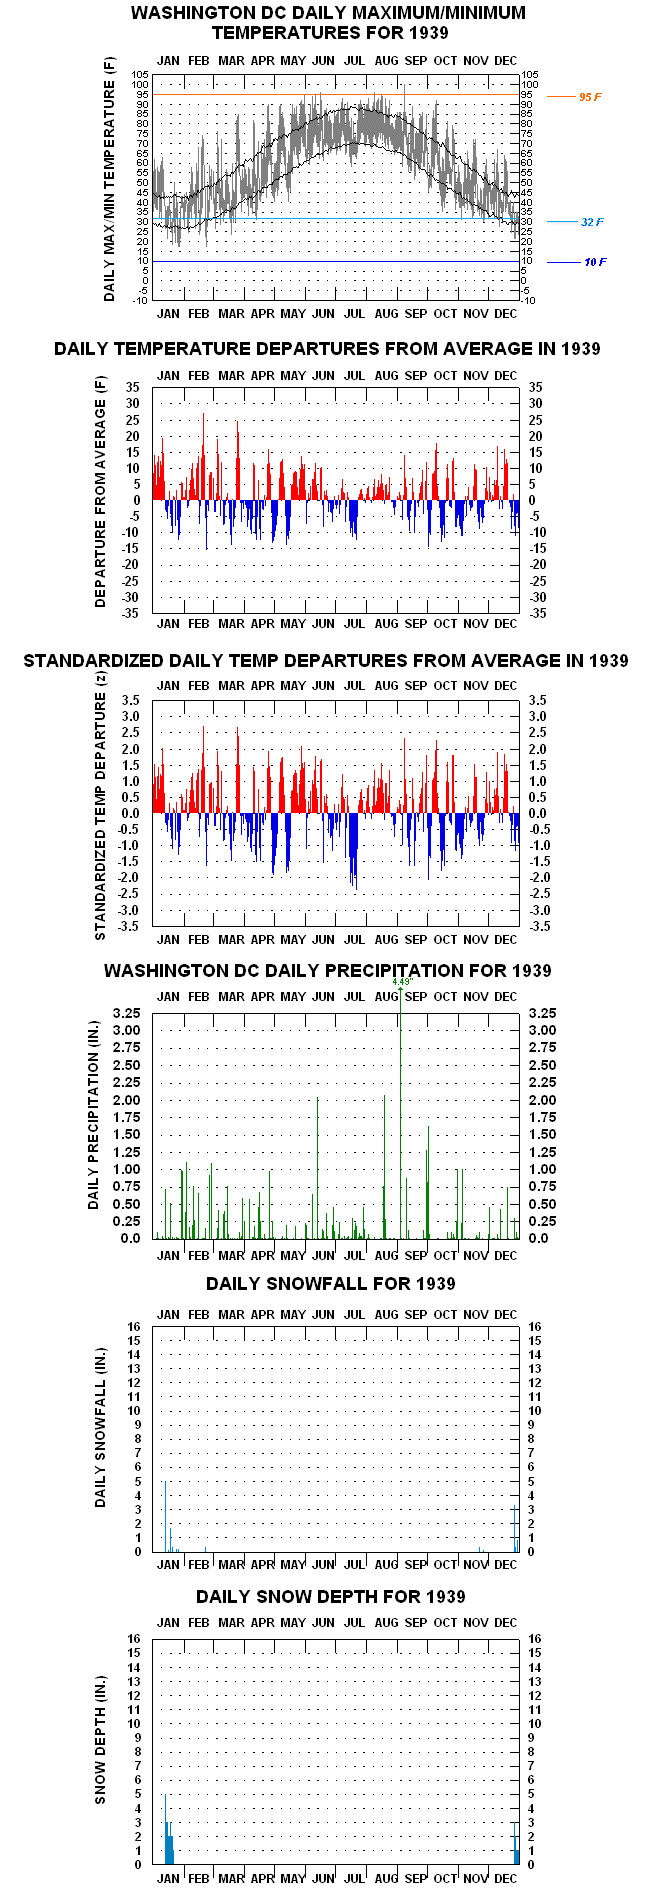
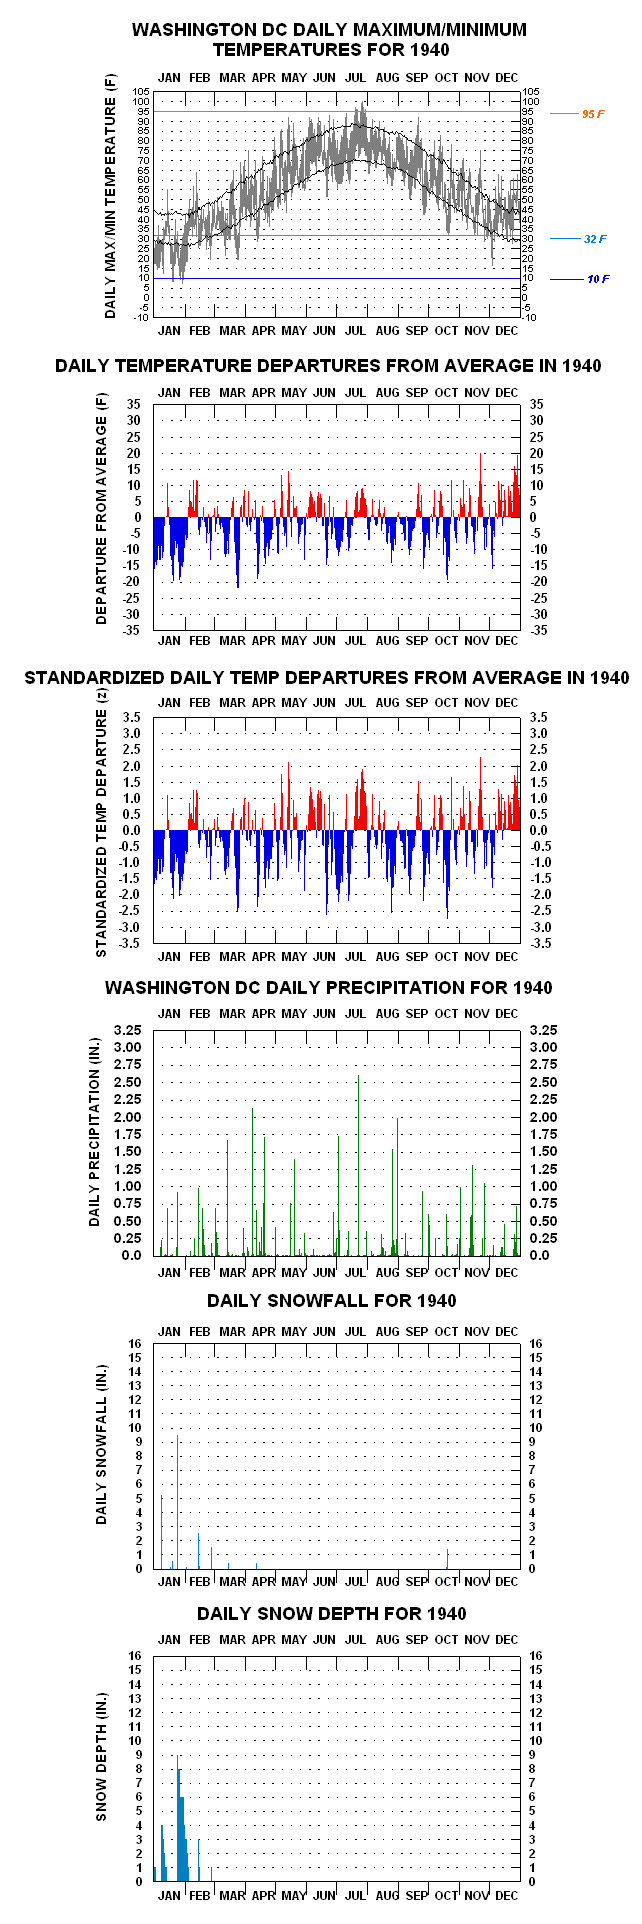
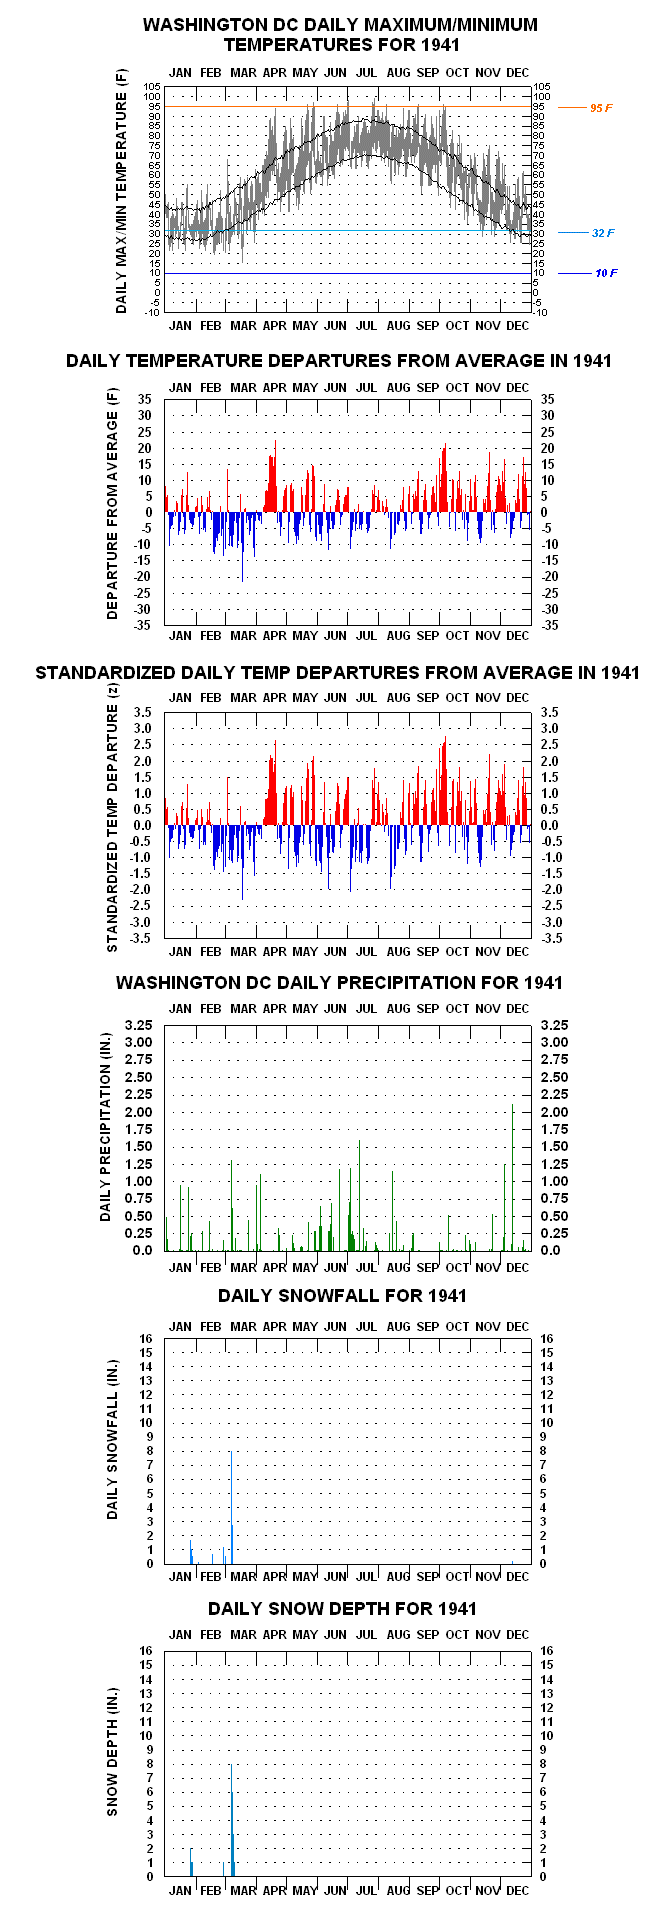
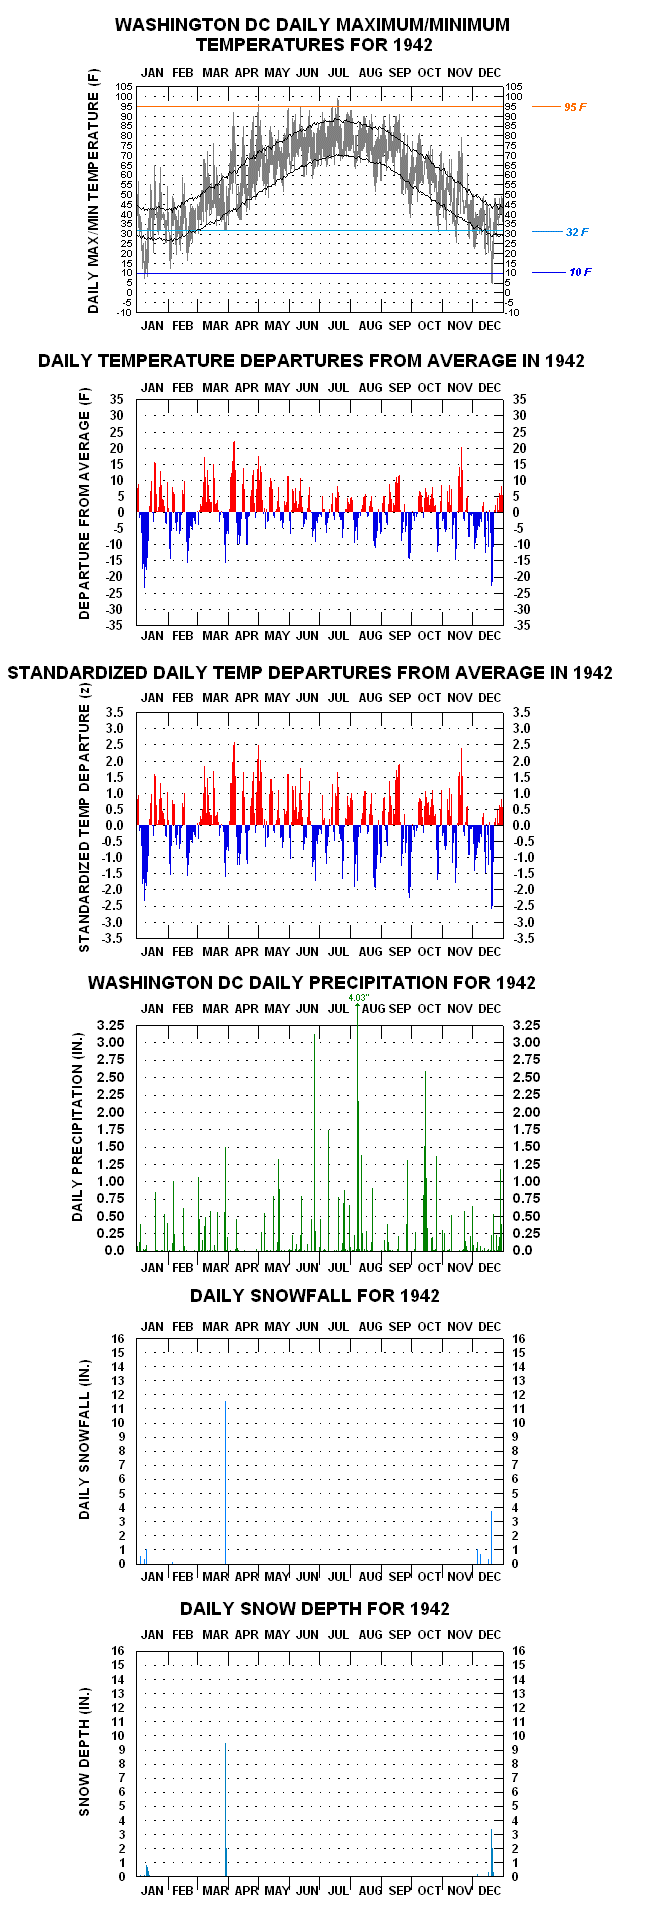
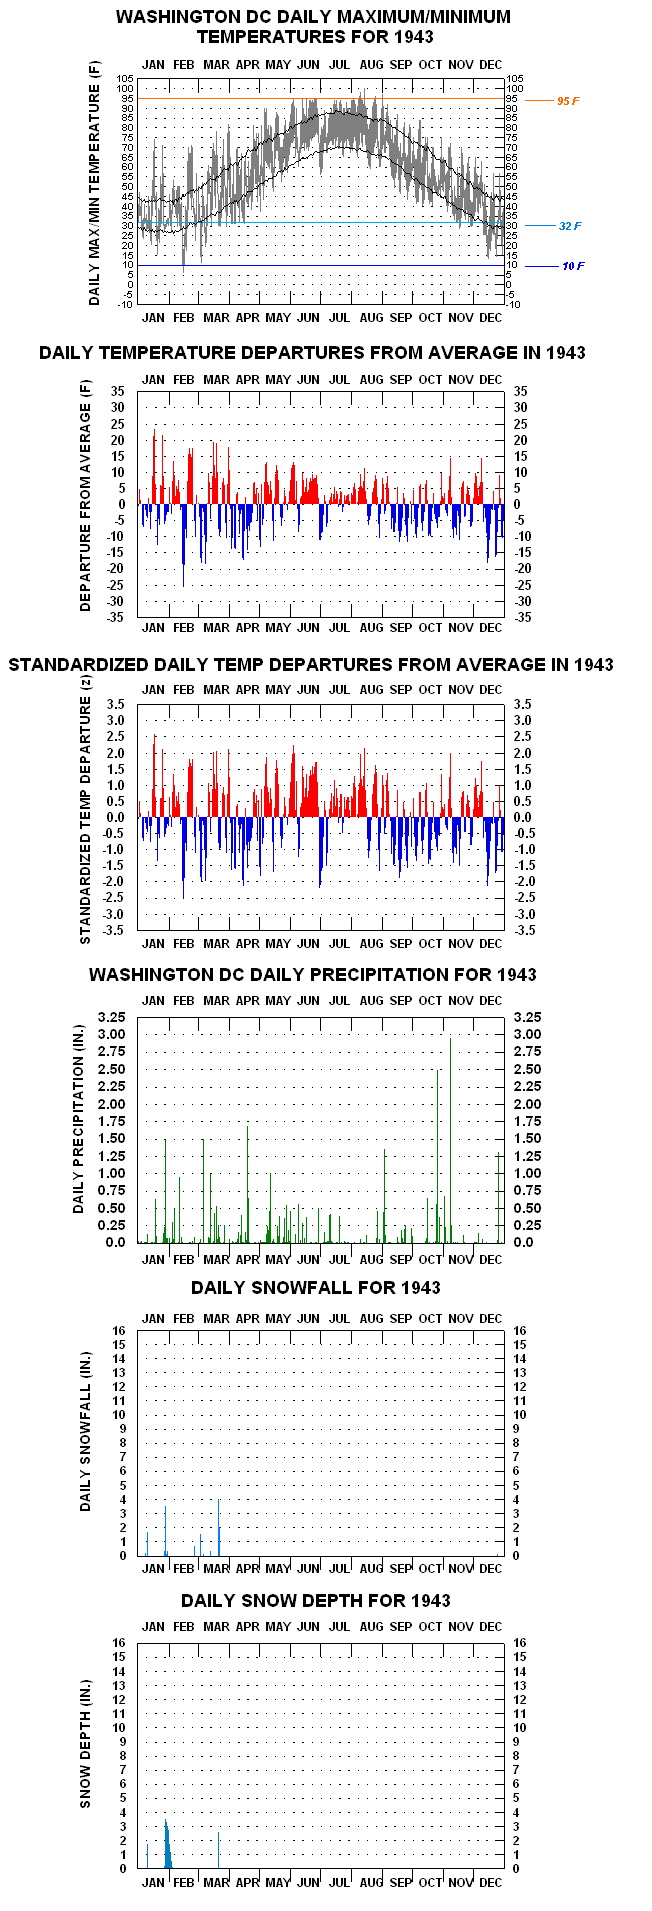
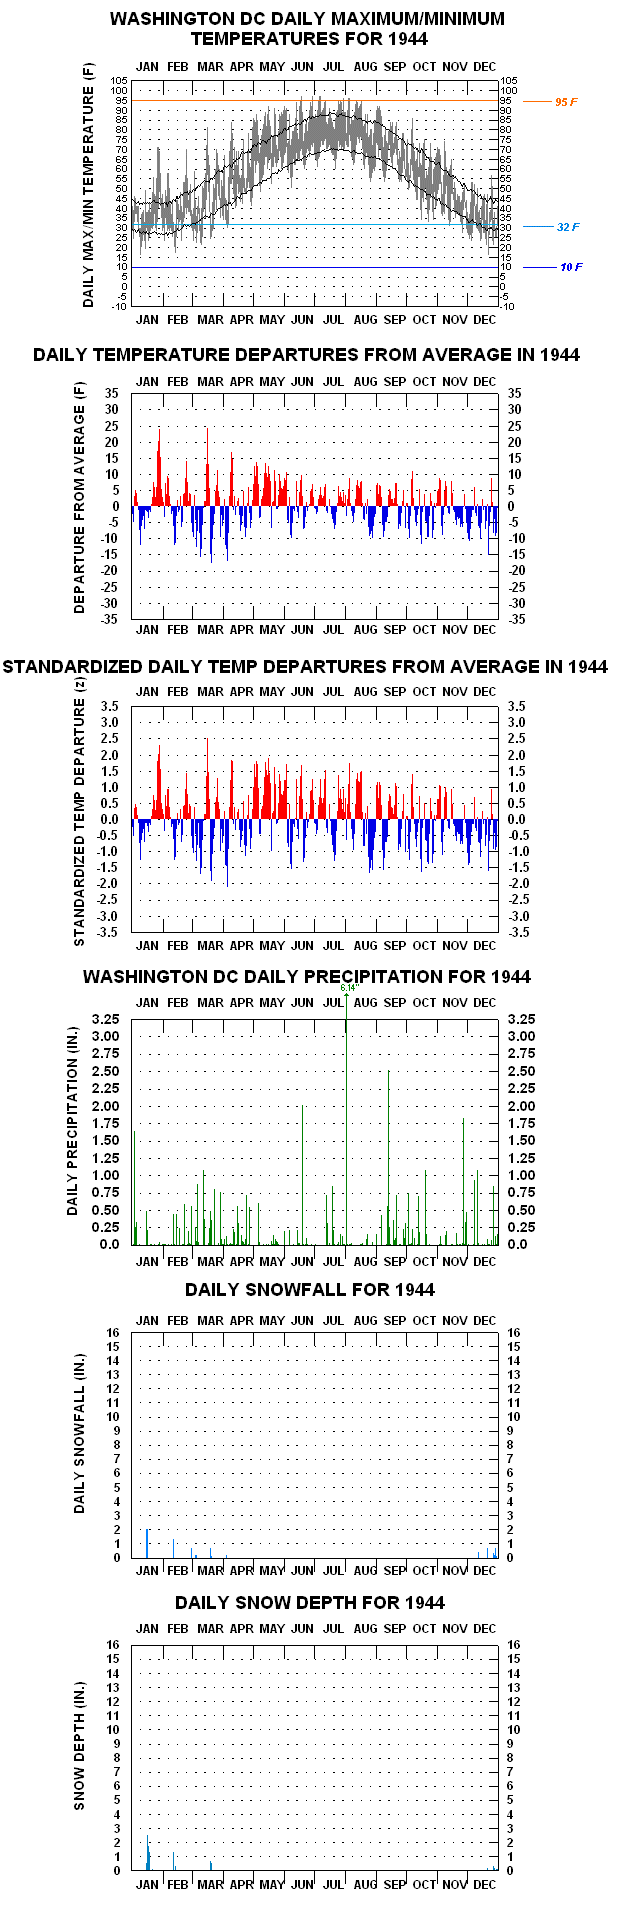
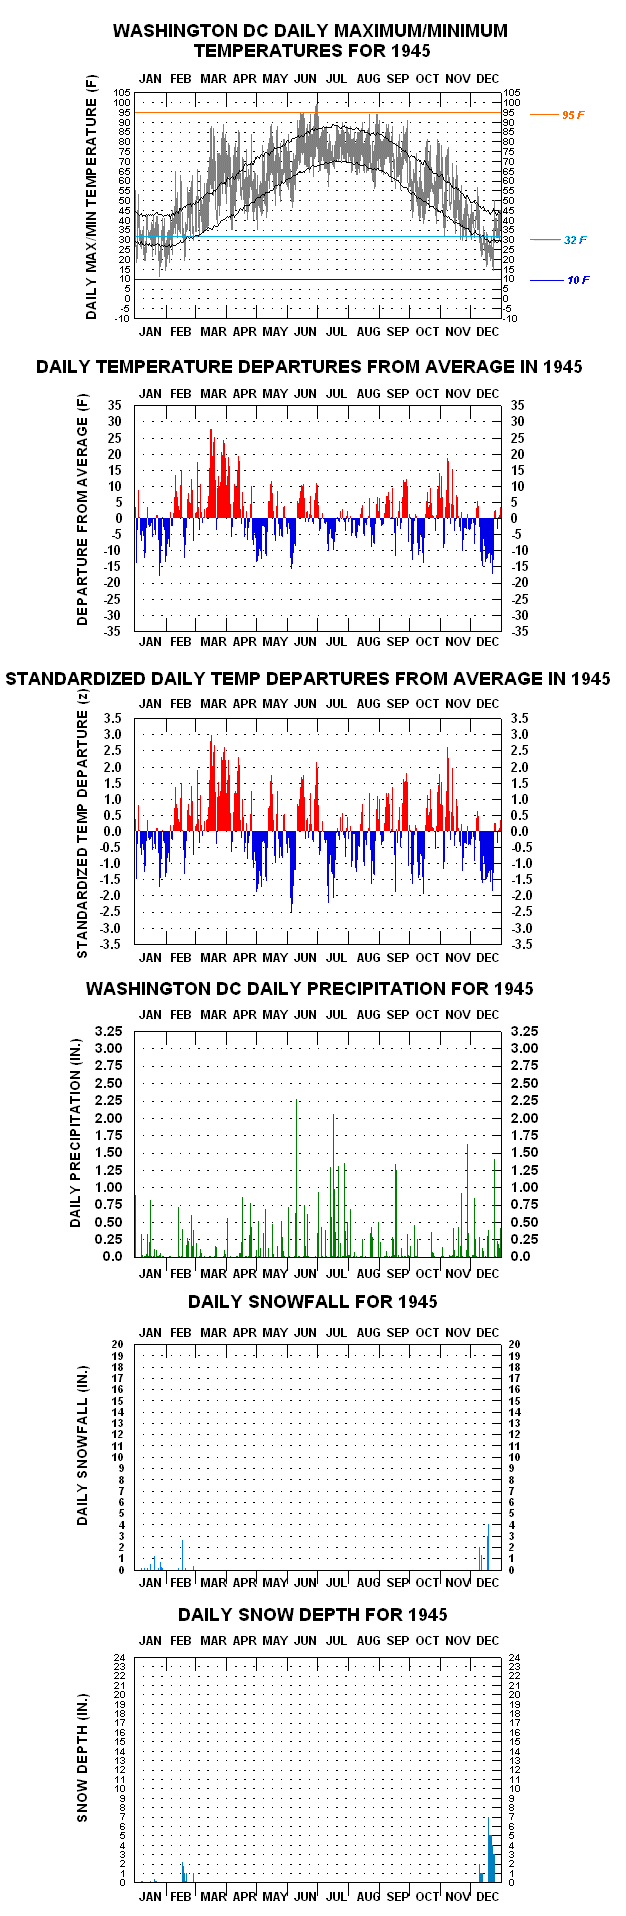
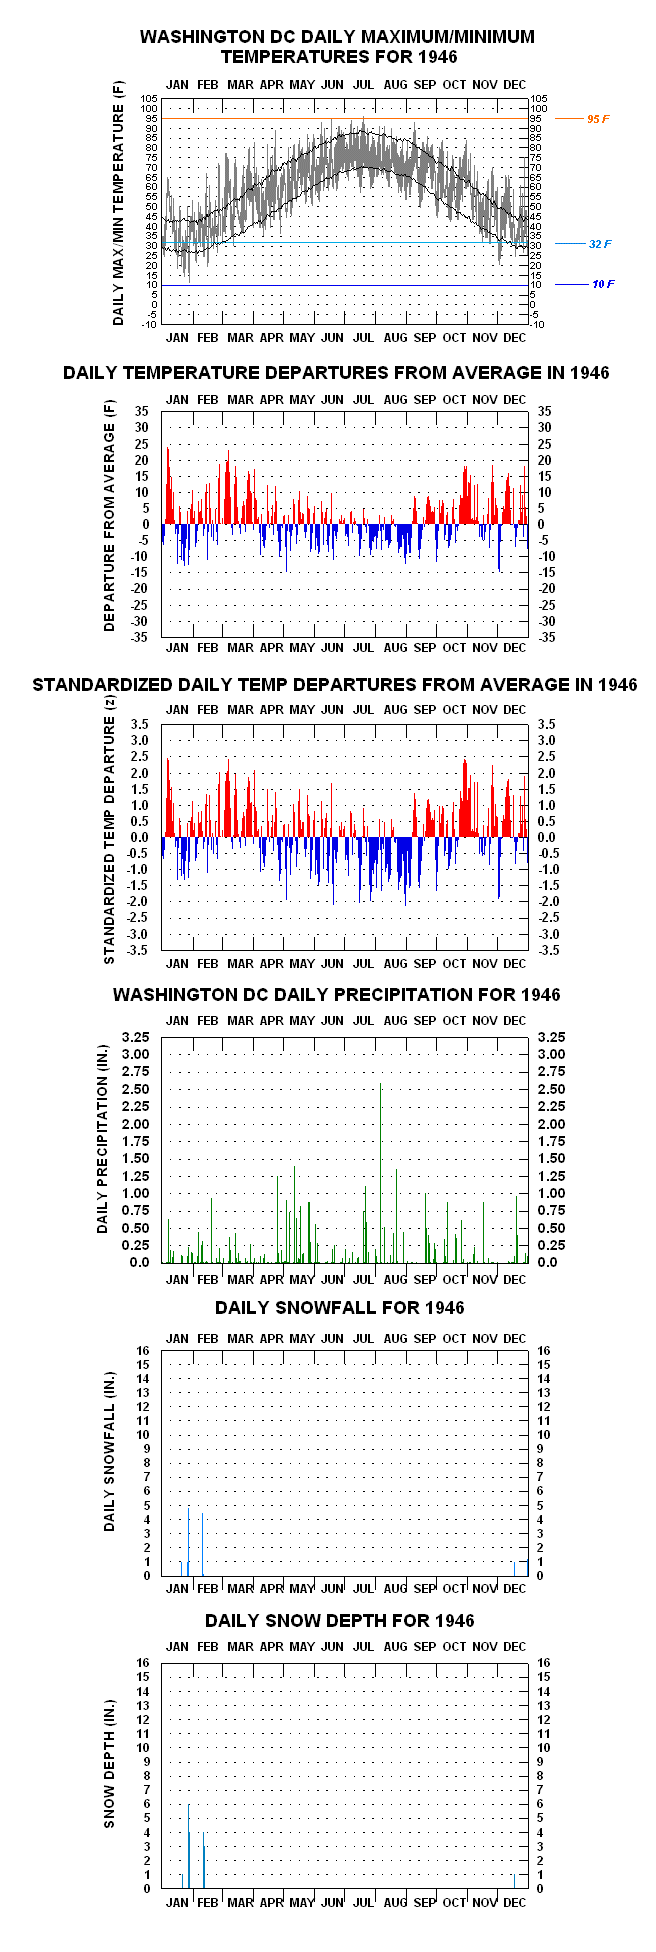
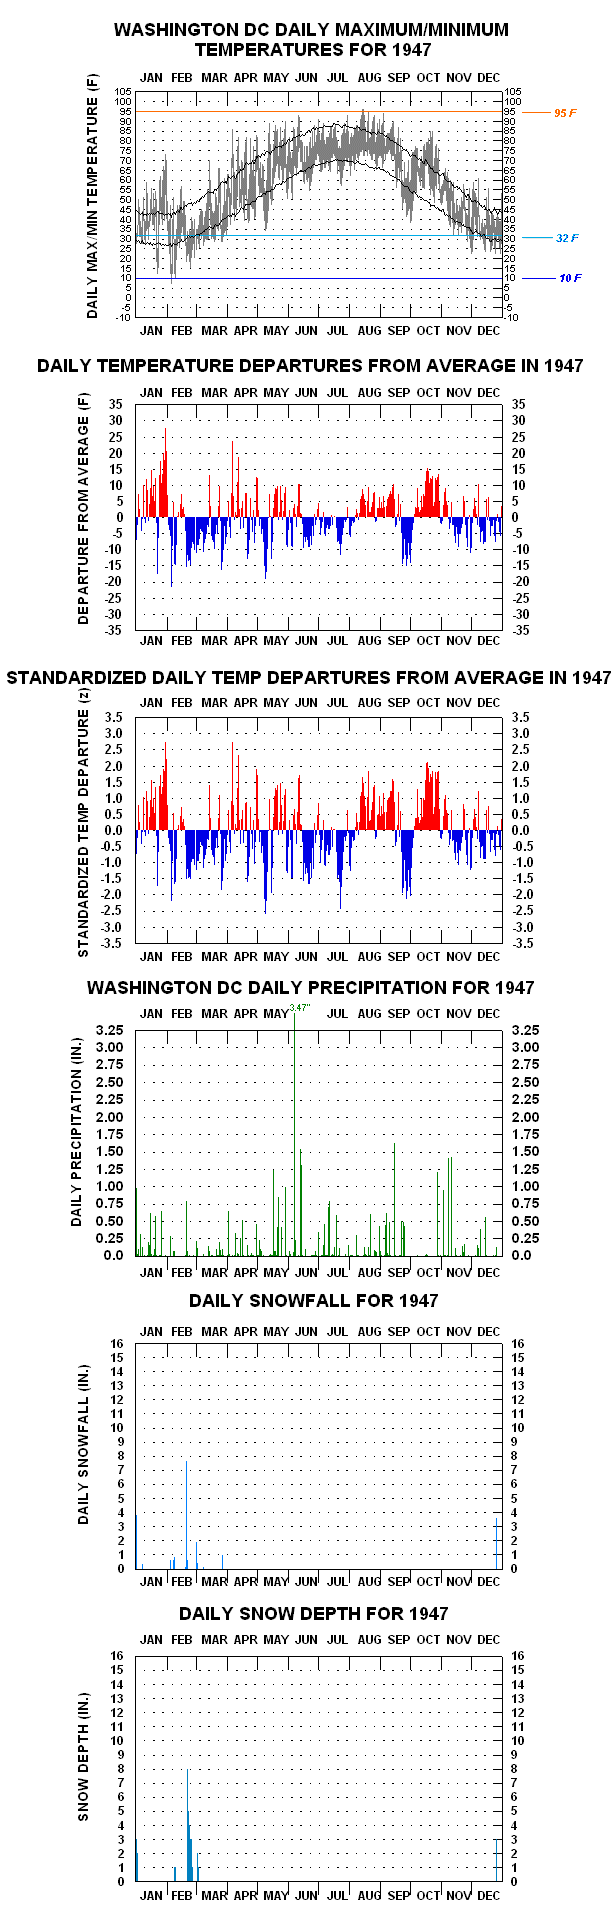
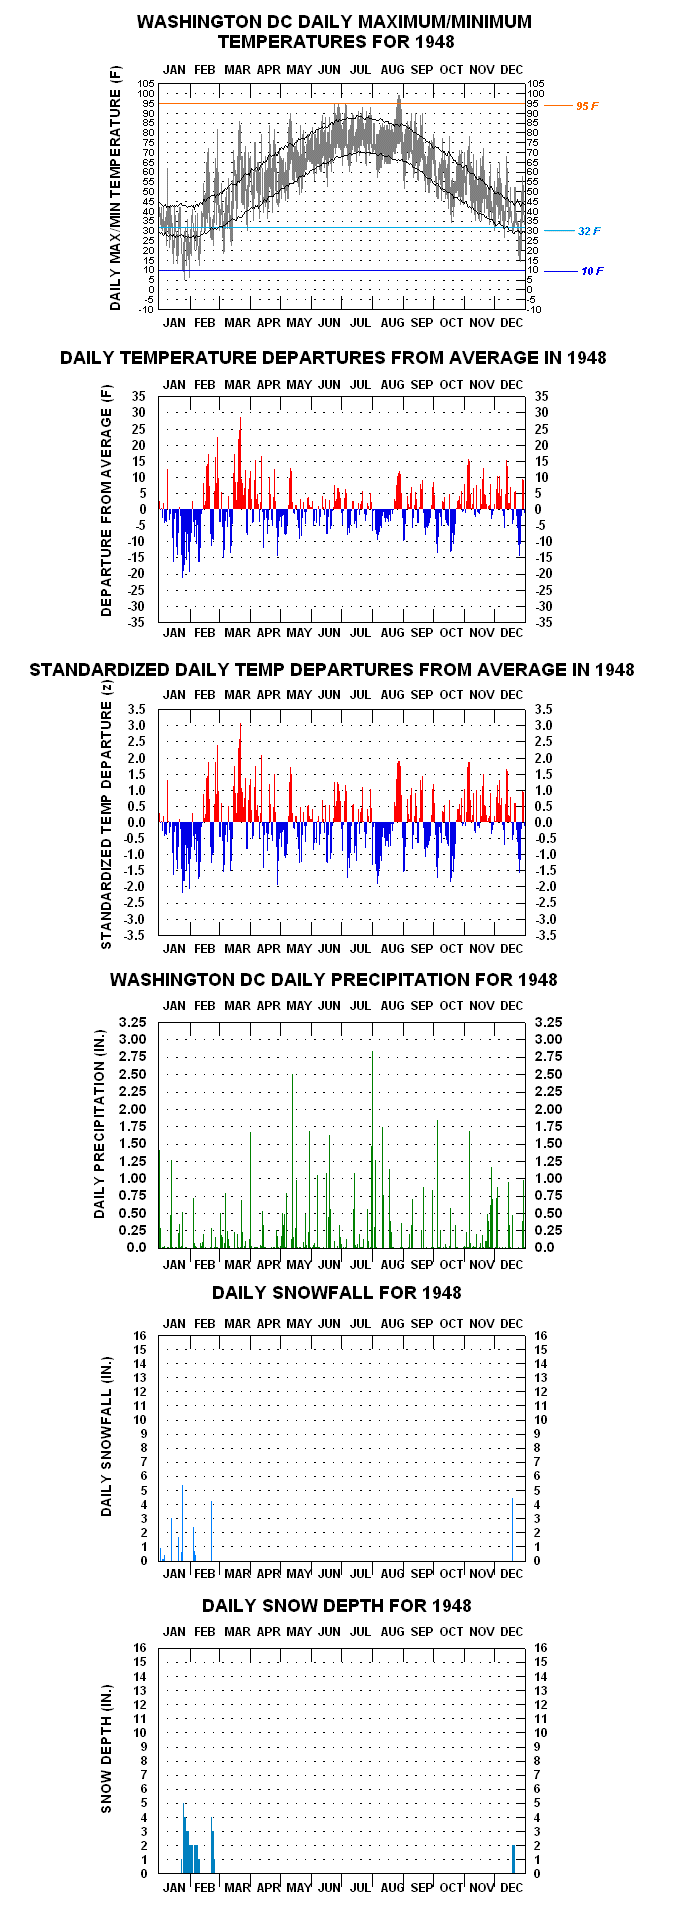
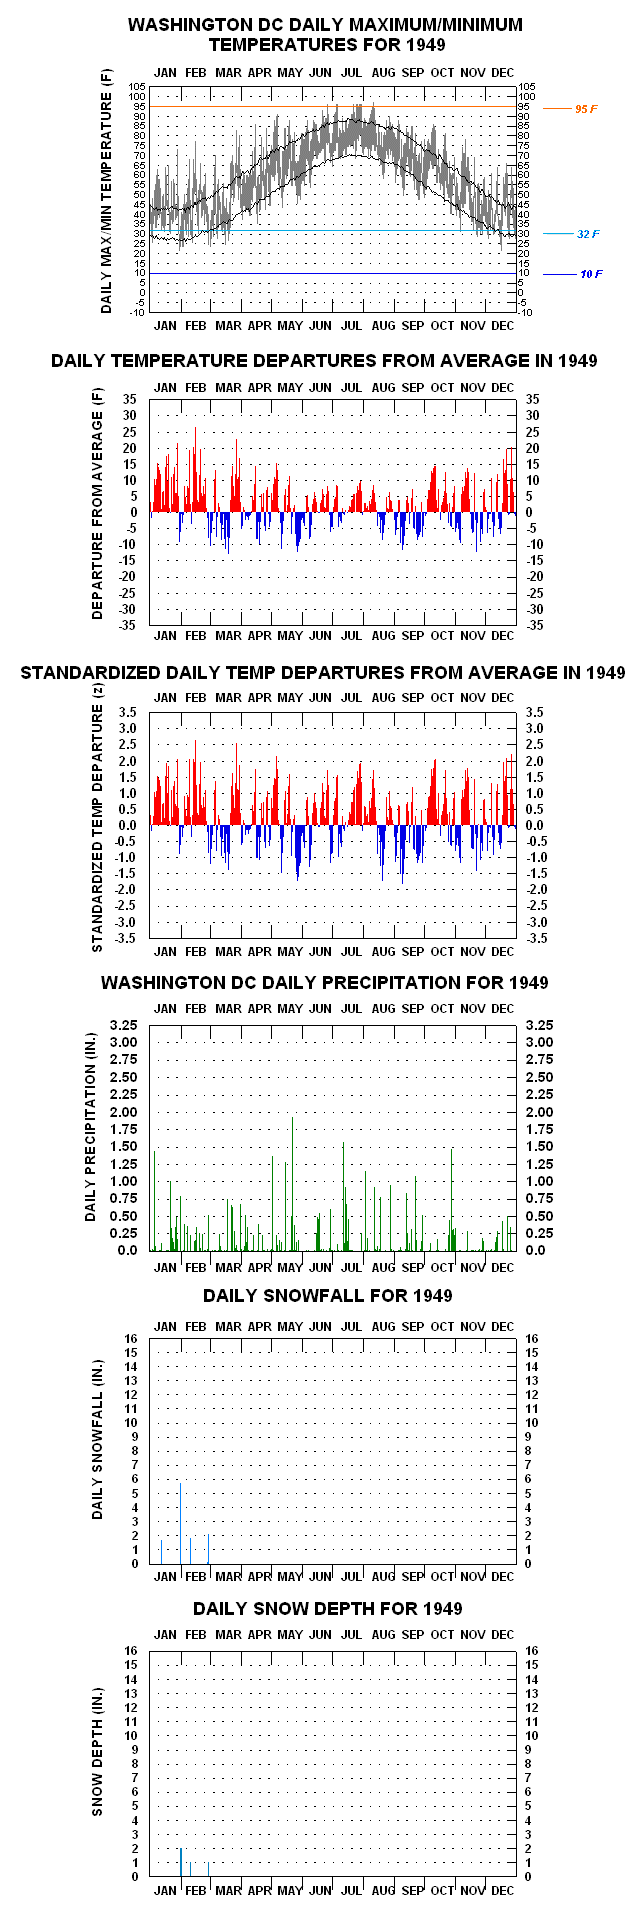
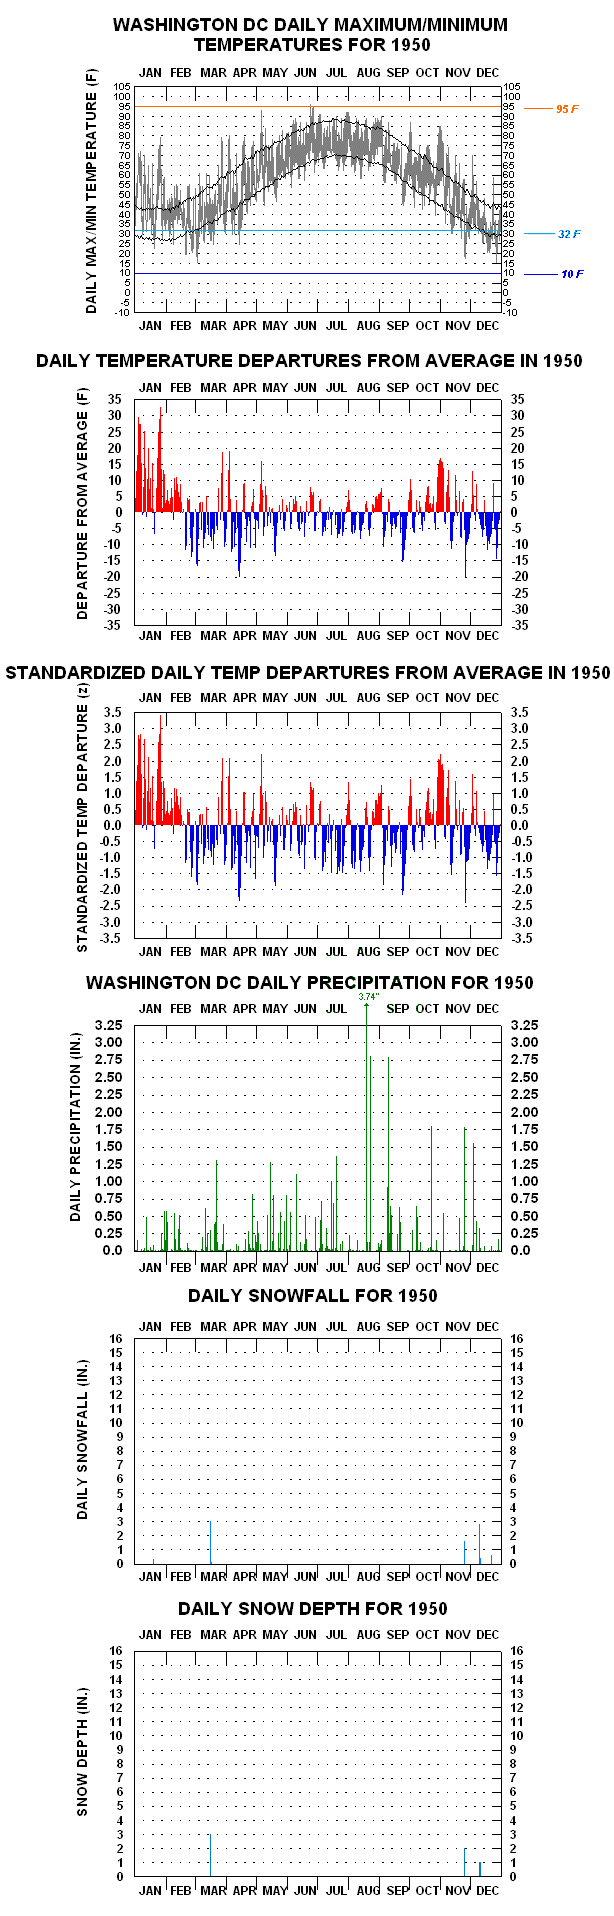
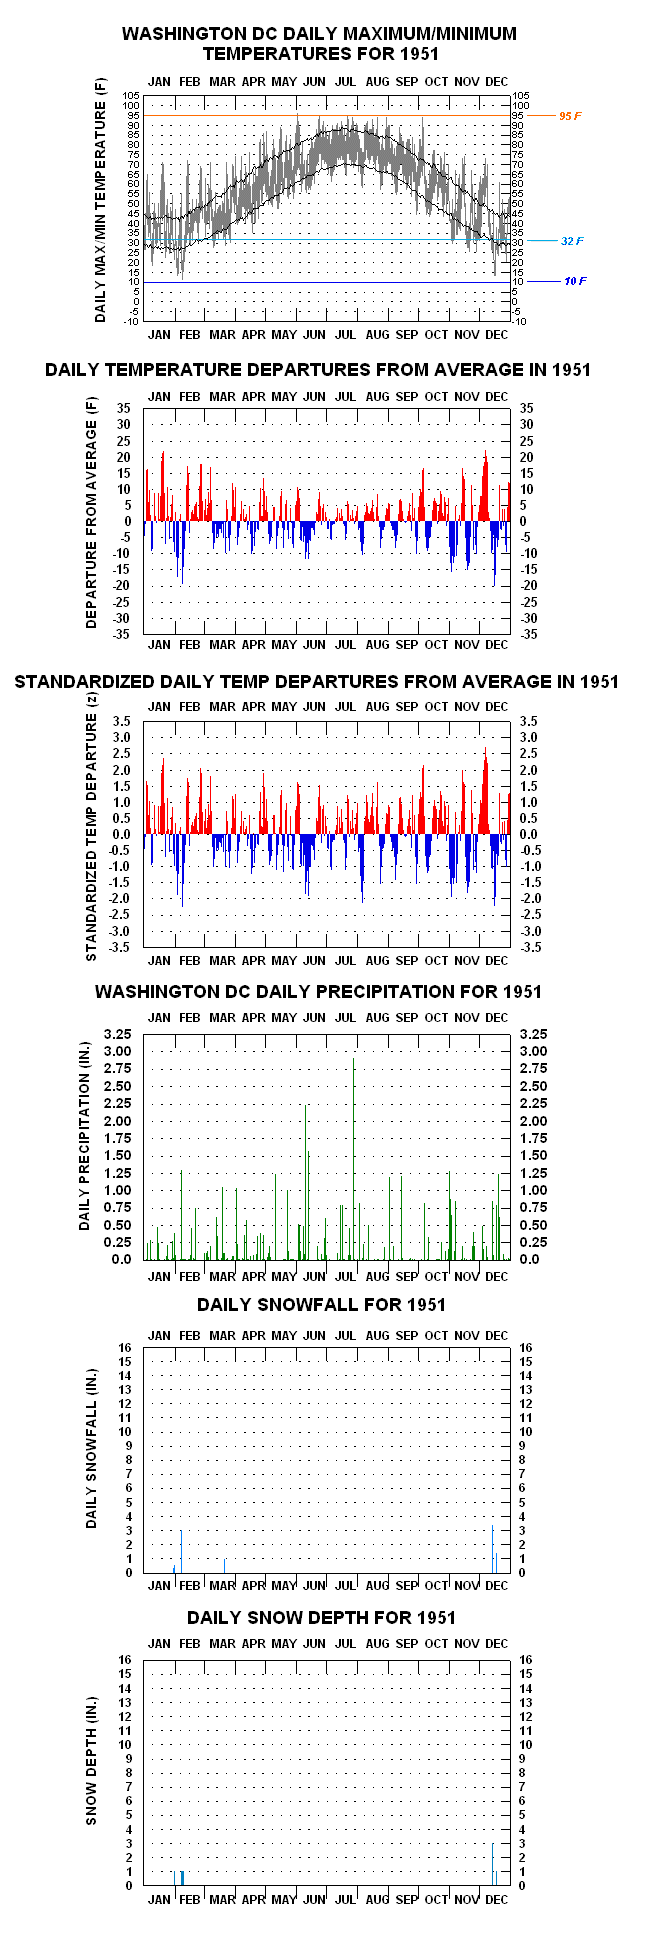
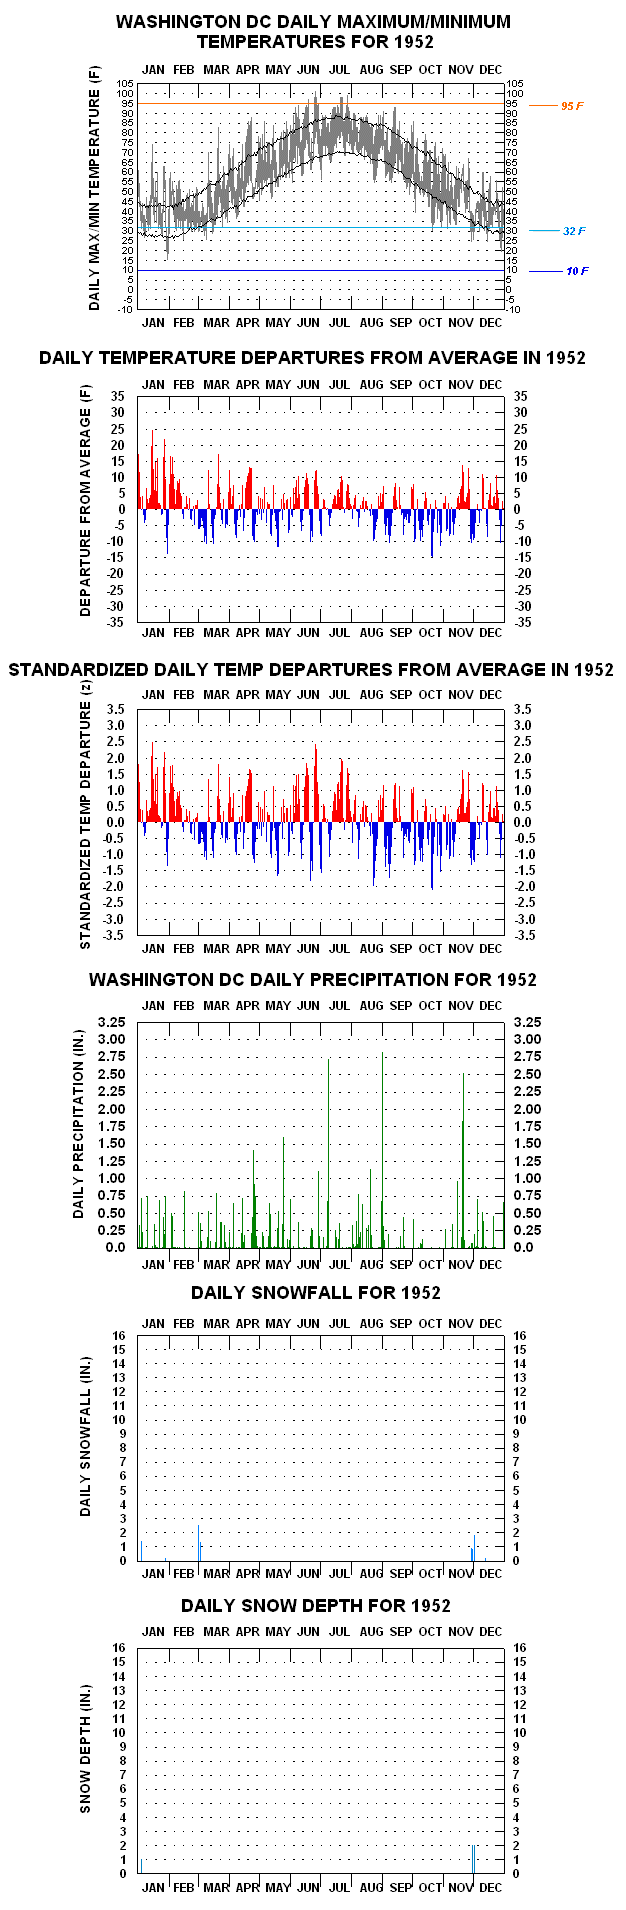
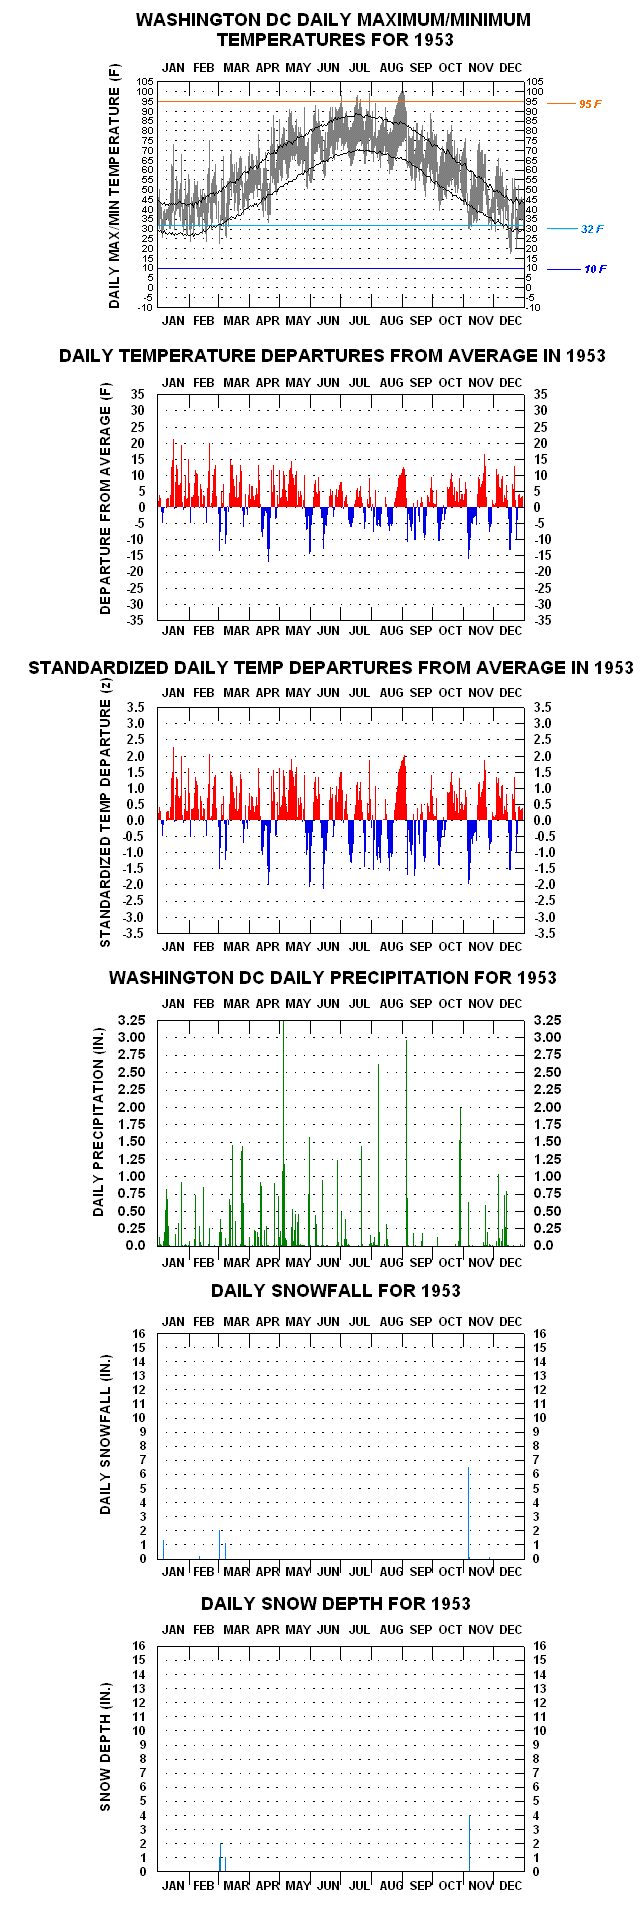
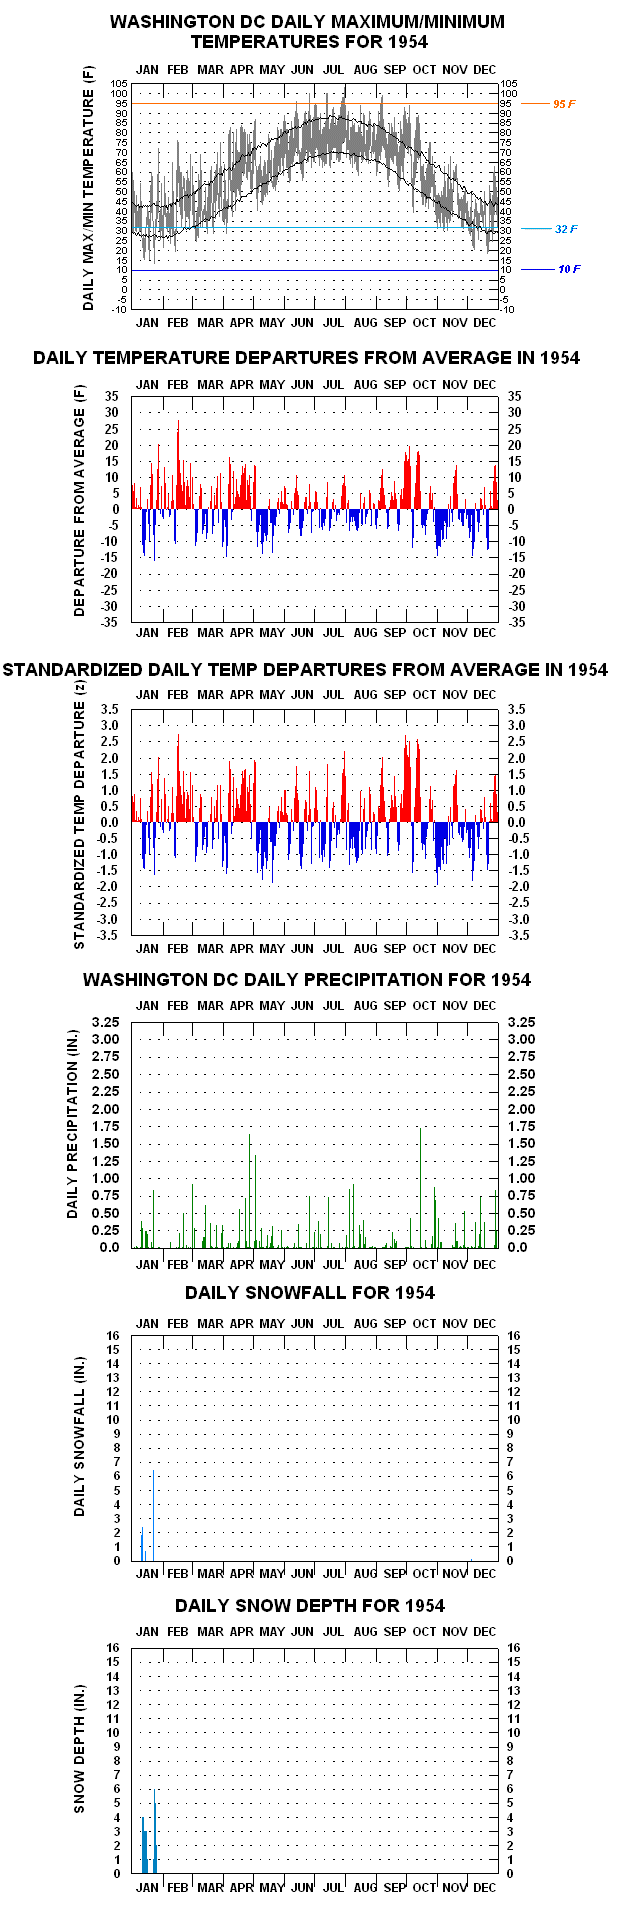
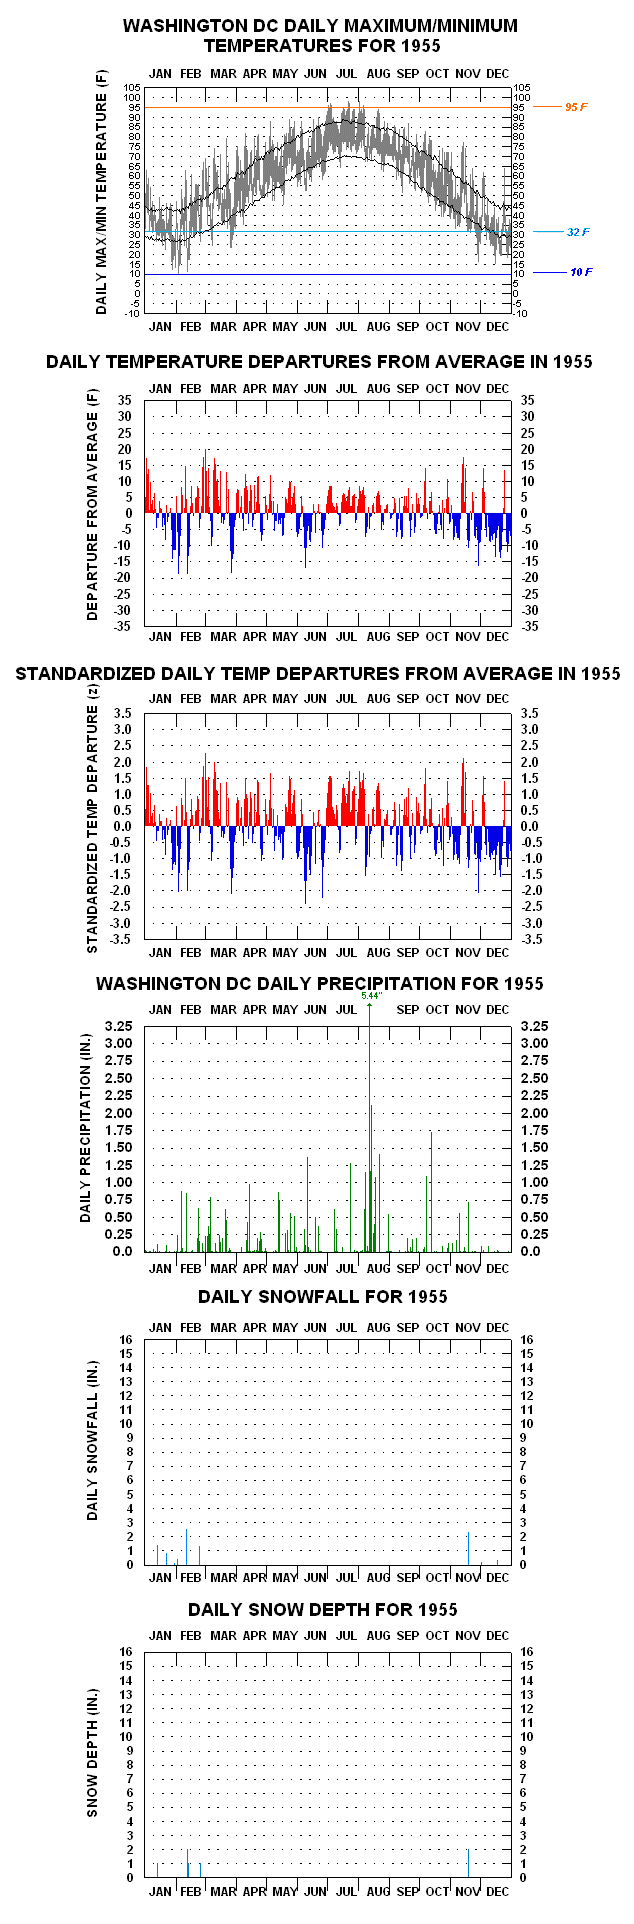
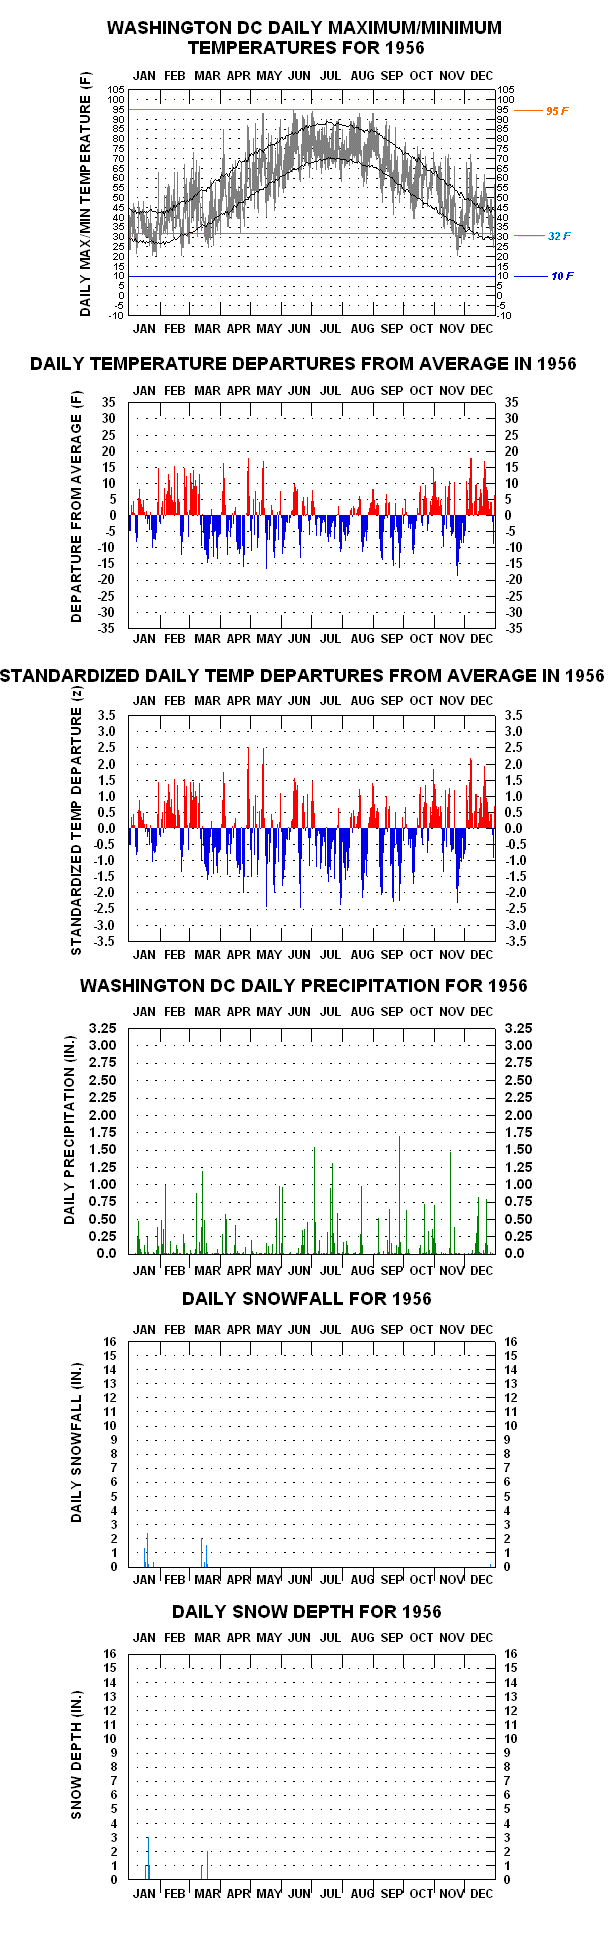
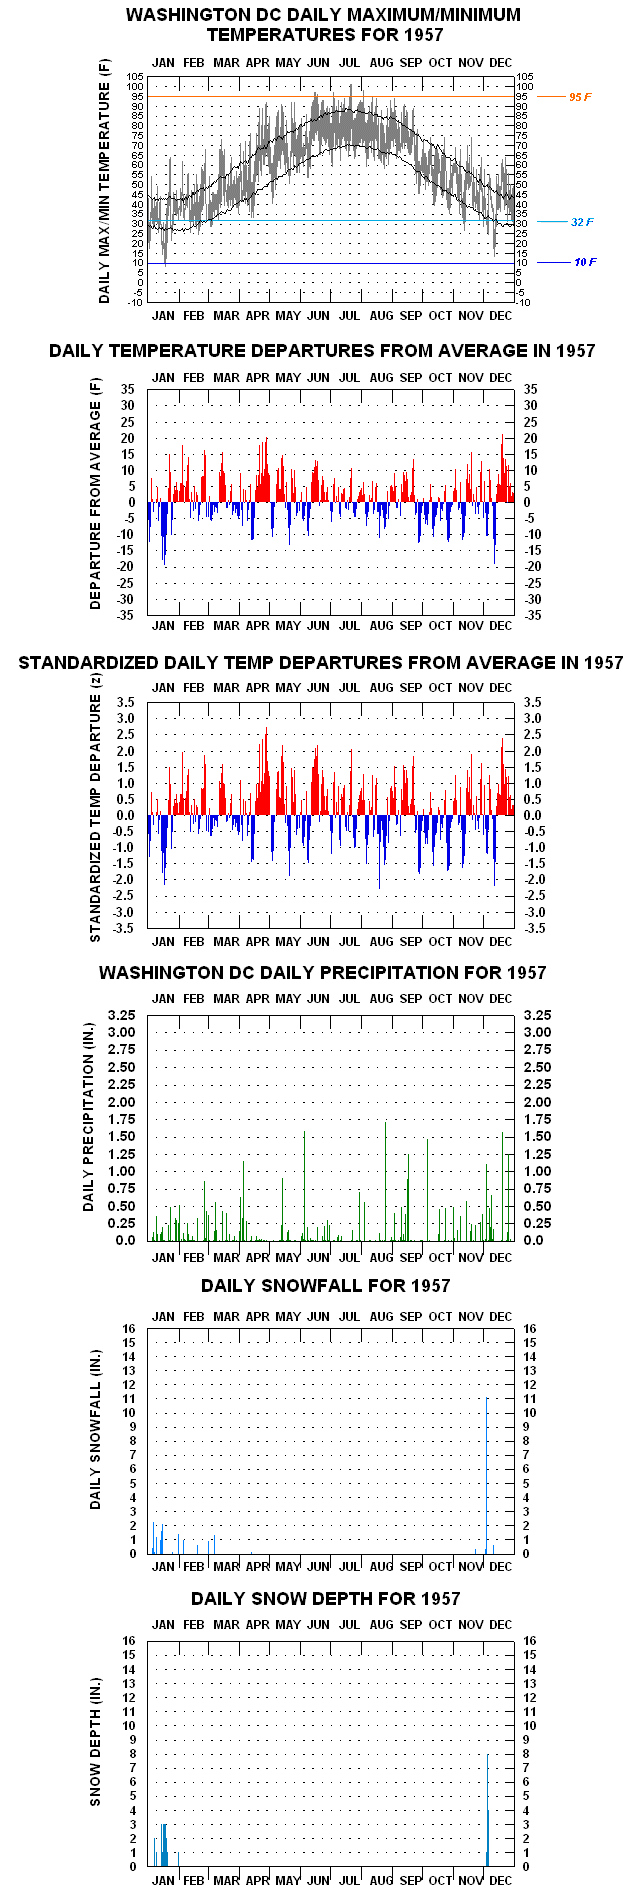
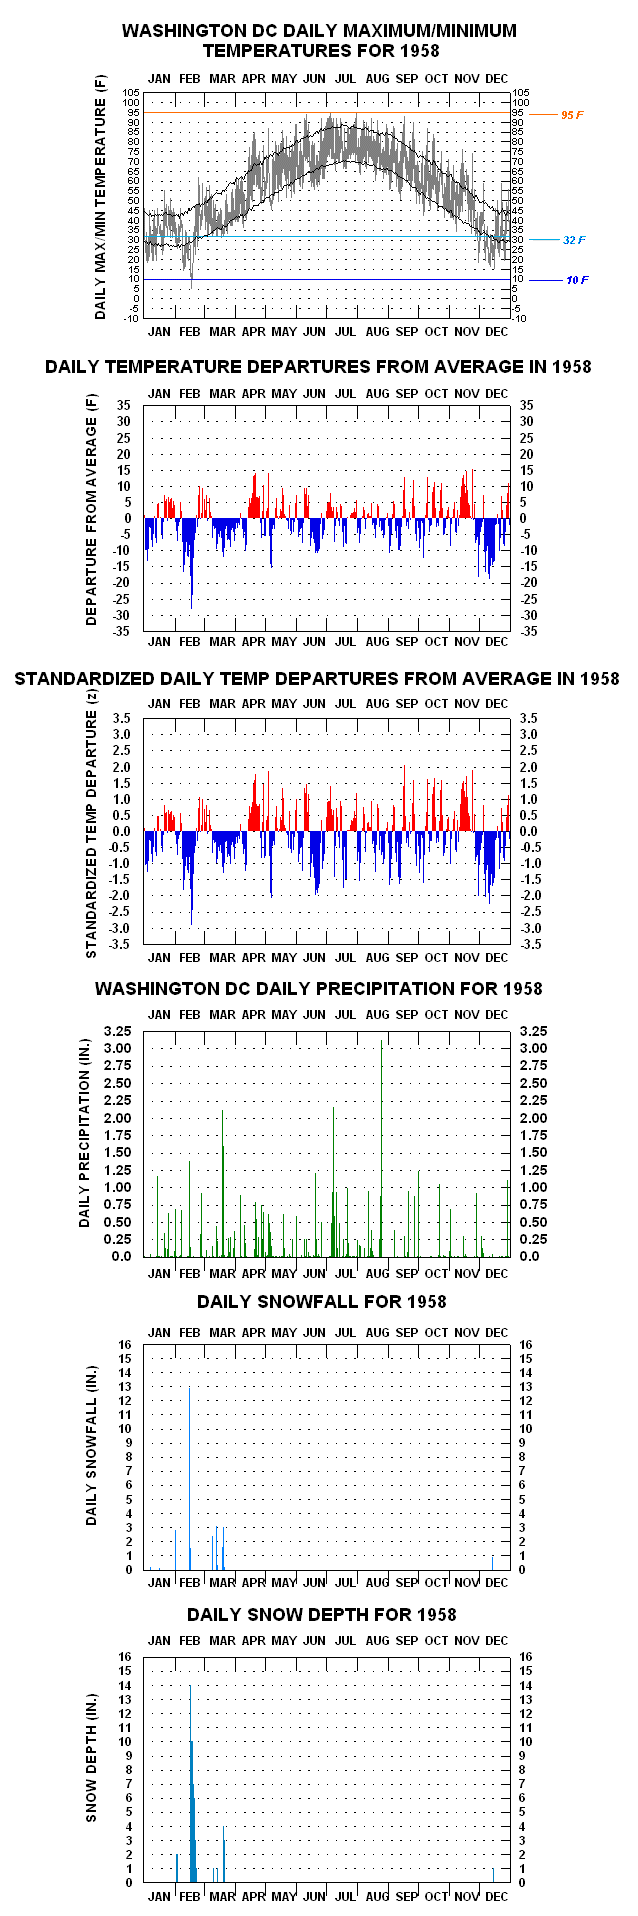
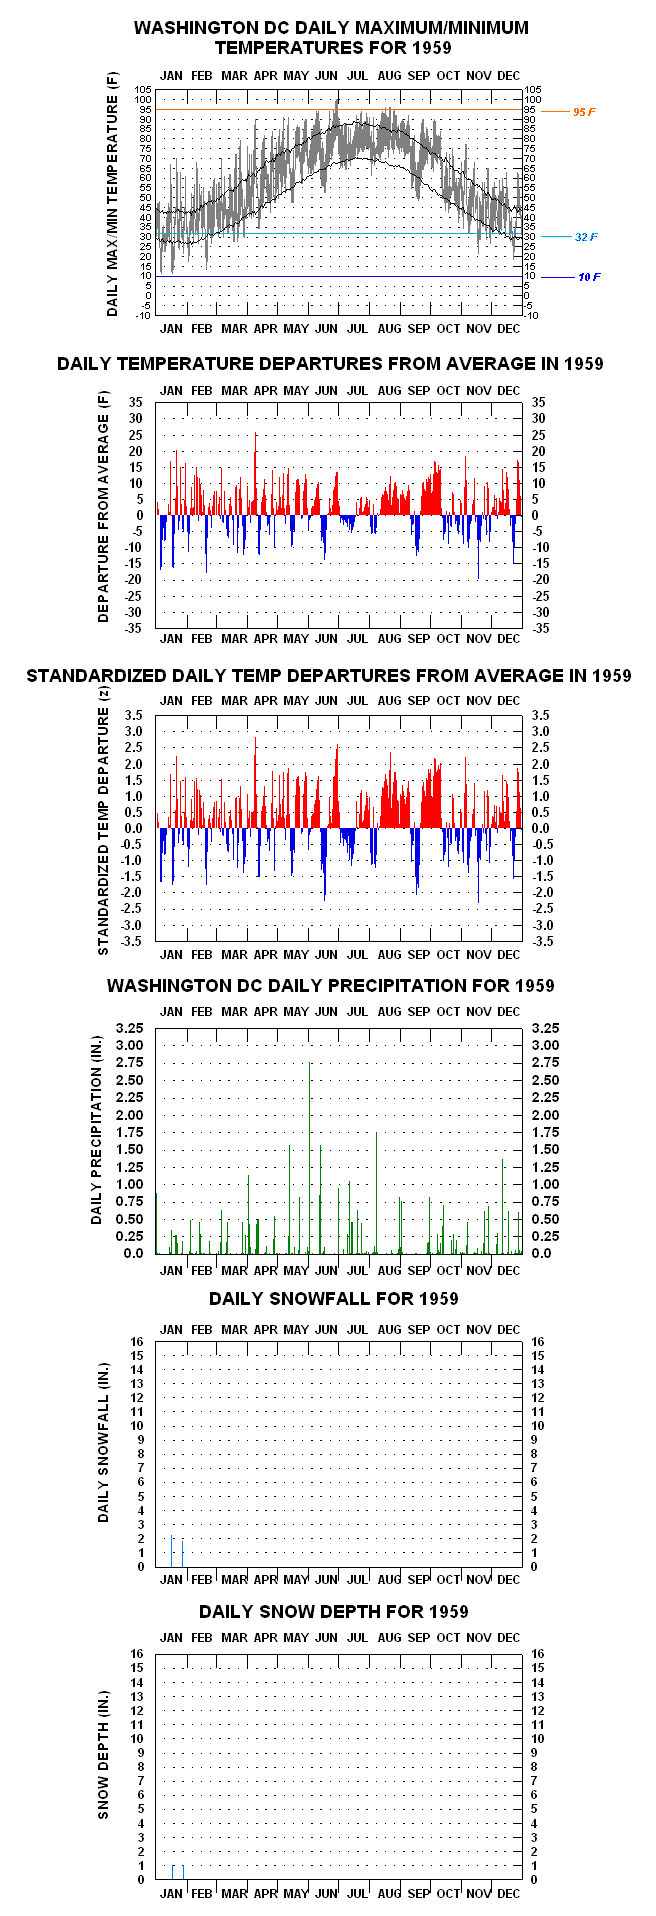
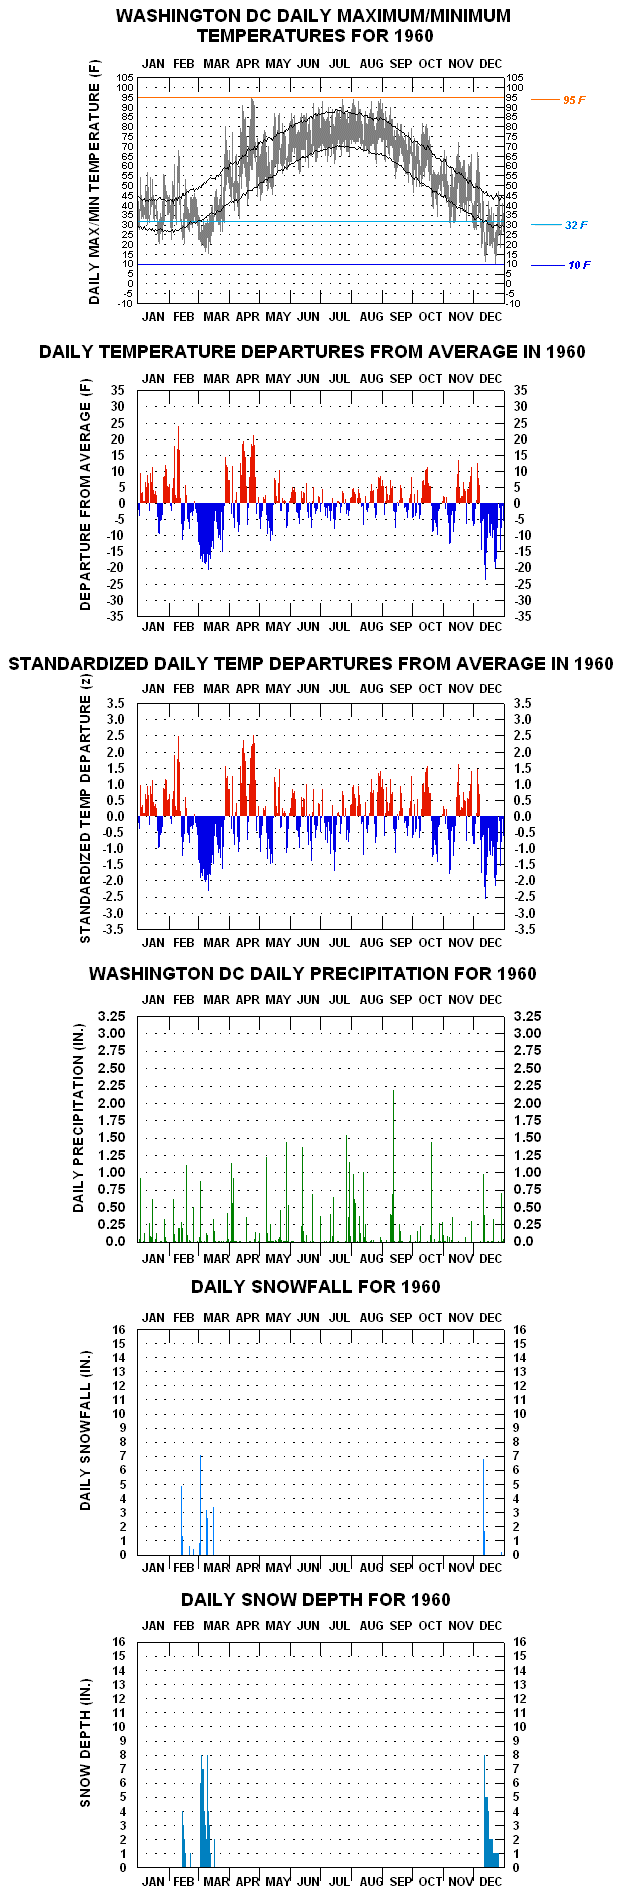
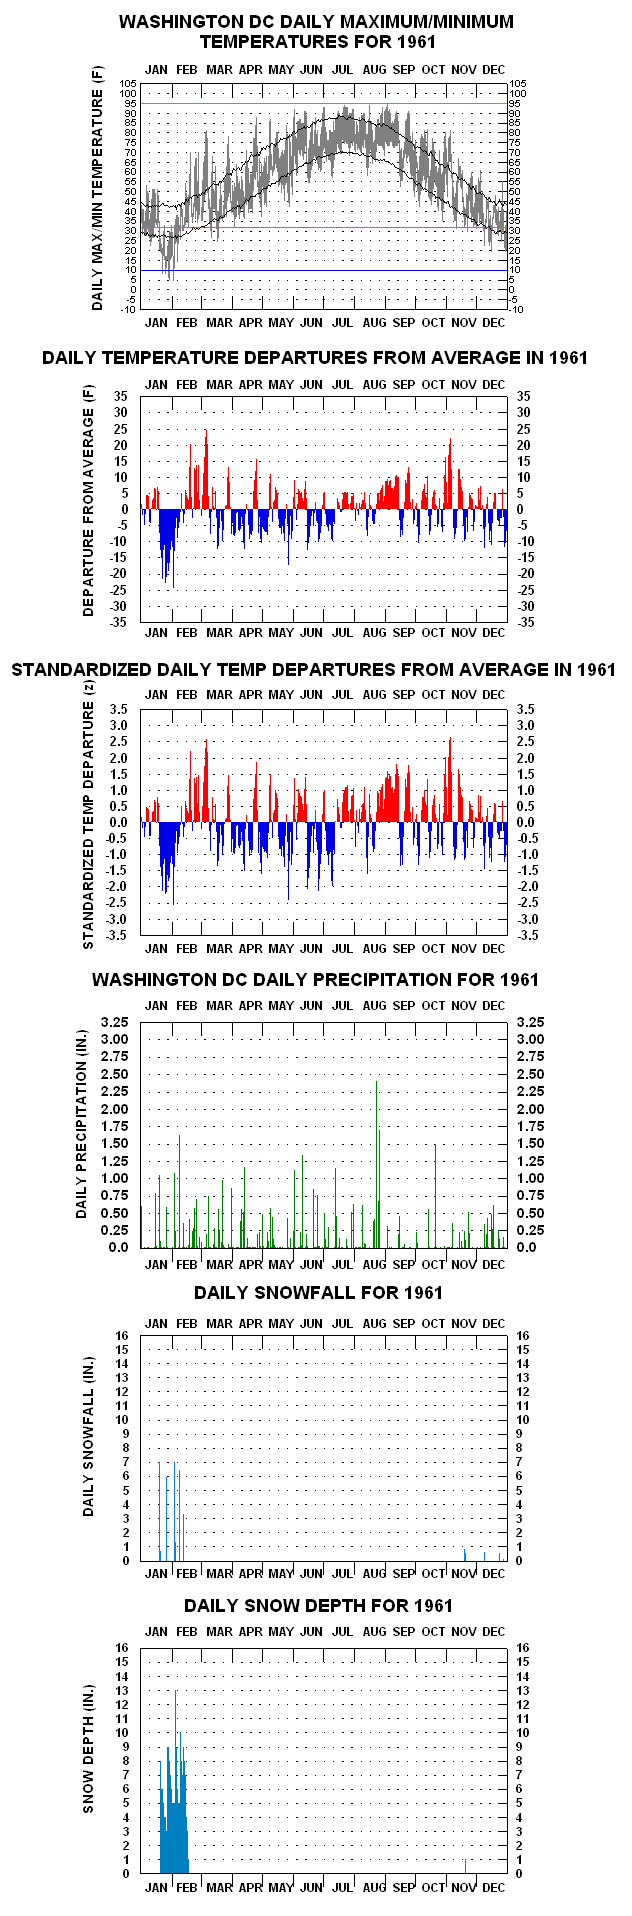
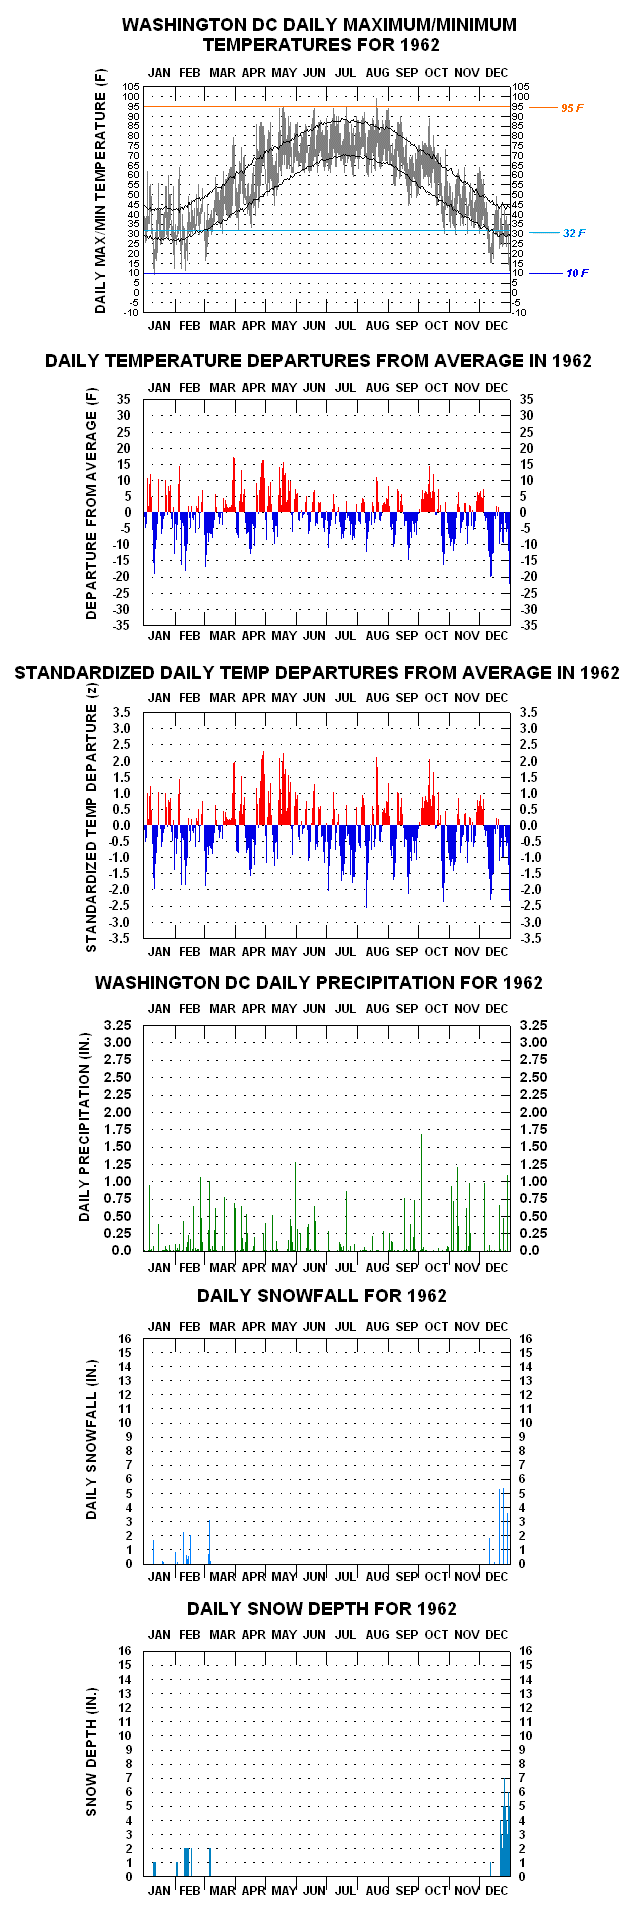
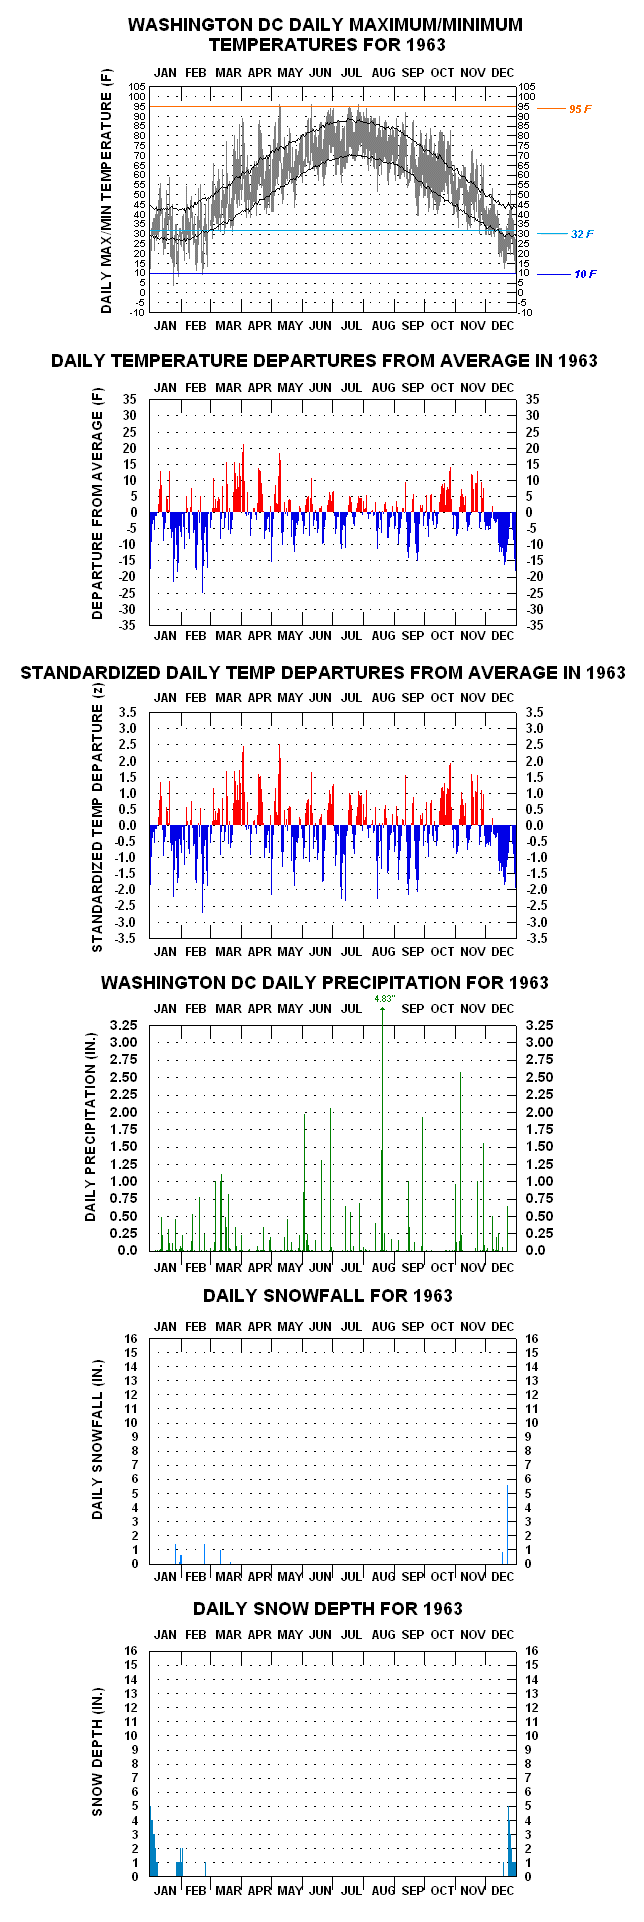
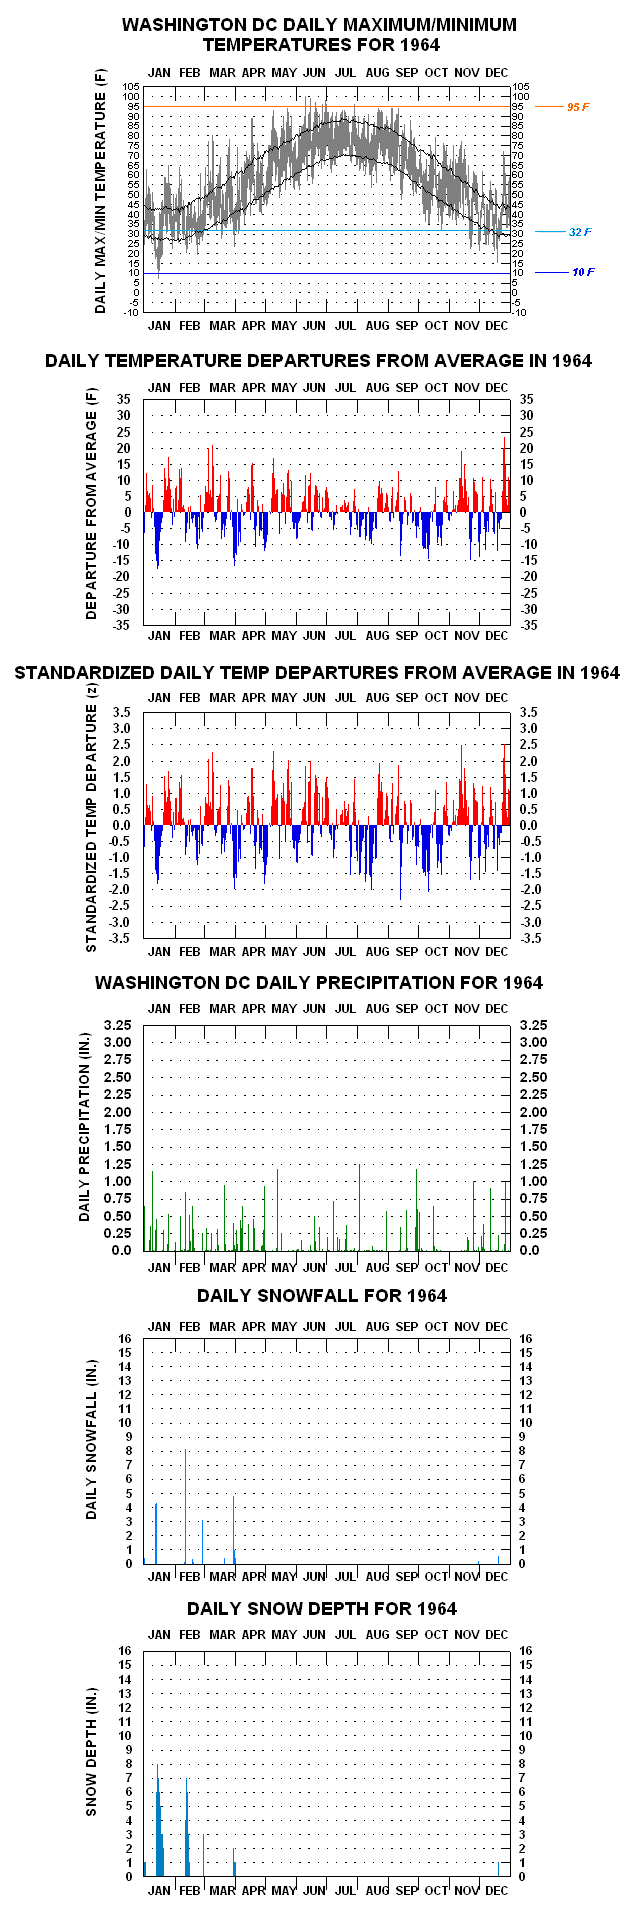
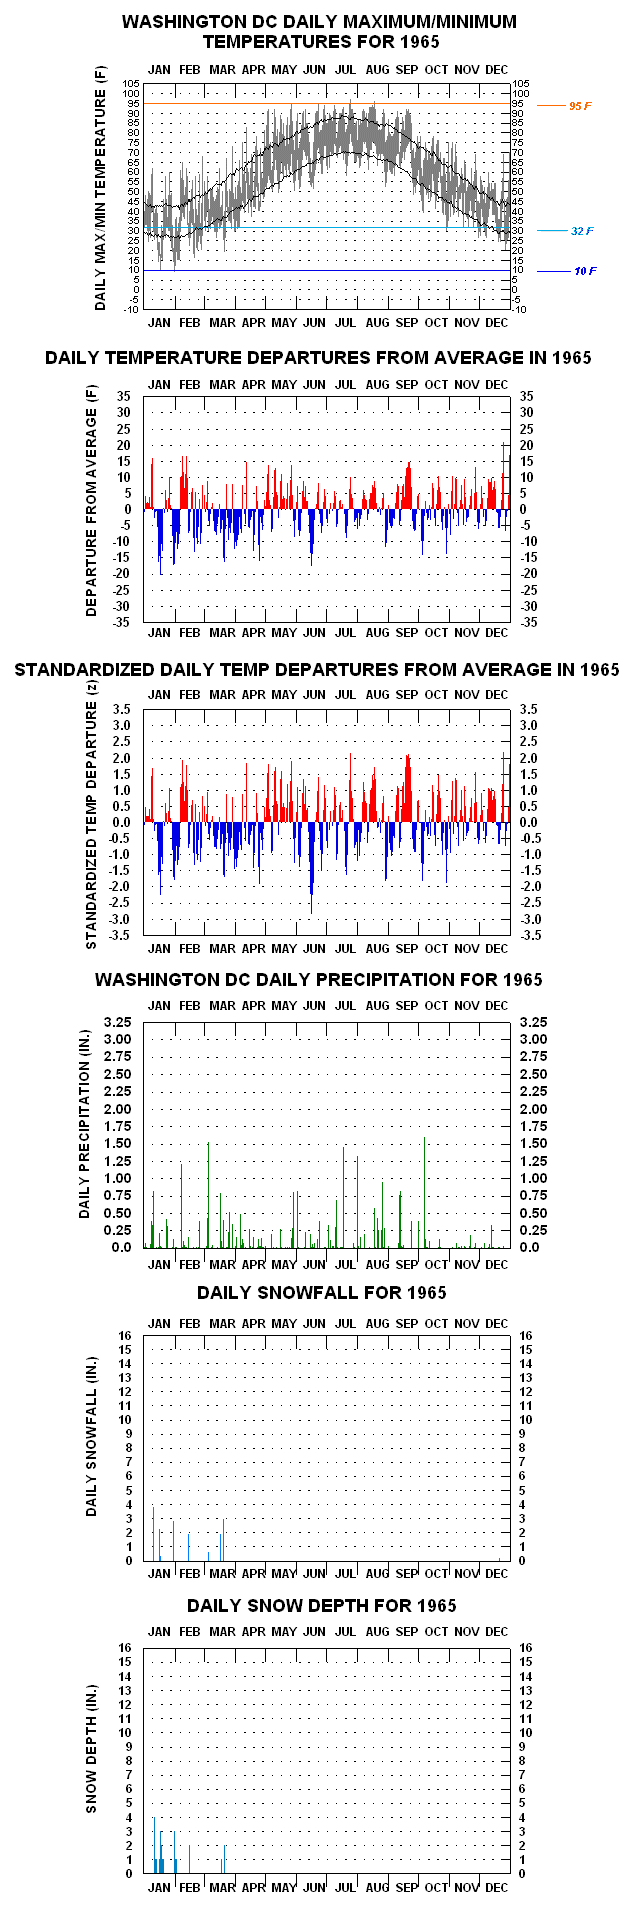
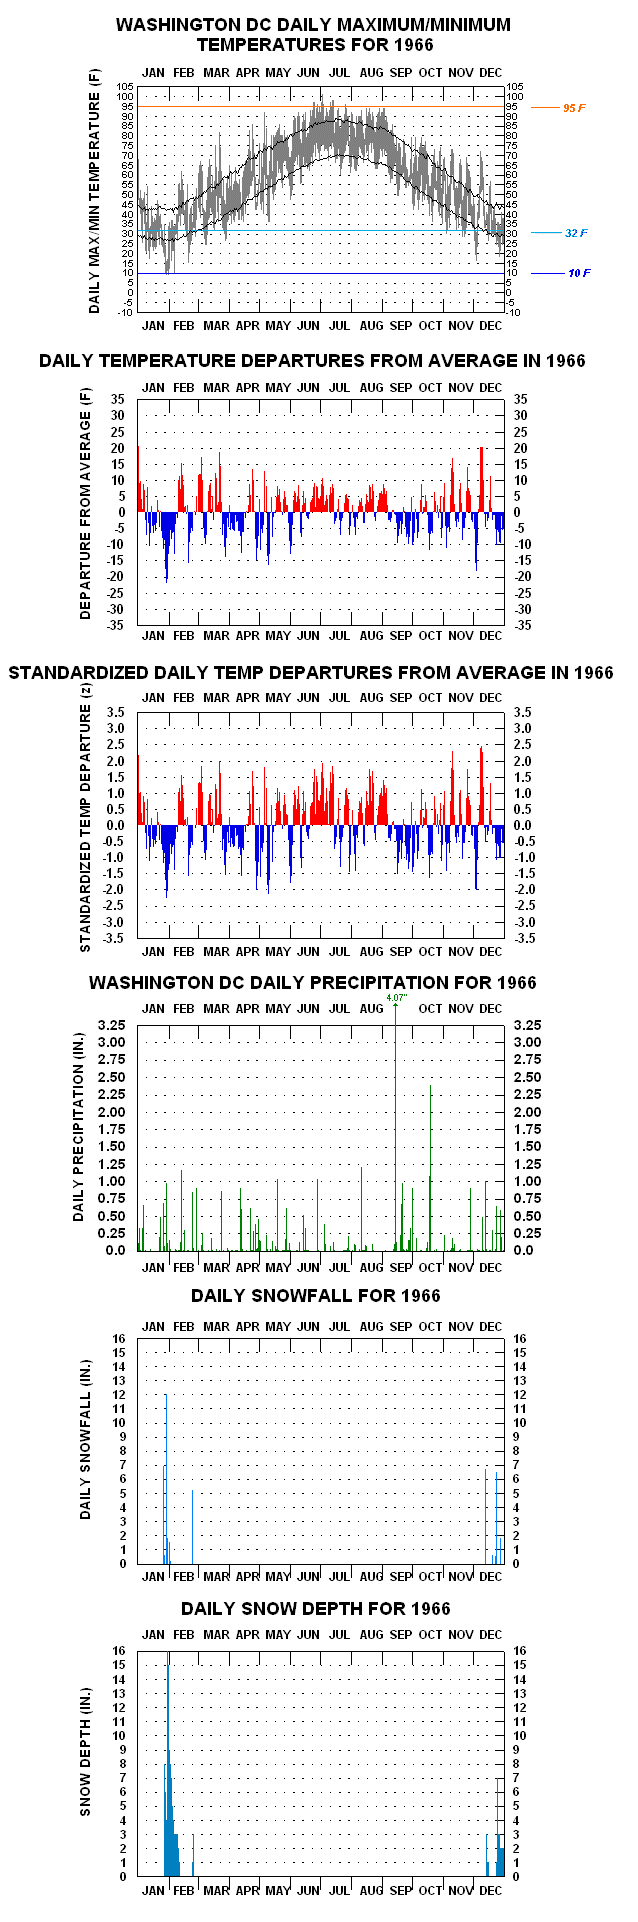
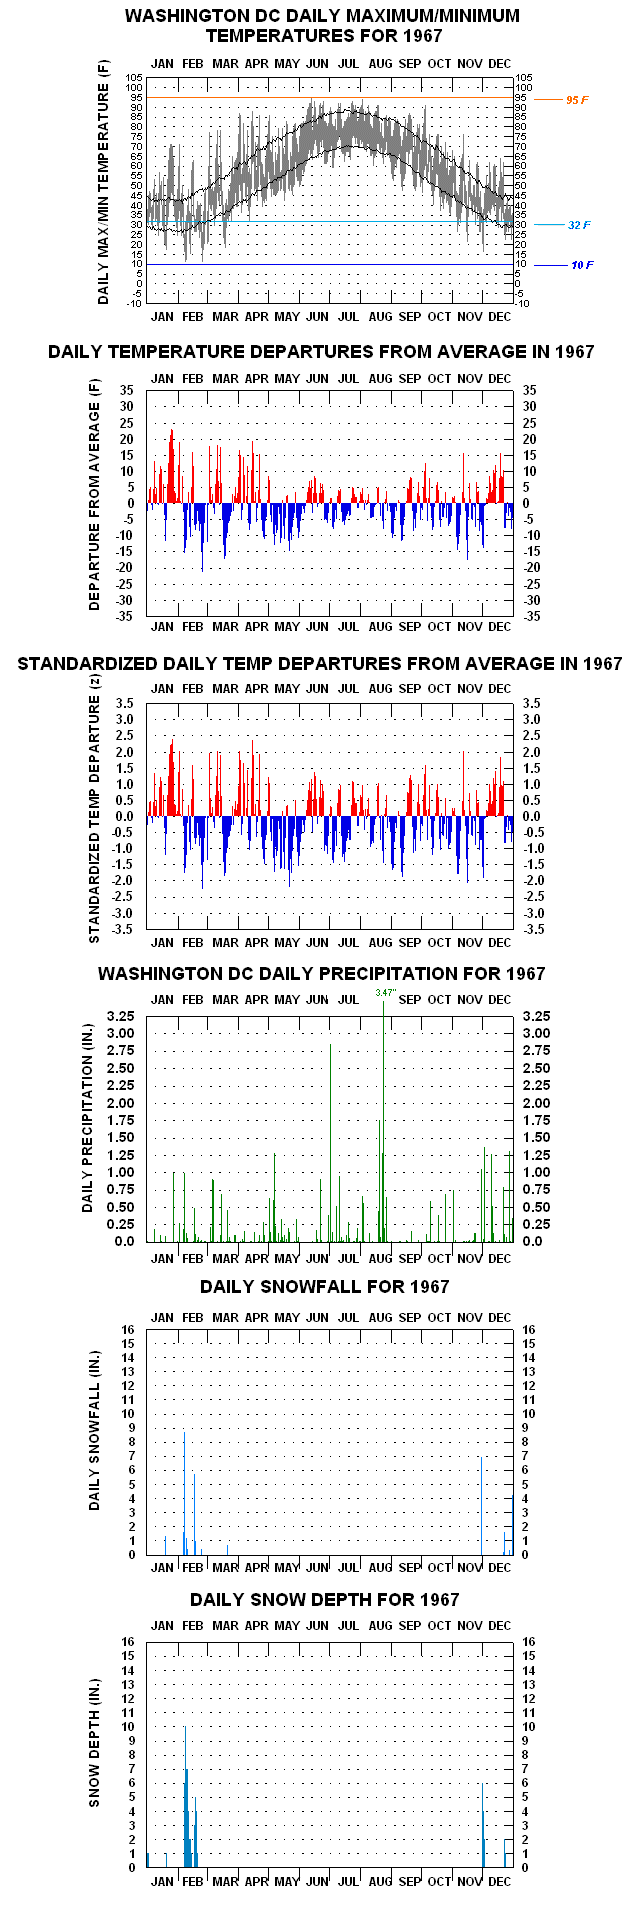
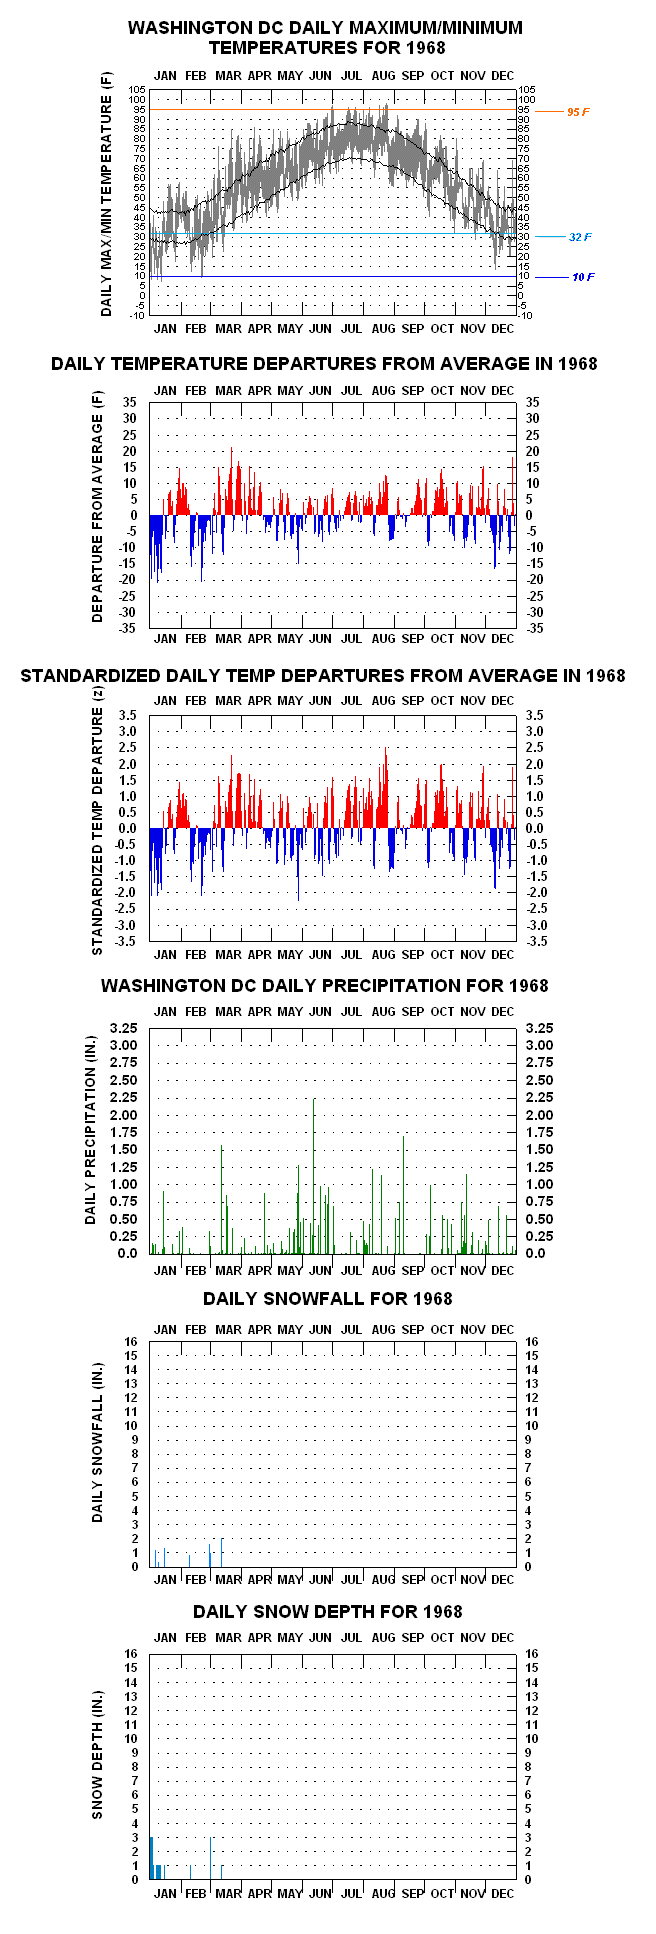
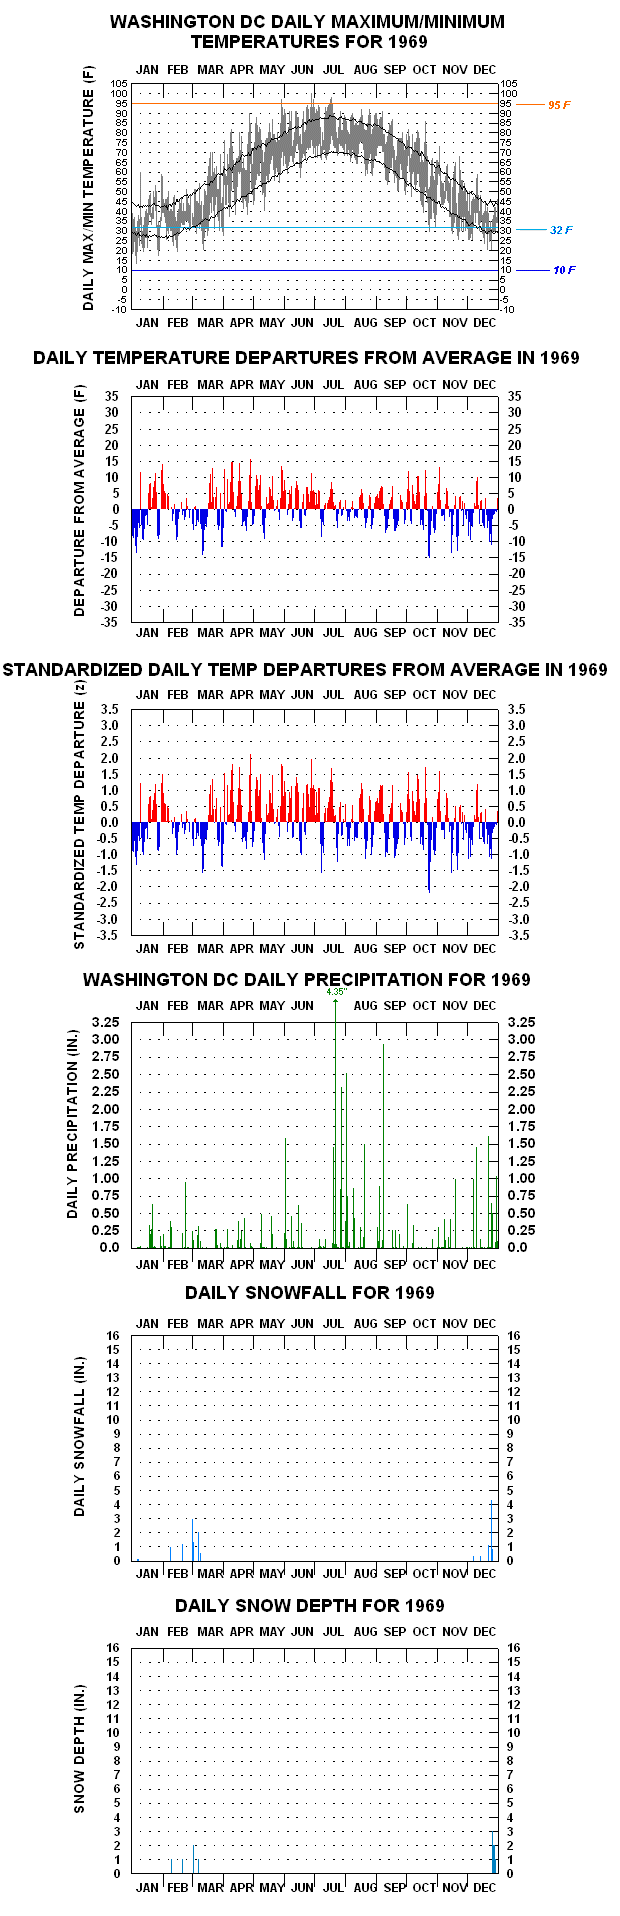
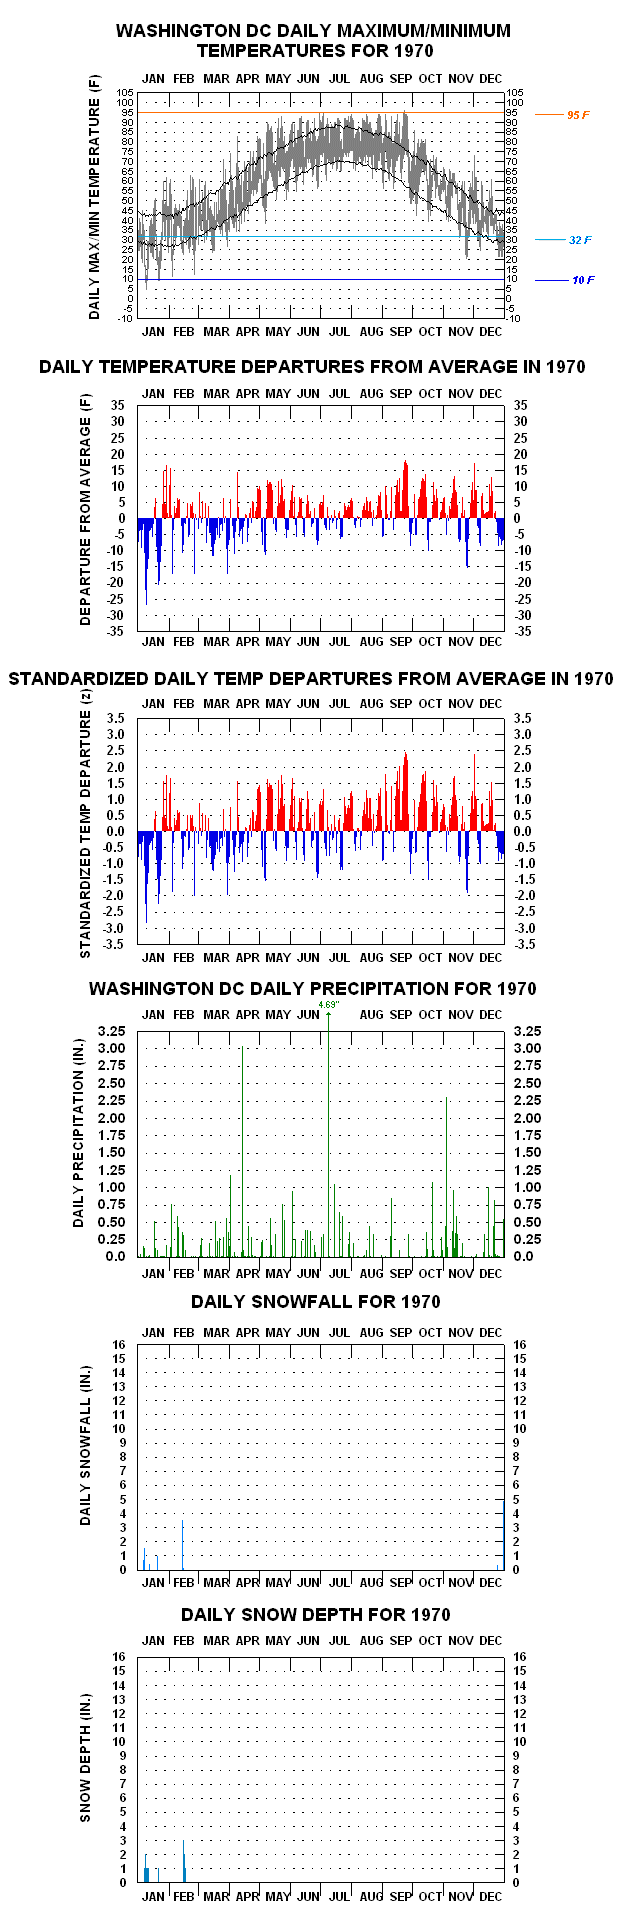
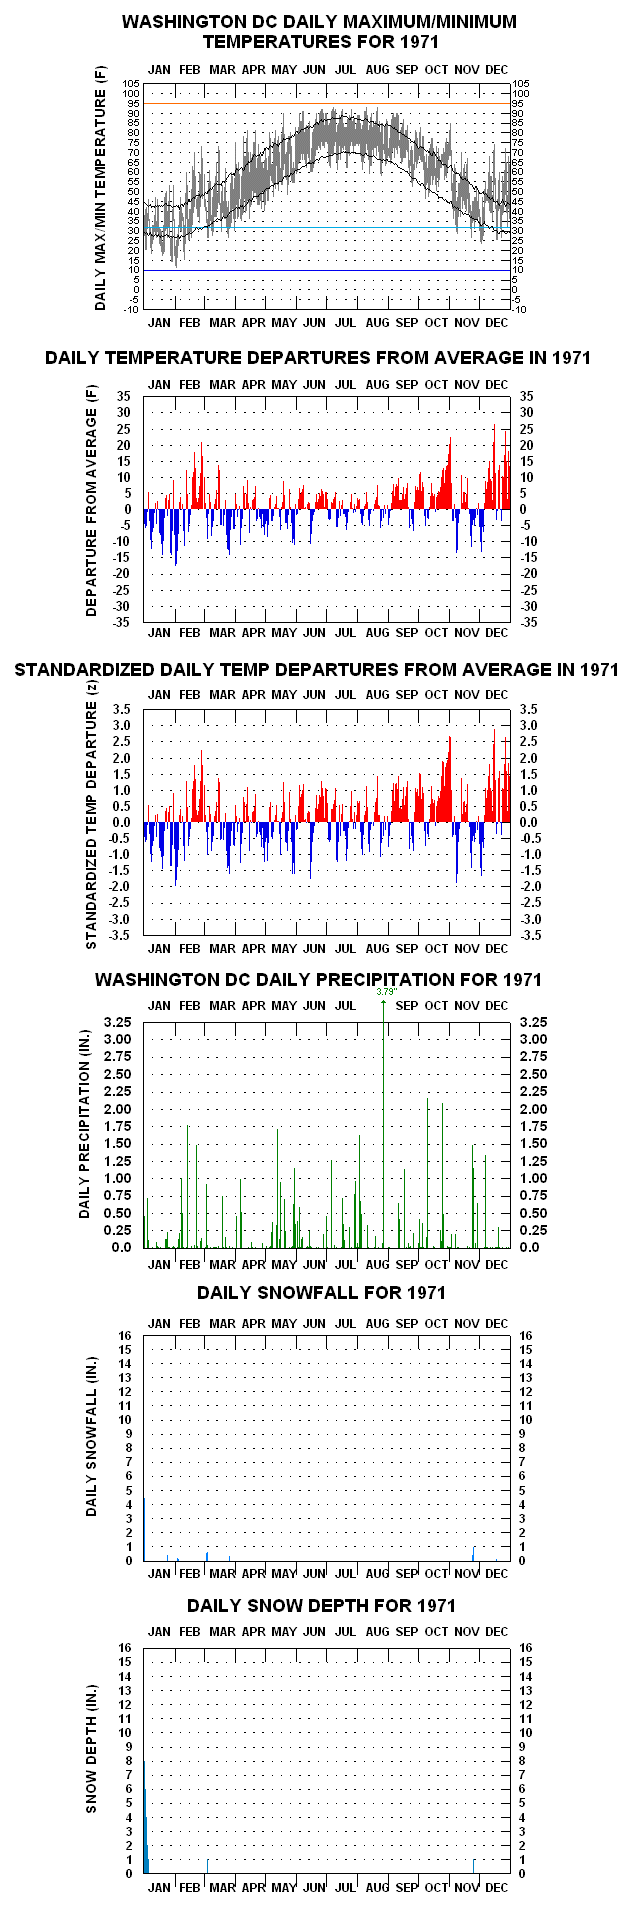
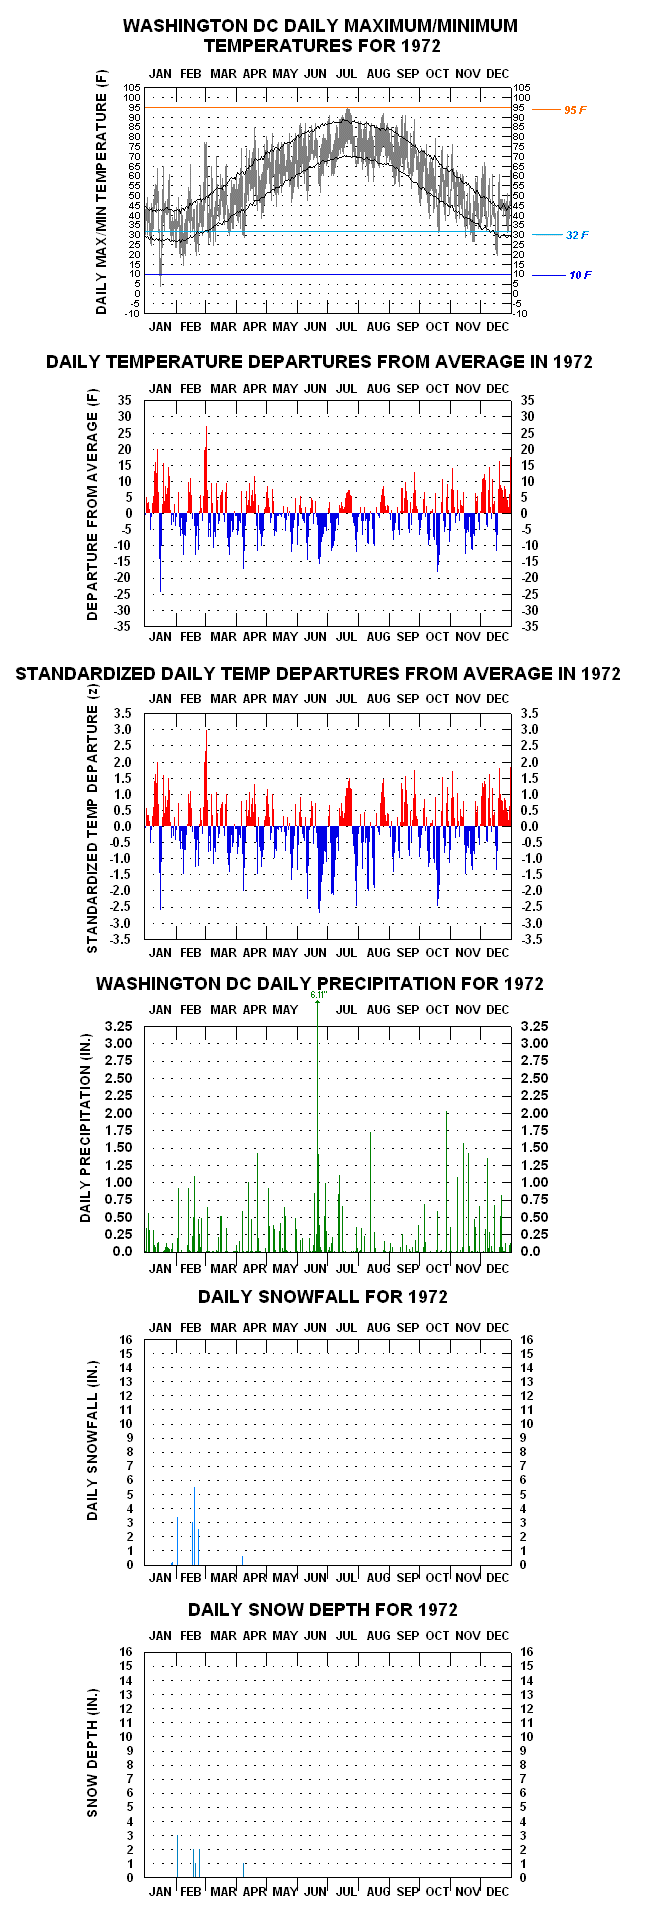
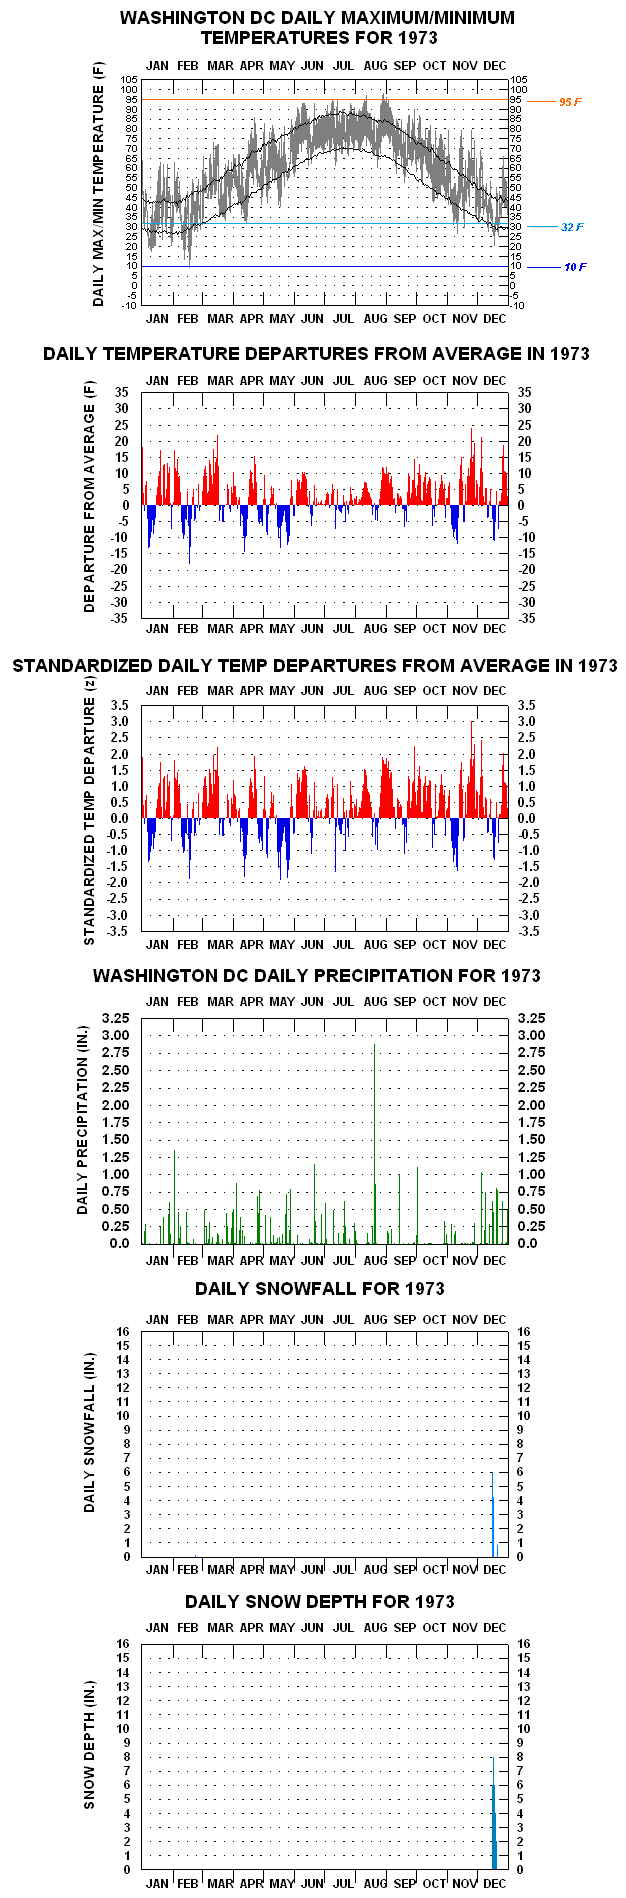
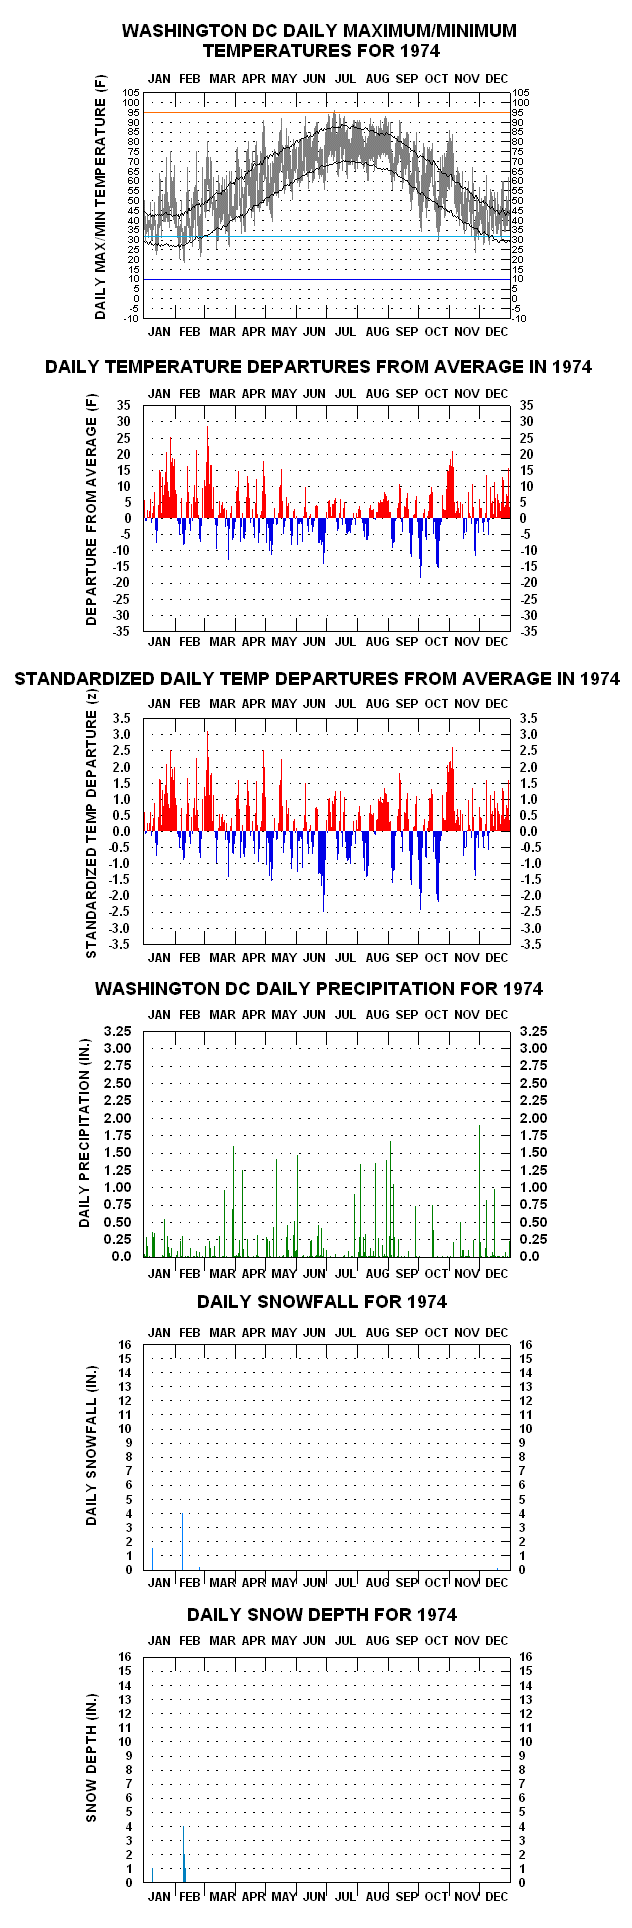
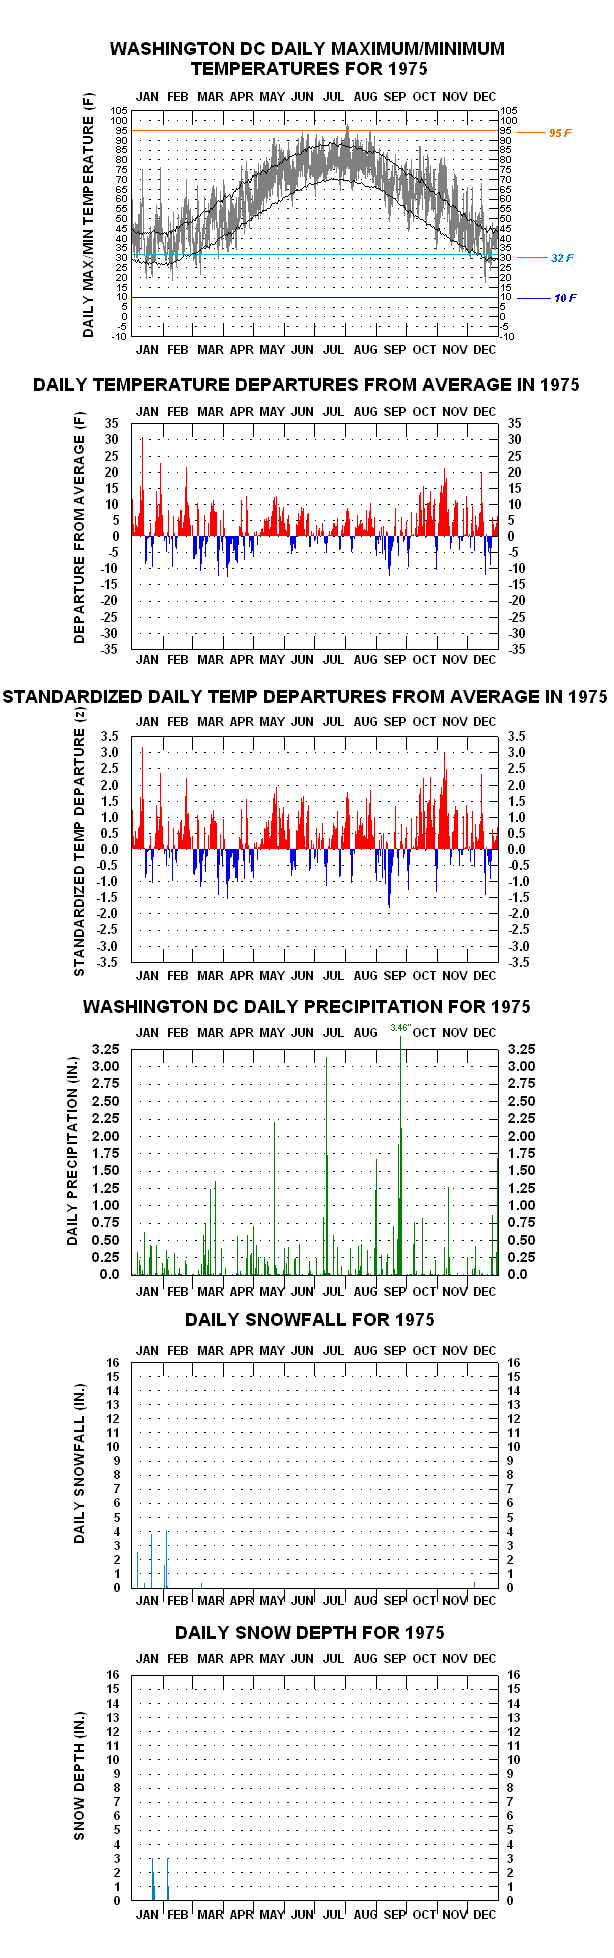
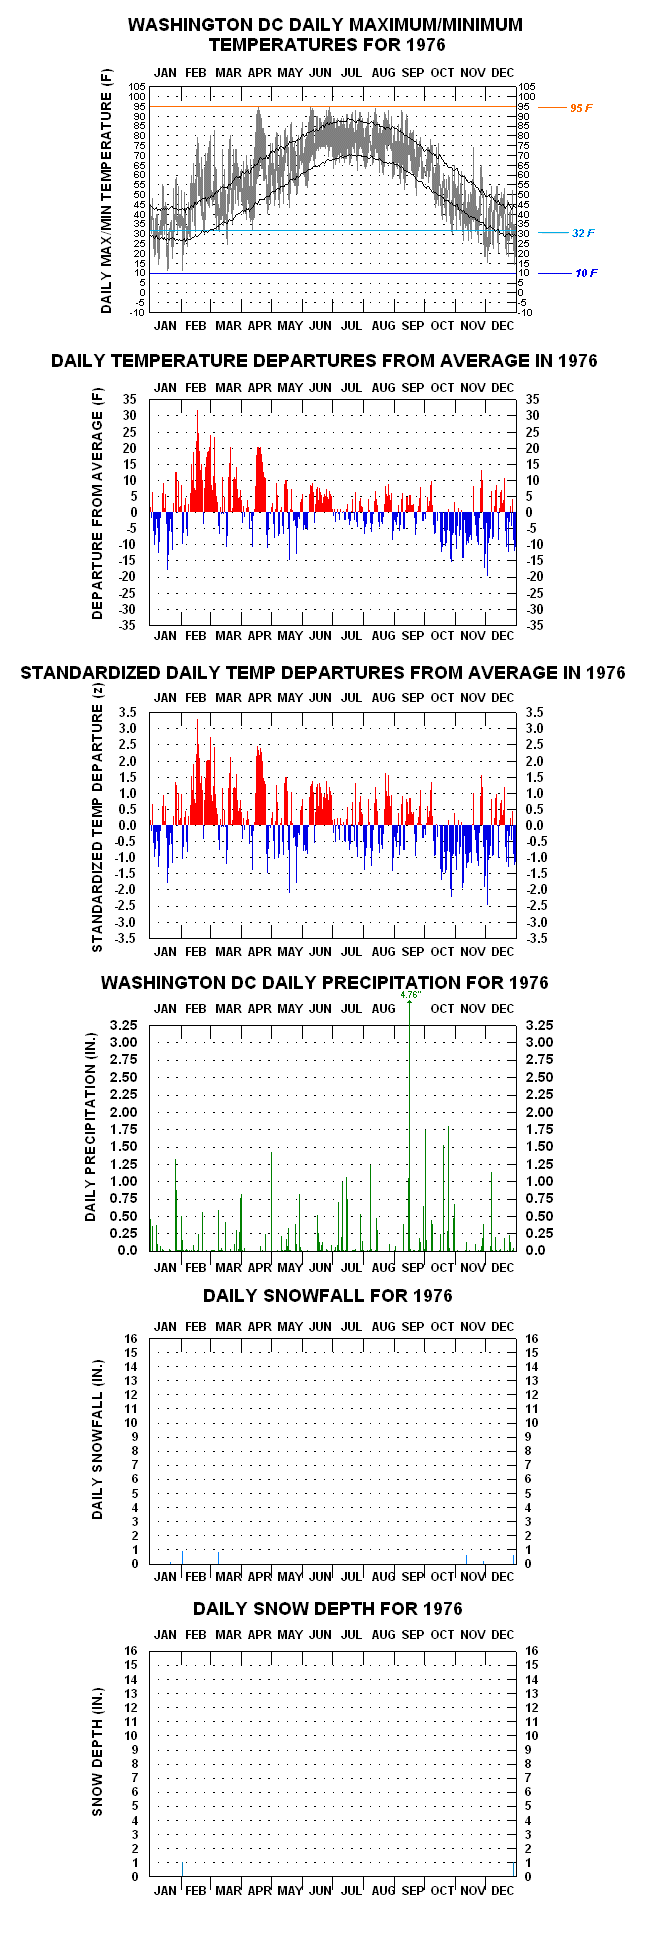
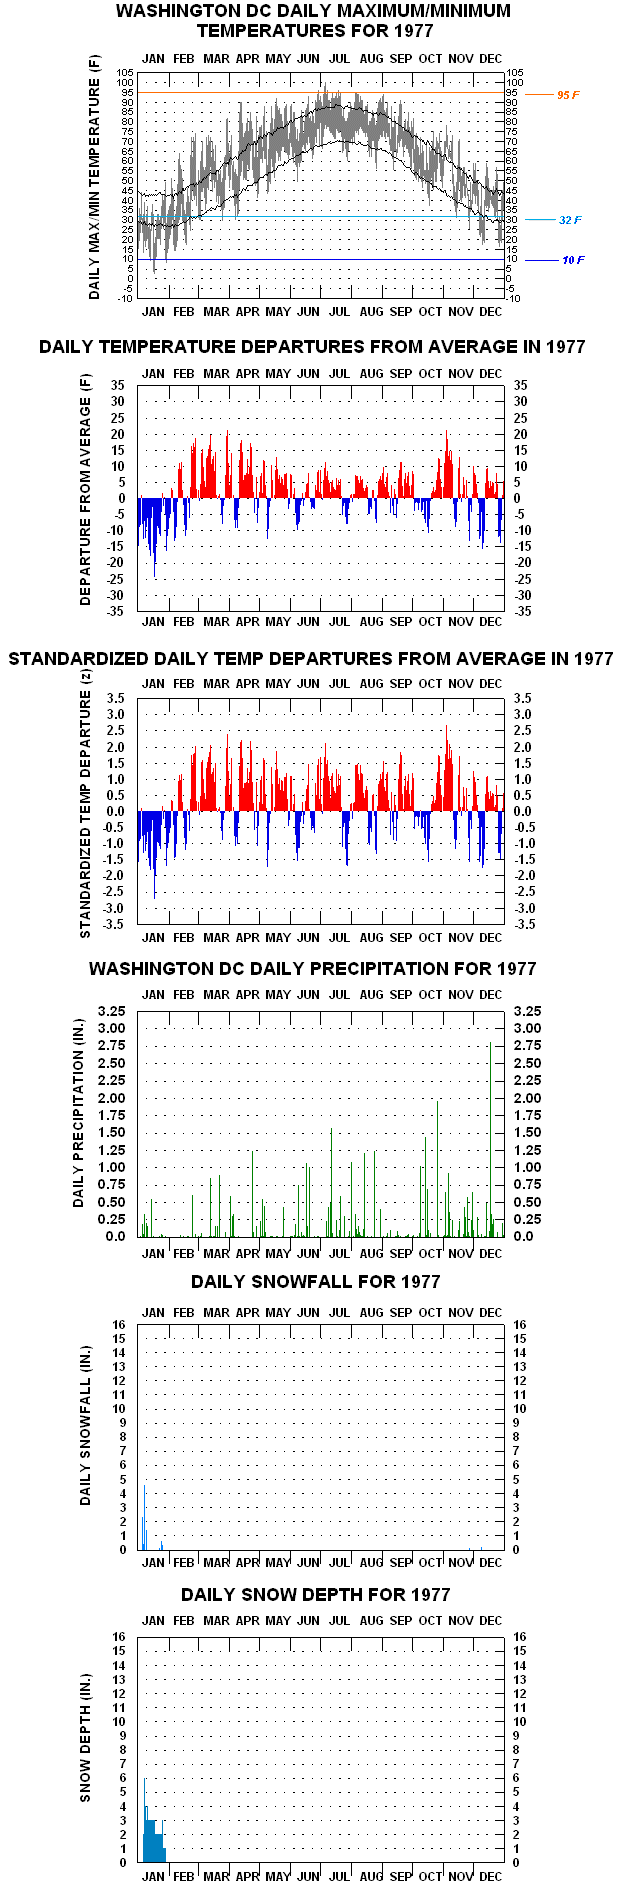
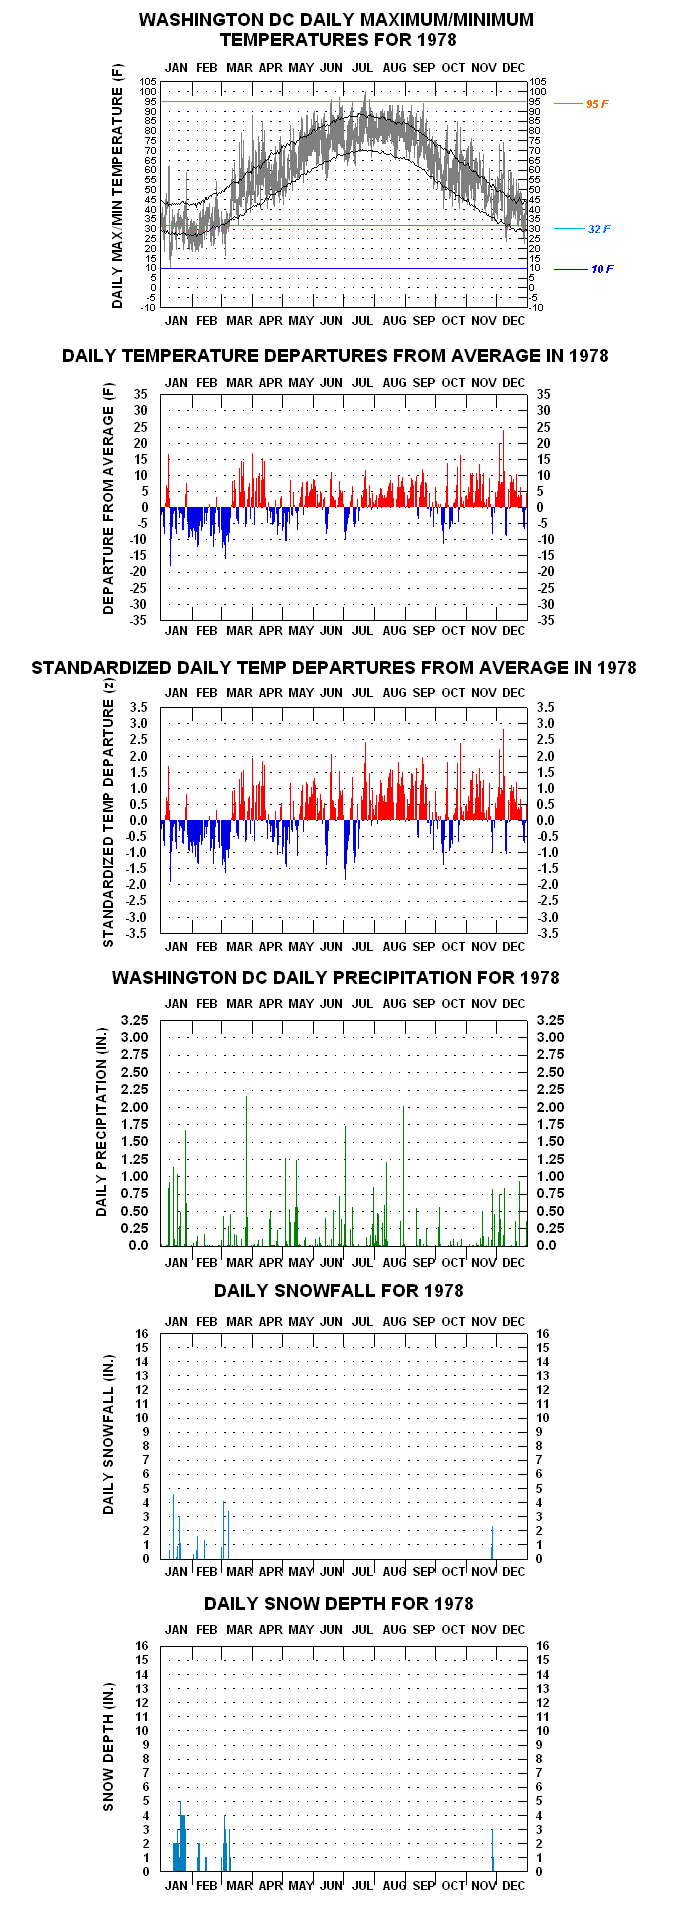
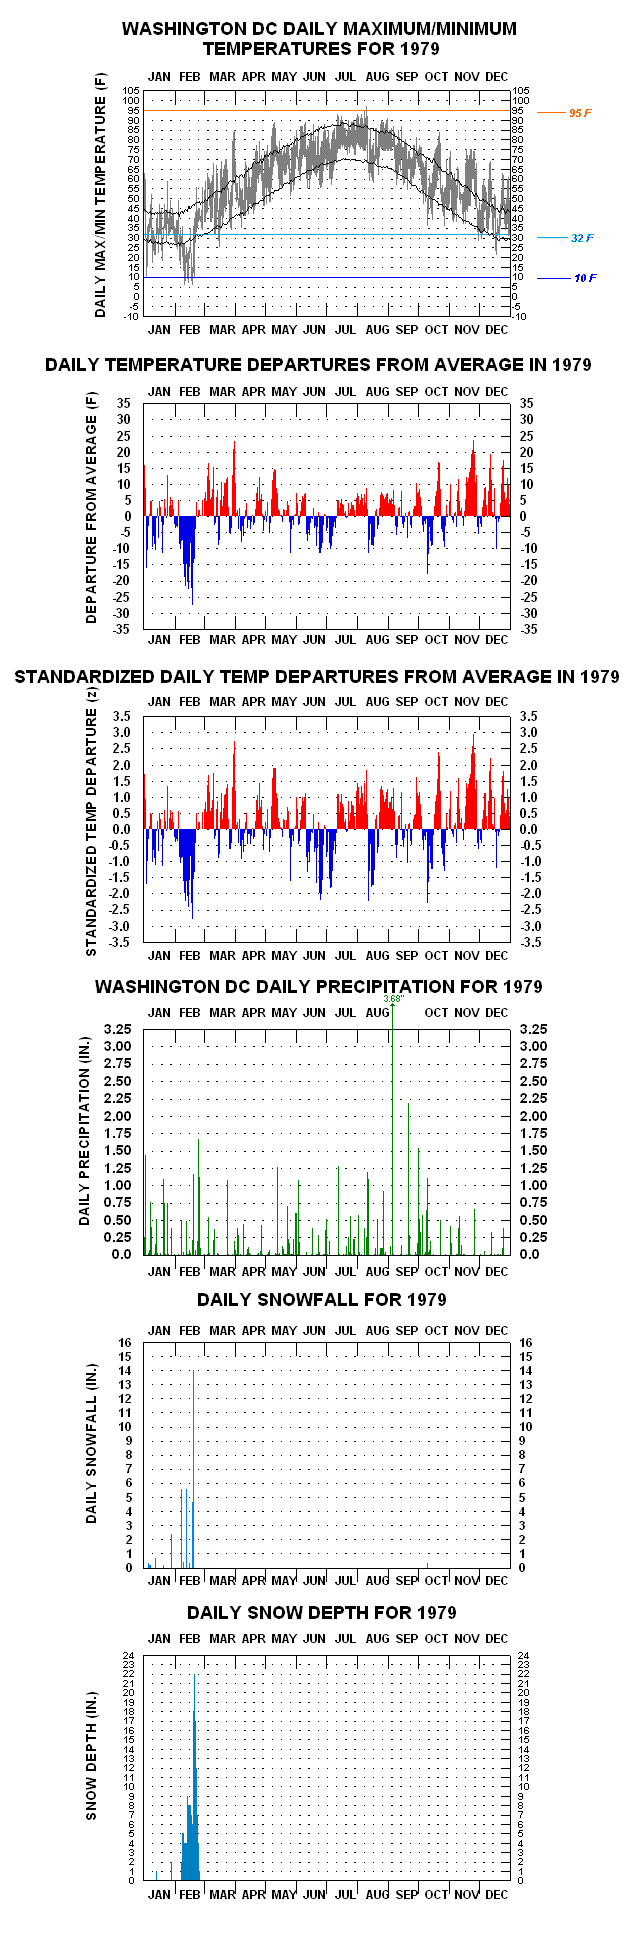
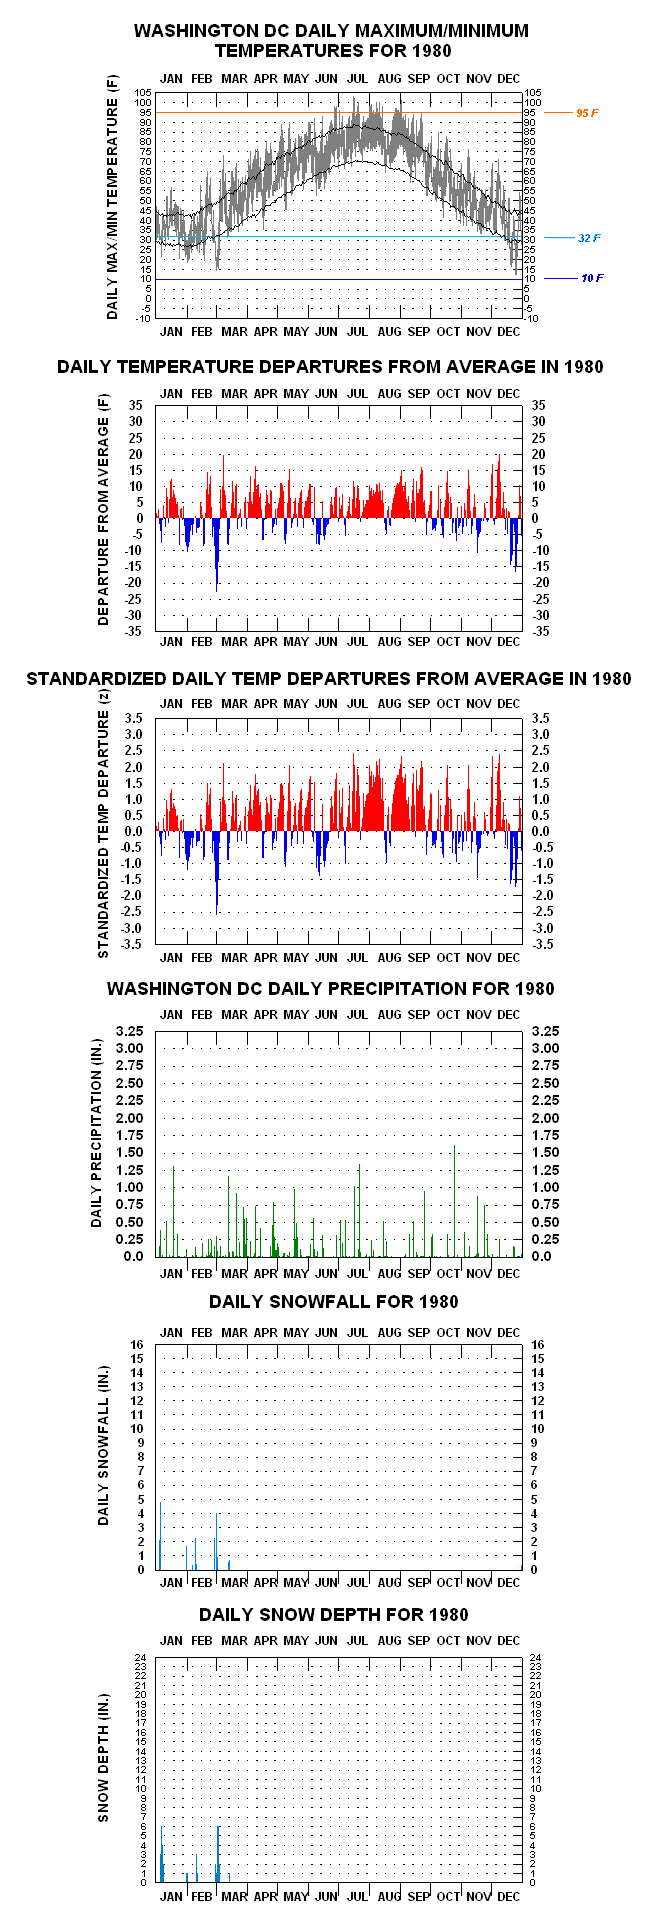
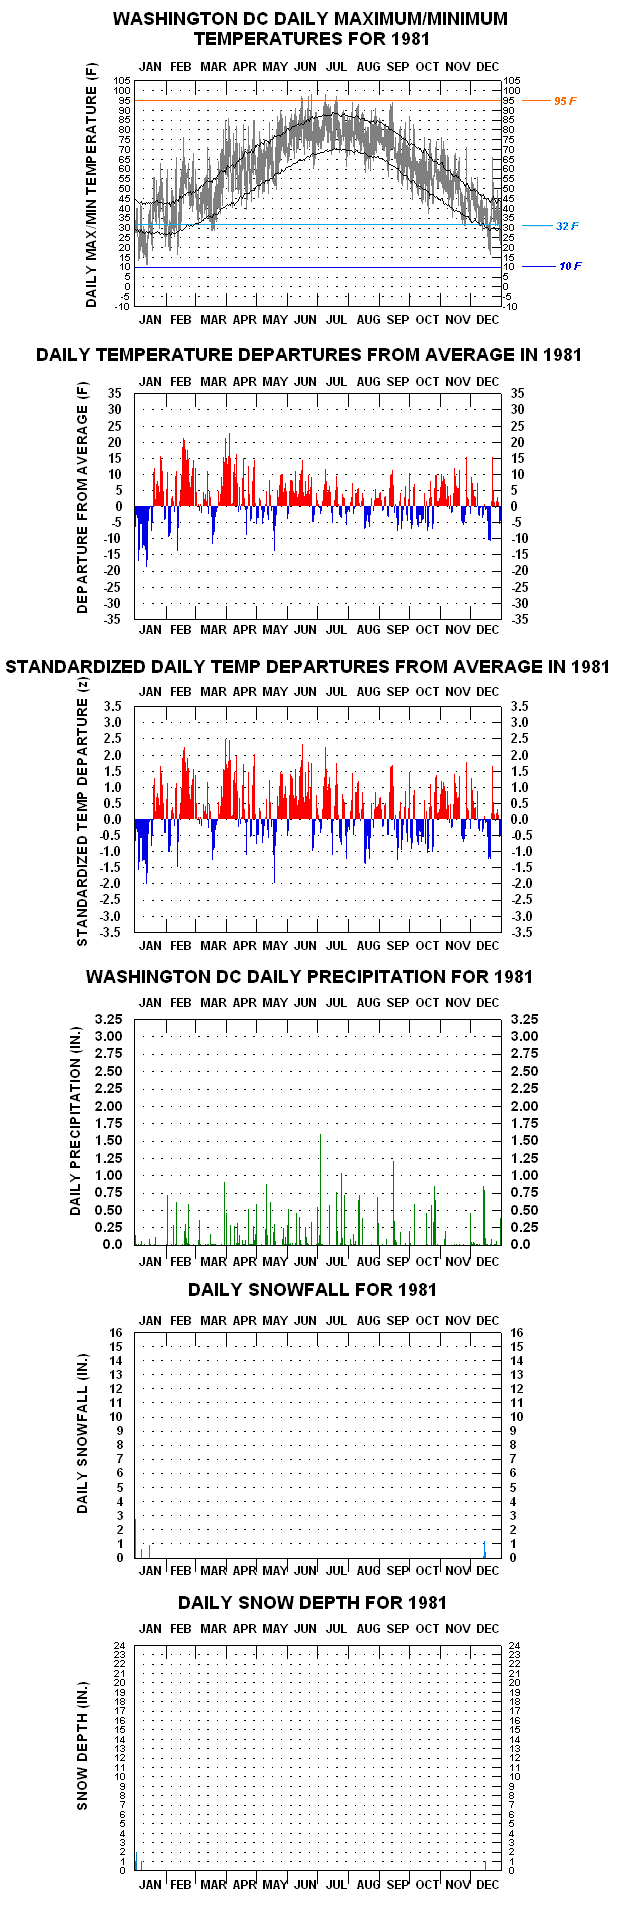
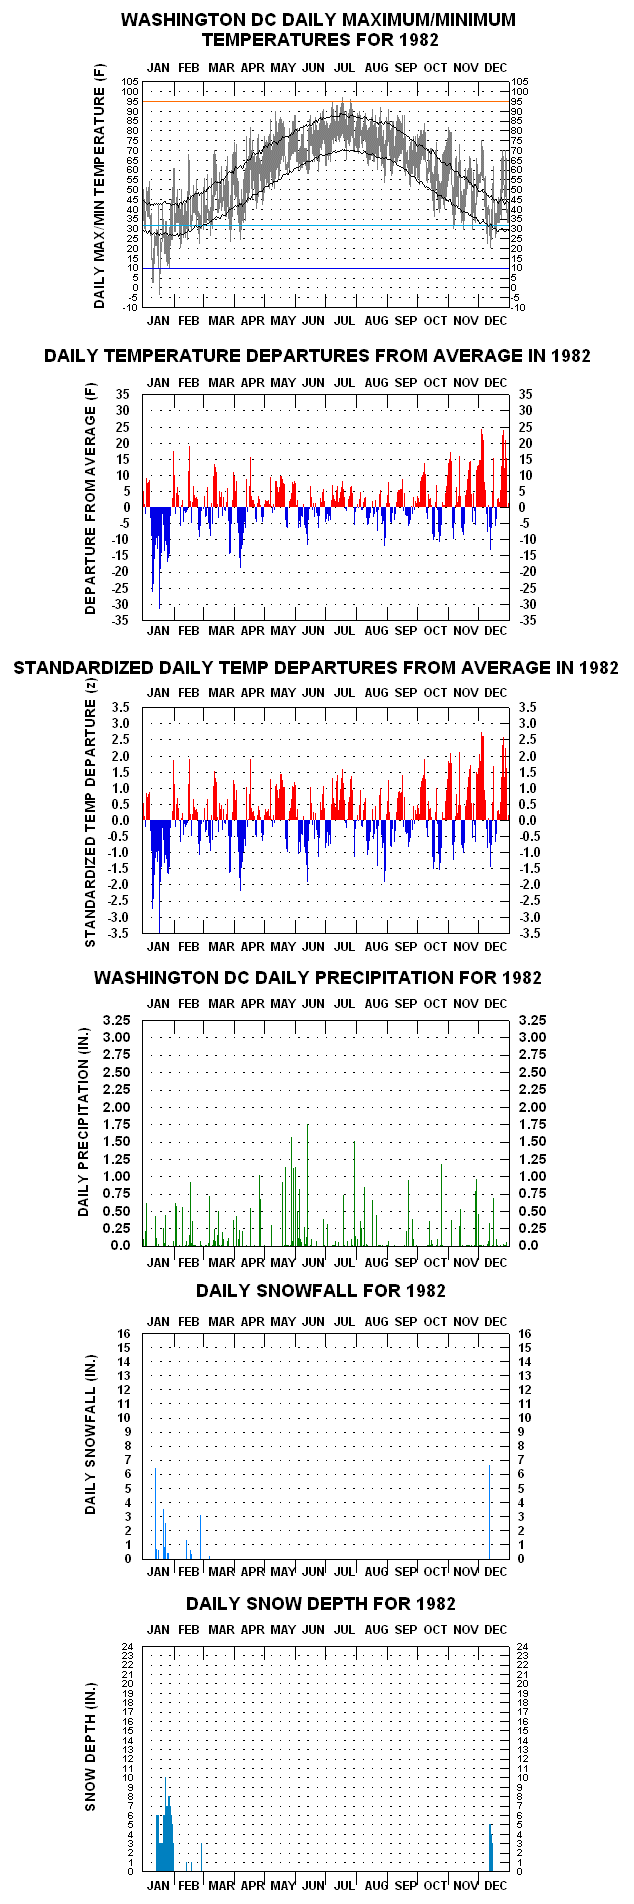
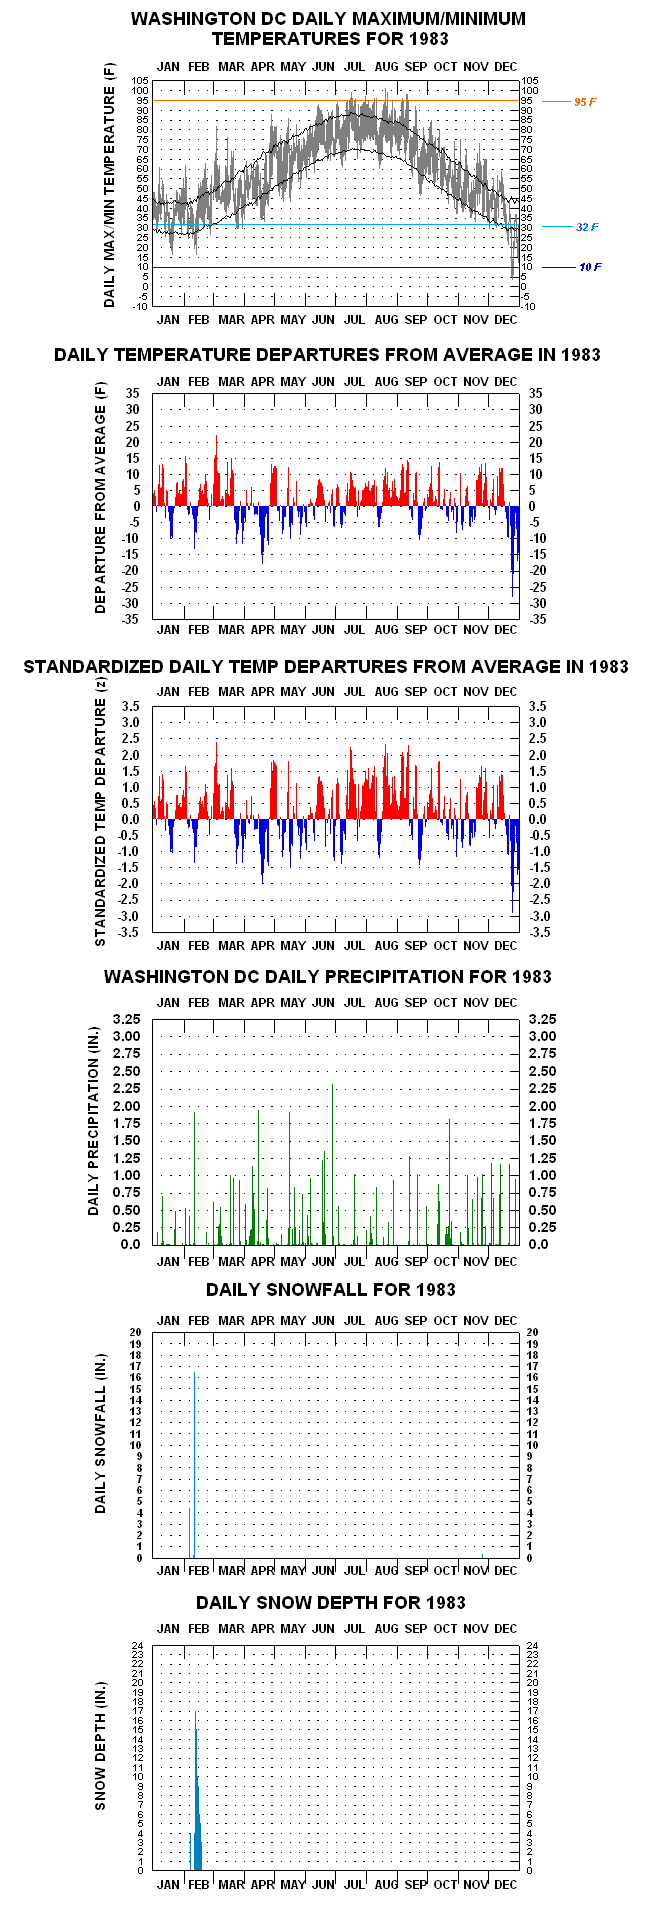
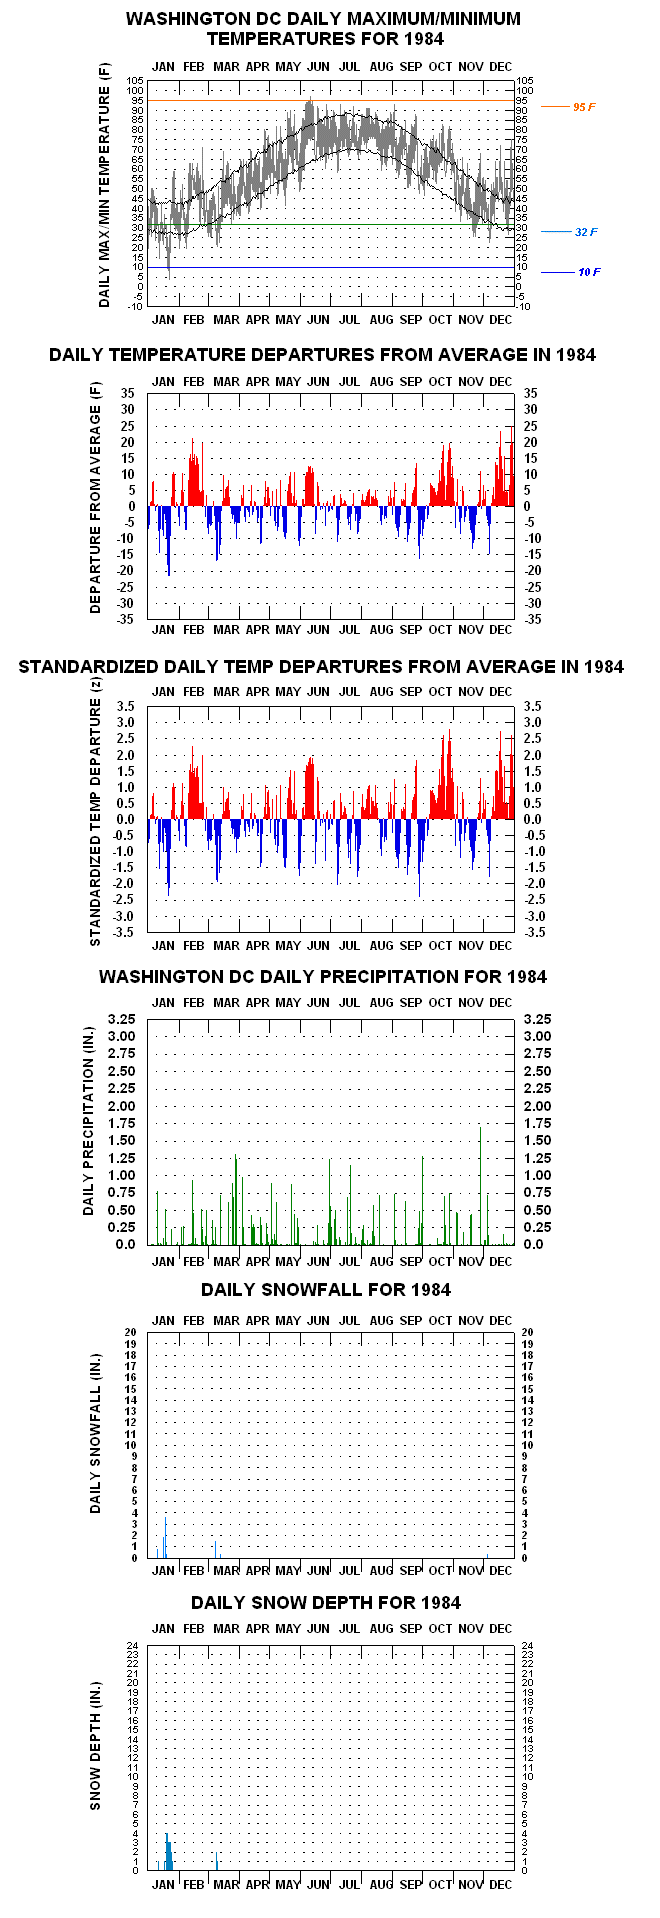
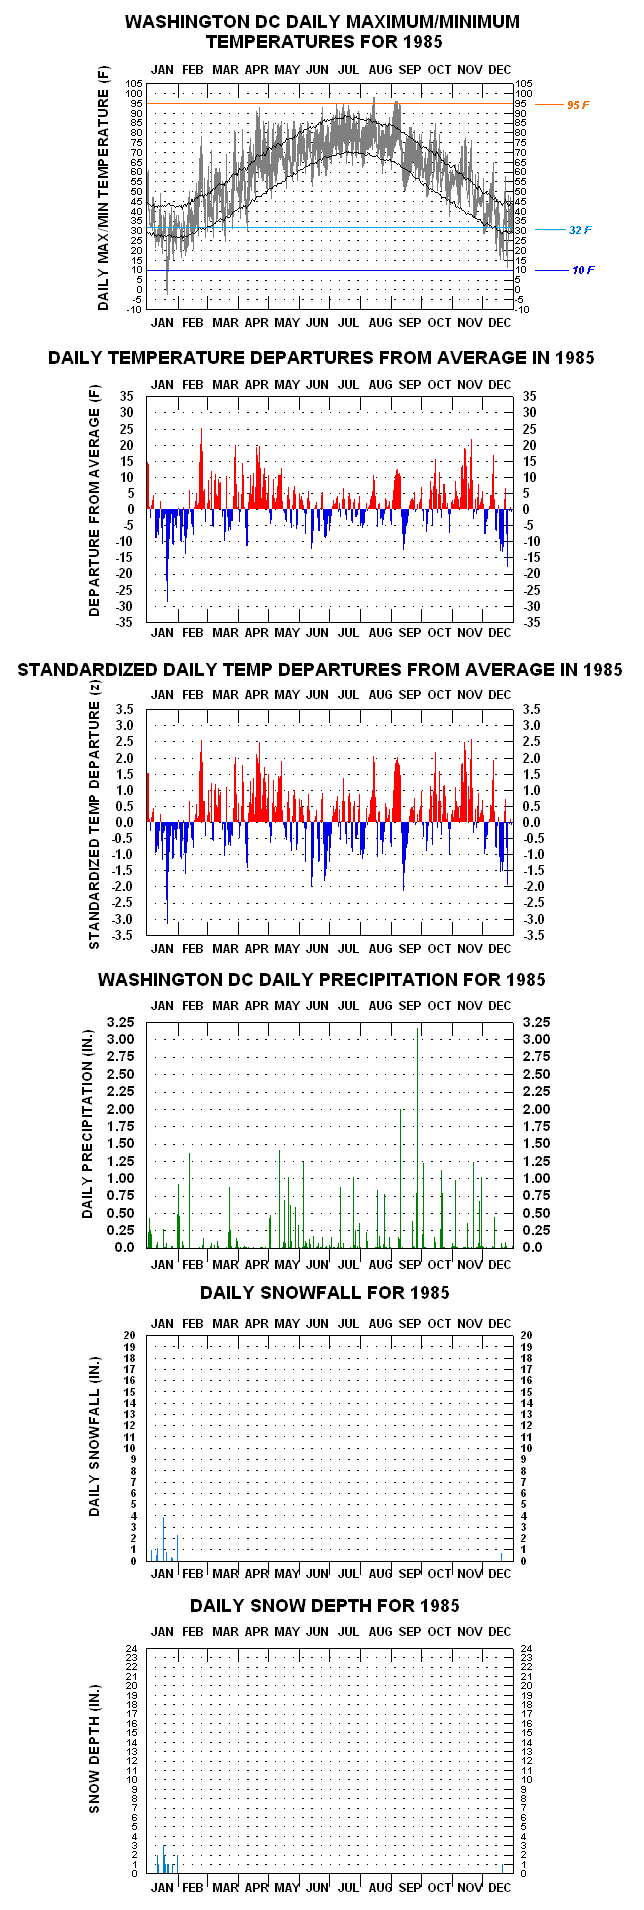
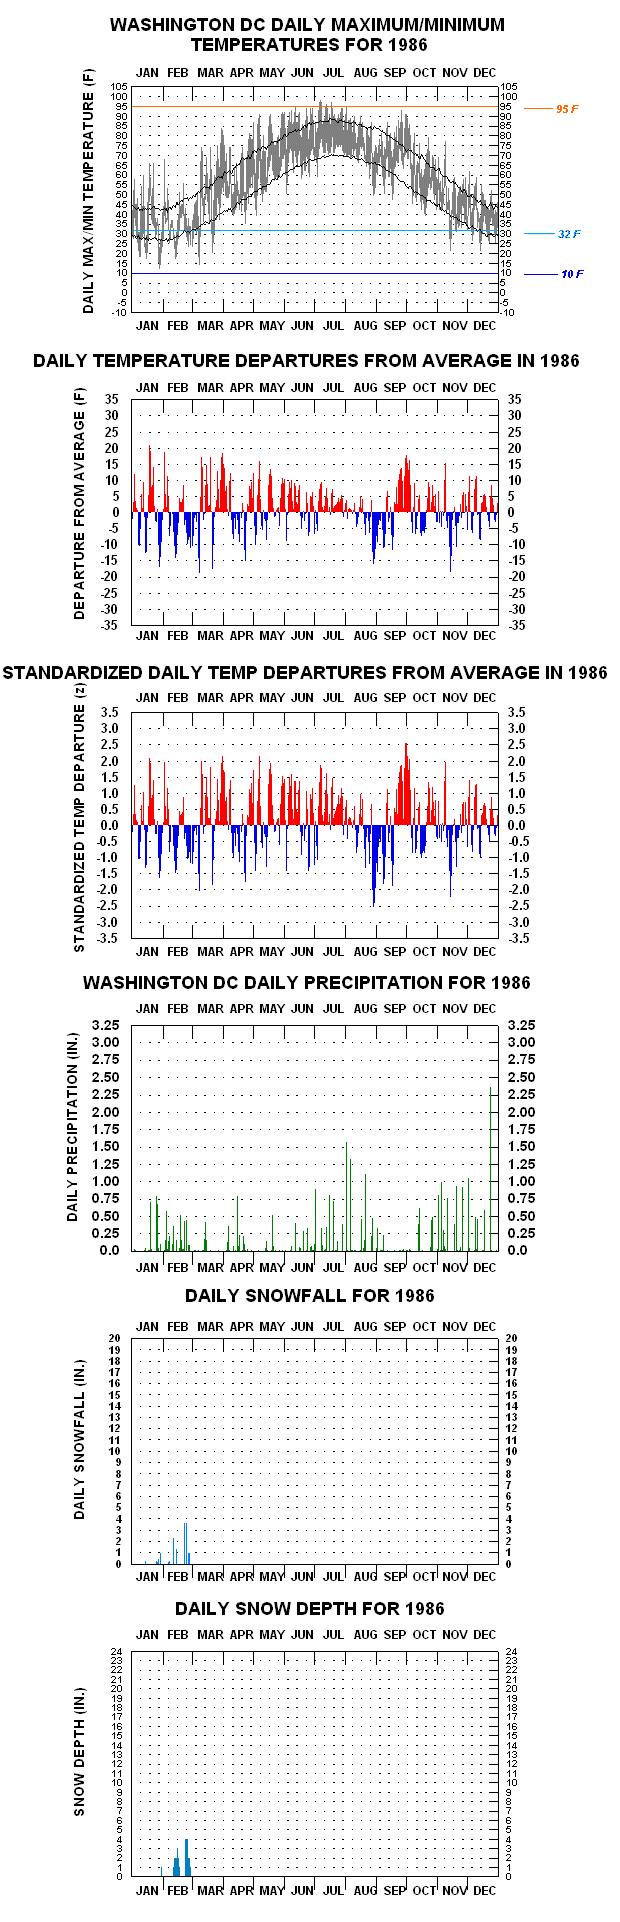
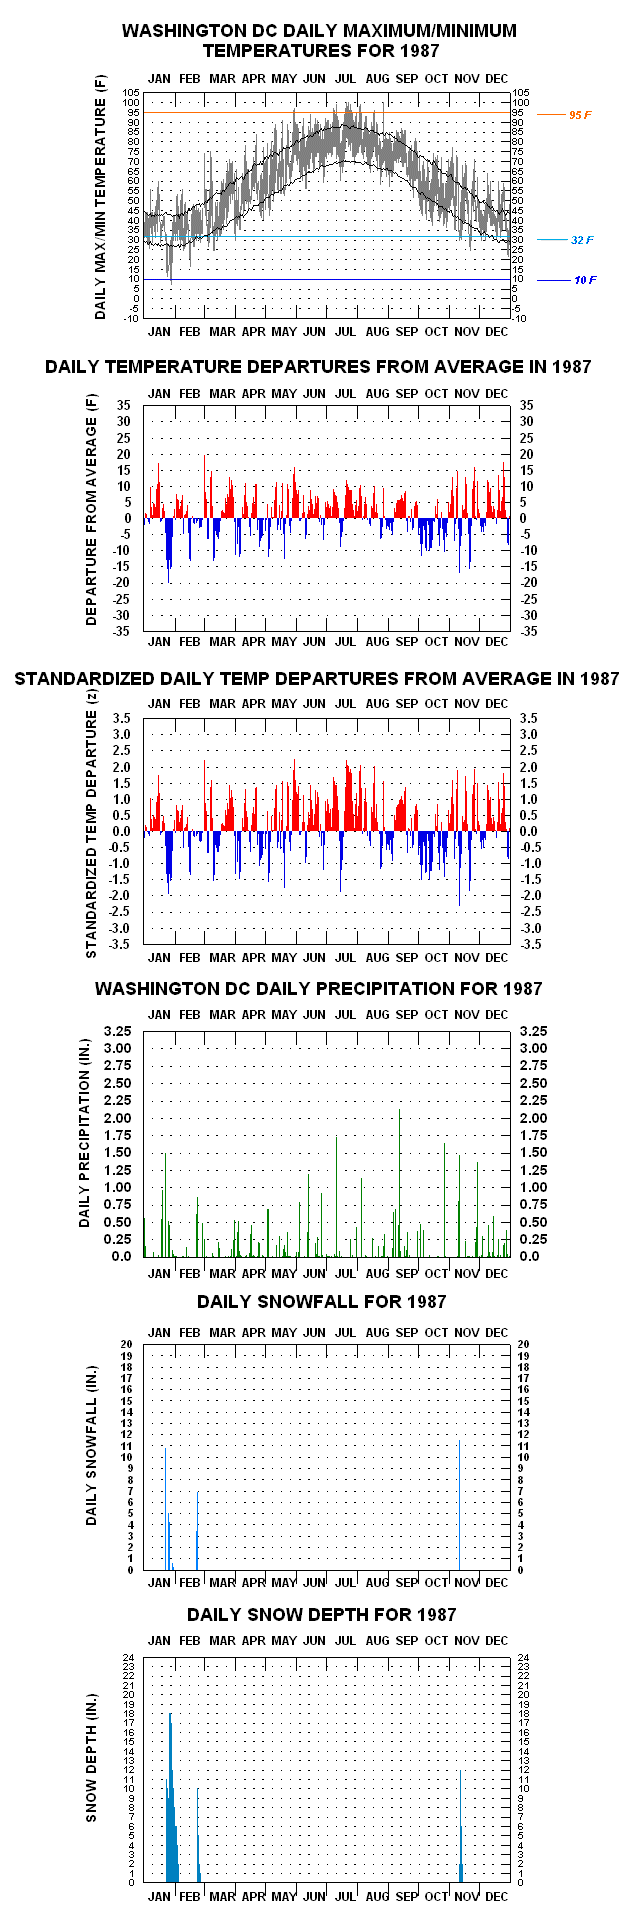
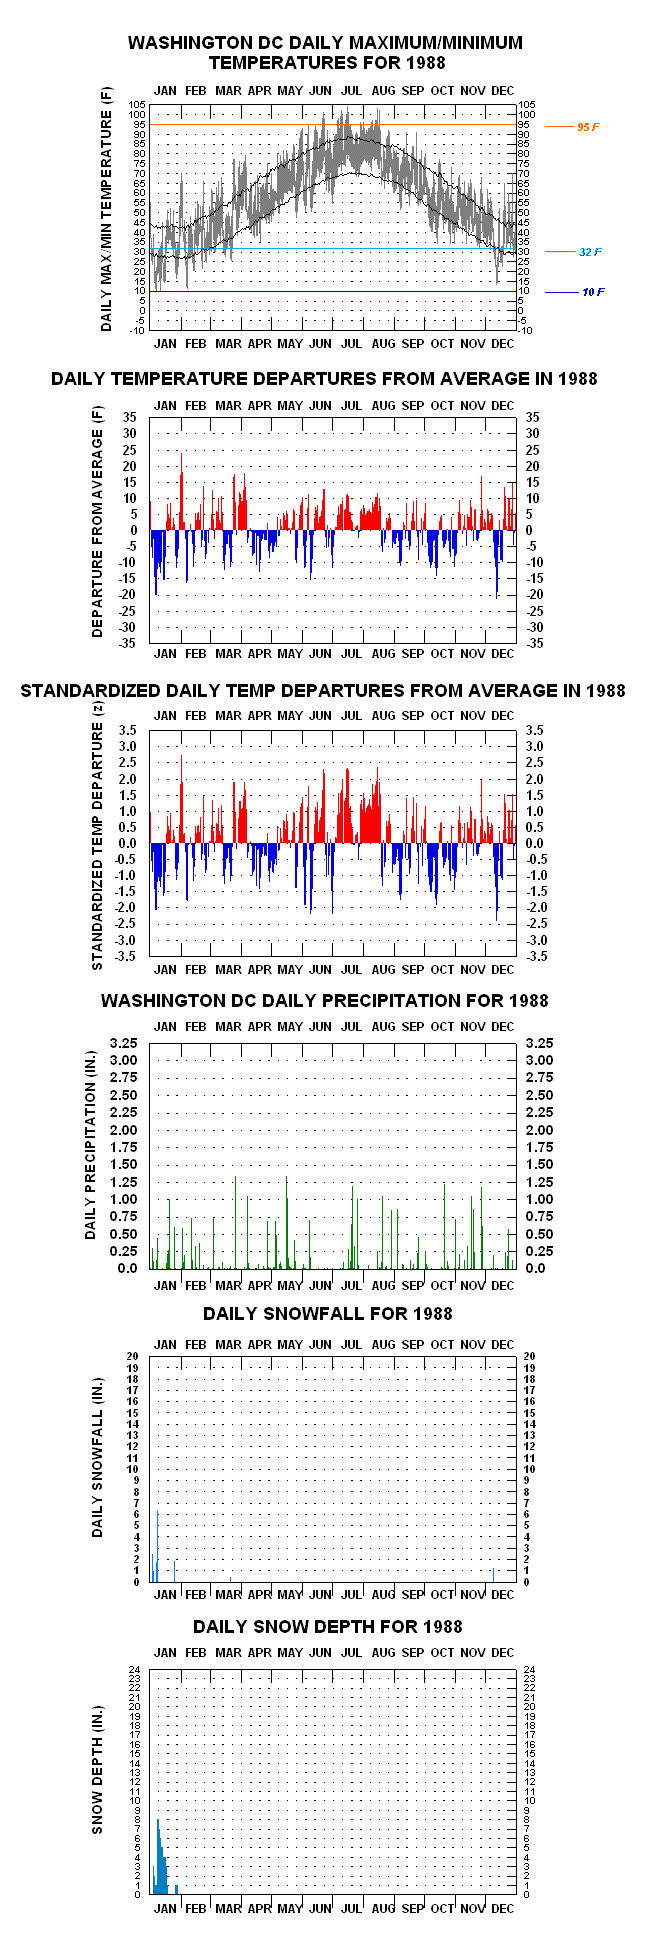
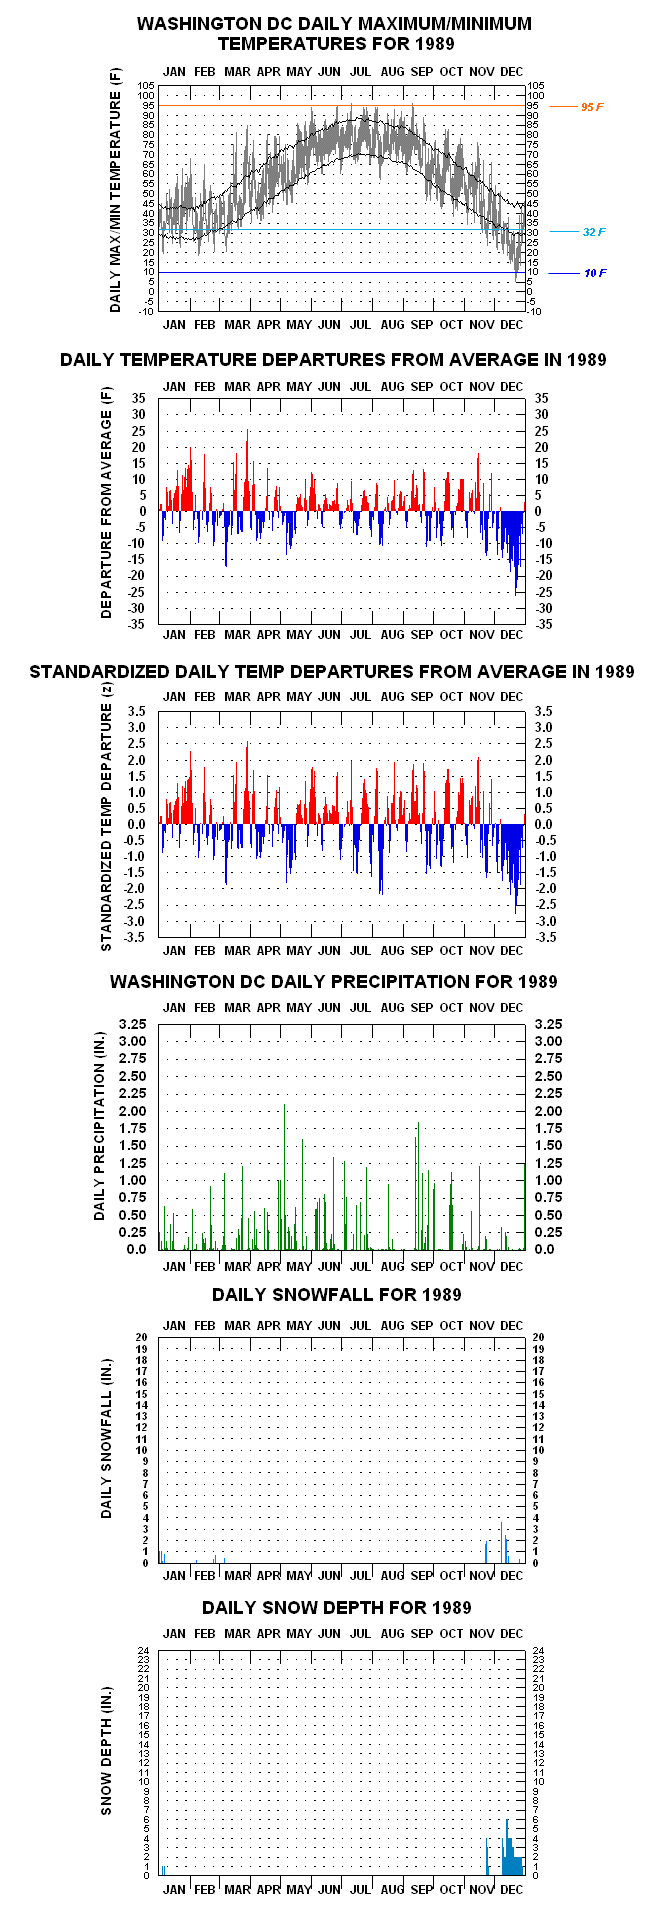
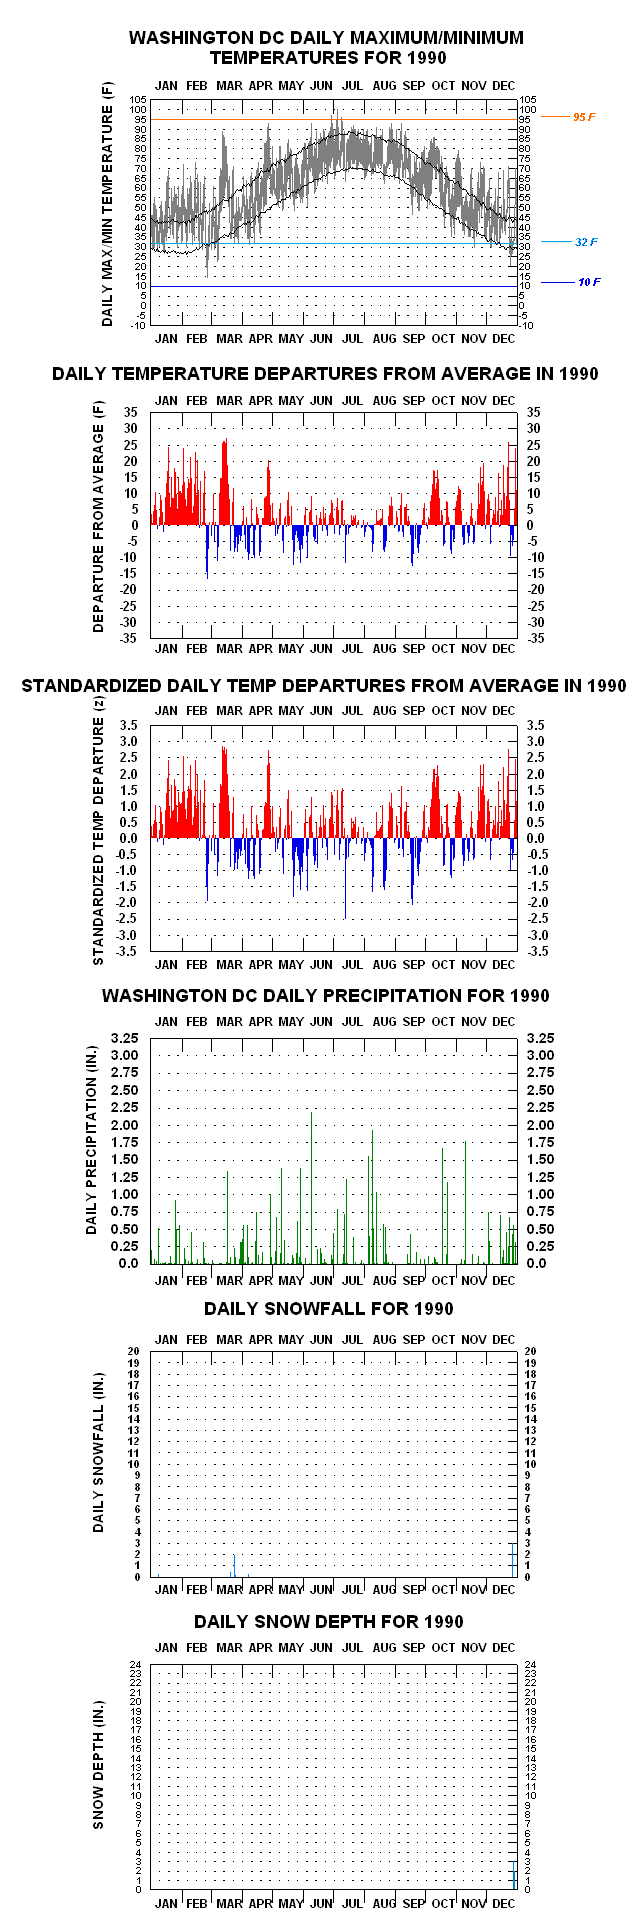
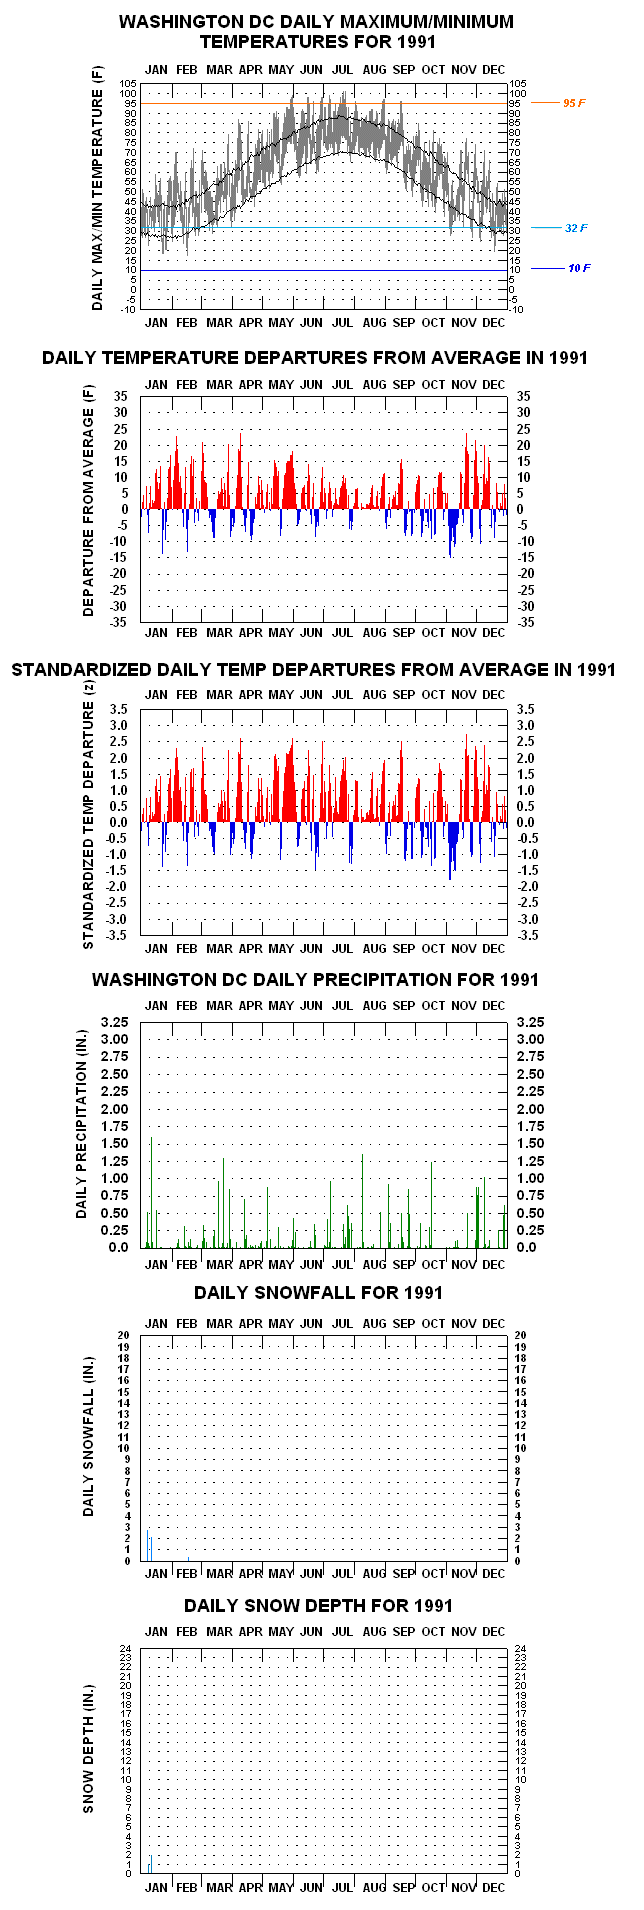
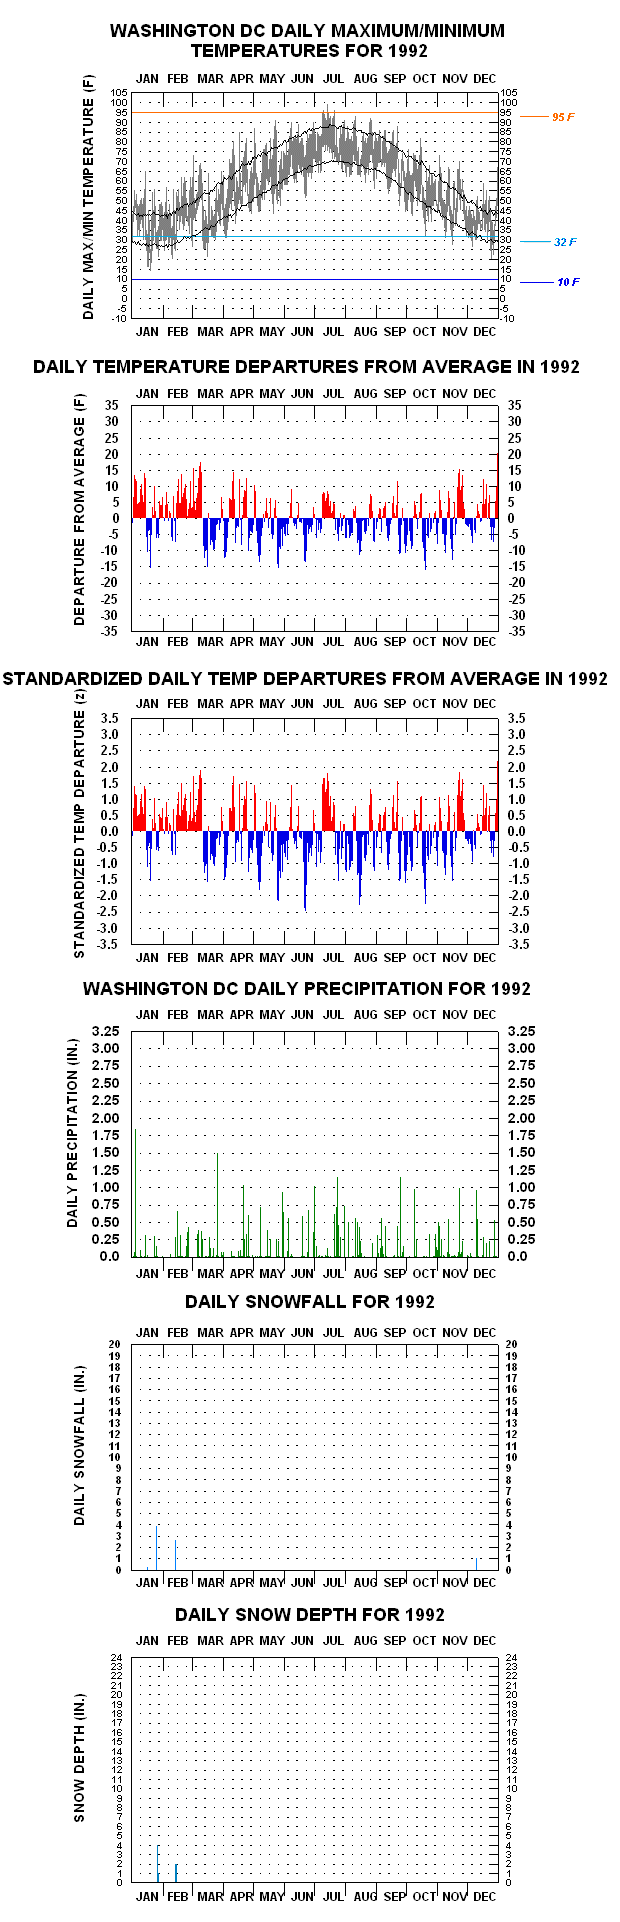
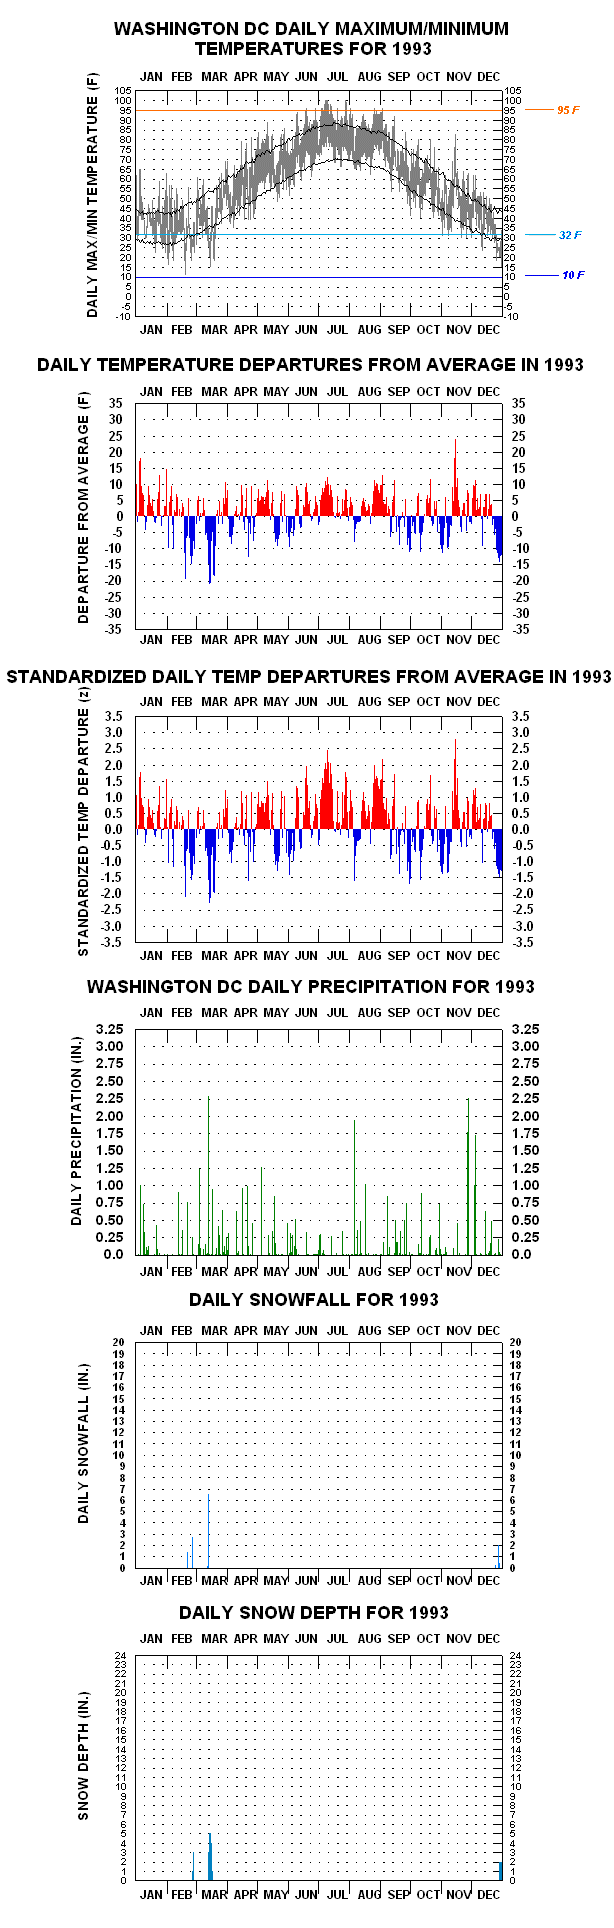
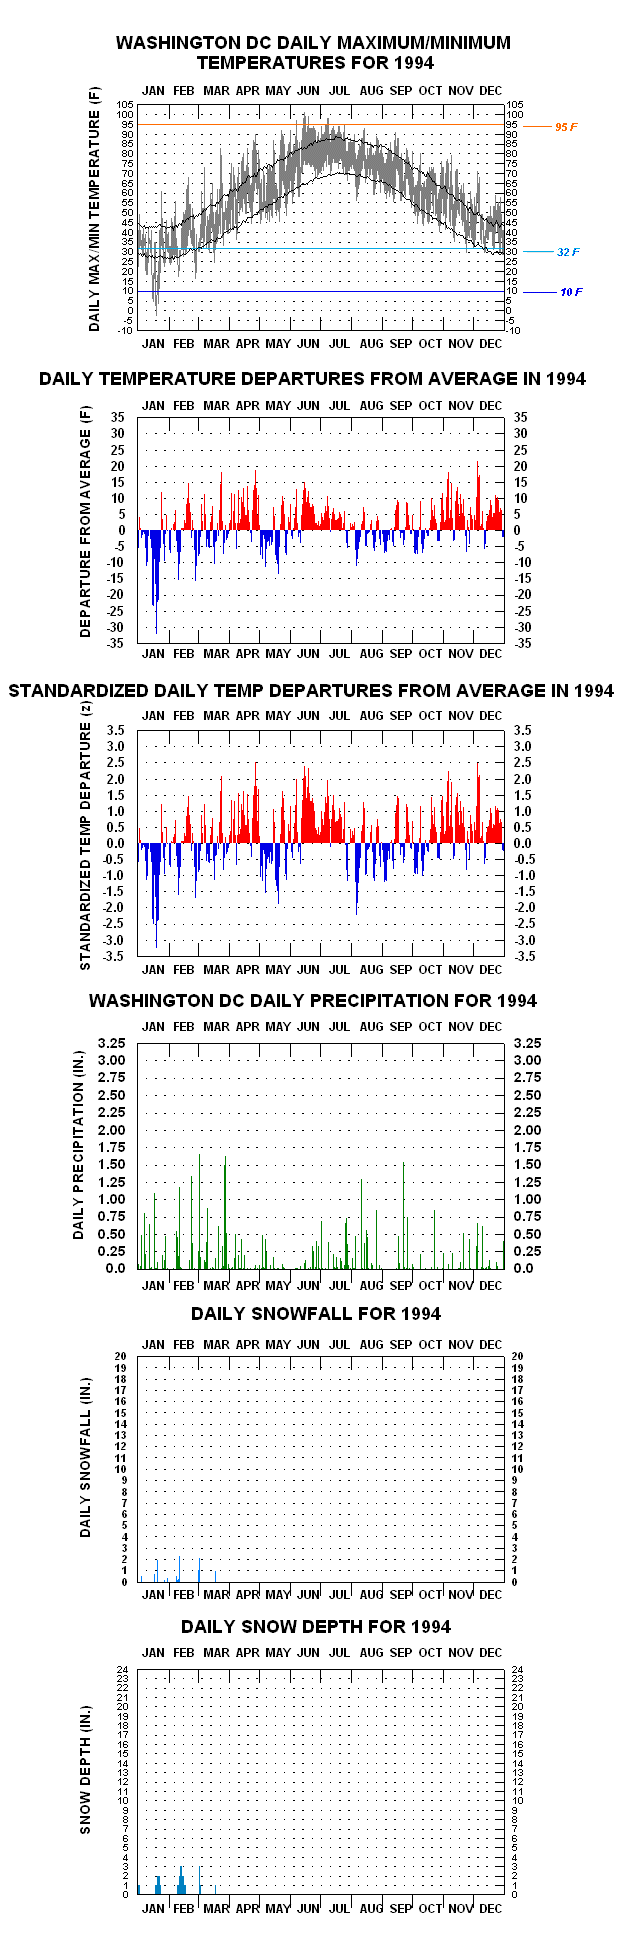
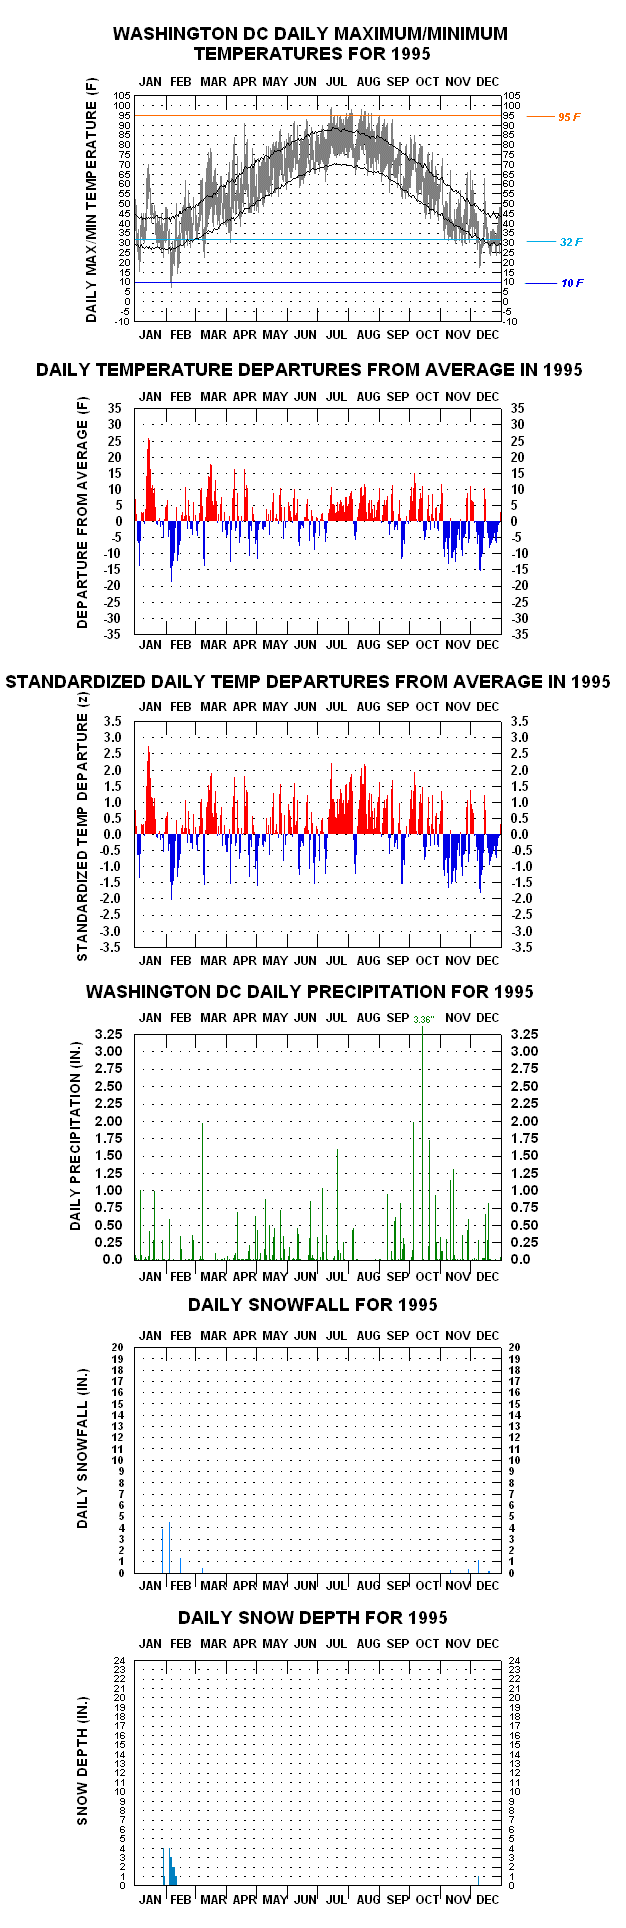
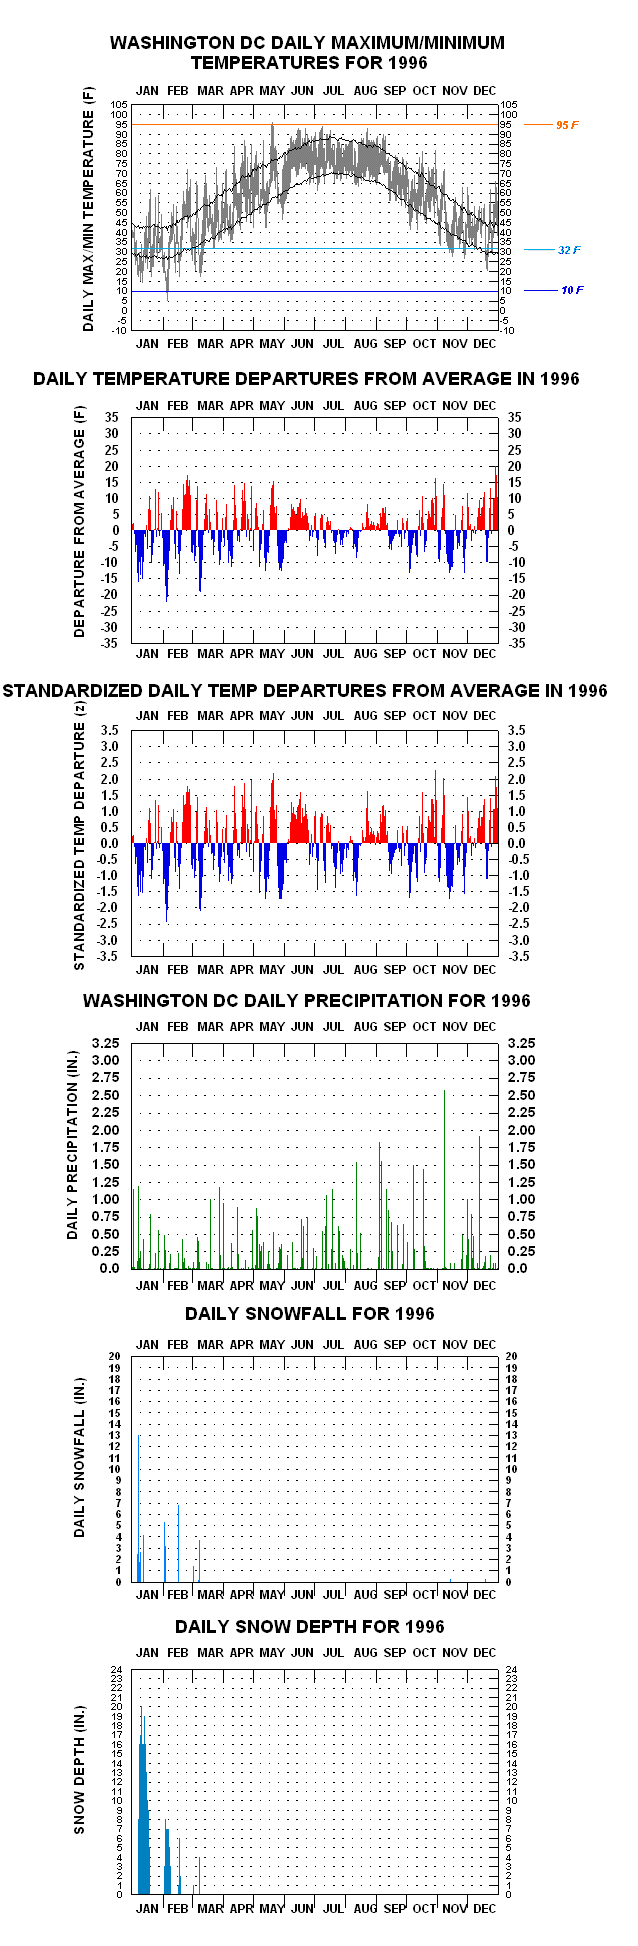
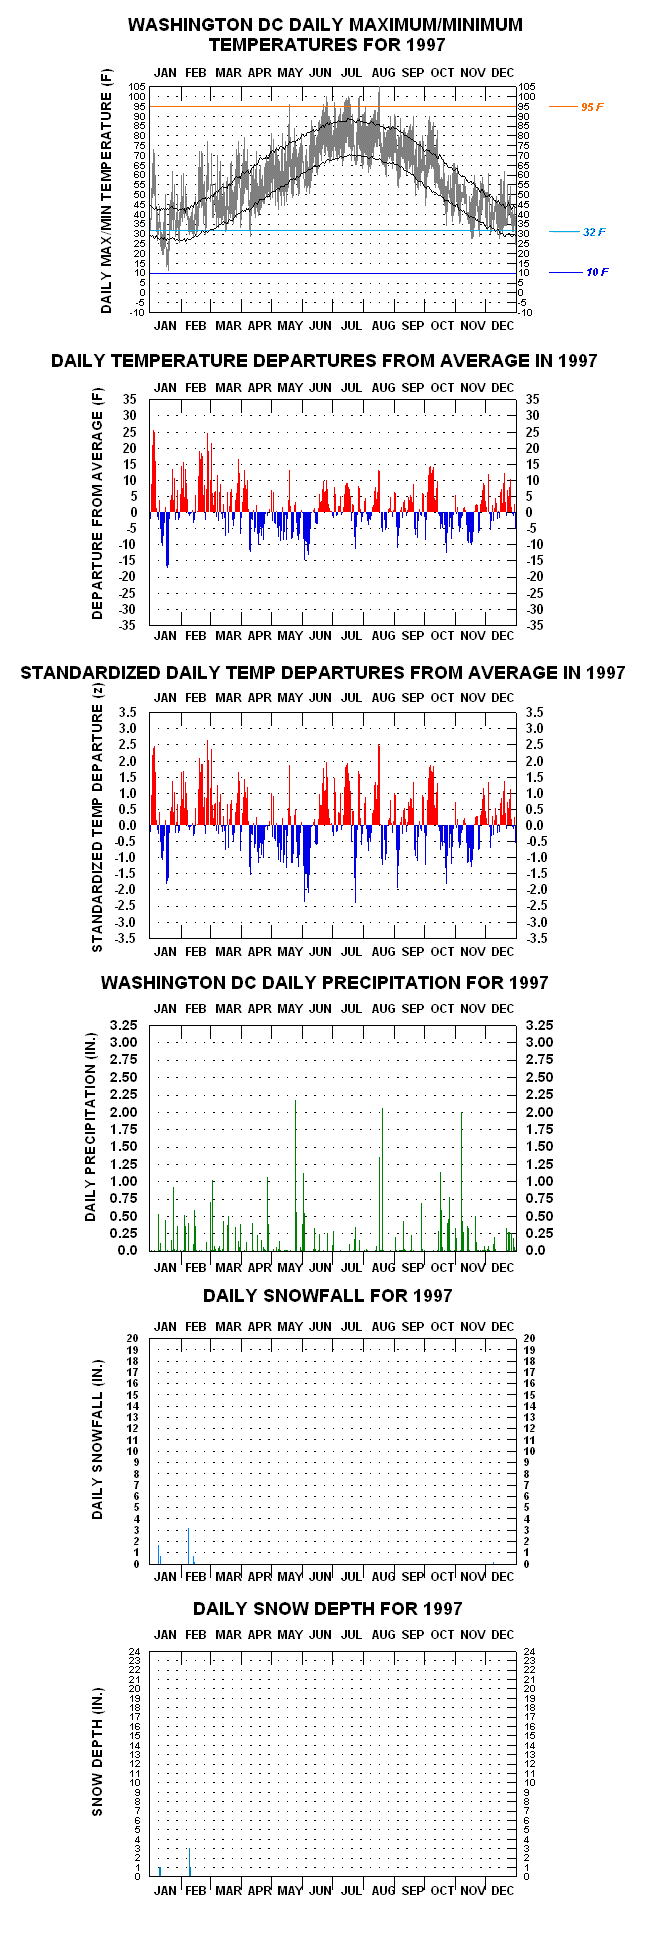
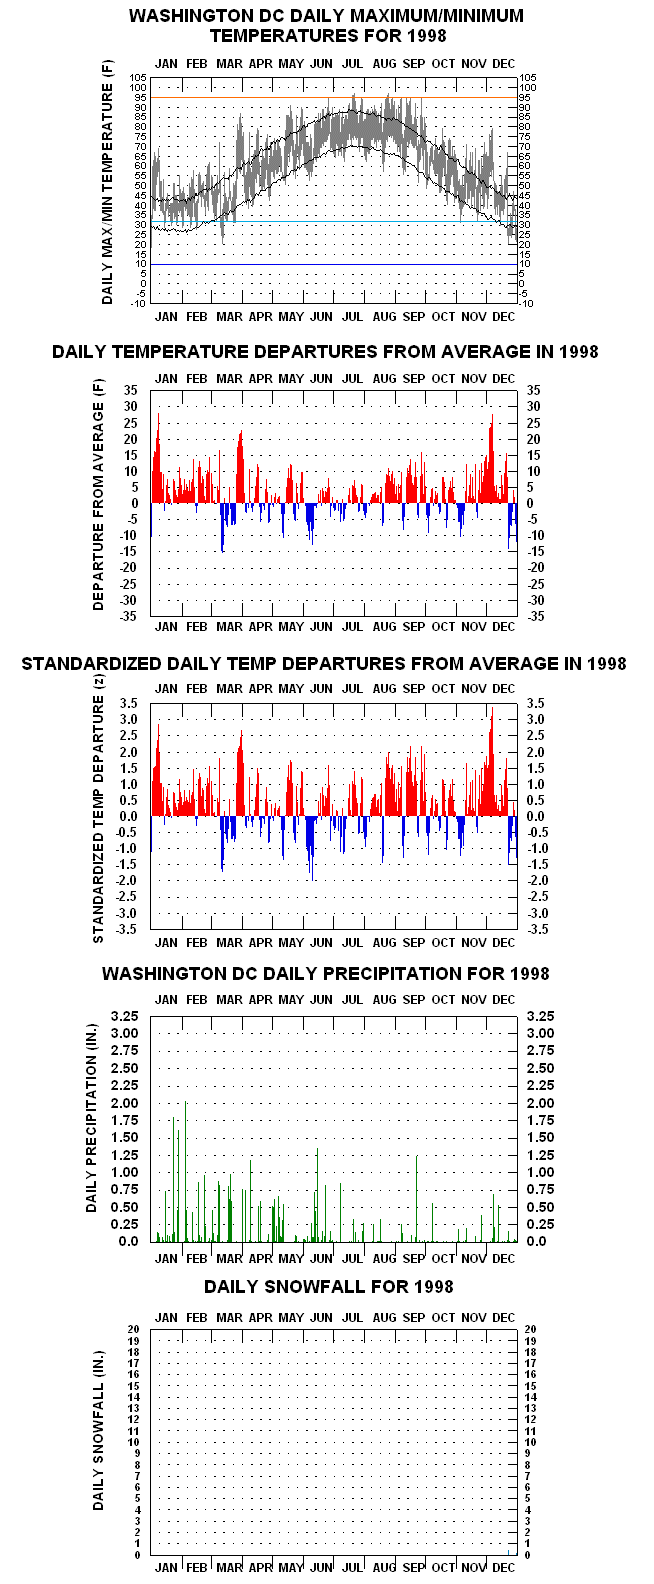
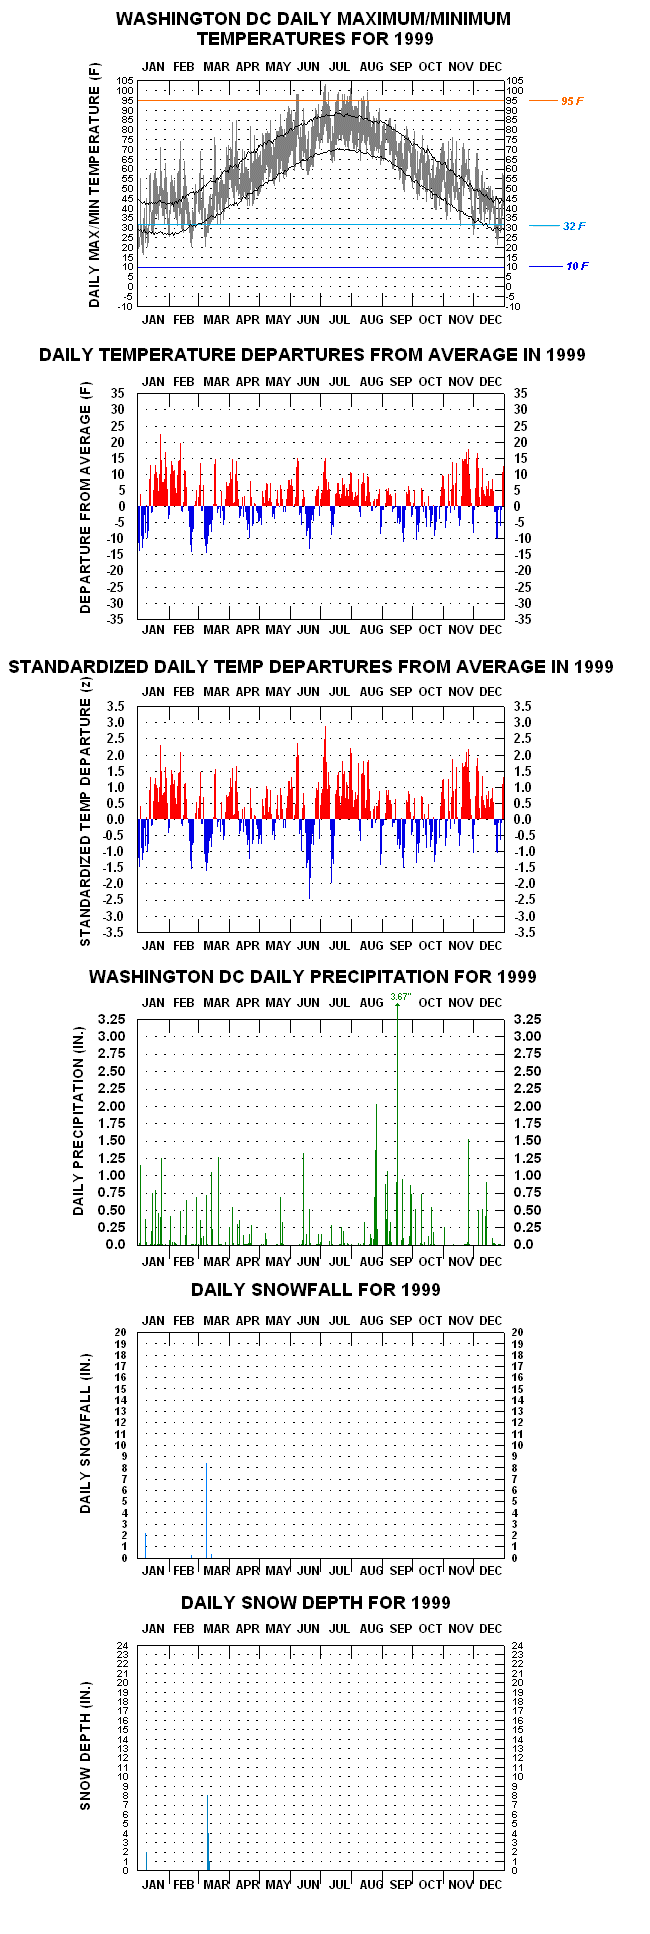
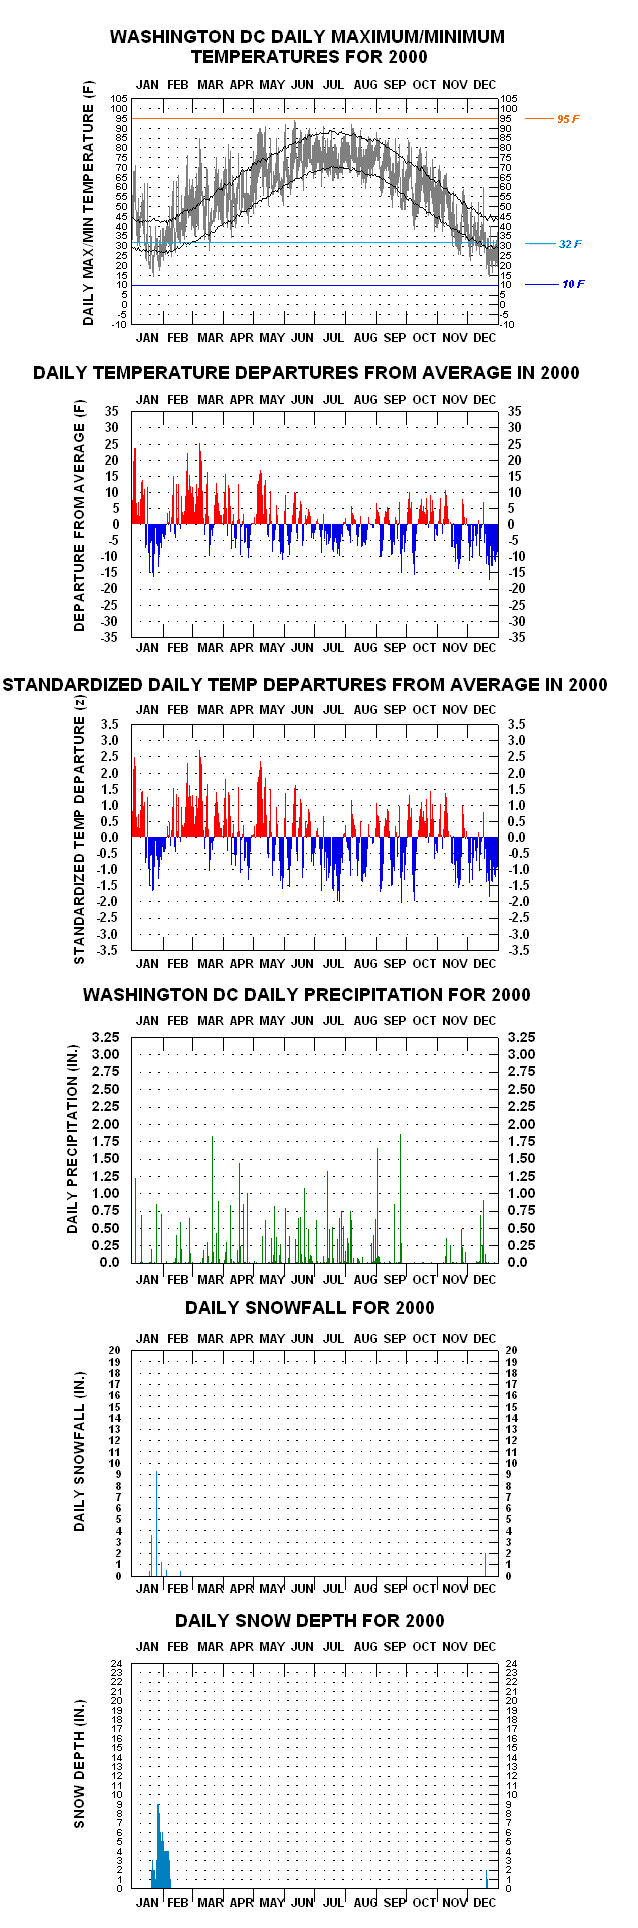
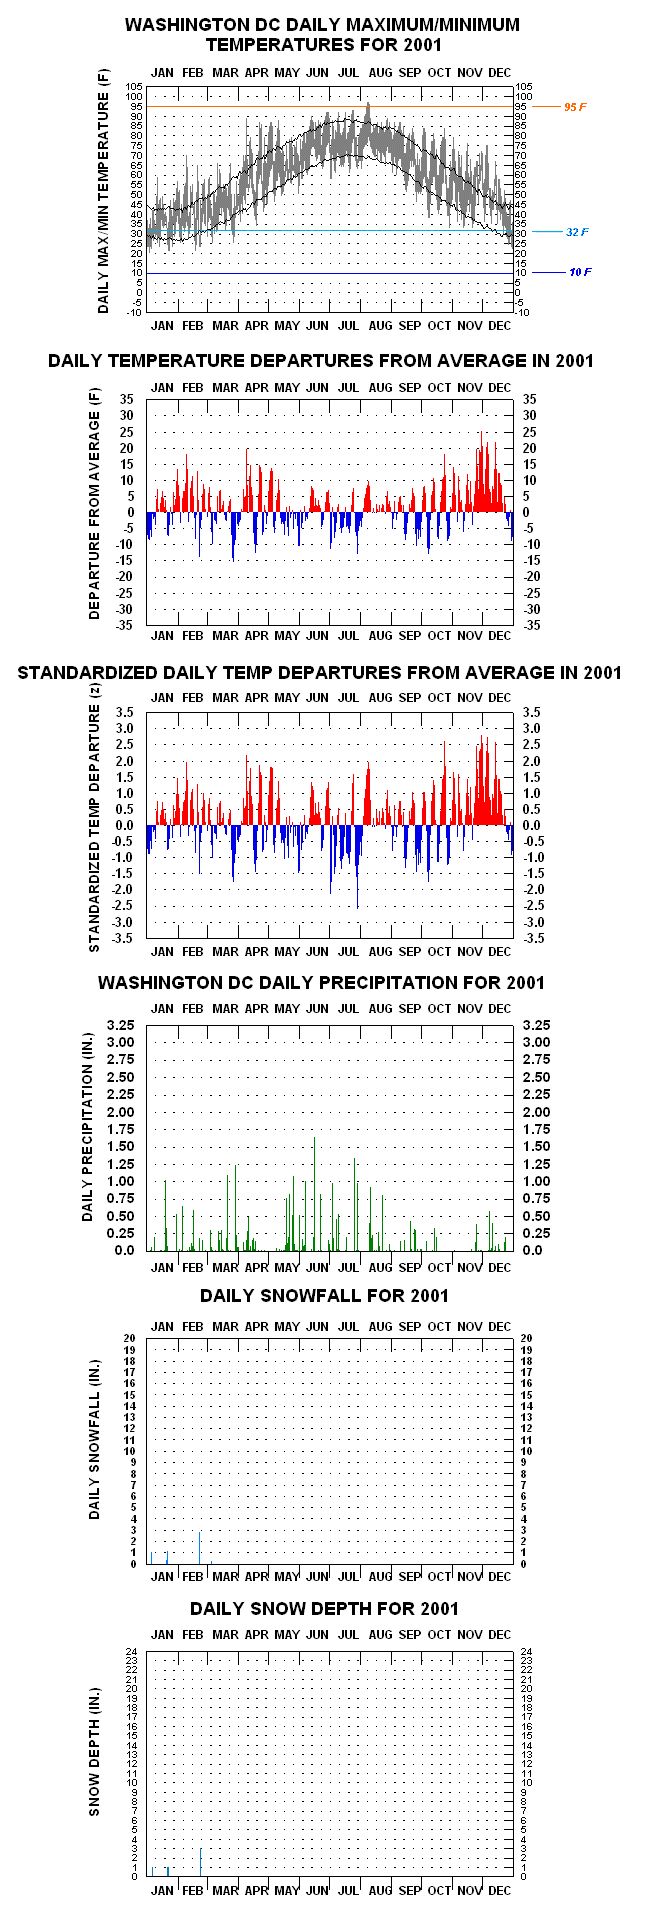
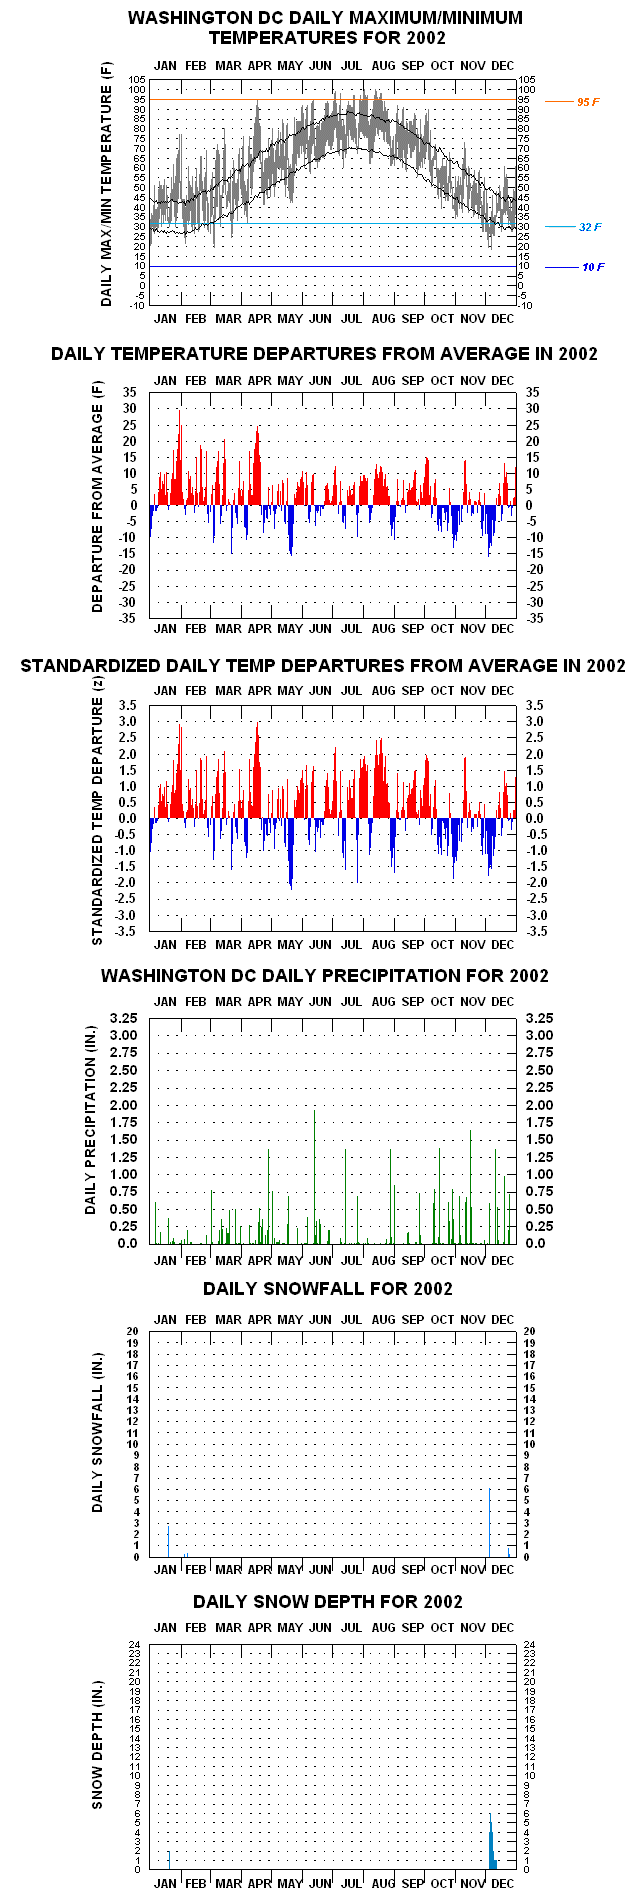
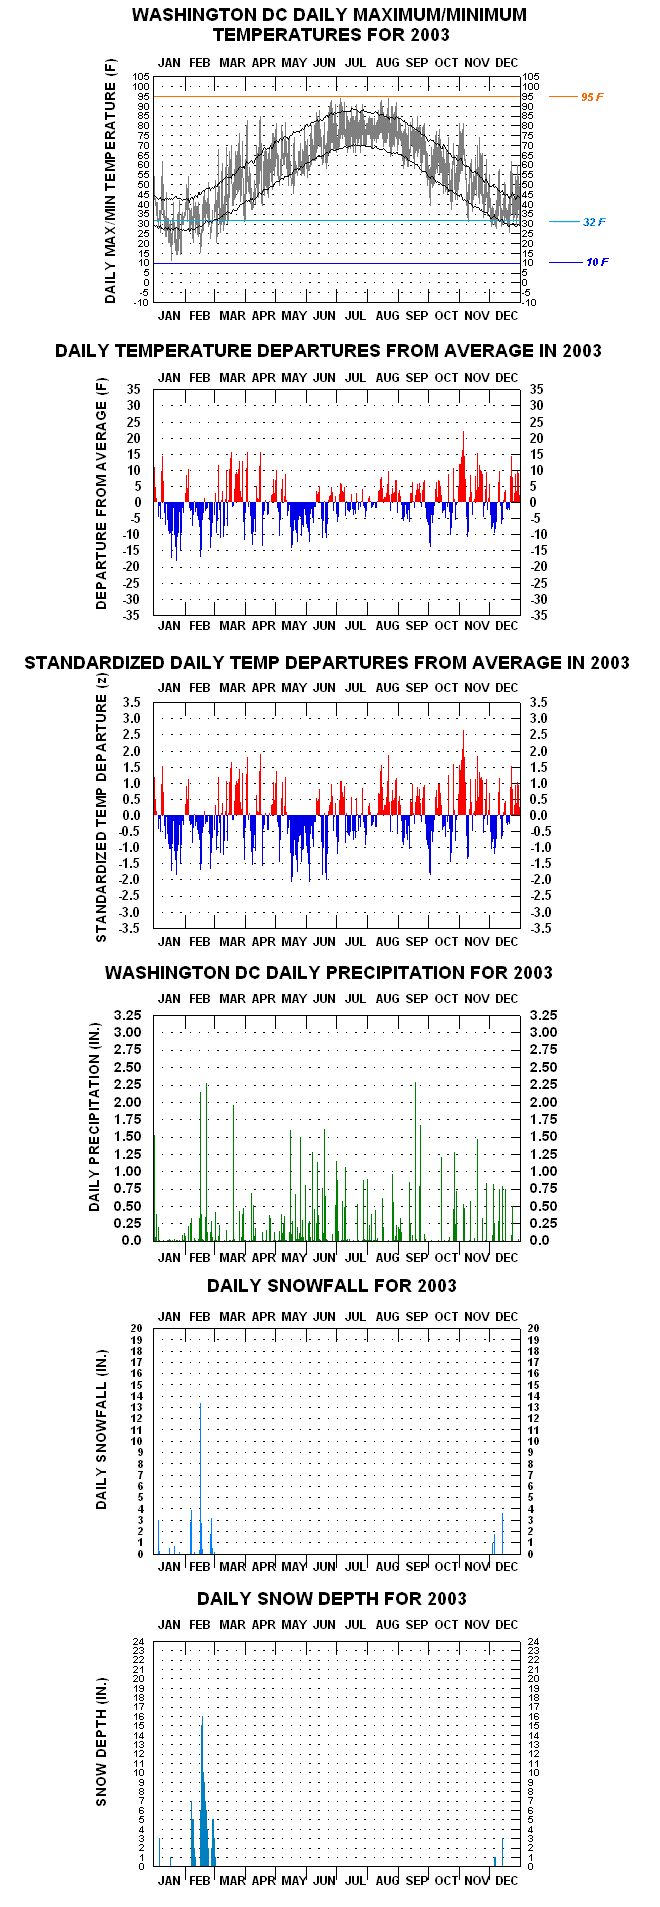
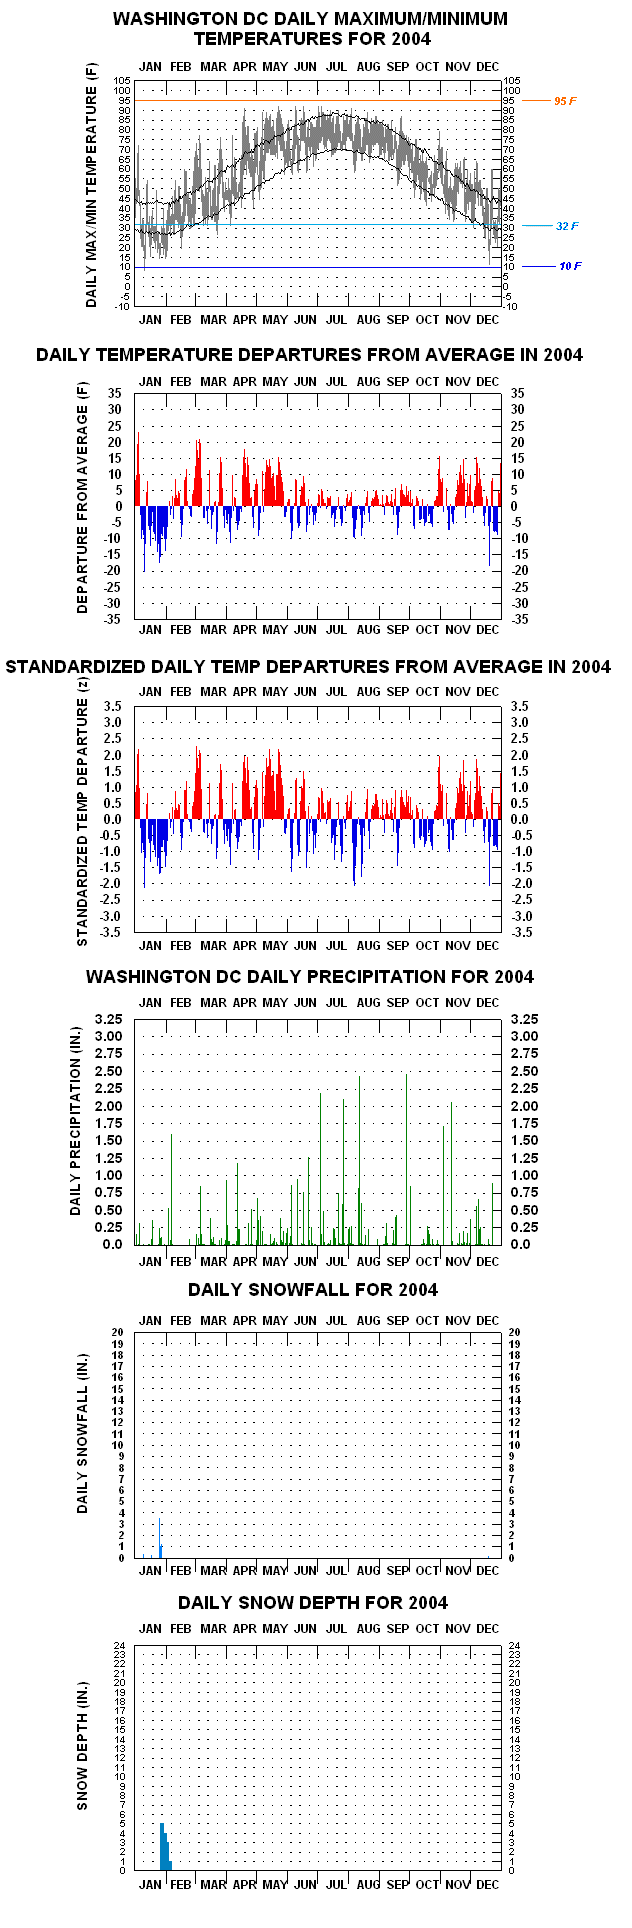
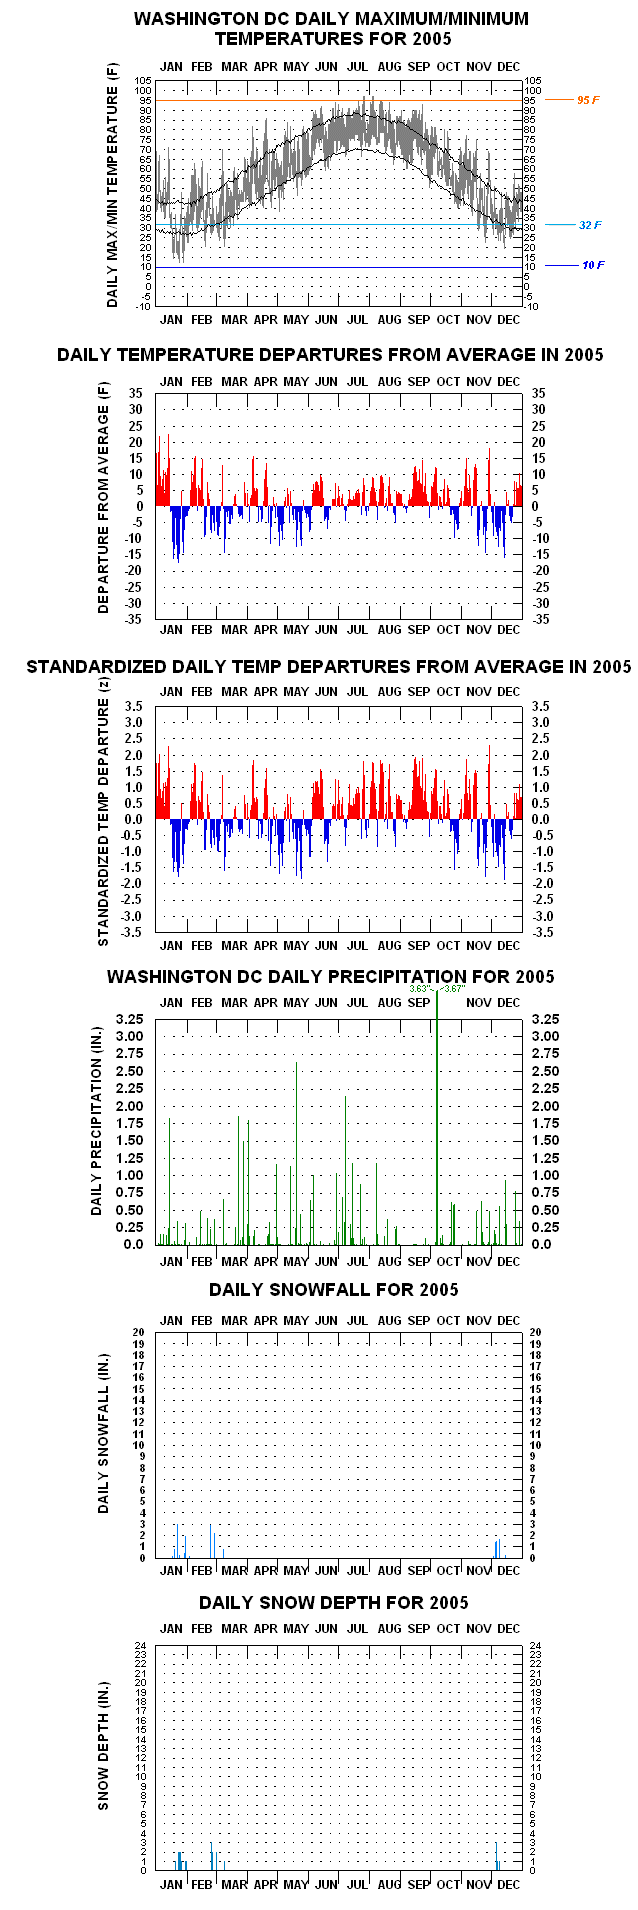
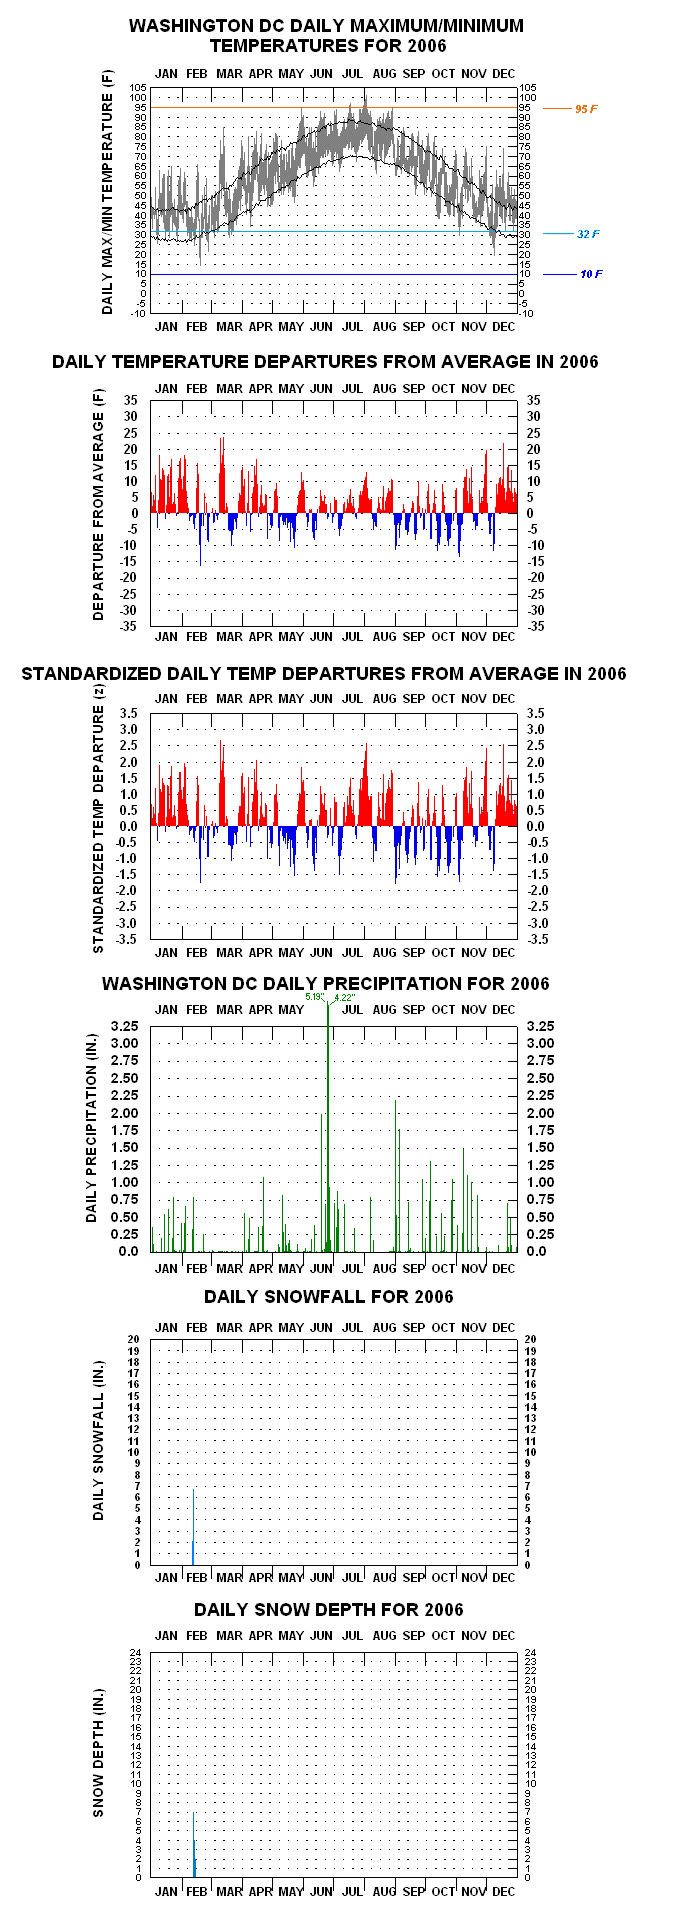
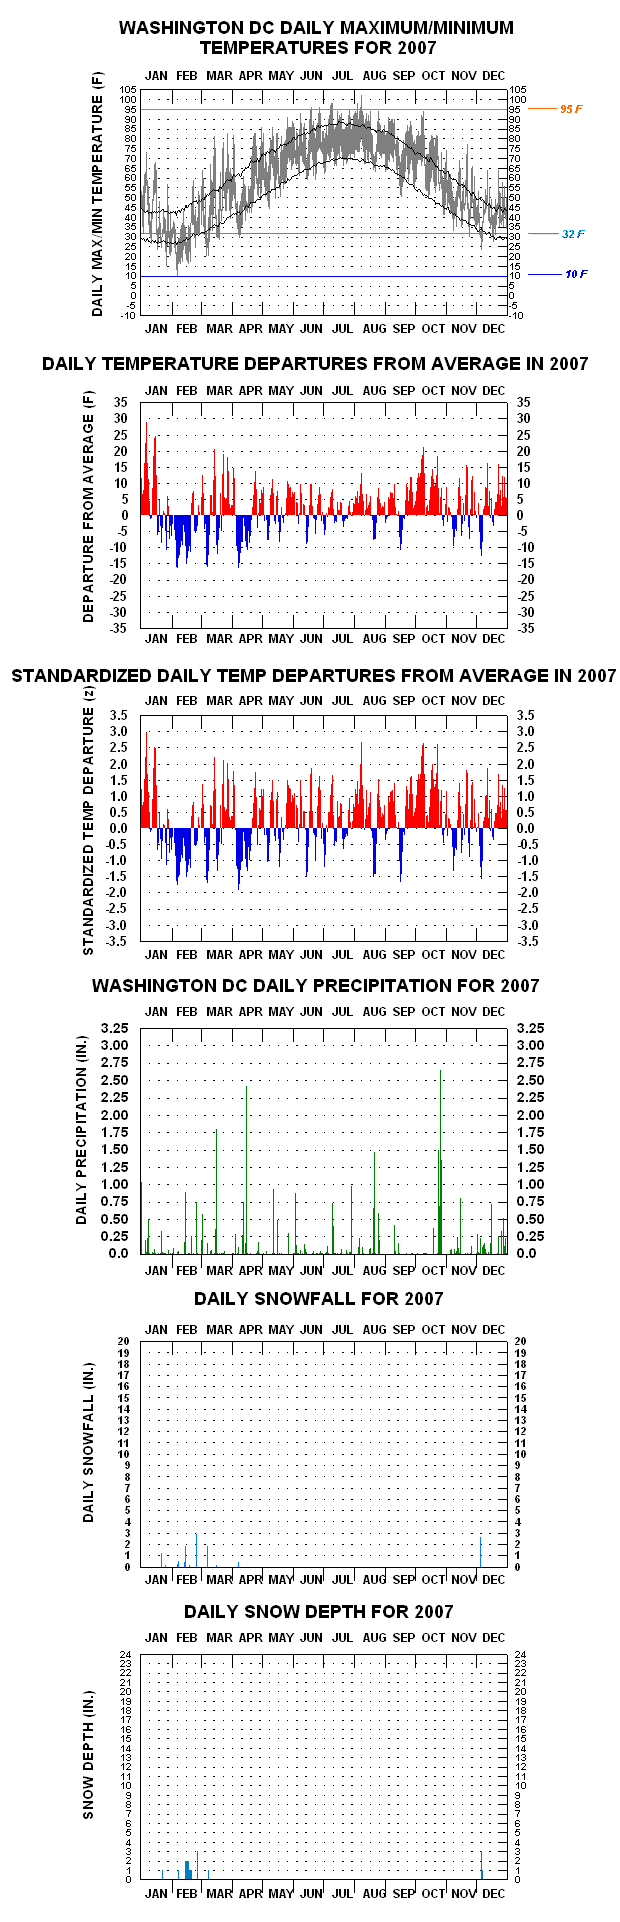
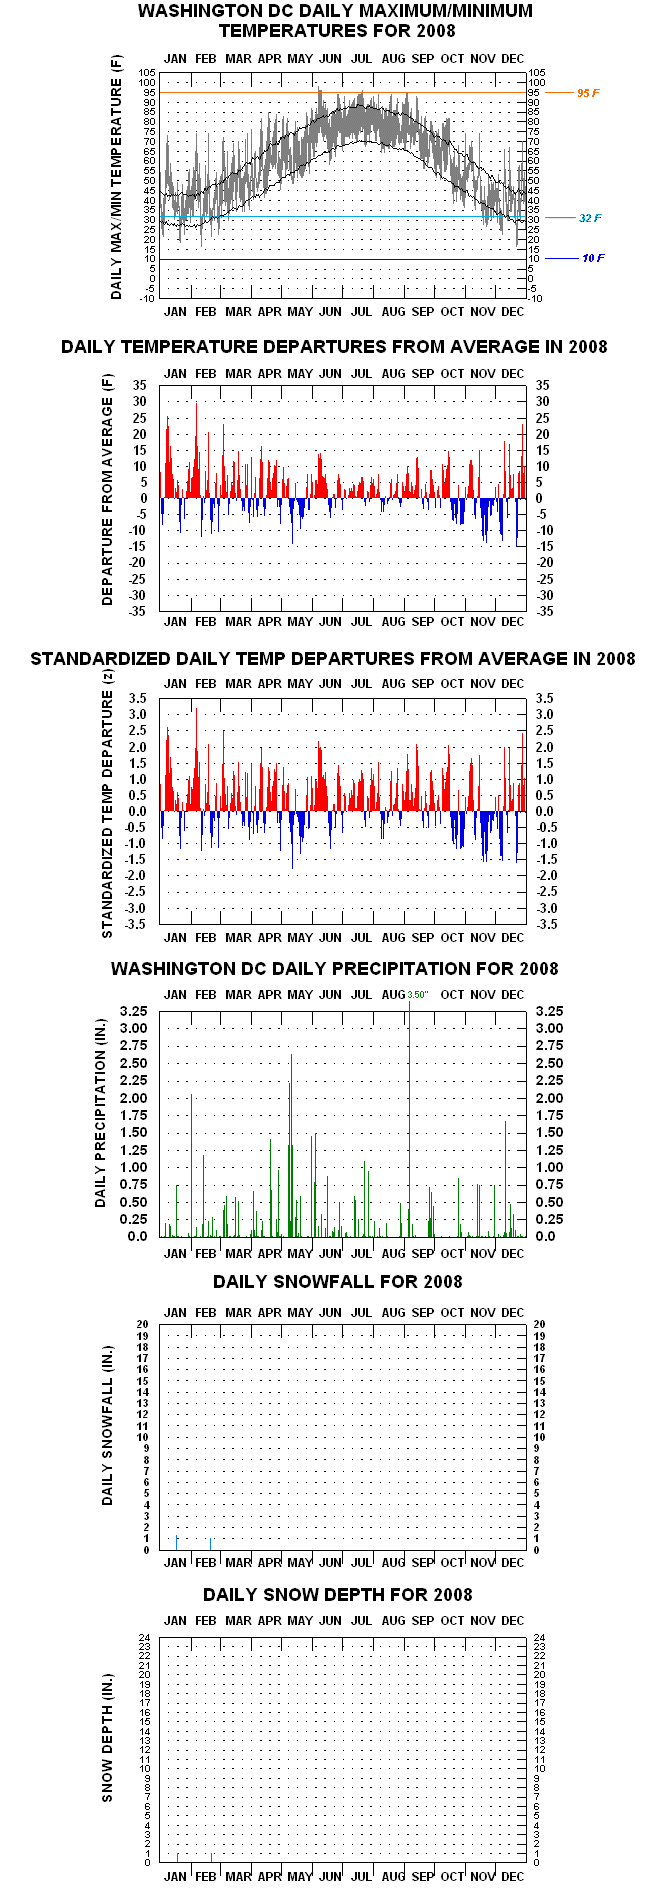
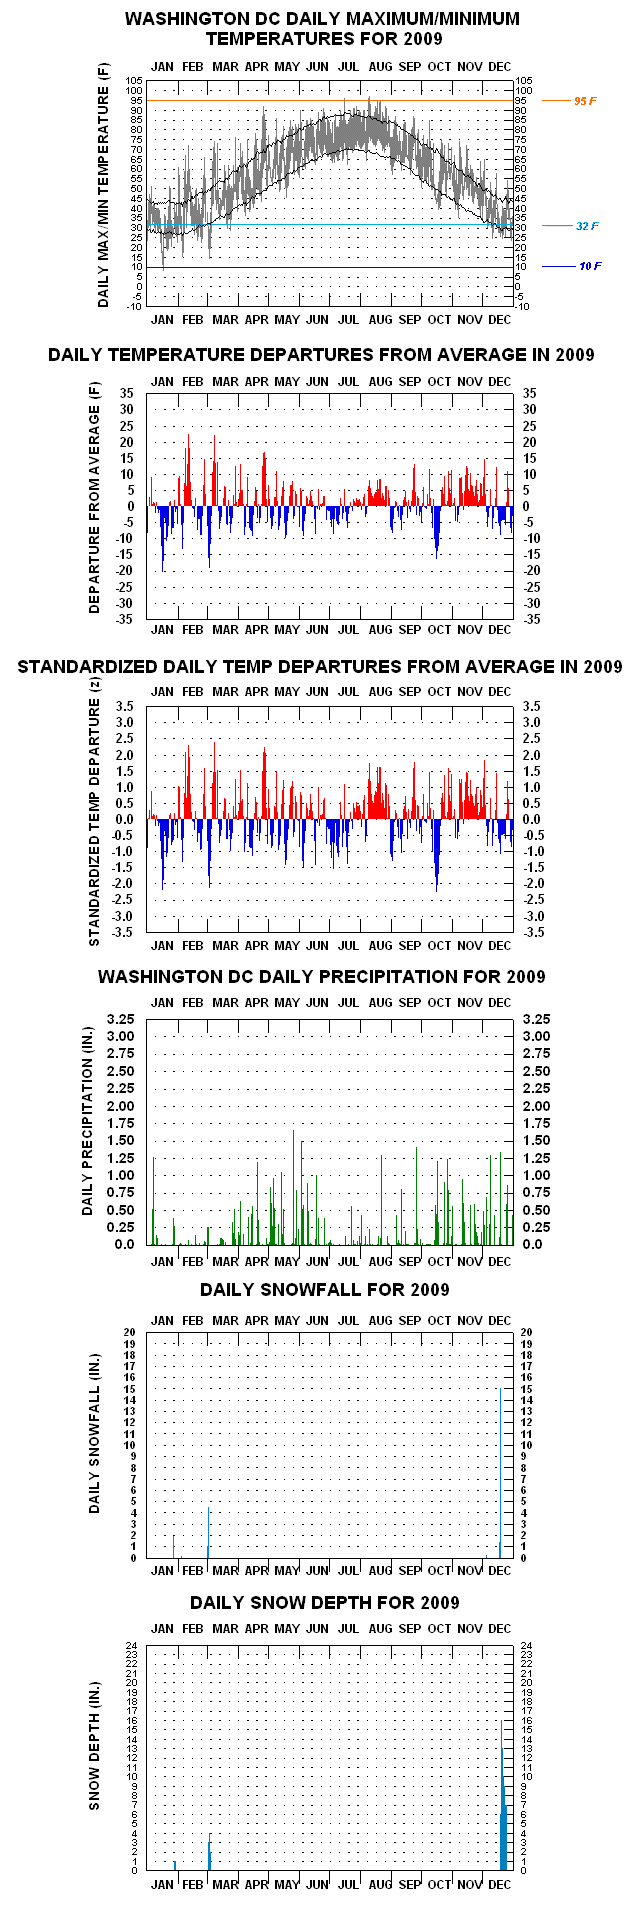
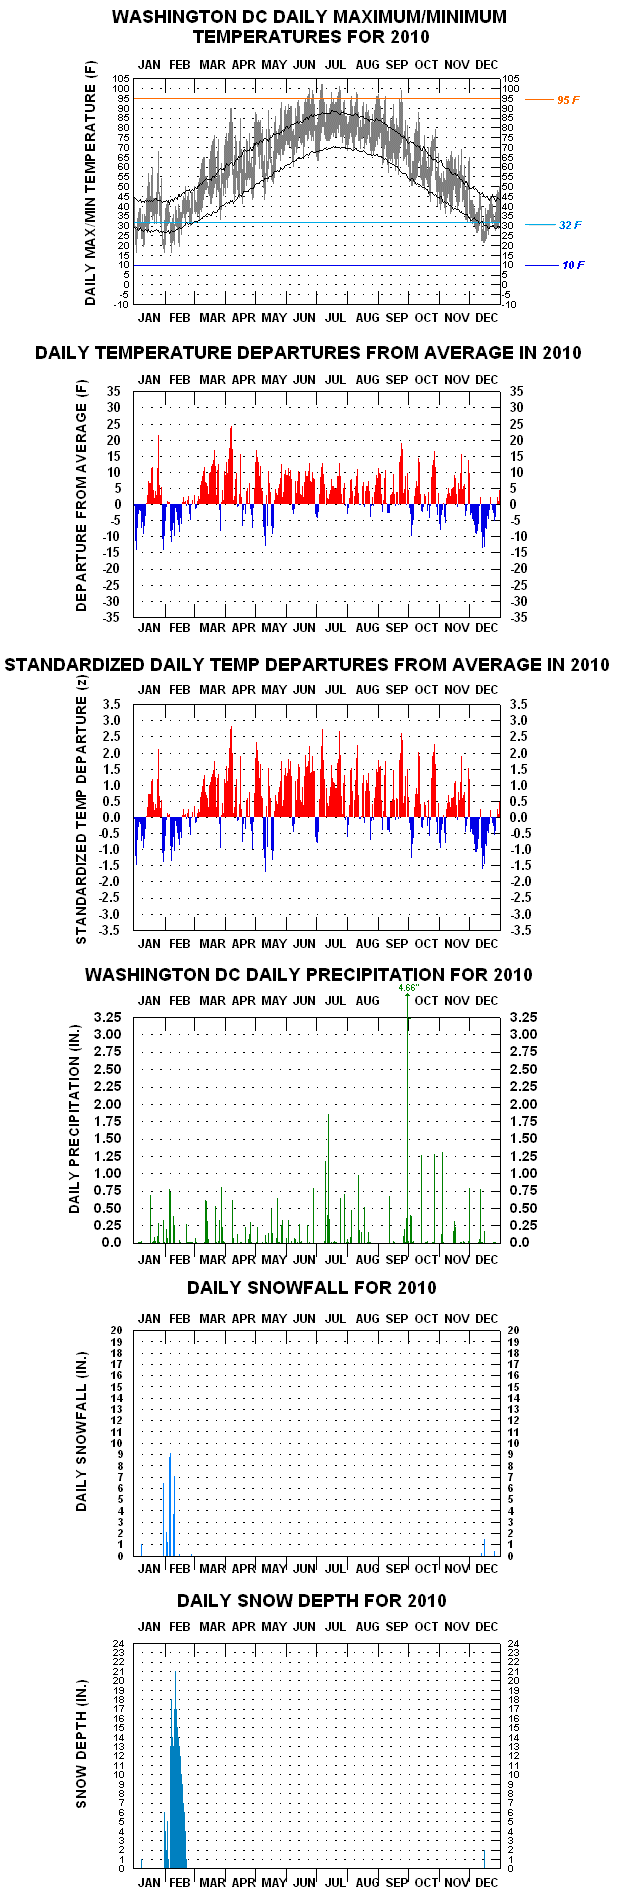
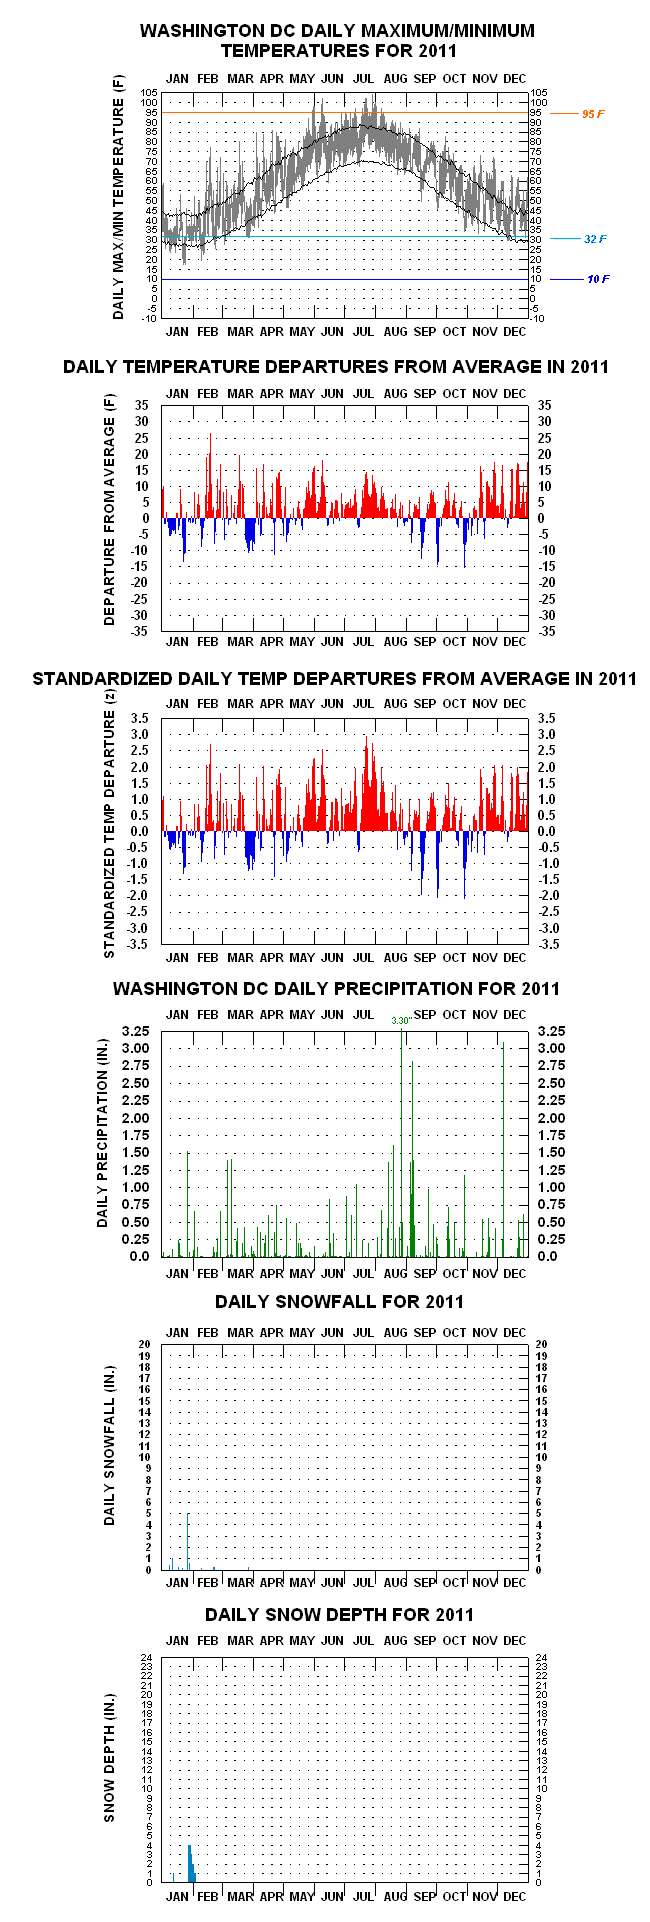
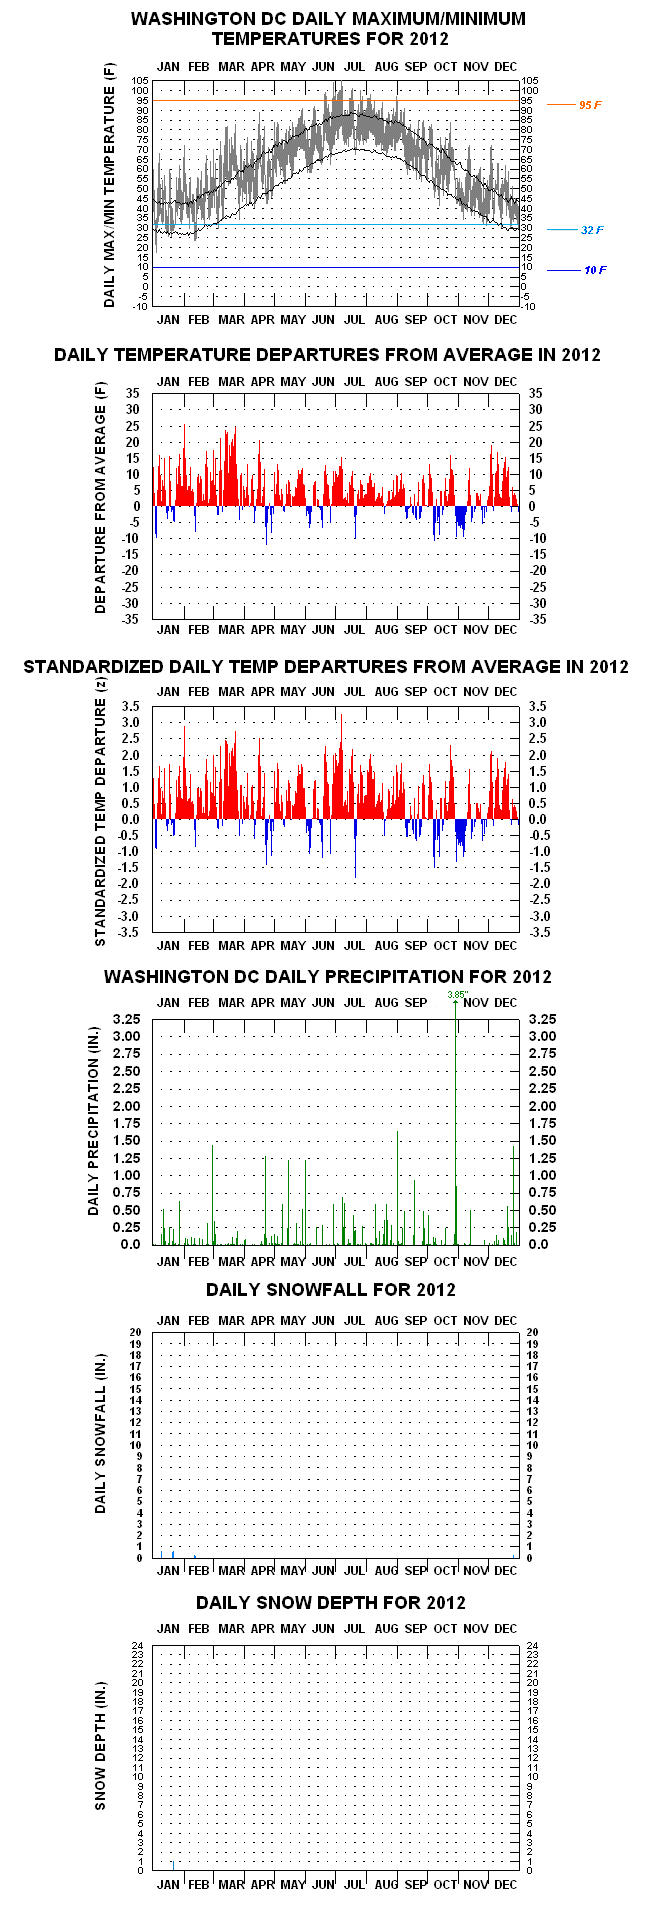
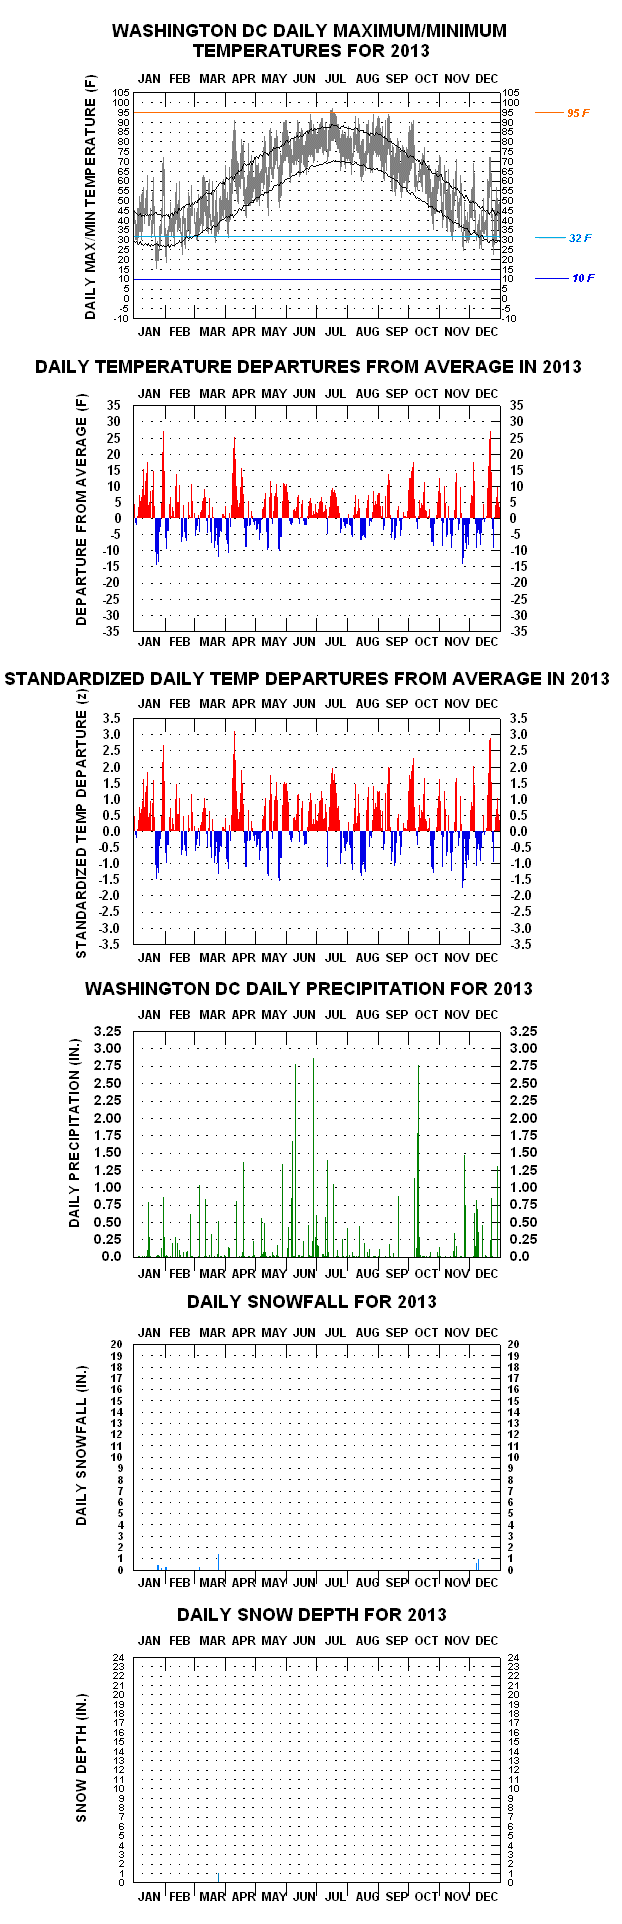
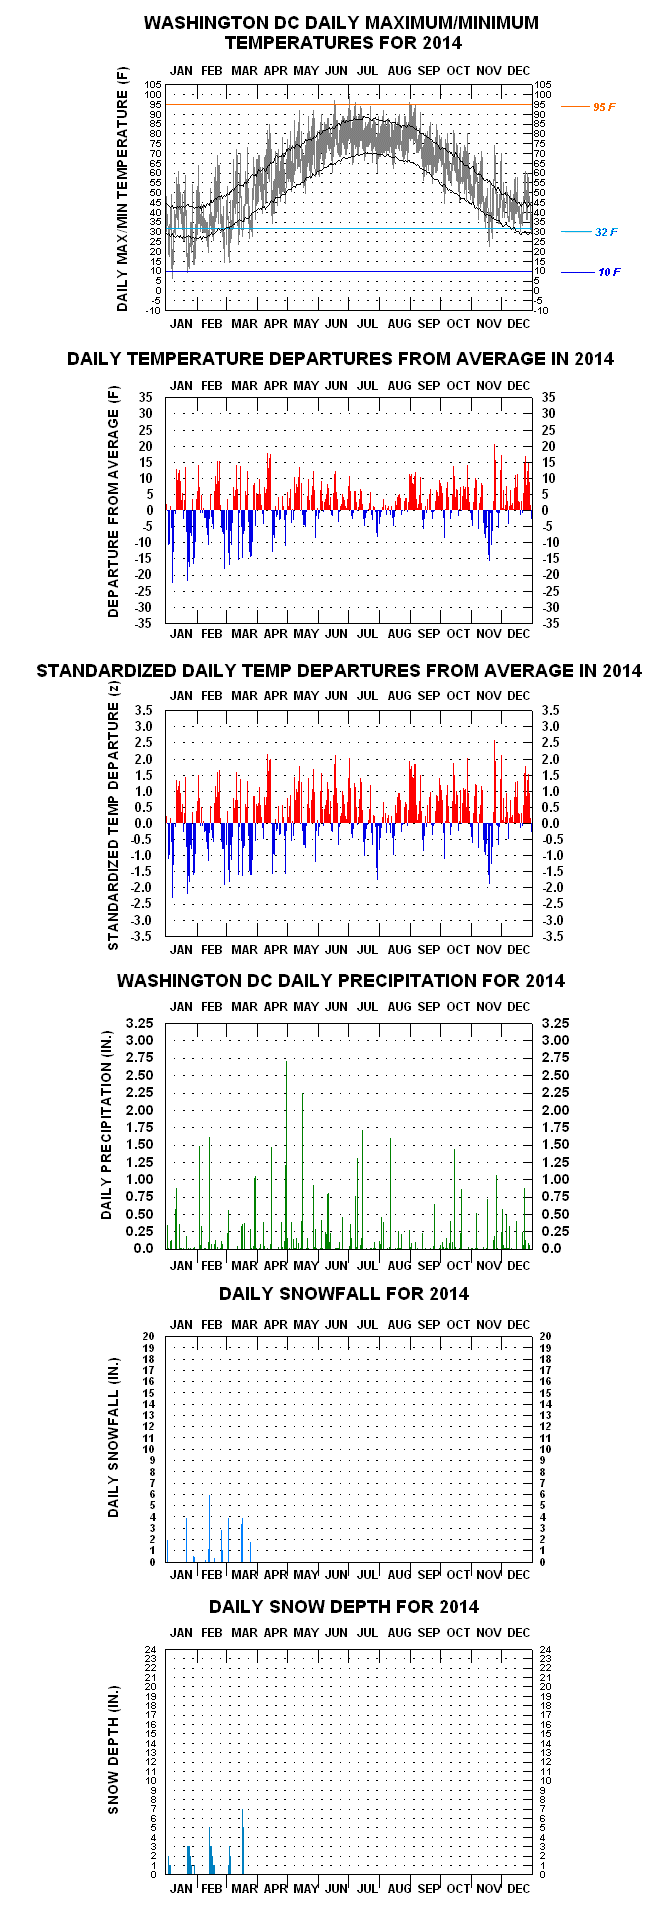
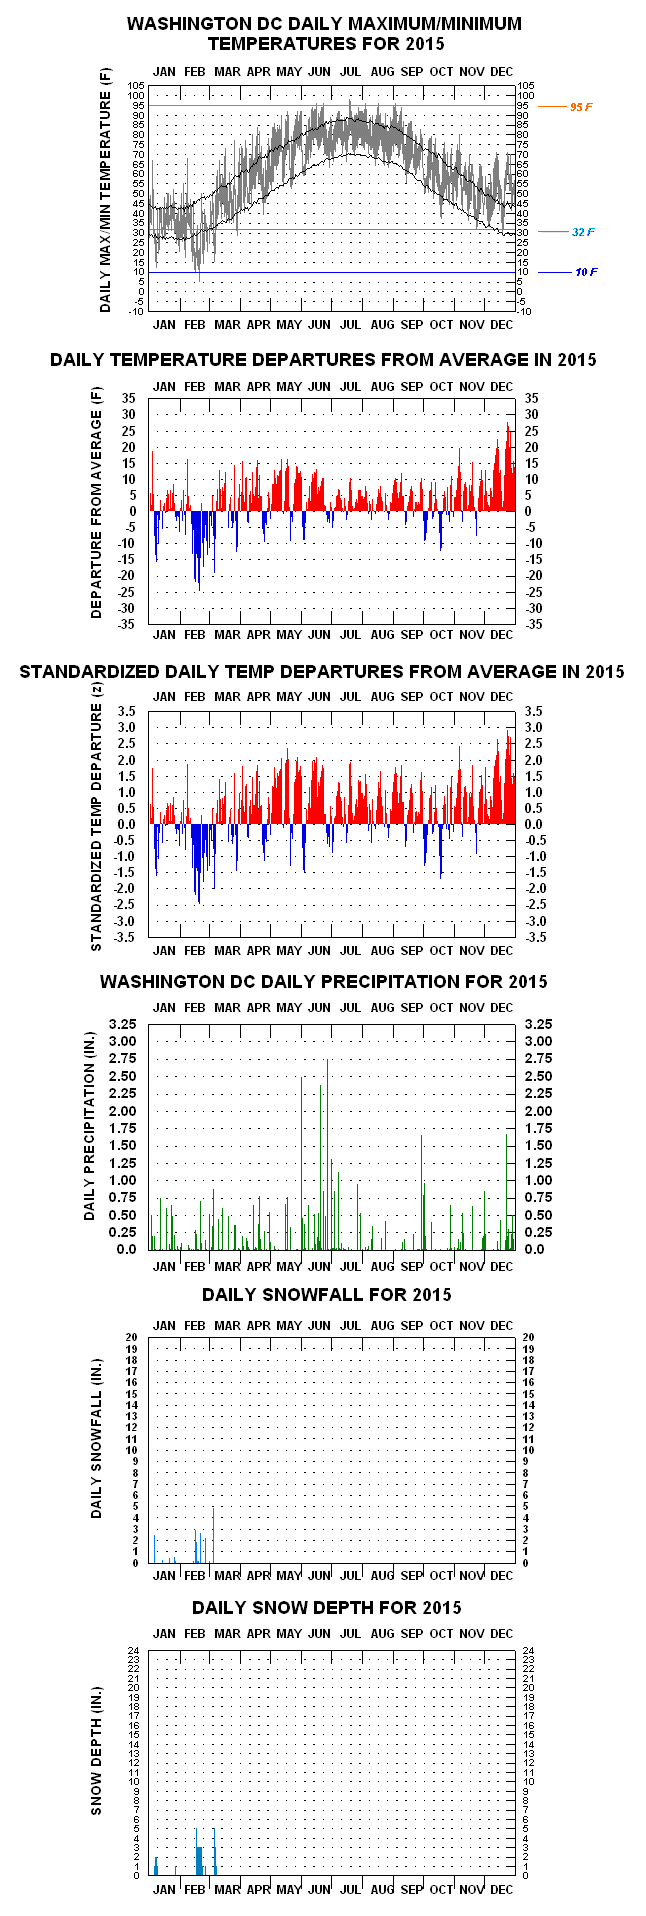
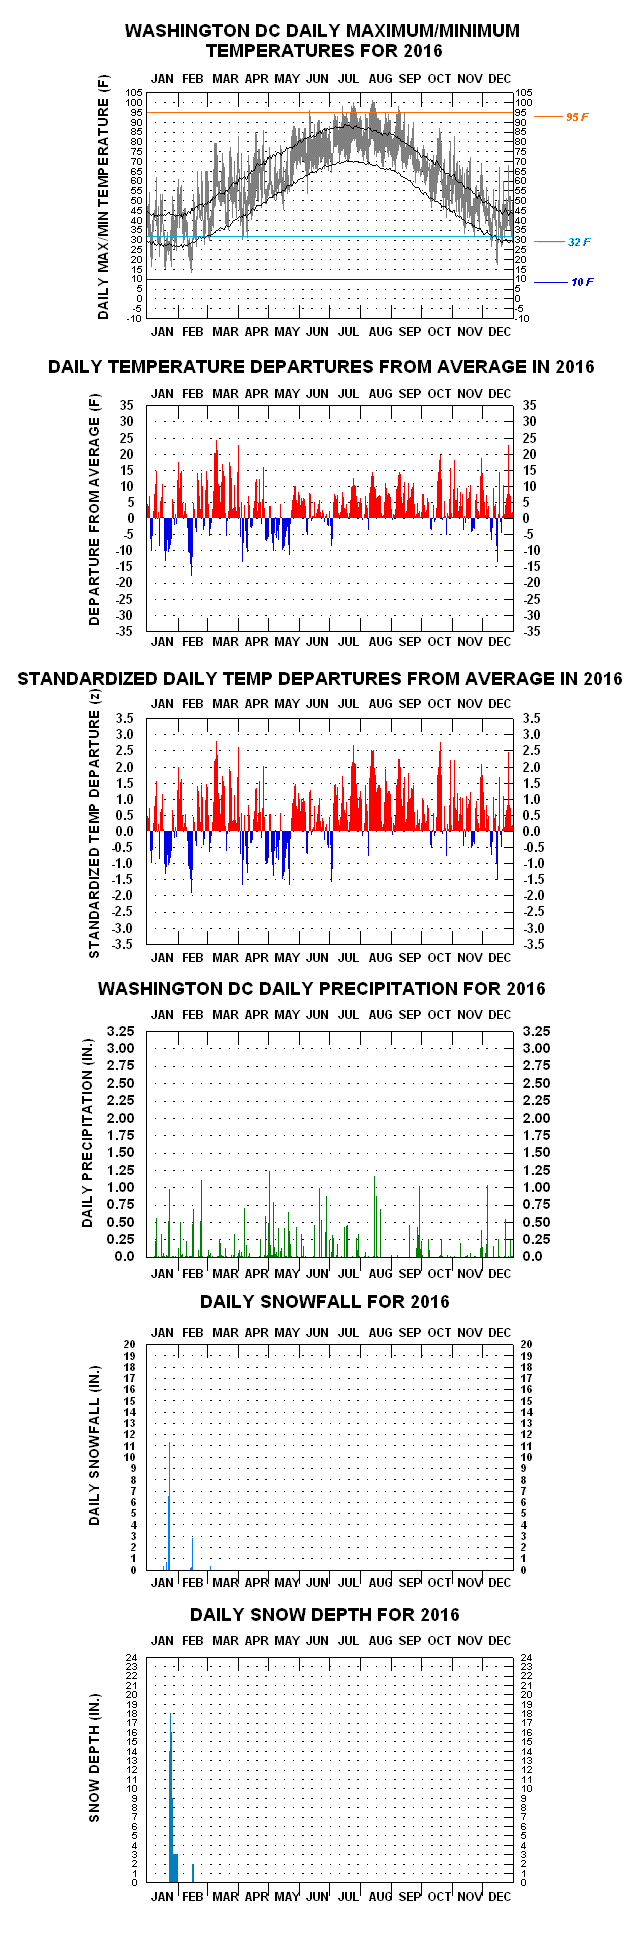
The third chart down shows the second chart’s daily mean temperature anomalies in deseasonalized (“standardized” or "z-scores") form . Those of plus or minus 3.0 z are the "extremes of the extremes", comprising just 0.1% (or 63 individual days' cases) of the more than 55,000 entire Washington DC daily observations. Forty of the 63 are negatively signed, with the greatest negative –3.92 z for 31 Dec 1880 (13 F/-13 F temperature range), and the greatest positive +3.43 z for 26 Jan 1950 (79/56 F daily temperature range),
Fourth chart down depicts daily precipitation totals, as high as 6.39 inches (23 Aug 1933), the fifth and sixth, respectively, representing daily snowfall accumulations, and accumulated snow depths. Maximum figure of the former is 21.0" inches (for 28 Jan 1922), that for the latter 34" (for 14-15 Feb 1899).
Links To Some Of The More Interesting Year-To-Year Graphs, With Accompanying Notes
The links below depict a collection of DC daily temperature, precipitation, and snowfall patterns that were eventful in some fashion - either statistically or from a pure-pattern sense, physical interpretations aside.
Wettest calendar year in history (66.28").
Warmest year in history (61.5 F).
July warmest calendar month (84.5 F) in history.
February with 32.1" of snow. Total for 2009-10 season (56.1") surpasses 1898-99's previous record (54.4"). Warmest Summer in history (81.3 F).
Warmest Spring in history (63.2 F).
Second wettest year in history (60.83").
. Warmest year to date (60.2 F).
Warmest year to date (60.0 F).
= December ties 1917 for second coldest December since 1876.
Warmest year to date (59.6 F). Hottest summer to date (80.0 F).
Snowy Feb (30.6"). Second in high magnitude to Feb 1899's 35.2".
Warmest year to date (59.4 F).
Driest year (26.94") since 1930.
No Measurable Precipitation in October, only calendar month of that distinction in the 1872-present history.
Cold late Jan to early Feb. Twenty-nine consecutive days with measurable snow depth, a record.
Historic cold and snowy March. Second coldest and second snowiest March - 1872-present history.
Continuous anomalous warmth, early August to early October, except for brief mid-September cool interruption
Warmest January (47.9 F), 1872-present.
Dust Bowl year 1936 produces very cold February, but a 105 F temperature reading in early July.
Coldest February (24.6 F) in history. Average day-to=day change in max temperature (7.5 F) for 1934 the highest figure for any individual year (1872-2022). September the wettest calendar month in all history (17.45"), with reference to as far back as 1817.
Warmest January to date, and mildest winter (Dec '31 - Jan '32) down to the present. But sharp unseasonable cold snap in early March.
Warmest year to date (58.3 F).
Drought Year. Driest in all history (21.66"). Eleven 100 F + days, including 106 F in early July.
Curious-looking three-"pronged" warm anomaly pattern over early-March to early-April period.
"Knickerbocker" snowstorm in late January; 28 inches accumulated over two days.
January coldest calendar month (23.7 F), 1872-present, but 106 F registered in early August.
Several days of 90+ F heat in late March, but coldest April-June period in history, 1872 to present.
Coldest year in history
Heavy rains over late May to early June.
Great early February cold wave. Record -15 F cold and 34" snow depth. Snowiest calendar month in history (35.2").
Unseasonably early nine-day summer-like warm spell over mid-April.
Mix of pronounced anomalous warm and cold spells across the year.
Mildest winter for another 42 years, until 1931-32.
Gyrating warm and cold anomaly spells, October into December.
Second Coldest year (1872-present).
Data Collection 07Analytics
Sample Regimes, PCA Modes, PDFs & Extremes+
Temperature+
Regimes+
Sample analysis: group years by recurring seasonal temperature patterns for Washington, DC, then compare transitions between common, unusual and persistent regimes. This is sample Analytics content for layout and workflow testing. Replace it with the station’s verified analysis when the final material is ready.
Extremes+
Sample analysis: review the upper and lower tails of the temperature record for Washington, DC and identify years that merit detailed chart interpretation. This is sample Analytics content for layout and workflow testing. Replace it with the station’s verified analysis when the final material is ready.
Rainfall+
PCA Modes+
Sample analysis: demonstrate how leading modes can separate broad precipitation variability variability from shorter-lived anomalies at Washington, DC. This is sample Analytics content for layout and workflow testing. Replace it with the station’s verified analysis when the final material is ready.
PDFs+
Sample analysis: compare the central distribution and tail behavior of daily rainfall observations at Washington, DC. This is sample Analytics content for layout and workflow testing. Replace it with the station’s verified analysis when the final material is ready.
Continue Exploring
Compare Climate History Across Every Station
Browse domestic and international climate archives, long-term trends and original statistical visualizations.